Embed Size (px)
Citation preview

State of Minnesota
GIS Pandemic Needs Analysis
Report

Advancing Public Health Outcomes Through Information Technology
State of Minnesota GIS Pandemic Needs Analysis Report
September, 2007
ii
This report was prepared for the
State of Minnesota
By
Scientific Technologies Corporation
4400 E. Broadway Blvd. Ste. 705
Tucson, AZ 85711
U.S.A
Phone: +1.520.202.3333
Fax: +1.520.202.3340
WWW.STCHOME.COM

Advancing Public Health Outcomes Through Information Technology
State of Minnesota GIS Pandemic Needs Analysis Report
September, 2007
iii
Table of Contents
1.0 Executive Summary .............................................................................................................. 1 2.0 Introduction and Background .............................................................................................. 3
2.1 Purpose of Assessment .................................................................................................. 3 2.2 Definition of Terms and Acronyms .................................................................................. 3 2.3 Pan Flu/HPAI Overview................................................................................................... 4 2.4 MEOP Supplement.......................................................................................................... 6 2.5 Existing Technology Available for Pan Flu/HPAI Response ........................................... 8 2.6 Role of GIS...................................................................................................................... 9 2.7 Minnesota Governor’s Initiative..................................................................................... 10 2.8 Methodologies ............................................................................................................... 11 2.9 Review of Existing Documentation................................................................................ 13 2.10 Research on Related National Initiatives/Peer Approaches ......................................... 13
3.0 Findings................................................................................................................................ 14 3.1 GIS Inventory Survey Results ....................................................................................... 14 3.2 MEOP Function Survey................................................................................................. 19 3.3 Stakeholder Interviews.................................................................................................. 19
3.3.1 General Stakeholder Comments ......................................................................... 20 3.3.2 HPAI and Pan Flu GIS Needs ............................................................................. 21 3.3.3 Essential Data Layers for Pan Flu Response...................................................... 31
3.4 National/Peer Initiatives................................................................................................. 42 3.4.1 National Incident Management System............................................................... 43 3.4.2 Federal Legislation .............................................................................................. 43 3.4.3 ESRI Study: Geographic Information Systems and Pandemic Influenza Plans . 44
4.0 Recommendations .............................................................................................................. 47 5.0 Glossary of Acronyms ........................................................................................................ 55 6.0 Appendices .......................................................................................................................... 57

Advancing Public Health Outcomes Through Information Technology
State of Minnesota GIS Pandemic Needs Analysis Report
September, 2007
iv
List of Figures Figure 2-1: Spread of Influenza in 1918, Four Weeks after Onset in the US................................. 5
List of Tables Table 2-1: Key Agencies with Roles in Pan Flu and HPAI Response............................................ 6 Table 2-2: Breakdown of Interviewees ......................................................................................... 12 Table 2-3: Interview Seed Questions ........................................................................................... 13 Table 3-1: GIS Assets Inventory................................................................................................... 14 Table 3-2: Issues and Gaps by Agency ....................................................................................... 21 Table 3-3: GIS Data Layers Supporting Pandemic Influenza Planning and Response............... 32 Table 3-4: Summary of GIS Mentions in State Pandemic Influenza Plans.................................. 44 Table 5-1: Glossary of Terms ....................................................................................................... 55
State of Minnesota GIS Pandemic Needs Analysis Report
September, 2007
1
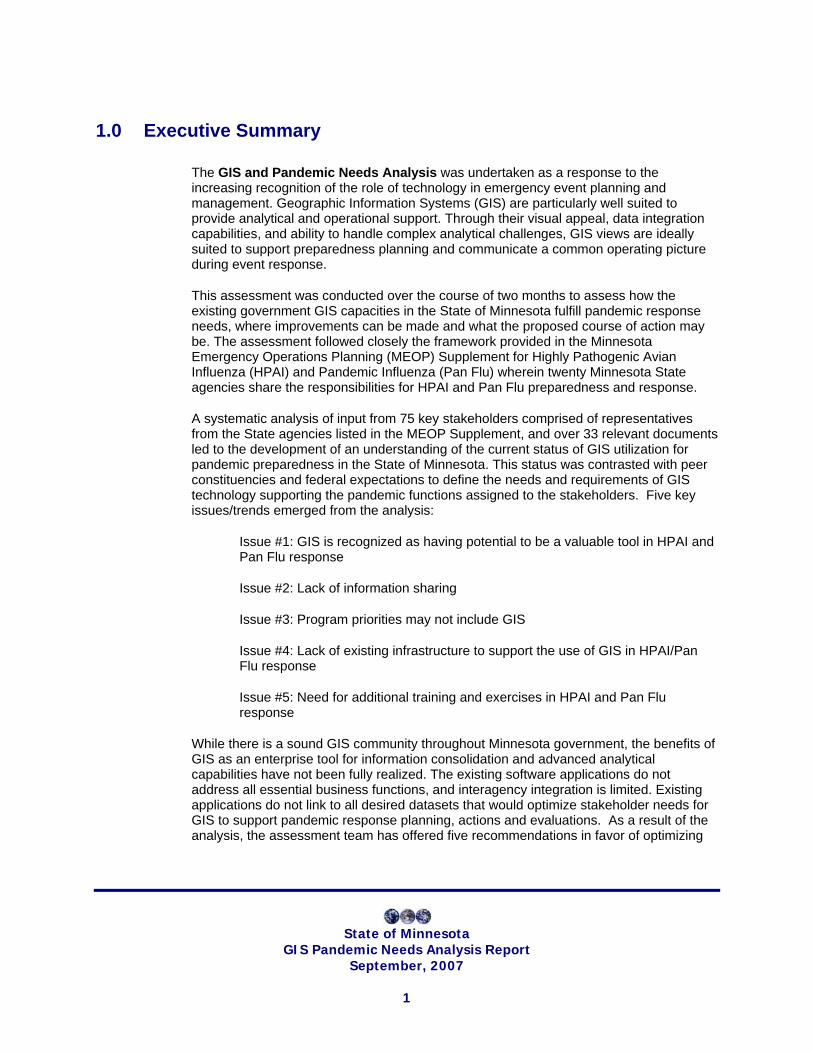
1.0 Executive Summary
The GIS and Pandemic Needs Analysis was undertaken as a response to the increasing recognition of the role of technology in emergency event planning and management. Geographic Information Systems (GIS) are particularly well suited to provide analytical and operational support. Through their visual appeal, data integration capabilities, and ability to handle complex analytical challenges, GIS views are ideally suited to support preparedness planning and communicate a common operating picture during event response.
This assessment was conducted over the course of two months to assess how the existing government GIS capacities in the State of Minnesota fulfill pandemic response needs, where improvements can be made and what the proposed course of action may be. The assessment followed closely the framework provided in the Minnesota Emergency Operations Planning (MEOP) Supplement for Highly Pathogenic Avian Influenza (HPAI) and Pandemic Influenza (Pan Flu) wherein twenty Minnesota State agencies share the responsibilities for HPAI and Pan Flu preparedness and response.
A systematic analysis of input from 75 key stakeholders comprised of representatives from the State agencies listed in the MEOP Supplement, and over 33 relevant documents led to the development of an understanding of the current status of GIS utilization for pandemic preparedness in the State of Minnesota. This status was contrasted with peer constituencies and federal expectations to define the needs and requirements of GIS technology supporting the pandemic functions assigned to the stakeholders. Five key issues/trends emerged from the analysis:
Issue #1: GIS is recognized as having potential to be a valuable tool in HPAI and Pan Flu response
Issue #2: Lack of information sharing
Issue #3: Program priorities may not include GIS
Issue #4: Lack of existing infrastructure to support the use of GIS in HPAI/Pan Flu response
Issue #5: Need for additional training and exercises in HPAI and Pan Flu response
While there is a sound GIS community throughout Minnesota government, the benefits of GIS as an enterprise tool for information consolidation and advanced analytical capabilities have not been fully realized. The existing software applications do not address all essential business functions, and interagency integration is limited. Existing applications do not link to all desired datasets that would optimize stakeholder needs for GIS to support pandemic response planning, actions and evaluations. As a result of the analysis, the assessment team has offered five recommendations in favor of optimizing

State of Minnesota GIS Pandemic Needs Analysis Report
September, 2007
2
GIS utilization for HPAI and Pan Flu response in Minnesota. The recommendations have been prioritized and are listed in the order that they should be considered.
1. Increase availability, standardization and use of GIS tools in Pan Flu and HPAI planning and response.
2. Assign a “champion” to drive and coordinate GIS integration into Pan Flu and HPAI processes, including the attainment of stakeholder buy-in and plans for statewide rollout.
3. Establish a forum for agencies listed in the MEOP Supplement to coordinate resources and evaluate needs for education/training and exercises as related to GIS use in Pan Flu and HPAI planning and response.
4. Focus GIS integration efforts in the following critical areas:
° Outbreak tracking/surveillance (disease incidence, death rate, etc.)
° Inventory distribution, utilization and reallocation
° Staffing resource management
° Enterprise integration of available datasets
5. Work with a Business Analyst to define which datasets and outputs are required/desired and prioritize.
The assessment team recognizes and supports Minnesota’s effort to achieve an Enterprise level approach to leveraging technology across multiple agencies. HPAI and Pan Flu response require an immediate and coordinated effort, which lends this type of public health emergency to the applied uses of GIS tools.
Should the recommendations be accepted, the State of Minnesota will be on the cutting edge of incorporating the use of GIS technologies into public health emergency response. Only the State of New York has put considerable thought into implementing GIS tools in public health emergencies. This analysis and resulting recommendations provide an opportunity for the State of Minnesota to serve as a model of GIS integration and utilization and to shine on the national front.

State of Minnesota GIS Pandemic Needs Analysis Report
September, 2007
3
2.0 Introduction and Background
2.1 Purpose of Assessment
The State of Minnesota recognizes the challenges posed by a pandemic, and the value of Information Technology (IT) in such an event. As part of the Minnesota Emergency Operations Plan (MEOP), the state has issued a Minnesota Highly Pathogenic Avian Influenza (HPAI) and Pandemic Influenza MEOP Supplement (Appendices Addendum, Section 1.0) that identifies specific activities to be undertaken by Minnesota state agencies in planning for and responding to pandemic activity.
Specific to IT, state agencies desire the use of geographic information systems (GIS) to better meet business needs and respond successfully. The state also has a need to understand what GIS capacity is required as a “single” enterprise. Finally, in anticipation of additional development and/or acquisition of GIS services, data, applications, and staff required to meet its priority pandemic influenza business needs, the state has a need for information that will help identify, define and prioritize future projects.
In April 2007, the State of Minnesota’s Department of Administration, Office of Geographic and Demographic Analysis (GDA) contracted with Scientific Technologies Corporation (STC) to analyze, identify and document agency specific HPAI and pandemic business needs relative to existing and required GIS capacities. The intent of this assessment was, through consultation with staff representing these state agencies, to analyze, inventory, and document each agency’s business needs as identified in the MEOP. In particular, this assessment will establish an inventory of contact points, skill sets, data, software, and resources available and desirable. Through a systematic process linking the findings to an appropriate reference framework, the current status was analyzed to identify the gaps and opportunities to a more effective utilization of GIS in the pandemic context.
STC is an international public health informatics firm with nearly two decades of experience. STC employs a diverse staff of public health professionals and information technology specialists. STC’s public health solutions include over 80 established products, most notably in the areas of immunization management systems, communicable disease reporting applications, disease surveillance and outbreak management. STC has significant experience related to emergency planning and response and has received substantial recognition for efforts initiated in response to Hurricane Katrina. STC also specializes in the integration and application of GIS tools as related to public health information systems and shares a long standing relationship with ESRI, a leader in the field of GIS software development.
2.2 Definition of Terms and Acronyms
The following definitions are critical to understanding the context of this assessment. Other terms will be defined throughout the document. Numerous acronyms are also

State of Minnesota GIS Pandemic Needs Analysis Report
September, 2007
4
used throughout the document and are defined upon first mention. A glossary of acronyms has been provided in Section 5.0 for ongoing reference.
Geographical Information System (GIS) – A collection of computer hardware, software, and geographic data for capturing, managing, analyzing, and displaying all forms of geographically referenced information. GIS allows a user to combine sets of information such as patient immunizations, birth rates, population demographics, and geographic boundaries into visual displays that are then integrated with underlying datasets. Information (attributes) can be linked to location data, such as people to addresses, buildings to parcels, or streets within a network. This information can then be layered to provide a better understanding of the relationship of the data.
Highly Pathogenic Avian Influenza (HPAI)* – Avian influenza (AI), also known as bird flu, is a contagious disease of poultry caused by viruses that can infect both farm-raised and wild birds. There are a variety of AI forms always circulating in birds, but only two main types of the virus: low pathogenic (LPAI) and highly pathogenic (HPAI). LPAI usually causes mild symptoms (ruffled feathers, some respiratory signs, and a drop in egg production) and may go undetected. HPAI is more virulent, spreading rapidly through flocks and killing most of the birds within 48 hours. Minnesota has detected LPAI in the past and has successfully controlled and prevented it from spreading. Minnesota has never had a case of HPAI.
Pandemic Influenza (Pan Flu)* – An influenza pandemic is a very large outbreak of influenza, usually affecting the entire world. A pandemic can happen whenever there is a major change in the virus that causes flu.
*Definitions taken directly from the MEOP Supplement (described in Section 2.4).
2.3 Pan Flu/HPAI Overview
Influenza viruses have threatened the health of animal and human populations for centuries. Their diversity and propensity for mutation have thwarted efforts to develop both a universal vaccine and highly effective antiviral drugs. A pandemic occurs when a novel strain of influenza virus emerges that has the ability to infect and be passed between humans. Because humans have little immunity to the new virus, a worldwide epidemic, or pandemic, can ensue. Several major human influenza pandemics occurred in the 20th century1, each resulting in illness in approximately 30 percent of the world population and death in 0.2 percent to 2 percent of those infected. Using this historical information and current models of disease transmission, it is projected that a modern pandemic could lead to the deaths of 200,000 to 2 million people in the United States alone. Figure 2-1 illustrates how quickly an influenza epidemic can spread across the country.
1 Spanish Influenza in 1918/19; Asian Influenza in 1957; Hong Kong Influenza in 1968; Russian Influenza in 1977.

State of Minnesota GIS Pandemic Needs Analysis Report
September, 2007
5
Figure 2-1: Spread of Influenza in 1918, Four Weeks after Onset in the US2
The economic and societal disruption of an influenza pandemic would be significant. Absenteeism across multiple sectors related to personal illness, illness in family members, fear of contagion, or public health measures to limit contact with others could threaten the functioning of critical infrastructure, the movement of goods and services, and operation of institutions such as schools and universities. A pandemic would thus have significant implications for the economy, national security, and the basic functioning of society.
Animal populations serve as a reservoir for new influenza viruses. Scientists believe that avian, or bird, viruses played a role in the last three pandemics. The current concern for a pandemic arises from an unprecedented outbreak of H5N1 influenza in birds that began in 1997 and has spread across bird populations in Asia, Europe, and Africa. The virus has shown the ability to infect multiple species, including long-range migratory birds, pigs, cats, and humans. It is impossible to predict whether the H5N1 virus will lead to a pandemic, but history suggests that if it does not, another novel influenza virus will emerge at some point in the future and threaten an unprotected human population.
Though an influenza event that was limited to animal populations has the potential to cause severe economic disruptions such as those seen in the 1997 Avian Influenza outbreak in Hong Kong where millions of chickens and other domesticated foul had to be
2 America’s Forgotten Pandemics – The Influenza of 1918-1989

State of Minnesota GIS Pandemic Needs Analysis Report
September, 2007
6
killed, the danger of broad and repeat exposure of humans, pets, or livestock to affected birds increases the likelihood of interspecies transmission and thereby increases the potential for widespread epidemics or an influenza pandemic.
2.4 MEOP Supplement
The State of Minnesota Highly Pathogenic Avian Influenza and Pandemic Influenza MEOP Supplement (Appendices Addendum, Section 1.0) establishes a coordinated response to Pan Flu and HPAI using the incident command structure. Agency responsibilities are defined based on Executive Order 04-04, Assigning Emergency Responsibilities to State Agencies (Appendices Addendum, Section 2.0). The Division of Homeland Security and Emergency Management (HSEM) has been assigned overall responsibility for coordinating efforts defined in the MEOP Supplement. Table 2-1 below provides a list of key agencies along with general roles/responsibilities in Pan Flu and HPAI response.
Table 2-1: Key Agencies with Roles in Pan Flu and HPAI Response
ROLES/RESPONSIBILITIES ASSIGNED AGENCIES
Coordinating Agency
• Pre-incident planning and coordination.
• Coordinating efforts with critical infrastructure.
• Maintain ongoing contact with lead technical and support agencies.
• Coordinate with Federal Coordinating Officer and Principal Federal Official.
• Department of Public Safety, Division of Homeland Security and Emergency Management (HSEM)
Lead Technical Agencies
• Establish daily goals and objectives for response.
• Provide overall technical recommendations regarding area of expertise.
HPAI Transmission
• Board of Animal Health
• Department of Agriculture

State of Minnesota GIS Pandemic Needs Analysis Report
September, 2007
7
ROLES/RESPONSIBILITIES ASSIGNED AGENCIES
• Provide primary staffing in SEOC’s Planning Assessment Center.
• Work with private sector organizations to maximize use of all available resources.
• Establish communications lines between SEOC and agency EOC.
• Provide Deputy State Incident Manager for SEOC.
• Department of Natural Resources
Human Pandemic Influenza Transmission
• Minnesota Department of Health
Support Agencies
• Conducting operations using their own authorities, subject matter experts, capabilities or resources.
• Participating in planning for short and long-term operations. Including plans, Sags, checklists or job aids.
• Furnish available personnel, equipment or other resource support.
• Participate in training and exercises as requested.
• Assist in conducting situational assessments.
• Assist in response.
• Department of Administration
• Attorney General’s Office
• Department of Commerce
• Department of Education
• Emergency Medical Services Regulatory Board
• Department of Employee Relations
• Department of Employment and Economic Development
• Department of Finance
• Minnesota Housing Finance Agency
• Department of Human Services
• Department of Labor and Industry
• Department of Military Affairs
• Office of Enterprise Technology
• Minnesota Pollution Control Agency
• Department of Public Safety

State of Minnesota GIS Pandemic Needs Analysis Report
September, 2007
8
ROLES/RESPONSIBILITIES ASSIGNED AGENCIES
• Department of Revenue
• Minnesota State Colleges and Universities
• Department of Transportation
The MEOP Supplement is organized according to the phases defined by the World Health Organization (WHO) and outlines specific tasks to be performed by designated agencies during each phase. Tasks are classified based on the following essential business functions:
• Notification and Warning
• Incident Management
• Public Information
• Accident/Damage Assessment
• Search and Rescue
• Health Protection
• Medical Services
• Fire Protection
• Evacuation/Traffic Control/Security
• Mass Care, Housing and Human Services
• Debris Management
• Public Works/Utilities Restoration
• Environmental Hazard Response
• Resource Management
These essential business functions are defined in Appendices Addendum, Section 3.0.
2.5 Existing Technology Available for Pan Flu/HPAI Response
State agencies rely on numerous information systems to support daily operations. Many of these tools can be leveraged in emergency response to supply critical data. In the State of Minnesota the following tools are currently available for HPAI and/or Pan Flu Response. This list is not inclusive of all information systems supported by State agencies but demonstrates key applications with HPAI and Pan Flu implications.
• DisasterLAN is a web-based crisis information management system designed for use in emergency operations centers. This application has tools for managing call center requests, donations, and reported information; tracking

State of Minnesota GIS Pandemic Needs Analysis Report
September, 2007
9
calls and assignments; generating reports; event monitoring; hospital bed tracking; GIS map viewing; monitoring weather; managing contacts; and as a status board for sharing textual and visual situational information. DisasterLAN is currently owned and hosted by the Department of Public Safety, Division of Homeland Security and Emergency Management, and made available to all state agencies as needed for drills and event management.
• MNTrac is the Minnesota system for Tracking Medical Resources, Alerts, and Communications. The application is operated by the Minnesota Department of Health. This system has been designed specifically to track bed, pharmaceutical, and resource availability from all designated facilities within the state as well as providing for allocation of these resources to support surge capacity needs. MNTrac has spatial elements but is not a GIS analytical tool.
• Minnesota Immunization Information Connection (MIIC) is a network of regional immunization information systems that provide consolidated, centralized immunization records for Minnesota residents and provide decision support tools to health care providers. MIIC is operated by local registry staff in the seven regions and is supported by the Minnesota Department of Health, which provides technical, policy and financial support. MIIC has geocoding capabilities but is not a GIS analytical tool.
• SNS Asset Management System (SAMS) is used to manage materials received from CDC in an SNS push pack by serving as a warehouse management system. SAMS tracks SNS inventories/materials from the time they are received by Minnesota SNS and RSS officials to the distribution at mass dispensing sites. SAMS is housed by the Minnesota Department of Health, but the application is being phased out because there is inadequate infrastructure to support it. Does not have GIS capabilities.
• Statewide Employee Management Application (SEMA 4) is a personnel database that includes personal information on all current and former Minnesota state employees, including physical job locations. This application is managed by the Minnesota Department of Employee Relations. Does not have GIS capabilities.
• The North Star Network is operated by the Minnesota Office of Enterprise Technology. The Network is comprised of data, voice and video services and supported by hardware, security and backup facilities. The Network is a critical hub for continuity of operations and communications during an emergency event. If utilized, GIS tools could be hosted on the Network.
2.6 Role of GIS
In order to properly plan, manage, and monitor any government continuity and response program with respect to health emergency events, it is vital that up-to-date, relevant information is available to decision-makers, particularly at all levels of the public health system. As every disease problem or health event requires a different response and policy decision, information must be available that reflects a realistic assessment of the situation at local, national and global levels. This must be done with best available data and taking into consideration disease transmission dynamics, demographics, availability

State of Minnesota GIS Pandemic Needs Analysis Report
September, 2007
10
of and accessibility to existing health and social services, as well as other geographic and environmental features.
Geographic information systems (GIS) provide ideal platforms for the convergence of disease-specific information and their analyses in relation to population settlements, surrounding social and health services, and the natural environment. They are highly suitable for analyzing epidemiological data, revealing trends and interrelationships that would be more difficult to discover in tabular format. Moreover, GIS allows policy makers to easily visualize problems in relation to existing health and social services and the natural environment and so, more effectively target resources.
Integrating geography into the business functions of pandemic planning and emergency preparedness provides the opportunity to address several critical areas during an event, including:
• Identifying and monitoring communities to be warned or evacuated in an emergency
• Identifying and monitoring transportation corridors for exiting affected areas
• Identifying facilities containing hazardous material in the area of influence, whether it be caused by human or natural events
• Identifying the location of pharmaceutical stockpiles, and delivery routes to points of distribution
• Identifying critical infrastructure that could be vulnerable to power failures
In all of these situations, advance planning and design will be the foundation for a key to success both in response to emergencies and in the daily operation of critical structures.
2.7 Minnesota Governor’s Executive Order 05-04
The Governor’s Executive Order 05-04 (Appendices Addendum, Section 4.0) establishes the drive to technological excellence by employing an enterprise approach to all governmental activities in the area of technology development. A new state Chief Information Officer position was created to implement this directive with Cabinet-level authority.
Within the overall information technology environment of the State of Minnesota, GIS efforts have a long tradition. Several planning exercises for the appropriate development of GIS capacities within the Minnesota government were completed. Namely in 1991 and 2004, two strategic plans were completed that still guide the evolution of GIS capacities in government agencies.
The 2004 Strategic Plan for “A Foundation for Coordinated GIS, Minnesota’s Spatial Data Infrastructure (MSDI)” defined seven key datasets to be framework data layers for the greater good of the user community and defined the element of proper organizational structure to ensure the sustainable success of GIS integration in government functions. In particular it provided the following recommendations:

State of Minnesota GIS Pandemic Needs Analysis Report
September, 2007
11
• Explicit authority and responsibility for overseeing the development and implementation of the MSDI should be assigned to a state cabinet level agency, supported by legislation if necessary.
• Adequate resources should be provided to support the sustained development and implementation of the MSDI, including necessary funding to sustain the coordination effort.
• Public expenditures in geospatial data and technology should reflect MSDI priorities, updated by stakeholders through policies and procedures adopted for maintenance of the MSDI.
• GIS implementation by state agencies should be coordinated within guidelines established for the state’s IT architecture framework and consistent with policies of the state’s Office of Technology and Department of Finance.
• GIS implementation by state, local and regional agencies should be coordinated with similar efforts by state and federal agencies as they relate to the MSDI.
• A strong emphasis should be placed on identifying emerging opportunities for effectively using GIS, identifying opportunities for joint projects and leveraging private and federal resources not otherwise available to Minnesota.
• The continued development of the MN Geographic Data Clearinghouse should be supported, emphasizing e-government solutions for distributing geospatial data.
2.8 Methodologies
STC’s structured methodology for conducting assessments, the Information Technology Alternative Assessment Methodology (ITAAM), was adapted for the present study. ITAAM is comprised of flexible components designed to be modified to fit the requirements of the subject to which it is being applied. ITAAM consists of several phases, each containing tasks and outcomes. The ITAAM phases are described in the Appendices Addendum, Section 5.0.
Information for the current assessment was gathered from several sources:
• Survey of software and resource inventories provided by each department
• Stakeholder interviews
• Review of existing documentation
• Research on related national initiatives/peer approaches
Based on these information sources, a conceptual design was developed that describes and illustrates desired outcomes. Corresponding recommendations were established to address existing gaps identified within surrounding GIS technology with respect to pandemic planning and other alternative solutions.
Survey
State of Minnesota GIS Pandemic Needs Analysis Report
September, 2007
12
Section (MEOP Supplement) lists the agencies defined by the Governor’s Executive Order 04-04 in the MEOP Supplement with specific roles and responsibilities during a pandemic event. A survey was issued to representatives at each of the respective agencies to establish an enterprise-level inventory of existing datasets, software and other GIS resources. Each agency also established expected future demand for GIS resources related to datasets, software, and staffing needs.
Interviews
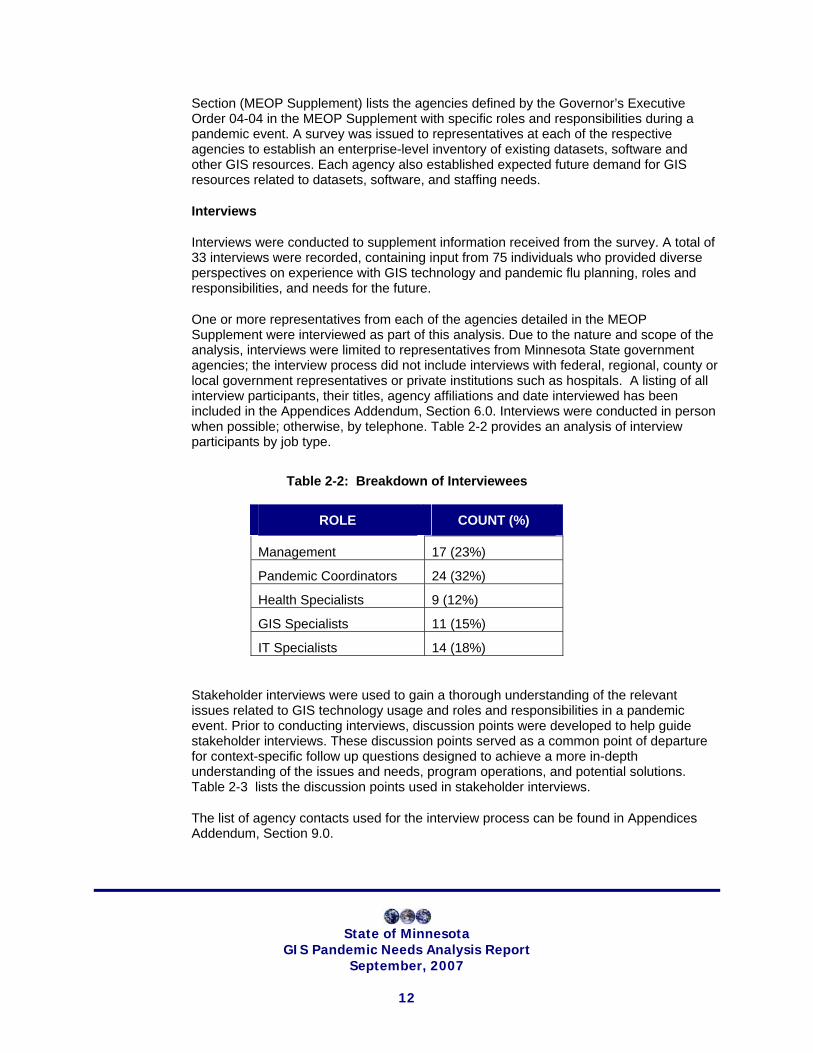
Interviews were conducted to supplement information received from the survey. A total of 33 interviews were recorded, containing input from 75 individuals who provided diverse perspectives on experience with GIS technology and pandemic flu planning, roles and responsibilities, and needs for the future.
One or more representatives from each of the agencies detailed in the MEOP Supplement were interviewed as part of this analysis. Due to the nature and scope of the analysis, interviews were limited to representatives from Minnesota State government agencies; the interview process did not include interviews with federal, regional, county or local government representatives or private institutions such as hospitals. A listing of all interview participants, their titles, agency affiliations and date interviewed has been included in the Appendices Addendum, Section 6.0. Interviews were conducted in person when possible; otherwise, by telephone. Table 2-2 provides an analysis of interview participants by job type.
Table 2-2: Breakdown of Interviewees
ROLE COUNT (%)
Management 17 (23%)
Pandemic Coordinators 24 (32%)
Health Specialists 9 (12%)
GIS Specialists 11 (15%)
IT Specialists 14 (18%)
Stakeholder interviews were used to gain a thorough understanding of the relevant issues related to GIS technology usage and roles and responsibilities in a pandemic event. Prior to conducting interviews, discussion points were developed to help guide stakeholder interviews. These discussion points served as a common point of departure for context-specific follow up questions designed to achieve a more in-depth understanding of the issues and needs, program operations, and potential solutions. Table 2-3 lists the discussion points used in stakeholder interviews.
The list of agency contacts used for the interview process can be found in Appendices Addendum, Section 9.0.
State of Minnesota GIS Pandemic Needs Analysis Report
September, 2007
13
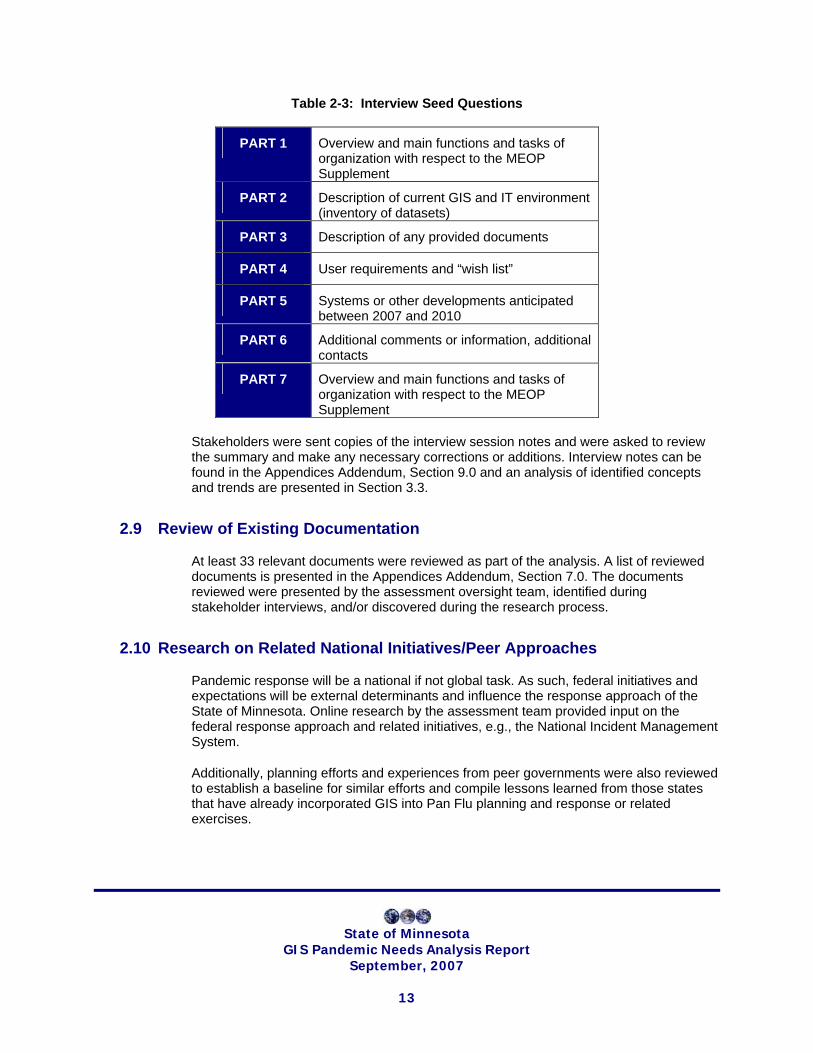
Table 2-3: Interview Seed Questions
PART 1 Overview and main functions and tasks of organization with respect to the MEOP Supplement
PART 2 Description of current GIS and IT environment (inventory of datasets)
PART 3 Description of any provided documents
PART 4 User requirements and “wish list”
PART 5 Systems or other developments anticipated between 2007 and 2010
PART 6 Additional comments or information, additional contacts
PART 7 Overview and main functions and tasks of organization with respect to the MEOP Supplement
Stakeholders were sent copies of the interview session notes and were asked to review the summary and make any necessary corrections or additions. Interview notes can be found in the Appendices Addendum, Section 9.0 and an analysis of identified concepts and trends are presented in Section 3.3.
2.9 Review of Existing Documentation
At least 33 relevant documents were reviewed as part of the analysis. A list of reviewed documents is presented in the Appendices Addendum, Section 7.0. The documents reviewed were presented by the assessment oversight team, identified during stakeholder interviews, and/or discovered during the research process.
2.10 Research on Related National Initiatives/Peer Approaches
Pandemic response will be a national if not global task. As such, federal initiatives and expectations will be external determinants and influence the response approach of the State of Minnesota. Online research by the assessment team provided input on the federal response approach and related initiatives, e.g., the National Incident Management System.
Additionally, planning efforts and experiences from peer governments were also reviewed to establish a baseline for similar efforts and compile lessons learned from those states that have already incorporated GIS into Pan Flu planning and response or related exercises.

State of Minnesota GIS Pandemic Needs Analysis Report
September, 2007
14
3.0 Findings
3.1 GIS Inventory Survey Results
As part of the assessment a survey was administered to agencies with responsibilities in the MEOP Supplement in order to create an inventory of available data resources, GIS staff resources, and GIS software resources. The complete results of this survey are presented in their entirety in Appendices Addendum Section 10.0.
Table 3-1 provides an overview, by agency, of the number of staff that perform GIS functions, notable skill sets among those staff, which GIS applications an agency supports and how many seats/licenses are available, and any datasets that the agency currently manages or has available.
Table 3-1: GIS Assets Inventory
NUMBER OF GIS STAFF
NOTABLE SKILL SETS
GIS APPLICATIONS (NUMBER OF SEATS) #, ##
AVAILABLE DATASETS
Department of Administration – Land Management Information Center
14
Data / Server Administration, Web Services, Desktop Cartography, Database Design / Admin, Application Development, Data Development, GIS Coordination
ArcINFO (10)
ArcGIS Server (2),
ArcSDE (2)
ArcGIS Spatial Analyst (1), 3D Analyst (1) and Network Analyst (1)
ArcSDE (2)
ArcView (2)
More than 50 base layers that could possibly support a pandemic response.
Department of Agriculture
3 Data & Server Administration, Web Services,
Desktop Cartography, Database Design,
ArcGIS (1)
ArcIMS (1)
ArcSDE (2)
ArcINFO (4)
ArcEditor (1)
FSA Air Photos (2003-04), Poultry Production Operations, Rendering Facilities, Egg Processing Facilities, SSURGO

State of Minnesota GIS Pandemic Needs Analysis Report
September, 2007
15
NUMBER OF GIS STAFF
NOTABLE SKILL SETS
GIS APPLICATIONS (NUMBER OF SEATS) #, ##
AVAILABLE DATASETS
Application Development, Database Administration, Field Data/Mobile GIS Coordination
ArcView (16)
ArcPad (20)
*desktop, server, PDA
Soils, Sawmills, Commercial Feed Facilities, Meat Processing Facilities, 24K Hydro Features, Wildlife Management Areas, Traffic & Transportation Data, Contingent Closures of environmental spills
Board of Animal Health
3 General use of BAH GIS tools
ArcGIS (3)
DeLORME Street Atlas (50)
Harvard Graphics (15)
Google Earth (50)
*desktop
Minnesota Premises Database (private), Poultry Database (private)
Department of Health
8 General use of DOH GIS tools
ArcGIS (10)
*desktop
Vaccine/antiviral inventory *does not exist, PPE inventory/needs *may not exist, Ventilators, neg. pressure rooms, Patient tracking - hospital bed availability
Department of Human Services
NR n/a ArcGIS/ArcView (1)
*desktop
State Operated Services (SOS) site locations, SOS vendors
*neither dataset currently exists
Department of Commerce
1 Basic map development skills, primarily using existing data layers
ArcInfo (floating)
*desktop
Not specified

State of Minnesota GIS Pandemic Needs Analysis Report
September, 2007
16
NUMBER OF GIS STAFF
NOTABLE SKILL SETS
GIS APPLICATIONS (NUMBER OF SEATS) #, ##
AVAILABLE DATASETS
Department of Education
3 Not specified ArcGIS (2)
ArcView (500 desktops)
*desktop & server
School District boundaries, School District Attendance boundaries, School Program Building Locations
Department of Employment and Economic Development
1 Not specified ArcView (7)
ArcGIS (3)
ArcIMS (1)
ArcSDE (10)
*desktop & server
QCEW Employer List
(private)
Department of Employee Relations
1 Not specified None. Desired. State workforce data (private), Situational event data *may not exist
Department of Labor and Industry
4 Not specified NR PPE supplies, Affected Employers
*unknown whether either dataset exists
Department of Natural Resources
7 – GIS Section
Linux and Citrix Server Administration, Web Mapping Services, User support, GIS/GPS integration,
Desktop Cartography, Database Design, Application Development,
ArcView 3x – 500+
ArcGIS 9.x:
ArcView – 41
ArcEditor – 27
Arc/Info – 15
Spat. Anal. – 8
3D Anal. - 4
ArcSDE – 3
ArcIMS – 1
MapServer –
312 layers totaling more than 250gb that support DNR’s business functions.

State of Minnesota GIS Pandemic Needs Analysis Report
September, 2007
17
NUMBER OF GIS STAFF
NOTABLE SKILL SETS
GIS APPLICATIONS (NUMBER OF SEATS) #, ##
AVAILABLE DATASETS
Database Administration, Field Data/Mobile GIS Coordination,
MNICs- overhead team members
unlimited
ArcPAD – 70+
LandView GIS – unlimited
Pollution Control Agency
5 Admin staff, 4 Dedicated GIS users
Data & Server Administration,
Desktop Cartography, Database Design, Application Development (ArcIMS, Server, ArcEngine), Database Administration
ArcIMS (2)
ArcSDE (2)
ArcINFO (10)
ArcEditor (0)
ArcView (45)
Environmentally Regulated Facilities (Air permits, water discharge permits, Hazardous Waste Generators, Solid waste facilities, Petroleum storage, remediation sites, etc),Impaired Waters, Water quality standards, Surface water monitoring stations, ground water monitoring stations, Air monitoring stations, Surface water discharge stations
(Note: This list only includes data generated by PCA—we also manage wide range of basemap data and data sets generated by other agencies.)
Department of Public Safety
2
911 systems, CAD and Mobile Maps
GeoMedia Pro (1)
I/Mobile (450)
CAD/Mobile map (private), Over-Underpasses

State of Minnesota GIS Pandemic Needs Analysis Report
September, 2007
18
NUMBER OF GIS STAFF
NOTABLE SKILL SETS
GIS APPLICATIONS (NUMBER OF SEATS) #, ##
AVAILABLE DATASETS
Division of Homeland Security and Emergency Management
2
Not specified
I/Dispatcher (37)
MicroStation (1)
CAD Tools (37)
*desktop & server
ArcMap (1)
ArcGIS (3)
*server
(private), Bridges (private), Mile Post Markers (private), State Patrol Districts/Stations (private)
Relies in LMIC
Department of Revenue
1 Maintain boundary files, geocode data, produce maps for reports, and provide spatial analysis
MapInfo (5)
MapMaker (1)
Surfer (1)
ACE (1+)
ZP4 (1)
Google Earth (1)
*desktop
Not specified
Department of Transportation
5 ArcGIS and ArcView
ArcGIS (78)
ArcView (51)
ArcINFO (23)
*desktop & server
MN Base map
Emergency Medical Services Regulatory Board
NR n/a NR Not specified
Office of Enterprise Technology
NR n/a NR MNet Sites, State of MN office locations
NR = no response
# most are not accessible on the State Network (except Google Earth, DOT & PubSaf – GeoMedia, I/Mobile and I/Dispatcher); ## some Arc tools available from DoAg, DoEmp/Econ/Dev and DOT are accessible on the Internet
State of Minnesota GIS Pandemic Needs Analysis Report
September, 2007
19
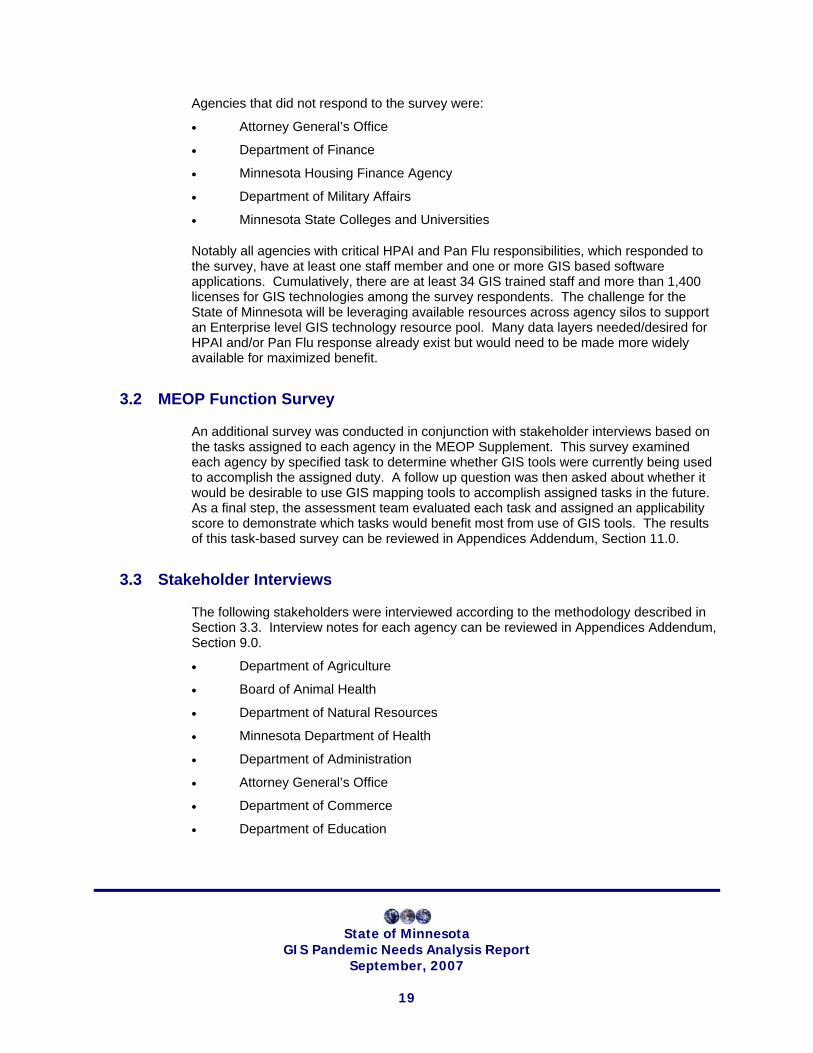
Agencies that did not respond to the survey were:
• Attorney General’s Office
• Department of Finance
• Minnesota Housing Finance Agency
• Department of Military Affairs
• Minnesota State Colleges and Universities
Notably all agencies with critical HPAI and Pan Flu responsibilities, which responded to the survey, have at least one staff member and one or more GIS based software applications. Cumulatively, there are at least 34 GIS trained staff and more than 1,400 licenses for GIS technologies among the survey respondents. The challenge for the State of Minnesota will be leveraging available resources across agency silos to support an Enterprise level GIS technology resource pool. Many data layers needed/desired for HPAI and/or Pan Flu response already exist but would need to be made more widely available for maximized benefit.
3.2 MEOP Function Survey
An additional survey was conducted in conjunction with stakeholder interviews based on the tasks assigned to each agency in the MEOP Supplement. This survey examined each agency by specified task to determine whether GIS tools were currently being used to accomplish the assigned duty. A follow up question was then asked about whether it would be desirable to use GIS mapping tools to accomplish assigned tasks in the future. As a final step, the assessment team evaluated each task and assigned an applicability score to demonstrate which tasks would benefit most from use of GIS tools. The results of this task-based survey can be reviewed in Appendices Addendum, Section 11.0.
3.3 Stakeholder Interviews
The following stakeholders were interviewed according to the methodology described in Section 3.3. Interview notes for each agency can be reviewed in Appendices Addendum, Section 9.0.
• Department of Agriculture
• Board of Animal Health
• Department of Natural Resources
• Minnesota Department of Health
• Department of Administration
• Attorney General’s Office
• Department of Commerce
• Department of Education

State of Minnesota GIS Pandemic Needs Analysis Report
September, 2007
20
• Emergency Medical Services Regulatory Board
• Department of Employee Relations
• Minnesota Housing Finance Agency
• Department of Human Services
• Department of Labor and Industry
• Department of Military Affairs
• Office of Enterprise Technology
• Minnesota Pollution Control Agency
• Department of Public Safety (includes Division of Homeland Security and Emergency Management)
• Department of Revenue
• Minnesota State Colleges and Universities
• Minnesota Department of Transportation
Agencies that did not participate in the interview process were:
• Department of Employment and Economic Development
• Department of Finance
3.3.1 General Stakeholder Comments
There were five (5) stakeholder issues that emerged as general trends among interview participants as detailed below.
Issue #1: GIS has potential to be valuable in HPAI and Pan Flu response
Stakeholders agree that GIS has potential to play a very critical role in HPAI and/or Pan Flu response. The biggest barriers to successfully leveraging GIS include lack of coordinated effort, different priorities for how time/money should be spent toward preparedness efforts, lack of GIS resources within agencies and undefined timeframe to put necessary processes and datasets into place. Stakeholders frequently reported the desire for increased awareness of what opportunities exist for use of GIS and desire for more training.
Issue #2: Lack of information sharing
Information is not adequately being shared among HPAI and Pan Flu response agencies. As a result, resources can not be appropriately leveraged across multiple stakeholders. At present, there is no lead authority to coordinate HPAI and Pan Flu response, especially with regards to technology and GIS tools. Further, since no lead exists, there is limited enterprise coordination of HPAI and Pan Flu technology and resources.
Issue #3: Program priorities may not include GIS

State of Minnesota GIS Pandemic Needs Analysis Report
September, 2007
21
Programs within agencies are often driven by directives set forth by federal funding agencies. Several key agencies reported that though GIS could have critical application in an emergency response effort, particularly HPAI and Pan Flu, current program priorities and funding do not allow for expansion of GIS utilization. As such, funding and coordination of such efforts would need to come from outside of the various agencies/programs.
Issue #4: Lack of existing infrastructure to support the use of GIS in HPAI/Pan Flu response
Interview participants cited concerns about lack of key datasets or insufficient datasets that would be required for an adequate response effort. The issue was also described that data may exist, but it is not accessible due to isolated databases and information systems. Stakeholders suggested the need for interfacing between these disparate systems. Further, data is generally not available in real time, which affects its utility and application in a response effort.
Issue #5: Need for additional training and exercises in HPAI and Pan Flu response
Stakeholders reports that there has been limited testing of information systems in emergency response exercises/drills. Further, uncertainty exists about what the workflow would look like in a HPAI and Pan Flu response. As such, stakeholders requested additional opportunities for drills/exercises to test systems and processes.
3.3.2 HPAI and Pan Flu GIS Needs
During the interview process, stakeholders were asked to identify their specific needs related to GIS tools and HPAI/Pan Flu preparedness and response. As part of this discussion, interviewees were asked to identify which datasets were of particular importance to them in performing the essential business functions described in Section 2.3, and whether they were users or creators of the referenced datasets. In Appendices Addendum, Section 12.0, two tables are presented that detail 1) dataset analysis by essential business function and 2) dataset analysis by agency as users or creators of the data. The table below, Table 3-2, provides a general, cross-cutting overview of each agency’s issues and gaps as related to GIS use in HPAI and Pan Flu response, as well as suggestions to help facilitate increased use of GIS tools.
Table 3-2: Issues and Gaps by Agency
AGENCY ISSUES AND GAPS SUGGESTIONS
Department of Administration
GIS resources of DOA (LIMC) are critical to incident management through the DLan application. However, they are not backed by the OET enterprise network technology.
LMIC provides de-facto leadership in
The expansion of the Archibus system should be reviewed for potential to make a status view of government utilities available via a link to the DisasterLAN application.
The planned fleet management system data structure should be reviewed if it contains
State of Minnesota GIS Pandemic Needs Analysis Report
September, 2007
22
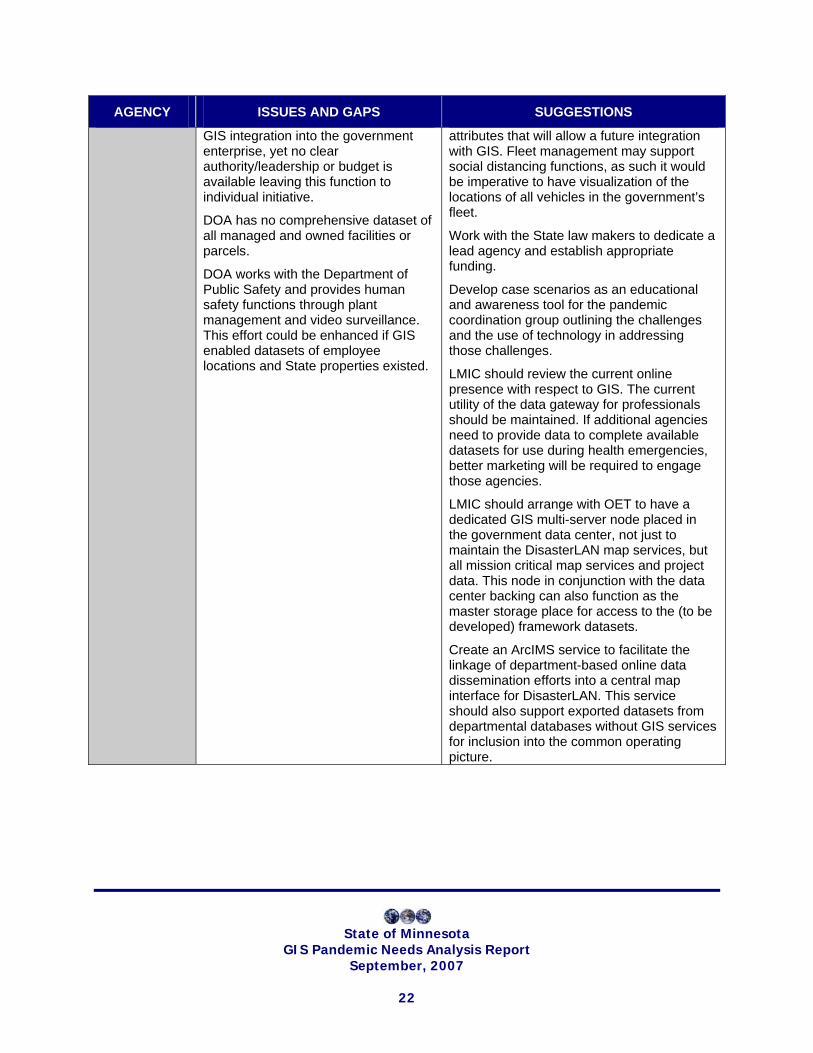
AGENCY ISSUES AND GAPS SUGGESTIONS
GIS integration into the government enterprise, yet no clear authority/leadership or budget is available leaving this function to individual initiative.
DOA has no comprehensive dataset of all managed and owned facilities or parcels.
DOA works with the Department of Public Safety and provides human safety functions through plant management and video surveillance. This effort could be enhanced if GIS enabled datasets of employee locations and State properties existed.
attributes that will allow a future integration with GIS. Fleet management may support social distancing functions, as such it would be imperative to have visualization of the locations of all vehicles in the government’s fleet.
Work with the State law makers to dedicate a lead agency and establish appropriate funding.
Develop case scenarios as an educational and awareness tool for the pandemic coordination group outlining the challenges and the use of technology in addressing those challenges.
LMIC should review the current online presence with respect to GIS. The current utility of the data gateway for professionals should be maintained. If additional agencies need to provide data to complete available datasets for use during health emergencies, better marketing will be required to engage those agencies.
LMIC should arrange with OET to have a dedicated GIS multi-server node placed in the government data center, not just to maintain the DisasterLAN map services, but all mission critical map services and project data. This node in conjunction with the data center backing can also function as the master storage place for access to the (to be developed) framework datasets.
Create an ArcIMS service to facilitate the linkage of department-based online data dissemination efforts into a central map interface for DisasterLAN. This service should also support exported datasets from departmental databases without GIS services for inclusion into the common operating picture.

State of Minnesota GIS Pandemic Needs Analysis Report
September, 2007
23
AGENCY ISSUES AND GAPS SUGGESTIONS
Department of Agriculture
Facility data has been identified as desired by many users for most pandemic business functions, yet this information is currently stored in non-spatial data stores.
For HPAI response, poultry farms are essential to identify. The current set of farm records and contact information needs to be updated and completed.
Formally review the response to the recent TB outbreak event with special consideration to HPAI preparedness and response. Create a training scenario for GIS testing the lessons learned from the review with current technology and processes.
Create a case study describing the use of the Network Analyst extension for the meat program at DOA.
Review the planned compliance system implementation for data elements that can be mapped. DisasterLAN may need to have access to a list of all such facilities and their respective compliance in the case of an event.
Board of Animal Health
HPAI response by BAH should be supported by the capability to track the history of individual animals using maps, a capacity that is not yet developed.
The interactivity of GIS products should be increased at BAH.
Development, maintenance, and access to facilities that are most affected by HPAI or pandemic events must be improved.
Field staff support does not currently include GIS tools, yet pandemic response will require real time situational awareness in the field.
Explore with OSHA and Department of Revenue if the list of poultry locations can be improved with data from their systems. There are certain legal issues that need to be addressed, yet it may be possible to tap those sources.
Review and ensure that all poultry laboratory test requests always carry either full addresses or can be resolved through an ID system to a physical location that can be mapped. This information may be required by a command center to complete a situational awareness picture.
Attorney General’s Office
The AG office must rely on information and data provided by other agencies for decision support. There is no staff knowledgeable in GIS and no technology base to review the common operating picture in real-time.
Develop case studies around non-compliant carriers, scientific information presentation, quarantine situations, and court room challenges during pandemic events that should be reviewed with a GIS specialist to a) get a business need understanding in the GIS community, and b) get an understanding of the contributions GIS can make to solve these challenges.

State of Minnesota GIS Pandemic Needs Analysis Report
September, 2007
24
AGENCY ISSUES AND GAPS SUGGESTIONS
Department of Commerce
There are uncertainties about the content in the department’s databases that may need to be verified.
There are no GIS sharing facilities to provide utility infrastructure information to a common operating picture.
None noted.
Department of Education
The lack of reliable skill inventories, facility listings, attribute information on tracked facilities (e.g., which schools have an agriculture department) and other cross government support information impacts the use of GIS for pandemic resource tracking.
Establish a GIS service hosting available datasets from the department. This may even be achieved by using existing services at LMIC and adding an additional map service. This simple provision will ensure school access to relevant data in the command center map interface for decision support.
Emergency Medical Services Regulatory Board
There is currently a lack of sufficient information to form an integrated common operating picture to support decisions regarding the best deployment of resources.
Review MNStar database for its potential to provide online data regarding ambulances and personnel to the common operating picture in MNTrac and DisasterLAN.
Possible data exchange between MNTrac, DisasterLAN, several multi-agency communication centers, hospitals and the EMSRB should be considered and recommendations made regarding the ideal integration of these various response utilities.
Department of Employee Relations
There is a lack of risk assessment information, resource location information, communication about absenteeism, which should all be available visually to perform resource placement and deploy support scenarios to affected departments.
Being the only agency that can provide government-wide employee and status information, DOER and HSEM should work together defining an information system that could be utilized by DOER detailing (possibly on a map) the status of each agency on a daily basis.
DOER should develop a dataset of all locations where government employees have a work place. This may be an export from the Sema4 system and re-executed routinely. This dataset should be included in a map service at LMIC.
Department of Employment & Economic Development
There appears to be a re-assignment of pandemic responsibilities between staff within the department.
None noted.

State of Minnesota GIS Pandemic Needs Analysis Report
September, 2007
25
AGENCY ISSUES AND GAPS SUGGESTIONS
Department of Health
Exercises are conducted without the use of maps in some EOC settings.
SNS tracking and management, vaccine tracking and management, overall resources are not supported by GIS.
Field staff is not supported by GIS-based data collection technology.
Training and awareness of GIS is limited and prevents consistent integration of GIS into Health functions.
Health lacks a data and map resource combining datasets with a user-friendly interface.
Health requires interpretation analysis functionality: tracking care needs, behavior analysis during events to improve care, people movement analysis, hazard risk analysis, local capacity analysis, route mapping and analysis for care distribution.
Develop a mass immunization add-on to the state’s immunization registry system that supports spatial attributes and automated geocoding or georeferencing for coverage analysis and decisions on resource allocations.
Implement a modern disease reporting and management system with links to the immunization registry, laboratory reporting and outbreak management capabilities (all supported by interactive maps). This is one of the single most important enablers for an integrated common health picture while providing substantively enhanced capacities for daily operations of the department.
Migrate MNTrac from private vendor to OET government enterprise data center for heightened availability and security.
Work with the vendor of MNTrac on replacing the Google map component with an ArcIMS/ArcGIS Server based map component to overcome the inherent limitations of Google maps, such as lack of analytical capabilities, data integration with external datasets, etc.
Work with the vendor of MNTrac and the Department of Human Services to expand MNTrac to track human services facilities for inclusion in the decision making process and resource management.
Develop case studies for spread of disease, develop requirements for essential datasets needed for pandemic response decision support, and work with partners on the analytical solutions to key problems during health emergencies, e.g., population movements, disease spread models, social distancing models, etc.

State of Minnesota GIS Pandemic Needs Analysis Report
September, 2007
26
AGENCY ISSUES AND GAPS SUGGESTIONS
Housing Finance Agency
Housing Finance is tasked to find housing for needy or displaced people, yet there is not a real-time current list of properties available. The list would have to be created manually from paper reports.
None noted.
Department of Human Services
DHS functions would require knowledge of resources within other agencies, such as red cross sites, hospitals, animal care facilities, car washes, lodging, emergency infrastructure (police and fire stations), etc. for decision support and resource allocation/deployment.
Work with the Department of Health to possibly include a module in MNTrac for the resource tracking of mental and behavioral health sites, emergency reception centers and other resources. This would integrate well with DHS’ stated need for access to hospital information to transfer patients and expand the user base for MNTrac into additional related departments for shared response coordination.
Department of Labor & Industry
OSHA has a large data store that contains a comprehensive listing of all inspected facilities where an employer/employee relationship exists, yet the data is not in a form conducive to GIS use.
Work with GIS experts from LMIC to explore the opportunities for unrealized datasets that are inherent in OSHA’s databases. Facility data has been identified as a key dataset for emergency response.
Work with GIS experts from LIMC to explore the potential for public communication and outreach inherent in map visualizations. This will increase the overall awareness within the department of GIS, thus making any data creation process as outlined above more sustainable.

State of Minnesota GIS Pandemic Needs Analysis Report
September, 2007
27
AGENCY ISSUES AND GAPS SUGGESTIONS
Department of Military Affairs
A large number of data products are available through Military Affairs, specifically remote sensing data, that is relatively unknown in its content and some of which may be unavailable due to secrecy protection.
Planning expertise that exists in Military Affairs could be better integrated into overall pandemic preparedness planning.
Overall, Military Affairs capacities are too little known.
Internal staff turn-over may be higher than in most other agencies due to the nature of the agency.
Review proactively with HSEM the capacities available within the National Guard for pandemic support. This should include the exploration of technology compatibility to quickly create information bridges, the preparations and processes needed to augment local law enforcement efforts to safeguard SNS facilities – if deemed necessary by state officials, a review of the forensic systems available at the National Guard for their applicability to contact tracing, and a review of modeling (plumes) and other advanced analytical functions to plan for their integration in the overall pandemic response.
The National Guard may be asked to review the ongoing planning efforts throughout the government to provide an opinion regarding their appropriateness based on the National Guard’s extensive emergency planning and operational support experience.
Department of Natural Resources
To perform its functions better, a comprehensive parcel landownership dataset would be needed. Some data exists in other agencies (Farm Services) but is not readily shared.
The Firewise application and facilities data is contained in a system that has no counterpart within government agencies (Oracle Spatial) and is limited in its uses for other agencies.
DNR desires to expand GIS capabilities into plume modeling with parameterized proximity searches across facilities and demographic datasets.
Provide case studies for the application of GIS in problem solving.
Make source data of the Critical Infrastructure Assessment Protocol Database (Firewise) accessible through an ArcIMS map service for real-time inclusion in the DisasterLAN map service.

State of Minnesota GIS Pandemic Needs Analysis Report
September, 2007
28
AGENCY ISSUES AND GAPS SUGGESTIONS
Office of Enterprise Technology
OET desires to establish a true picture of all enterprise resources by location to support utilities management and restoration functions.
No GIS expertise exists in either planning or operations at OET.
OET has not become the corporate resource it is for other mission critical infrastructure, systems and data.
Work with the Department of Employee Relations, the Department of Public Safety, the Department of Health, the Department of Administration, and the Department of Education on the creation of a global call list to support adequate information sharing to state employees and other public servants (schools, health facilities, etc.).
Create a dedicated server as a GIS node within the enterprise data center for the use of the Land Management Information Center, Department of Natural Resources and Department of Transportation to support the maintenance and safeguarding of key information infrastructure datasets.
Develop GIS knowledge capacity with 2-3 resources that are either within the department (through training) or are recruited from external sources to perform GIS functions on a regular basis (staff of other departments or private sector consultants).
Pollution Control Agency
PCA does not anticipate performing operational functions, but rather provide guidance. To support the decision process for the development of guidance in disposal scenarios will require soil and hydrology datasets to be available.
There is opportunity for improved communication of expectations between all stakeholders involved in the disposal of hazardous materials, such as HPAI infected birds.
Develop a mock scenario with the Board of Animal Health, the Department of Natural Resources and the Department of Agriculture to establish validated protocols for engagement of each party during a HPAI outbreak.
Develop a mock scenario with the Department of Health to establish validated protocols for engagement of each party during a pandemic influenza outbreak.
Develop case studies on the use of GIS in site analysis.
Department of Public Safety (includes HSEM)
Public Safety does not appear to support a consistent and unified intra-agency approach to GIS. The respective offices and departments follow separate approaches to the integration of GIS into their individual operations.
Decision support for pandemic (and all
Coordinate the discovery and development of alternative sources for needed datasets between all departments, in particular facilities data.
Support the migration of the GIS services for DisasterLAN to the OET enterprise data center.
Enhance the map module of DisasterLAN to

State of Minnesota GIS Pandemic Needs Analysis Report
September, 2007
29
AGENCY ISSUES AND GAPS SUGGESTIONS
hazard) events is dependent on datasets from other sources/agencies. Basic datasets and capacities are missing, e.g., geocoding.
DisasterLAN’s GIS component is basic in its features and disconnected from the ticket system in the main part of the application.
The GIS service component must be outsourced and is currently not supported by an enterprise-strength data hosting environment.
A comprehensive GIS database needed to support pandemic planning and response does not exist.
No data connectivity exists to bring real-time information from external sources via the GIS component for a comprehensive operational picture.
Awareness and skill sets related to DisasterLAN in the stakeholder community are spotty.
access ticket records in the system in real-time.
Establish a two-way data sharing structure with MNTrac and at least a one-way data sharing structure with the Firewise system to include the respective datasets in the common operating picture.
Support the creation and on-going maintenance of a unified, comprehensive and easily accessible GIS database.
Department of Revenue
The GIS capacities of Revenue are embodied in a single employee and are, therefore, not very stable or sustainable.
The Department’s data provisioning potential is undervalued and limited by legal safeguards.
Review with the Department of Public Safety and the Office of the Attorney General the potential to use tax record data to extract datasets identifying facilities locations by type and general people demographic by zip code. The latter may include percentages of special needs populations, second homes distributions, etc.
Review with the Land Management Information Center the potential of the established Master Address Database to become a source dataset for roof top geocoding.
The Department of Revenue does not have priority functions in the case of a health emergency, yet it does have key data that can be invaluable for decision support at a command center level. The Department of Public Safety should work with Dept of Revenue to create a sustainability model of information availability during emergencies

State of Minnesota GIS Pandemic Needs Analysis Report
September, 2007
30
AGENCY ISSUES AND GAPS SUGGESTIONS
that ensures the safety and confidentiality of personal records, yet make key facilities data available.
Case studies on data cleaning and geocoding issues should be developed.
Department of Transportation
The street dataset has been judged incomplete and not up to date.
There appears to be some data redundancy with other departments and some incompatibilities of data standards.
Create case studies on utilizing GIS based information in work management solutions to increase awareness for GIS as an operational tool and to support planning for work management under social distancing constraints.
Support the Firewise database of the Department of Natural Resources with any facilities data available to DOT, including locations of hazardous materials team, fuel cashes, traffic cameras, DOT sheds and equipment, etc.
Contribute to an advanced analysis by analyzing road sensor data for population movement modeling.
Department of Finance
The agency does not anticipate needing to perform pandemic support functions and has no accessible staff structure for pandemic preparedness.
None noted.
Minnesota State Colleges and Universities
There appears to be a lack of knowledge of utility installations, campus resource locations, etc.
Efforts have only begun to integrate the scientific body represented in MNSCU into the development of spatial analysis identified by some agencies.
Identify scientific staff and resources to support the development of advanced spatial analytical approaches to support pandemic decision making.
Expand the support of day/night population modeling to include work/vacation modeling to provide best efforts guidance to resource allocation during pandemic related population shifts. Data from the Department of Transportation traffic sensors may prove useful.
As described in the table and interview transcripts (Appendices Addendum, Section 9.0) many agencies are not maximizing the benefits of GIS or are performing GIS-like tasks using paper-based methods. Further, many datasets are incomplete, out of date or would require integration with other systems/datasets to be optimized. Stakeholders acknowledge that GIS has incredible potential for HPAI and Pan Flu response, but each agency sites barriers to pursuing more advanced use of GIS.

State of Minnesota GIS Pandemic Needs Analysis Report
September, 2007
31
3.3.3 Essential Data Layers for Pan Flu Response
Presently, there are no established standards or guidelines specifying which GIS data are relevant to preparing for or responding to a Pandemic Influenza event. For the purposes of the present assessment, federal, state, and non-governmental agency documents were reviewed and personnel were consulted who have recently surveyed state public health agencies regarding this topic. While there seems to be a general consensus that GIS has important roles to play in managing an influenza pandemic, presently a description is lacking for specific applicable data layers and how they would apply to event preparations and management. This may in part be due to the distributed nature of many GIS data layers – State and Local Public Health agencies, for example, are not generally custodians of data that spatially describe hospital and healthcare provider locations or location where livestock are housed.
There is, however, an emerging and increasingly well developed series of standards and guidelines regarding specific information needs and intervention and countermeasure activities that pertain to the public health management of Pandemic Influenza at the international, federal, state, and local levels. Much of this literature was consulted for the present assessment in order to identify a core set of Pandemic Influenza planning, response, and recovery activities, and associating each with GIS data layers which would likely support each activity. As an organizing framework, most activities that can be supported by GIS fall into one or more of the following categories:
• Monitoring
• Requesting information
• Tasking
• Analysis and decision making
• Product development
• Distribution and deployment
In Table 3-3 below, we identify and characterize these core activities, link each with relevant GIS data, and provide descriptions of how such data would likely support the performance of each activity. For the present assessment, the activities that have been identified – and the data necessary to support each – have focused on the state (rather than local) level; however, it is essential to recognize that much of the event response will occur and be managed at the local level and that much of the spatial data important to such management originates and/or is managed, locally.

State of Minnesota GIS Pandemic Needs Analysis Report
September, 2007
32
Table 3-3: GIS Data Layers Supporting Pandemic Influenza Planning and Response
PANDEMIC INFLUENZA
EVENT ACTIVITY3
ACTIVITY DESCRIPTION
SUPPORTIVE GIS DATA LAYER(S)
HOW GIS DATA SUPPORTS ACTIVITY
1. Surveillance and early detection
Early warning and situational awareness of human, animal, and contaminated commodities through spatial analysis of surveillance data, including new suspected and confirmed cases, fatalities, and recovered cases.
> Syndromic (human) data from emergency departments, clinics, pharmacies, and absenteeism reports (e.g., schools).
> Sentinel surveillance data (e.g., migratory birds, poultry and other livestock, and humans) such as this might be established when a pandemic threatens.
> Early detection screenings as might be established early in a pandemic (e.g., at airports, bus stations, boarder crossings, etc.).
> Case reports submitted from established or ad hoc reporting systems (e.g., communicable disease reports; hospital infection
> Locates emerging sources of infection and speeds public health intervention.
> Contributes to early detection, limiting spread, and characterizing the epidemiologic and clinical nature of the disease agent.
> Locates sources of possible spread.
> Identifying locations, patterns of spread, clusters, and epidemiologic attributes descriptive of the dynamics of the
3 Sources include: 1) CDC Influenza Pandemic Plan OPLAN, U.S. Centers for Disease Control and Prevention, Atlanta, GA., July 2007 (especially Annex B); 2) Pandemic Influenza Implementation Plan, Part I, U.S. Department of Health and Human Services, Washington, D.C., November, 2006; 3) Interim Pre-Pandemic Planning Guidance: Community Strategy for Pandemic Influenza Mitigation in the United States – Early, Targeted, Layered Use of Nonpharmaceutical Interventions, U.S. DHHS and CDC, February, 2007. These documents are available at www.pandemicflu.gov.

State of Minnesota GIS Pandemic Needs Analysis Report
September, 2007
33
PANDEMIC INFLUENZA
EVENT ACTIVITY3
ACTIVITY DESCRIPTION
SUPPORTIVE GIS DATA LAYER(S)
HOW GIS DATA SUPPORTS ACTIVITY
control reports; case-finding through epidemiologic investigation, etc.).
> Records of deaths.
> Records regarding persons immigrating or emigrating during the event.
> Birth records.
pandemic, and informs the selection and targeting of countermeasures.
> Resource predictor and hazard control.
> Locates and estimates care needs, and identifies known or suspected sources for importing or exporting infection.
> Locates new susceptible populations.

State of Minnesota GIS Pandemic Needs Analysis Report
September, 2007
34
PANDEMIC INFLUENZA
EVENT ACTIVITY3
ACTIVITY DESCRIPTION
SUPPORTIVE GIS DATA LAYER(S)
HOW GIS DATA SUPPORTS ACTIVITY
2. Population vulnerability assessment and management
Pre-event characterization of vulnerable groups (human/animals); event-management of special-needs populations.
> Nursing homes, hospitals, prisons and jails, universities and other residential institutions.
> Areas with low population density (rural) and their residential distribution.
> Low-income areas and areas known to have low access to basic support services (transportation, healthcare, media access).
> Areas with high concentrations of non-English-speaking residents.
> Any specialized data describing special-needs populations and where they might be located.
> Locates places where disease amplification may occur, and where special services may need to be directed.
> Locates and characterizes case spread; facilitates routing of care and services.
> Locates areas where care and services delivery may need to be deployed.
> Locates areas where translation of public health and other communications may be needed.
> Potentially locates such populations and characterizes their special needs.

State of Minnesota GIS Pandemic Needs Analysis Report
September, 2007
35
PANDEMIC INFLUENZA
EVENT ACTIVITY3
ACTIVITY DESCRIPTION
SUPPORTIVE GIS DATA LAYER(S)
HOW GIS DATA SUPPORTS ACTIVITY
3. Exposure tracking Locating and characterizing known and potential exposure of population members and groups to sources of infection and spread.
> Livestock and poultry locations.
> Migratory bird routes and congregating locations.
> Sites demonstrated or believed to be point-source transmission locations.
> Locations of vendors of potentially contaminated commodities (restaurants, food distribution, etc.).
> Potential/actual outbreak sites.
> Locates places where surveillance or intervention might be necessary.
> Locates sites where public health intervention may be needed.
> Locates points of possible spread for epidemiologic monitoring and possible public health intervention.
4. Quarantine and Isolation monitoring
Locating, monitoring, and managing the quarantine of cases (human/animal) suspected of being exposed, and the isolation of cases known to be infected.
> Locations designated (pre- and during-the-event) to be sites for quarantine or isolation for humans or animals suspected or known to be, respectively, infected.
> Data related to accessing and securing such locations.
> Locates individuals/groups that require public health and medical monitoring, or whose movements must be restricted in order to limit spread.
> Identifies geographic and other factors important for securing areas and monitoring interactions with responders.

State of Minnesota GIS Pandemic Needs Analysis Report
September, 2007
36
PANDEMIC INFLUENZA
EVENT ACTIVITY3
ACTIVITY DESCRIPTION
SUPPORTIVE GIS DATA LAYER(S)
HOW GIS DATA SUPPORTS ACTIVITY
5. Laboratory specimen tracking
Tracking, routing, and monitoring results of tests performed on specimens (human/animal origin) submitted to laboratories.
> Laboratories and their capabilities and capacity.
> Specimen routing paths and intermediate points where specimens might be handled or stored.
> Lab results data.
> Locates sites where testing can occur and helps balance workload.
> Identifies system efficiencies and possible sites where exposure might occur.
> Supports surveillance, epidemiologic case investigation and case monitoring.
6. Patient/case tracking
Locating, monitoring status, and managing interventions for cases (human/animal) and the healthcare of patients.
> Case reports.
> Patient medical status reports.
> Adverse reaction reports.
> Care administered.
> Locates disease burden and rate/routes of spread.
> Locates individuals receiving care; manages resource demand.
> Allows intervention when vaccines or drugs are suspected of causing adverse reactions in recipients.
> Locates healthcare burden and resource load-balancing.

State of Minnesota GIS Pandemic Needs Analysis Report
September, 2007
37
PANDEMIC INFLUENZA
EVENT ACTIVITY3
ACTIVITY DESCRIPTION
SUPPORTIVE GIS DATA LAYER(S)
HOW GIS DATA SUPPORTS ACTIVITY
7. Healthcare facilities census
Managing routing of patients, medical and public health personnel, and load-balancing across hospitals and other locations where medical care is being delivered.
> Locations, capabilities, and capacity of healthcare institutions and sites.
> Healthcare institutional occupancy reports.
> Healthcare institutional status (e.g., receiving patients?).
> Locates where cases may be treated.
> Locates and monitors healthcare burden; aids load-balancing.
> Locates where new patients might be sent.
8. Immunization Locating and monitoring the immunization status (pre-event and during the event) of human/animal populations and identifying populations with unmet needs.
> Immunization Information System records.
>Immunization provider locations and ad hoc immunization sites.
> Informs on patterns and locations relative to immunization coverage.
> Locates sources where immunizations are administered.

State of Minnesota GIS Pandemic Needs Analysis Report
September, 2007
38
PANDEMIC INFLUENZA
EVENT ACTIVITY3
ACTIVITY DESCRIPTION
SUPPORTIVE GIS DATA LAYER(S)
HOW GIS DATA SUPPORTS ACTIVITY
9. Inventories and Points of Dispensing
Locating, deploying assets to and managing the operations of community points of dispensing (for distributing medications, vaccines, and supportive commodities), and for locating and managing inventories of supplies (e.g., medical supplies and equipment, food, water, etc.).
> Points-of-dispensing locations and characterizations.
> Caches of equipment, supplies, and therapeutic modalities and locations suitable for the storage of same.
> Locations where community support commodities can be obtained or where these are stored (e.g., food, water, etc.).
> Locates sites of healthcare intervention.
> Locates repositories of supplies, equipment, medications, etc. that may be accessed in support of event response.
> Locates community-based sources of essential assets needed to sustain vulnerable populations through the pandemic.
10. Workforce management
Locating, characterizing, deploying and managing response personnel, including volunteers.
> Locations of public health, healthcare, and other emergency response personnel and their attributes.
> Locations of volunteers and their attributes.
> Locates available personnel in relation to areas where their skills are needed.
> Locates available personnel in relation to areas where their skills are needed.

State of Minnesota GIS Pandemic Needs Analysis Report
September, 2007
39
PANDEMIC INFLUENZA
EVENT ACTIVITY3
ACTIVITY DESCRIPTION
SUPPORTIVE GIS DATA LAYER(S)
HOW GIS DATA SUPPORTS ACTIVITY
11. Fatality management
Locating and managing processing and disposition of fatalities, especially those that pose potential hazards for spreading infection.
> Locations of fixed and mobile morgues and their capacity and capabilities.
> Transportation and storage equipment and facilities.
> Fatality disposition sites and their characteristics and capacity.
> Locates sources of fatality-management; potential sources of further disease spread.
> Locates assets dedicated to transporting or storing fatalities.
> Locates where bodies will be disposed; where security needs to be directed; where potential exposure hazard exists.
12. Social Distancing
Spatial information identifying known locations and opportunities for mass gatherings as a risk of increasing the spread of infection, as well as potential sites to which key population groups might be dispersed to avoid routine close contact throughout the pandemic.
> Locations and characteristics of schools, sporting event venues, entertainment establishments, and other sites where mass gatherings occur.
> Sites designated as suitable for potentially locating key personnel or population groups during periods of the pandemic where social distancing is desirable.
> Locates facilities and populations that might need to be closed or have movement restrictions imposed to limit spread.
> Locates sites where selected persons might find safe harbor during a pandemic.

State of Minnesota GIS Pandemic Needs Analysis Report
September, 2007
40
PANDEMIC INFLUENZA
EVENT ACTIVITY3
ACTIVITY DESCRIPTION
SUPPORTIVE GIS DATA LAYER(S)
HOW GIS DATA SUPPORTS ACTIVITY
13. Transportation Location, characterization and management of transportation assets for the movement of persons and animals (well, exposed, ill), material, bodies, and response assets.
> Schools and other buses.
> Freight transport.
> Cold storage vehicles.
> Sites where such assets might be parked and serviced.
> Locates assets that might be needed to move personnel or populations.
> Locates assets that can transport material.
> Locates assets that can maintain a supply cold-chain or store fatalities.
> Locates where vehicles can be positioned relative to where they are used.

State of Minnesota GIS Pandemic Needs Analysis Report
September, 2007
41
PANDEMIC INFLUENZA
EVENT ACTIVITY3
ACTIVITY DESCRIPTION
SUPPORTIVE GIS DATA LAYER(S)
HOW GIS DATA SUPPORTS ACTIVITY
14. Community support assets and services
Location and characterization of assets and services that support public health interventions and their consequences, especially for vulnerable populations and those with special needs.
> Food service and preparations sites.
> Schools.
> Mental Health services.
> Home healthcare personnel.
> Disability transportation.
> Foreign language specialists.
> Locates sources where food preparation can occur to serve responders and special-needs populations.
> Locates potential sites for services, healthcare, etc.
> Locates points of service relative to populations in need.
> Locates specialized services for service deliver y to home-bound populations.
> Locates assets that can move disabled populations.
> Locates persons that can aid in translating community health messages and instructions.
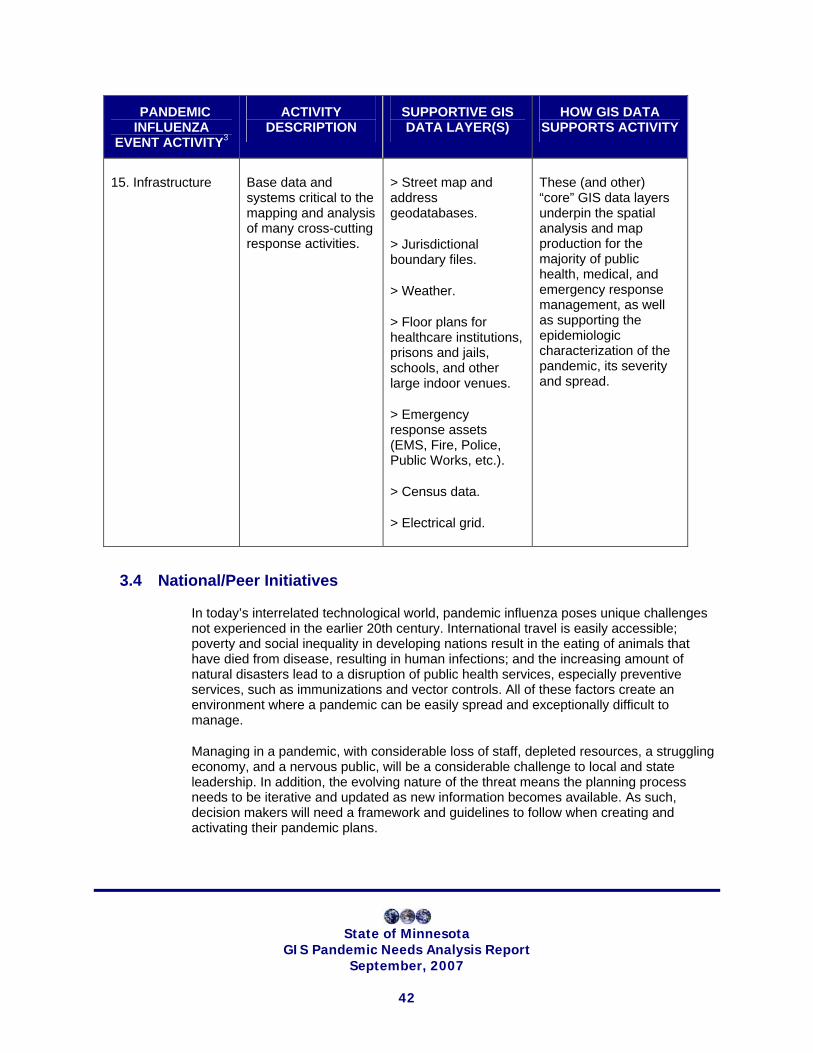
State of Minnesota GIS Pandemic Needs Analysis Report
September, 2007
42
PANDEMIC INFLUENZA
EVENT ACTIVITY3
ACTIVITY DESCRIPTION
SUPPORTIVE GIS DATA LAYER(S)
HOW GIS DATA SUPPORTS ACTIVITY
15. Infrastructure Base data and systems critical to the mapping and analysis of many cross-cutting response activities.
> Street map and address geodatabases.
> Jurisdictional boundary files.
> Weather.
> Floor plans for healthcare institutions, prisons and jails, schools, and other large indoor venues.
> Emergency response assets (EMS, Fire, Police, Public Works, etc.).
> Census data.
> Electrical grid.
These (and other) “core” GIS data layers underpin the spatial analysis and map production for the majority of public health, medical, and emergency response management, as well as supporting the epidemiologic characterization of the pandemic, its severity and spread.
3.4 National/Peer Initiatives
In today’s interrelated technological world, pandemic influenza poses unique challenges not experienced in the earlier 20th century. International travel is easily accessible; poverty and social inequality in developing nations result in the eating of animals that have died from disease, resulting in human infections; and the increasing amount of natural disasters lead to a disruption of public health services, especially preventive services, such as immunizations and vector controls. All of these factors create an environment where a pandemic can be easily spread and exceptionally difficult to manage.
Managing in a pandemic, with considerable loss of staff, depleted resources, a struggling economy, and a nervous public, will be a considerable challenge to local and state leadership. In addition, the evolving nature of the threat means the planning process needs to be iterative and updated as new information becomes available. As such, decision makers will need a framework and guidelines to follow when creating and activating their pandemic plans.

State of Minnesota GIS Pandemic Needs Analysis Report
September, 2007
43
3.4.1 National Incident Management System
While most emergency situations are handled locally, when there's a major incident help may be needed from other jurisdictions, the state and the federal government. The National Incident Management System (NIMS) was developed so responders from different jurisdictions and disciplines can work together better to respond to natural disasters and emergencies, including pandemic influenza4. NIMS benefits include a unified approach to incident management; standard command and management structures; and emphasis on preparedness, mutual aid and resource management.
The NIMS integrates existing best practices into a consistent, nationwide approach to domestic incident management that is applicable at all jurisdictional levels and across functional disciplines in an all-hazards context. Six major components make up this systems approach:
• Command and Management
• Preparedness
• Resource Management
• Communications and Information Management
• Supporting Technologies
• Ongoing Management and Maintenance
A more detailed description of the NIMS Components can be found in the Appendices Addendum, Section 13.0.
3.4.2 Federal Legislation
The second session of the 109th Congress put into act Statute 3678 to amend the Public Health Service Act with respect to public health security and all-hazards preparedness and response, and for other purposes5. Included in the Act are several sections that pose IT implications. In Appendices Addendum, Section 14.0, a table has been included that highlights the relevant sections and provides a descriptive summary.
Most of the IT related sections can be categorized into three overarching themes:
• Disease surveillance
• Resource management
• Vaccine management and distribution.
IT solutions currently exist for all areas and are discussed in Section 2.5.
4 National Incident Management System. http://www.fema.gov/pdf/emergency/nims/nims_doc_full.pdf. March 2004. 5 U.S. Government Printing Office. http://frwebgate.access.gpo.gov/cgi-bin/getdoc.cgi?dbname=109_cong_bills&docid=f:s3678es.txt.pdf

State of Minnesota GIS Pandemic Needs Analysis Report
September, 2007
44
3.4.3 ESRI Study: Geographic Information Systems and Pandemic Influenza Plans
The information contained in this section was presented at the 2007 URISA Conference, August 20-23, 2007 in Washington D.C. by ESRI. This presentation in its entirety can be viewed in the Appendices Addendum, Section 14.0.
In a 2007 study conducted by ESRI, fifty (50) State Pandemic Influenza Plans and six (6) local plans were reviewed for specific references to GIS application in pandemic response. Eight (8) State plans reference GIS: Arizona, Arkansas, Florida, Michigan, New Jersey, New York, Rhode Island and Texas. Searched references included: GIS, geographic, geography, geographical, and miscellaneous terms such as information system, location, map, spatial, visualization and demographic.
Note: failure to specifically mention GIS in the Pan Flu Plan does not mean that a state does not have GIS capacity. Additionally, many states and local jurisdictions continue to update and evolve existing plans so the number with GIS application/integration may continue to increase. All of the referenced State plans can be reviewed in detail at http://www.pandemicflu.gov/plan/stateplans.html.
Table 3-4 provides a specific summary of GIS mentions in the eight (8) referenced plans. New York State Department of Health provides the most detailed description of how GIS will be used in Pan Flu response. A detailed write up of the New York model for GIS use was prepared by ESRI and can be found in the Appendices Addendum, Section 16.0. Florida’s description of a GIS Data Specialist was the next most evolved GIS mention in the identified plans.
Table 3-4: Summary of GIS Mentions in State Pandemic Influenza Plans
STATE GIS MENTION
Arizona Plan notes that community level preparedness requires knowledge of the demographic, geographic and cultural make-up of the community, in order to ensure all populations in a community are involved, or are, at a minimum, accounted for in the response plan.
Arkansas Disease Surveillance - Includes weekly preparation of a GIS map to monitor all Medicaid claims variables for influenza diagnosis and other variables.
Florida GIS Data Specialist: Position Description
Provide liaison to various organizations and units within DOH to access maps, GIS coordinates and databases to be able to provide overlay maps with GIS locations for

State of Minnesota GIS Pandemic Needs Analysis Report
September, 2007
45
STATE GIS MENTION
various facilities and infrastructure components impacting the health of the public
Access and display maps with GIS locations, as above, in support of the Situation Status Unit and planning within ESF8
Develop and maintain databases necessary for creating and display of overlays for GIS maps as new ESF8 data becomes available within the Situation Status Unit
Provide advice and suggestion to Situation Status Unit and threat assessment specialists regarding current status and future concerns evident in geographic analysis of events
Michigan Disease Surveillance - Proposes the use of GIS in surveillance activities and the “application of GIS methodologies” in the event of novel virus activity or pandemic influenza occurrence.
New Jersey Disease Surveillance and Emergency Notification –
Existing GIS integration with disease surveillance systems
GIS mapping technology is part of a community emergency communication system (GeoNotify)
GeoNotify is a product of ESRI Business Partner Dialogic Communications Corp
Enables easy geographical selection of targeted notification areas, and initiates first phone warnings within 60-90 seconds of incident identification
Based on MapObjects
New York Disease Surveillance, Emergency Notification, Asset Tracking –
Existing GIS integration with disease surveillance systems
GIS will support real-time situational awareness and decision support
GIS will be used to visualize and analyze incoming data in relation to key geographical

State of Minnesota GIS Pandemic Needs Analysis Report
September, 2007
46
STATE GIS MENTION
information (layers)
Other proposed applications of GIS:
Vaccine inventory and tracking
Antiviral inventory and tracking
Clinic data management: Tracking of vaccine and antiviral administration
Demographic profiles to help locate special needs populations
Hospital assets
Medical staff assets at point locations
Volunteer rosters
Hospital and laboratory surge capacity
Logistics/Routing
Web-based tool to allow access and mapping of real-time data by users in the field, along with info on resource availability in the field
Rhode Island GIS appears in the Incident Command Structure org chart for Technical/Subject Matter Experts
Texas GIS appears in the Incident Command Structure org chart for the Planning Section
Though only eight plans specifically referenced GIS, many terms and phrases used frequently in most plans imply potential mapping integration opportunities, such as:
• Geographic progression of influenza
• Geographic clusters
• Geographic analysis
• Definition of quarantine
• Bed tracking
• Planning assumption that Pandemic Influenza will be widely dispersed geographically
• Geographically isolated populations (as a vulnerable population)
• “Snow days” for a targeted geographic area

State of Minnesota GIS Pandemic Needs Analysis Report
September, 2007
47
4.0 Recommendations
Based upon the evidence gathered and evaluated throughout this assessment, the following five recommendations are offered to enhance Minnesota’s capacity for utilization of GIS technologies in support of Pan Flu and HPAI planning and response efforts. The recommendations have been prioritized and are listed in the order that they should be considered. Recommendations can be summarized as follows:
1. Increase availability, standardization and use of GIS tools in Pan Flu and HPAI planning and response.
2. Assign a “champion” to drive and coordinate GIS integration into Pan Flu and HPAI processes, including the attainment of stakeholder buy-in and plans for statewide rollout.
3. Establish a forum for agencies listed in the MEOP Supplement to coordinate resources and evaluate needs for education/training and exercises as related to GIS use in Pan Flu and HPAI planning and response.
4. Focus GIS integration efforts in the following areas:
° Outbreak tracking
° Inventory movement
° Staffing resource management
° Enterprise integration of available datasets
5. Work with a Business Analyst to define which datasets and outputs are required/desired.
The following recommendations can be considered individually or inclusively to support the expansion of GIS utilization among agencies involved in Pan Flu and HPAI planning and response.
Recommendation 1
Increase availability, standardization, and use of GIS tools in Pan Flu and HPAI planning and response.
Increased use of new and existing GIS tools is recommended to aid Pan Flu and HPAI response planners in developing response plans and evaluating response efforts and exercises/drills. This requires enhancement of existing infrastructure to include the availability of a geocoding facility and centralized access to core GIS utilities/software. This infrastructure would then need to be accessible by all appropriate parties with a role in the use of GIS for Pan Flu/HPAI response or similar emergency response efforts. Data in this centralized system would need to be robust, accurate and current to ensure

State of Minnesota GIS Pandemic Needs Analysis Report
September, 2007
48
optimal usability. Further, data sources would require standardization to ensure uniformity of data elements and geocoding. This standardization would also include an optimized process for handling non-standard address information such as PO Box and Rural Route identifiers.
Some of the suggested uses of GIS presented during stakeholder interviews included:
• Real-time strategic decision-making and resource utilization
• Mapping of poultry farms, healthcare facilities, public health facilities, schools, etc.
• Mapping of HPAI incidence in wild and domestic bird populations
• Tracking disease incidence and target interventions
• Use of population density reports to determine SNS allocation needs
• Mapping of POD locations and utilization based on patient zip codes
• Mapping of adverse reactions
• Delivery dispatch of SNS materials to local administration sites
• Mapping of geographic areas affected by contamination, outbreaks and quarantine
Several state agencies already have GIS tools that have been utilized, or could be utilized, in preparing for Pan Flu and/or HPAI response, including:
• ESRI GIS tools: ArcIMS, ArcGIS, ArcPad, ArcMap, ArcSDE, ArcInfo, ArcView
• MapInfo
• Map Maker
• Map Window
• DeLorme Street Atlas
• Harvard Graphics
• Google Earth
This recommendation supports the Governor’s Executive Order 05-04 (Appendices Addendum, Section 4.0) to create an enterprise technology solution and is consistent with the 2004 Strategic Plan, “A Foundation for Coordinated GIS, Minnesota’s Spatial Data Infrastructure (MSDI).” Communications to agencies and respective programs should promote the use and value of GIS technologies as related to Pan Flu and HPAI planning and response. Ongoing attempts should be made to identify additional ways that GIS can be used to assist with emergency planning and response efforts.
Rationale –
Increased use of GIS in support of Pandemic Influenza response is consistent with Federal and International planning and response efforts. Stakeholder interviews revealed that there are a multitude of ways that GIS would be beneficial and can aid in Pan Flu

State of Minnesota GIS Pandemic Needs Analysis Report
September, 2007
49
and HPAI preparedness and response activities. Numerous GIS resources (human and software) exist within the agencies listed in the MEOP Supplement that could possibly be leveraged. This recommendation further supports the Governor’s vision for an enterprise approach for MSDI.
Known challenges –
Stakeholders cited the biggest barriers to increased utilization of GIS were limited staffing resources with GIS knowledge, limited financial resources, and programmatic priorities that did not include a GIS component. If buy-in is achieved from the various stakeholders, strategies will need to be implemented quickly to increase the likelihood that GIS could be utilized in a pandemic response, which could be as soon as the 2007-2008 influenza season.
Alternatives –
Organizations with existing GIS tools will continue to use the tools as they do presently.
Projected costs –
Costs to implement this recommendation will be directly related to staffing resources and GIS software and integration needs. Staff with GIS expertise appears to be inadequate at the Enterprise level. At minimum, this recommendation would include 2 FTE GIS experts to be housed at an appropriate agency for use across the Enterprise with Pan Flu and HPAI needs. This would also involve the purchase of appropriate software licenses or access to existing GIS software seats. Software needs will ultimately depend on the specific dependencies and priorities resulting from implementation of Recommendation #5.
Additional costs to procure and standardize geocoding capabilities will depend upon the current prevalence of such capacity among key data source agencies. Additionally, there may be substantial costs associated with converting and/or establishing standardized data layers that use common coordinate systems and conventions for geocoding locations, such as street geography and addresses, particularly for rural locations. The goal is to have all relevant local GIS data able to be layered without the concern that spatial attributes will not align or be registered correctly. The costs for achieving this capacity are dependant on the degree to which key data sources are discovered to use different registrations systems or conventions -- it is suggested that prioritization be given to aligning street networks and address-level data layers first. The GIS staff suggested above could also be assigned responsibility for ensuring that data is appropriately maintained and up to date.
Each agency key to Pandemic response should also strongly consider bolstering its internal GIS capabilities and workforce. In the case of the Department of Health, for example, such investments would not only support and sustain the Department's Pan Flu response activities but would also significantly advance ongoing day-to-day program area efforts such as child health, injury prevention, chronic disease, oral health and other health threats.

State of Minnesota GIS Pandemic Needs Analysis Report
September, 2007
50
Recommendation 2
Assign a “Champion” to drive and coordinate GIS Integration into Pan Flu and HPAI processes, including the attainment of stakeholder buy-in and plans for statewide rollout.
A key point person must be identified to oversee and coordinate the integration of GIS into Pan Flu and HPAI planning and response as stated in Recommendation #1 and work directly with the workgroup described in Recommendation #3. This Pan Flu/HPAI GIS “champion” would focus efforts on obtaining stakeholder buy-in, oversee requirements gathering (Recommendation #5), establish a plan for maximizing existing Enterprise GIS resources and prioritize efforts on critical functional areas. This point person should have both technical knowledge related to GIS and a good understanding of Pan Flu and HPAI response needs.
Increased use of GIS tools and the value of GIS use for Pan Flu and HPAI should be promoted through discussions, presentations and demonstrations; State, regional and local emergency drills/exercises; and annual influenza clinics.
Rationale –
Stakeholders reported that they are not aware of a single point of contact for Enterprise GIS. Because a pandemic is imminent and the timeline is unknown, this effort should be implemented as quickly as possible, which requires a central point of coordination and communication.
Known challenges –
It is unknown where this position would be housed, but it is recommended that this person reside with HSEM, LIMC or OET due to the technical nature and Enterprise initiatives. Roles and responsibilities would need to fit within the purview of the lead agency.
Alternatives –
Organizations with existing GIS tools will continue to use the tools as they do presently. Enterprise efforts would continue to evolve in accordance with the 2004 Strategic Plan for MSDI.
Projected costs –
Costs to implement this recommendation would require a .5 FTE until the basic foundation has been established (est. one year). Once the primary framework of staff resources, software, and exercises/drills is complete, this position could be reduced to .25 FTE.

State of Minnesota GIS Pandemic Needs Analysis Report
September, 2007
51
Recommendation 3
Establish a forum for agencies listed in the MEOP Supplement to coordinate resources and evaluate needs for education/training and exercises/drills as related to GIS use in Pan Flu and HPAI planning and response.
HSEM leadership coordinates a standing committee that brings all Pan Flu and HPAI response agencies, as listed in the MEOP Supplement, together for planning and logistics. Currently, however, no forum exists that specifically focuses on the application of GIS in Pan Flu and HPAI planning and response. Further, no forum exists for program level staff across agencies to come together.
Programs with some responsibility for Pan Flu and/or HPAI preparedness and response activities should have a similar forum established by HSEM at the agency level. This program level workgroup should include an executive level coordinator from HSEM and should create the opportunity for program staff to establish critical infrastructure and further promote and identify uses for GIS technology in support of Pan Flu and HPAI response activities. This forum would bring crucial program staff together to ensure that tools and resources, notably those related to GIS, are being leveraged appropriately in Pan Flu and HPAI response planning efforts.
It is recommended that the established workgroup meet on a quarterly basis, more often as needed/desired. Meeting content would generally revolve around Pan Flu and HPAI business needs and processes, particularly related to existing GIS resources and application of GIS technology to programmatic response staff. The forum would also allow for identification of additional educational and trainings needs. Further, this group should be responsible for creating and coordinating exercises or drills to test application of GIS in the periods before, during and after response. Eventually, this workgroup could also be expanded beyond Pan Flu and HPAI to focus on planning and responding to other public health emergencies and general response efforts.
Rationale –
Stakeholder interviews revealed that agencies and programs operate within silos, and information is not always communicated across all programs conducting emergency planning and response activities. As such, programs are often unaware of what other program requirements might be and what activities they may be coordinating. This was consistent for responses related to general practices as well as those related to GIS resources and application.
Known challenges –
This initiative would require a “top-down” directive to bring busy program staff to the table. Workgroup meetings would need to occur frequently enough to account for ongoing business needs. Interim communication mechanisms would need to be established for ongoing data sharing between agencies and among programs.

State of Minnesota GIS Pandemic Needs Analysis Report
September, 2007
52
Alternatives –
Current agency relationships will continue with intermittent “as needed” data sharing. Programs will maintain their own operations and focus on meeting individual grant/program requirements independent of other programs performing Pan Flu and HPAI planning and response activities.
Projected costs –
Costs to implement this recommendation would be directly related to staff time spent to participate and multiplied by the number of participants at 4-8 hours/year, plus any time spent planning for and participating in exercises/drills. In general, a tabletop exercise could cost approximately $50,000, and a functional exercise could cost $150,000 or more.
Recommendation 4
Focus GIS integration efforts in the following areas: 1) outbreak tracking, 2) inventory movement, 3) staffing resource management, and 4) enterprise integration of available datasets.
Several areas emerged as top priorities that would benefit from the use of GIS tools. The four priority areas listed below should be the primary focus of any efforts to integrate GIS technology into Pan Flu and HPAI response.
Outbreak tracking – ability to map morbidity and mortality thresholds to identify needs for increased resource allocation and impact on local facilities (Pan Flu); ability to track location and incidence of avian influenza in wild and domestic bird populations. Essential data layers are likely to include geo-referenced information on laboratory tests, case reports (human/animal), contact tracing, isolation and quarantine of persons or animals, community interventions to prevent spread (e.g., school closure, etc.).
Inventory movement – use of population data to drive inventory allocation decisions and distribution sites, use of outbreak tracking to drive reallocation of inventory resources, and use of maps to determine delivery routes. Essential data layers are likely to include immunization records (patients, providers, and first-responders), points-of-dispensing sites, Healthcare institutions, staging locations (e.g., food and home-care services to vulnerable populations), supply caches (medical, security, sanitation, public support services), and medical examiner and postmortem services (e.g., morgues, refrigerated trucks, disposition sites).
Staffing resource management – ability to map rates of absenteeism, reallocate staffing resources, and identify locations of alternate staffing resources (retirees and past State employees). Essential data layers are likely to include workforce location and attribute data (public health, security, veterinarian, information technology, food service, public works, Healthcare, EMS, etc.), population-based data (school attendance, key

State of Minnesota GIS Pandemic Needs Analysis Report
September, 2007
53
workplace absenteeism locations), volunteer registration and tracking, meeting and training sites, and communications centers.
Enterprise integration of available datasets – maximize existing datasets and leverage those datasets appropriately across agencies by utilizing a centralized, enterprise integration approach. Essential data layers are likely to include case reports, healthcare institutional censuses, medical therapeutics distributed, laboratory testing results, isolation and quarantine data, and the location and populations affected by various community-oriented interventions (e.g., school closures, restrictions on commerce and movement, etc.).
Note: Referenced data layers are detailed in Section 3.3.3.
For future consideration, additional focus areas were compiled to address GIS needs in the essential MEOP business functions listed in Section 3.2. These needs are detailed in Appendices Addendum, Section 17.0 but should be secondary to the four primary focal areas described above that have implications across numerous HPAI and Pan Flu business functions.
Rationale –
Several agencies serve critical functions across all phases of a pandemic as defined by WHO and established in the MEOP Supplement. These agencies track disease incidence and are responsible for coordinating human and medical resources during a response situation. In light of limited time and financial resources, the four areas listed above were assessed to be of greatest importance and to benefit most from use of new and existing GIS tools.
Known challenges –
Stakeholders cited the biggest barriers to increased utilization of GIS were limited staffing resources with GIS knowledge, limited financial resources and programmatic priorities that did not include a GIS component. If buy-in is achieved from the various stakeholders, strategies will need to be implemented quickly to increase the likelihood that GIS could be utilized in a pandemic response, which could be as soon as the 2007-2008 influenza season.
Alternatives –
Organizations with existing GIS tools will continue to use the tools as they do presently. GIS will not be formally integrated into HPAI and/or Pan Flu response.
Projected costs –
Costs to implement this recommendation will depend on resources required to create/access the data layers and outputs defined in Recommendation #5 and would

State of Minnesota GIS Pandemic Needs Analysis Report
September, 2007
54
likely fall within appropriate roles/responsibilities of staffing recommendations stated in Recommendation #1.
The greatest costs will likely be incurred with the enterprise integration of available datasets. Due to the lack of a centralized disease management system and the regionalized network that comprises MIIC, substantial integration challenges and costs ($100,000 - $200,000) are foreseeable. Due to the extent to which systems are distributed across State agencies (and relevant sub-jurisdictions), a feasibility study or pre-integration assessment may be considered (cost approximately $150,000).
Recommendation 5
Work with a Business Analyst to define which datasets and outputs are required/desired.
A Business Analyst should be hired to work with the primary agencies involved in Pan Flu and HPAI response to formalize the list of programmatic data layer needs and finalize GIS data output requirements to support the priorities detailed in Recommendation #4. Datasets outlined in Section 3.3.3 can serve as starting platform for this effort.
Rationale –
A Business Analyst can quickly and efficiently define stakeholder dataset and output needs and formalize a framework for use in the development and implementation phases.
Known challenges –
This recommendation necessitates an experienced Business Analyst and requires that all critical programmatic staff participate in the necessary requirements gathering phase.
Alternatives –
Utilize the workgroup defined in Recommendation #3 to define required datasets and outputs and utilize staffing recommendations in Recommendation #1 to execute the requirements.
Projected costs –
Costs to implement this recommendation include an experienced Business Analyst (likely contracted externally) to perform the requested task at a cost of approximately $75,000 (due to the number of State agencies and possible sub-jurisdictions involved). An internal Business Analyst could also be leveraged to perform the required task at a reduced cost but would require that the individual be available at 100% FTE for the duration of the analysis.

State of Minnesota GIS Pandemic Needs Analysis Report
September, 2007
55
5.0 Glossary of Acronyms
Acronyms used throughout this document are listed in Table 5-1 below.
Table 5-1: Glossary of Terms
ACRONYM DEFINITION
AG Attorney General
AHRQ Agency for Healthcare, Research, and Quality
COG Continuity of Government
COOP Continuity of Operations Plan
CRI Cities Readiness Initiative
DHHS Department of Health and Human Services
DHS Department of Human Services
DOA Department of Administration
DNR Department of Natural Resources
DPS Department of Public Safety
EA Enterprise Architecture
EOC Emergency Operations Centers
EOP Emergency Operations Program
EPRI Emergency Preparedness Resource Inventory
ETL Extraction, Transformation, and Loading – a data management technology
GDA Office of Geographic and Demographic Analysis at DOA
GIS Geographical Information Systems
HPAI Highly Pathogenic Avian Influenza
HSEM Homeland Security and Emergency Management
IT Information Technology
LMIC Land Management Information Center at GDA
MDH Minnesota Department of Health
MEOP Minnesota Emergency Operations Program

State of Minnesota GIS Pandemic Needs Analysis Report
September, 2007
56
ACRONYM DEFINITION
MGDC Minnesota Geographic Data Clearinghouse
Mn/DOT Minnesota Department of Transportation
MNSCU Minnesota State College and Universities
MNTrac Minnesota system for Tracking Resources, Alerts, and Communications
NIMS National Incident Management System
NREVSS National Respiratory and Enteric Virus Surveillance System
NYC New York City
OEP Office of Emergency Preparedness
PCA Pollution Control Agency
SEOC State Emergency Operations Center
SNS Strategic National Stockpile
SOS State Operated Services
STC Scientific Technologies Corporation
WHO World Health Organization

State of Minnesota GIS Pandemic Needs Analysis Report
September, 2007
57
6.0 Appendices
The Appendices are provided under separate cover in a separate document titled, “State of Minnesota GIS Pandemic Needs Analysis Report Appendices Addendum.