Embed Size (px)
Citation preview

State of Good Repair
Prioritization
May 2016
Jennifer Ahlin
2

State of Good Repair
Prioritization Process Schedule
Description Date
Prepare Draft Prioritization Process Internally 7/2015 to present
Provide Draft Prioritization Process to Local
Stakeholder Group for Feedback and Comment 3/25/2016
Provide Draft Prioritization Process to CTB 4/19/2016
CTB Action 6/14/2016
Prioritization Effective 7/1/2016
Continued Outreach on Approved Prioritization 7/1/2016
3

State of Good Repair Requirements
§33.2-369(B) and (C)
*More priority items are considered and explained later
Bottom of Structurally Deficient
Bridge Deck
Description Pavement Bridge
Purpose Reconstruction/Rehabilitation
(Deteriorated)
Reconstruction/Replacement
(Structurally Deficient)
System Interstate/Primary/Primary
Extensions
All Systems
(VDOT and Locally Maintained)
Priority
Consideration* Mileage, Condition, Costs Number, Condition, Costs
Distribution
All nine construction districts
Based on needs
Min 5.5% and Max 17.5% per year
Waivers
Key Project - extraordinary circumstances only – cap can be waived
20% - Secondary Pavements
(if VDOT secondary target not met) N/A
4

State of Good Repair Definition
VDOT’s Internal
Bottom of Structurally Deficient
Bridge Deck
Tests Pavement Bridge
1 Improves to fair or better status Removes from structurally deficient
status
2
Meets definition of pavement
rehabilitation and reconstruction in
Federal Highway Administration’s
memo dated 9/12/2005 (see link
below)
Meets definition of bridge
rehabilitation and replacement in
Federal Highway Administration’s
Bridge Preservation Guide dated
August 2011 (see link below)
3 Adds or restores strength
FHWA Memo
Links
FHWA’s Memo – September 12, 2005 -
Pavement Preservation Definitions
FHWA's Memo - February 25, 2016 - Pavement
Preservation
FHWA’s Bridge Preservation Guide – August 2011
– Maintaining a State of Good Repair Using Cost
Effective Investment Strategies
For a project to receive State of Good Repair funds, all three tests need to be met
5
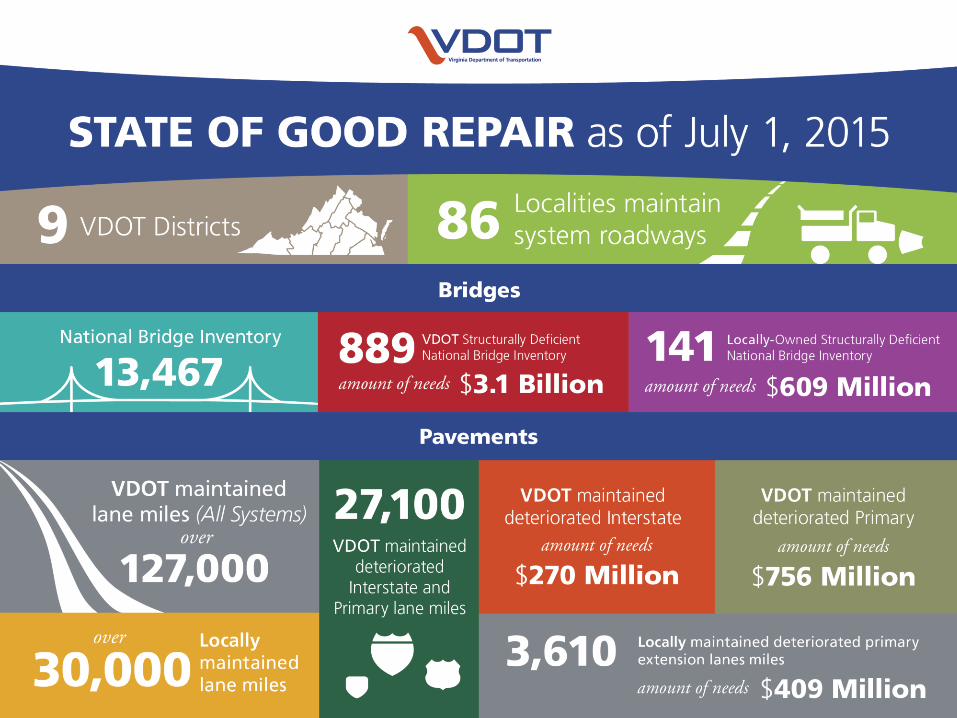
State of Good Repair – Prioritization
Requirement Statute
Reference Pavement Bridge
Implementation
Date
Chapter 684
Enactment 2 July 1, 2016
State Statute §33.2-369(B)
Mileage Number
Condition Condition
Cost Cost
Federal Statute MAP-21/FAST
ACT Asset Management Plan
VDOT Practice
Traffic
Volumes
Importance to
Users
Condition Structure Capacity
6

State of Good Repair
Needs Based Funding Distribution
Total Needs (Bridge/
Pavement)
Bridge Needs
County Network
Locality
Pavement Needs
County Network
Locality
No Urban Local/Collector Road
Needs Used
No Local Non-National Bridge Inventory Needs
Used
Secondary Needs (reduction) - VDOT managed
Non-National Bridge Inventory Needs
(reduction) - VDOT managed
Deteriorated Pavements Needs
Non-deteriorated Pavements Needs
Structurally Deficient Bridges Needs
Non-structurally Deficient Bridges Needs
State of Good Repair Needs
7

State of Good Repair
Needs Based Funding Distribution
Total Needs (Bridge/
Pavement)
Bridge Needs
County Network
Locality
Pavement Needs
County Network
Locality
No Urban Local/Collector Road
Needs Used
No Local Non-National Bridge Inventory Needs
Used
Secondary Needs (reduction) - VDOT managed
Non-National Bridge Inventory Needs
(reduction) - VDOT managed
Deteriorated Pavements Needs
Non-deteriorated Pavements Needs
Structurally Deficient Bridges Needs
Non-structurally Deficient Bridges Needs
State of Good Repair Needs
8

Bristol District SGR
Funds
Salem District SGR
Funds
Lynchburg District SGR
Funds
Richmond District SGR
Funds
Hampton Roads District SGR
Funds
Fredericksburg District SGR
Funds
Northern VA District SGR
Funds
Staunton District SGR
Funds
Culpeper District SGR
Funds
Statewide
SGR Funds
District “X” SGR Funds
Statewide Funding Distribution
Typical District Funding Distribution
VDOT Pavement SGR Funds
Locality Bridges SGR Funds
Locality Pavement
SGR Funds
VDOT Bridges
SGR Funds
State of Good Repair - Needs Based Funding Distribution
9

Pavement Prioritization
• Data Used
• Pavement Distresses and Roughness
• Average Annual Daily Traffic, Truck Traffic
Volume
• Strength of Pavement Layers and
Subgrade
• Last Maintenance Type and History
• Distribution based on costs
• Eligible lane miles will be determined based on
needs through a multi-constraint optimization
process
• Decision matrices are used to generate
recommended treatments
• VDOT - publish target lane miles by district and
system
• Localities – similar to primary extension process
• November 2016, §33.2-232 – Annual Report item
5 requires a prioritized list of needs for
pavement and bridges.
10
Bridge Prioritization
11
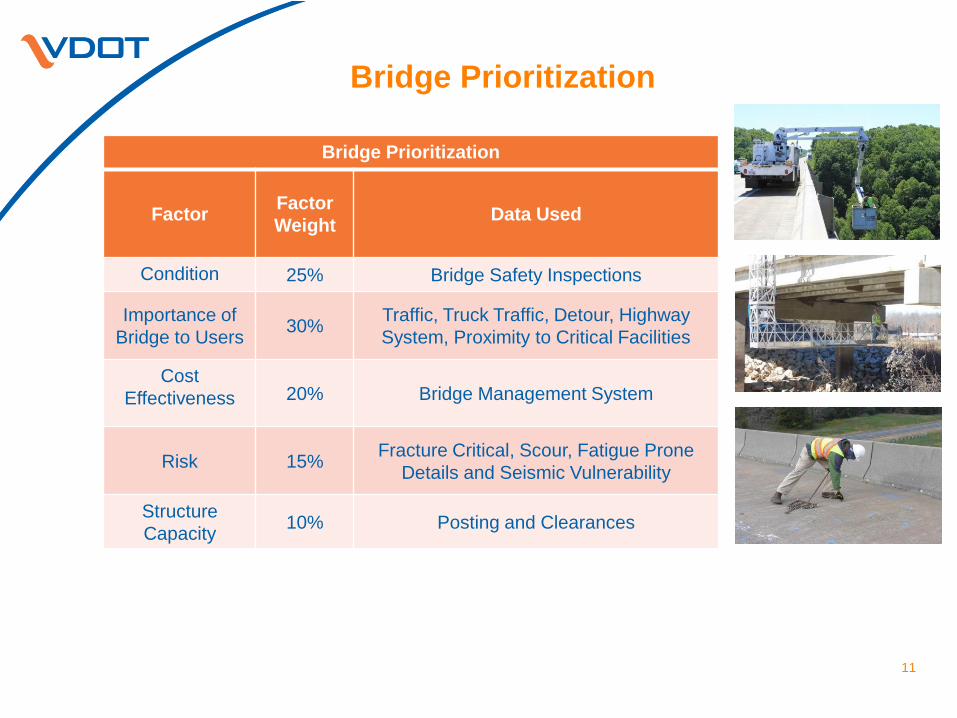
Bridge Prioritization
Factor Factor
Weight Data Used
Condition 25% Bridge Safety Inspections
Importance of
Bridge to Users 30%
Traffic, Truck Traffic, Detour, Highway
System, Proximity to Critical Facilities
Cost
Effectiveness 20% Bridge Management System
Risk 15% Fracture Critical, Scour, Fatigue Prone
Details and Seismic Vulnerability
Structure
Capacity 10% Posting and Clearances

Prioritization Process – How Does It Work?
• Pavements
• VDOT - Lane Miles
• Localities – similar to primary extension process
• Bridges
• Two prioritized lists per district for structurally deficient bridges
• VDOT
• Locality
• May skip structures in list? Why?
• Lots of reasons
• Examples
• Cost of work
• 1st ranked - $2B
• 2nd ranked - $20M
• Economy of Scale
• Maybe the contract prices are better for two structures such as 1st
rank structure and 6th rank structure are cheaper to contract together
• Maintenance of Traffic
• Interstate 95 bridges
• Deficiency addressed with maintenance funds or other funds
12

State of Good Repair
Proposed Process
13
Funding
• Needs Based
• VDOT Pavements
• Local Primary Extensions
• VDOT Bridges
• Local Bridges
Prioritization
• Deteriorated Pavements
• Structurally Deficient Bridges
• Must follow VDOT Best Practices
Ranking
• Location
• Treatment
• Estimate
• Fund Request
Selection
• Condition
• Traffic Volume
• On National Highway System

State of Good Repair – Preliminary
Percentage by District
14
District
FY 2017
(Based on
previously
proposed
distribution)
VDOT Localities
Pavement Bridge Total Pavement Bridge Total
Bristol 11.7% 21% 64% 85% 2% 13% 15%
Culpeper 6.0% 25% 45% 70% 3% 27% 30%
Fredericksburg 12.1% 18% 77% 95% 2% 3% 5%
Hampton
Roads 14.8% 7% 38% 45% 25% 30% 55%
Lynchburg 7.6% 29% 63% 92% 5% 3% 8%
Northern
Virginia 10.6% 27% 61% 88% 11% 1% 12%
Richmond 17.4% 25% 65% 90% 4% 6% 10%
Salem 12.1% 21% 67% 88% 3% 9% 12%
Staunton 7.9% 13% 76% 89% 4% 7% 11%

State of Good Repair – Scoring Process –
Pavement (Locality)
• Applications accepted along with the Primary Extension Paving
Program
• Accept applications on an annual basis to support pavement overlay,
rehabilitation, or reconstruction projects
• Maximum request of $1M per locality, per year
• Roadway must have Critical Condition Index rating of 60 or less
• Projects must be advertised within 6 months of allocation. Projects that are
selected and do not meet this criteria may be subject to deallocation.
• Maintenance of Effort Certification – funding supplements, not replaces, the
current level of funding/level of effort on the part of the locality
• Prioritize projects for funding based on technical score that considers
pavement condition, traffic volume, and prior expenditures
• Pavement Condition (CCI) – 45%
• On the National Highway System (NHS) – 10%
• Traffic Volume – 30%
• Prior Expenditures – 15%
• Requires regular collection of pavement condition data on the locally
maintained primary extensions. 15

State of Good Repair – Scoring Process
Bridges (Localities)
• Annual basis for selection of bridge rehabilitation, or reconstruction
projects
• Bridge must be structurally deficient
• National Bridge Inventory Only
• Proposed work must take bridge out of structurally deficient status
• Localities must be current on bridge inspections
• Projects receiving funding under this program must initiate the Preliminary
Engineering or the Construction Phase within 24 months of award of funding
or become subject to deallocation
• Selection of projects for funding considers bridge prioritization and
cost effectiveness
16

Locality Bridge Ranking Example
17
State of Good Repair - Locality Bridge Ranking Example
Bridge #
Variables System-Level Values Final Values After Scoring
0.30 0.25 0.15 0.10 0.20
Initial Score
Initial Rank
System Level Recommended
Scope
Estimate for Recommended Scope
Estimated Total
Replacement Cost
Funding Request
0.20
Final Scope Final Score
Final Rank IF CF RF SCF CEF
Cost-Effective
ness Factor
18399 0.99 0.82 0.10 0.85 0.00 0.60 1 Replace Superstructure
$6,675,231 $13,014,024 $5,526,000 0.45 Replace Superstructure 0.69 1
16020 0.95 0.90 0.10 0.55 0.00 0.58 2 Major Rehabilitation
$1,652,651 $15,034,241 $13,542,000 0.00 Bridge Replacement w/o Added Capacity
0.58 6
2466 0.95 0.98 0.00 0.29 0.00 0.56 3 Rehabilitate Culvert
$378,938 $769,496 $769,496 0.00 Replace Culvert 0.56 7
17087 0.77 0.83 0.00 0.36 0.00 0.47 4 Replace Superstructure
$308,190 $1,040,226 $312,524 0.70 Replace Superstructure 0.61 4
5275 0.87 0.54 0.00 0.64 0.00 0.46 5 Replace Superstructure
$257,366 $924,388 $423,888 0.38 Replace Superstructure 0.54 8
8204 0.85 0.82 0.00 0.00 0.00 0.46 6 Major Rehabilitation
$280,579 $3,435,758 $3,435,758 0.00 Bridge Replacement w/o Added Capacity
0.46 10
18419 0.98 0.60 0.10 0.00 0.00 0.46 7 Replace Deck $1,949,697 $8,663,145 $2,056,240 0.83 Replace Deck 0.62 3
16384 0.30 0.97 0.75 0.00 0.00 0.45 8 Major Rehabilitation
$67,619 $837,123 $112,000 1.00 Major Rehabilitation 0.65 2
18724 0.89 0.55 0.00 0.19 0.00 0.42 9 Replace Bridge $4,957,098 $4,957,098 $4,957,098 0.00 Bridge Rehab w/o Added Capacity
0.42 11
2439 0.79 0.48 0.00 0.59 0.00 0.42 10 Replace Bridge $2,179,301 $2,179,301 $2,179,301 0.00 Bridge Replacement w/o Added Capacity
0.42 12
10335 0.60 0.70 0.00 0.52 0.00 0.41 11 Replace Bridge $335,158 $335,158 $123,248 0.56 Replace Superstructure 0.52 9
17878 0.52 0.98 0.00 0.00 0.00 0.40 12 Major Repair $363,855 $3,678,246 $429,036 1.00 Repair and Preserve Structure 0.60 5

State of Good Repair
Prioritization
April 19, 2016
Garrett Moore
Chief Engineer