Embed Size (px)
Citation preview

State Estimation at All India Level
Akhil Singhal Harish Kumar Rathour P.K. Agarwal KVS Baba S.K. Soonee Deputy Manager Chief Manager General Manager Executive Director Chief Executive Officer
POWER SYSTEM OPERATION CORPORATION LIMITED, NEW DELHI, INDIA
1 of 6
Abstract — Indian power system is one of the largest synchronously operated Power System Networks in the world. It has an installed capacity of about 303 GW. Indian power system has complex transmission network along with many cross border connections. It is monitored by a multi-level integrated Supervisory Control & Data Acquisition (SCADA)/ Energy Management System (EMS) installed at many control centres dispersed all over India. SCADA/EMS of National control centre is integrated with SCADA/EMS systems of five Regional control centres. SCADA/EMS systems of Regional control centres in turn are integrated with SCADA/EMS systems of 32 State control centres. It is important to use all real-time tools to help the operator in maintaining the grid in a highly secure and reliable manner. Successful implementation of State Estimator is said to be critical requirement for efficient EMS. An exercise was taken up by Power System Operation Corporation Limited (POSOCO) with an objective of improving the usage of State Estimation in Load Despatch Centres in India. In this process, it has been interacting with experts both in India and abroad with the objective of learning and making continuous improvement. Successful running of State Estimation at All India level involves maintaining and tuning of a large SCADA and Network database. Such a big database needs correction in topology, device parameters, connectivity model, etc. This paper focusses on all such related issues, its solution and impact on State Estimator output.
Keywords – Supervisory Control and Data Acquisition (SCADA), National Load Despatch Center (NLDC), Energy Management System (EMS), State Estimator (SE), Power Network Applications (PNA).
I. Introduction
State Estimation was introduced by Gauss and Legendre (around 1800). The basic idea was to “fine tune” State Variables (Voltage and Angle at each bus) by minimizing the sum of the residual squares. This is the well-known Least Squares (LS) method. The reason for its popularity is easy to understand: At the time of its invention there were no computers, and the fact that the Least Squares estimator could be computed explicitly from the data made it the only feasible approach. State Estimation was applied to Power Systems by Schweppe and Wildes in the late 1960s in a real-time environment.
The basic equations involved are –
[z] = H[x] + e f = Σ Wj.ej2 (j=1 to n)
Where, z is the vector of measured state variables. H is measurement function coefficient matrix. x is the vector of estimated state variables. e is the error. Wj is the weight assigned to error ej.
n is the number of measurements. It is the function ‘f’ which is minimized using Weighted Least Square algorithm.
State Variables: Voltage and Angle at each node (refer fig.1) are the state variables. By estimating these two parameters, we can calculate line flows, injection, drawls, etc.
Fig.1: Common Bus diagram showing state variables
Real Power, P = V1*V2*sin(θ1- θ2) ------------------------- XL
Reactive Power, Q = V1 2 – V1V2 cos(θ1- θ2) -------------------------------- XL
II. Use of State Estimation in Energy Management System at Load Despatch Centres
Energy Management System (EMS) is the mechanism to capture “system knowledge” and “situational awareness” and provide some key indicators to help the Load Despatcher in real-time decision making. EMS tools are essential for reliable and secure operation of the grid.
EMS applications can be divided into two parts –
a) Network Applications which includes fault analysis, contingency analysis, Powerflow, optimal powerflow, Data Validation (by State Estimation), etc.
b) Generation Applications which includes Unit commitment/scheduling, Reserve/Cost monitoring, Economic Despatch, etc.
Energy Management System (EMS) has a system of computer-aided tools used by operators of electric utility grids to monitor, control and optimize the performance of the generation and/or transmission system. The monitor and control functions are known as SCADA. This computer technology is also referred to as SCADA/EMS or EMS/SCADA. The terminology EMS then excludes the monitoring and control functions, but more specifically refers to the collective suite of Power Network Applications (PNA) and to the generation control and scheduling applications.
In Load Despatch Centre at National level, thousands of analog and digital data are acquired in real-time which may also contain some incorrect data or some data might not be getting telemetered due to various reasons such as faulty RTU, faulty transducers, poor state of potential-free NO/NC contacts in switching devices, communication failure, etc.
Fig.2: Non-availability of Analog data due to various reasons

2 of 6
State Estimation provides an estimated value of measurands for all correctly telemetered/non-telemetered/incorrect data and hence acts as a cross-check reference helping in Bad Data detection.
Output of the State Estimator provides Voltage Magnitude and Angle at each bus and hence gives a base-case for all the Network Applications and some of the generation applications to carry out various studies in order to help grid operator in real-time operation.
Fig.3: Base case generation from State Estimation process
III. Corrections Done to Improve State Estimator Solution
1. Network Truncation
The Network Model at NLDC is vast consisting of more than 1800 sub-stations. Updating and maintaining (or tuning) such a large network model for State Estimation is very difficult. In order to focus on the main network and considering only on the major portion (say 400kV level and above) Network Truncation is done.
(a) Network before truncation
(b) Network after truncation
Fig.4: Truncation of network at 400kV and above voltage level at NLDC
While carrying out network truncation; the external model is ignored and a Load/Injection is modeled at the point of truncation with the real-time MW and MVAR data of the mapped to it.
Fig.5: Display at NLDC to facilitate truncation of network at 400kV
and above level
2. Network Parameters
State Estimation requires correct model parameters of the network. Incorrect parameters of various power system equipments impact the State Estimator output.
2.1 Correction in Line Parameters
Incorrect line parameters cause change in impedance of paths, hence different flows (MW and MVAR) than actual, and change in the estimated angles at the station buses. Many cases of incorrect parameters were observed and rectified. An example is shown in Fig.6.
Fig.6: Impact of different line length on SE output
2.2 Correction in ICT Parameters
In transformers the tap changer types and winding parameters were corrected at many places in database. ICT parameters include Series Resistance, Series Reactance, Tap Changer details (number of taps and step size), Nominal voltage of HV and LV side, placement of Tap changer (HV or LV side), etc. For number of ICTs in database, it was found that the Step size was incorrect (in magnitude or sign) and also Tap changer was placed at both HV and LV side, which is not as per the field equipment. Generally, Tap changer is put on HV side of transformer. Further, Resistance and Reactance were also corrected for many ICTs as per its MVA ratings and design.
It was found that in some stations all the ICTs are not of the same MVA rating and hence possess different impedance

3 of 6
and different MW flow. In all such cases the parameters of ICTs were changed accordingly.
2.3 Correction in Generating Unit Parameters
In the Network database, the Generating Units need to be properly defined with number of parameters such as Maximum/Minimum MW capacity, Maximum/Minimum MVAR capacity, MVA rating, etc. The generating unit parameters were taken from the Annual Compendium Booklet of POSOCO and updated in database.
All these parameters impact the State Estimator Output considerably. An example is shown in Fig.7.
Fig.7: Impact of incorrect Maximum/Minimum MW limits on SE output
3. Incorrect Mapping of switching devices between NLDC and RLDCs
In order to exchange data between two systems with different naming convention in ICCP, it is required that ICCP mapping shall be done at either of the ends. In case of incorrect ICCP mapping the topology of the system as changed on the site is not exactly replicated at NLDC. An example is shown in Fig.8.
Fig.8: Incorrect mapping of switching device at NLDC
4. Topology Correction
The first step executed by almost all the State Estimator applications worldwide is Topology Processing. Topology Processor extracts the line-energised network out of the total
network based on position of switching devices (i.e. Circuit Breakers and Isolators). If the output of topology processor deviates from the actual scenario at the site (due to incorrect/unavailable status) then output of SE application would also not of much use and many-a-times would not give a converged solution.
Fig.9: Impact of incorrect topology on SE output
First step taken towards Topology Correction is “Auto Replacement” of CB/Isolator positions to “CLOSED” using a script provided by vendor. Under this approach all switching devices which have “Suspect”, “Between” or “Garbage” status are replaced as “CLOSED” in Network data (real-time SCADA displays remain unaffected).
(a) Network before topology correction
(b) Network after topology correction
Fig.10: Topology Correction approach
Switching devices with “Suspect” quality status leads to point of conflict as it is not possible to make out whether the associated line is charged or under outage/tripping.
Status of switching devices with “Suspect” quality can be replaced as CLOSED for State Estimator application.
4 of 6
Another approach is to keep the last good value. Different vendors may have different approached to handle this. Whatever approach is chosen one has to look at such device status & validate them and get the telemetry issue fixed. Fig.11 further elaborates this approach of correcting the status information.
Fig.11: Topology correction
The status of switching devices with “Good” Quality remains unchanged.
5. Topology Estimation
Topology estimation checks could be performed on network to find ambiguity with respect to the line flows and status of the corresponding switching devices. Coherency warnings generated could be used to tune the network. The threshold for analog data for generating Coherency Warning is kept as 50 MW.
The drawback of topology estimation checks in NLDC system is that is does not consider the entire connectivity of the equipment to the bus. It only checks the coherency with the switching device (say Line Isolator) directly connected with the equipment.
Fig.12: Topology Estimation with coherency warnings at NLDC
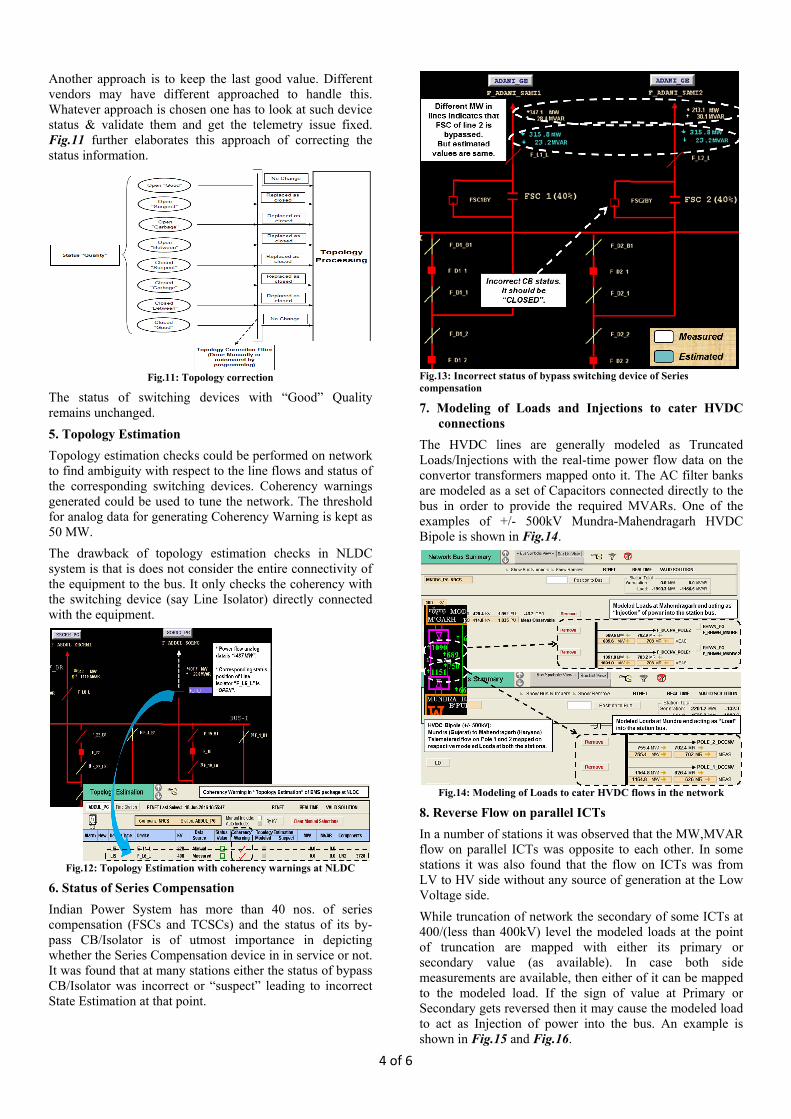
6. Status of Series Compensation
Indian Power System has more than 40 nos. of series compensation (FSCs and TCSCs) and the status of its by-pass CB/Isolator is of utmost importance in depicting whether the Series Compensation device in in service or not. It was found that at many stations either the status of bypass CB/Isolator was incorrect or “suspect” leading to incorrect State Estimation at that point.
Fig.13: Incorrect status of bypass switching device of Series compensation
7. Modeling of Loads and Injections to cater HVDC connections
The HVDC lines are generally modeled as Truncated Loads/Injections with the real-time power flow data on the convertor transformers mapped onto it. The AC filter banks are modeled as a set of Capacitors connected directly to the bus in order to provide the required MVARs. One of the examples of +/- 500kV Mundra-Mahendragarh HVDC Bipole is shown in Fig.14.
Fig.14: Modeling of Loads to cater HVDC flows in the network
8. Reverse Flow on parallel ICTs
In a number of stations it was observed that the MW,MVAR flow on parallel ICTs was opposite to each other. In some stations it was also found that the flow on ICTs was from LV to HV side without any source of generation at the Low Voltage side.
While truncation of network the secondary of some ICTs at 400/(less than 400kV) level the modeled loads at the point of truncation are mapped with either its primary or secondary value (as available). In case both side measurements are available, then either of it can be mapped to the modeled load. If the sign of value at Primary or Secondary gets reversed then it may cause the modeled load to act as Injection of power into the bus. An example is shown in Fig.15 and Fig.16.

5 of 6
Fig.15: Impact of Reverse flow in parallel ICT on SE at NLDC in case of truncation at that point
It can be resolved temporarily (until data sign is corrected from site) by changing the “FLIP” flag associated with the Analog as “TRUE”. By doing this the incorrect value (in sign) will be reversed before getting transferred to SE application.
As per the sign convention of ICT related data in Load Despatch Centres, different philosophy for measuring transformer data is followed in different Regions. In Northern Region, when, power flows from HV side to LV side analog measurement is taken as Positive whether it is measured on HV side or LV side. Whereas, in other regions the flow directions are positive when the power flows from bus into the transformer. Hence the association of “FLIP” flag with modelled loads shall be as per Table 1.
Table 1: Association of “FLIP” flag at NLDC with measurements on ICTs mapped on loads at points of truncation
Fig.16: Impact of measurement mapping at modeled loads from Primary and Secondary end (including case of sign reversal)
9. Inserting calculated values on non-measured loads
Some of the State Estimation Algorithms do not try to change the MW and MVAR corresponding to loads. It either uses the real-time data-telemetry assigned to it or a Pseudo measurement taken from Load Scheduling (or any other source). If a Pseudo measurement is used then it has a high uncertainty level. In order to improve the State Estimator
solution the value of Load can be calculated online and inserted into the measurement of truncated loads. The most common way to calculate the Loads is by Bus Summation and equating the same to Zero.
Fig.17: Inserting calculated values on non-measured loads
10. Modeling of Equivalent Generator in special cases
In many cases it was observed that the status of switching devices associated with Units was “suspect” leading to problem in topology Estimation whether to include the unit in SE process or not. In order to cater it, an equivalent generator was modeled and the sum of individual units was mapped to it. The equivalent generator always remains in-service and generates as per the “sum of all individual units”. An example is shown in Fig.18.
Fig.18: Modeling of equivalent generator
11. Tap Position of Transformers
At many sub-stations the Tap position of the ICTs is not available with “good” quality. As the OLTC of transformers is not frequently changed, it is manually replaced by Conforming its position from the field level. An example is given in Fig.19.
Fig.19: Unavailability of OLTC of ICTs
12. Re-initialising the parameters of State Estimation
The state estimation application has various parameters which need to be initiated after certain conditions are met every time it runs. In a large power system network, it is

6 of 6
many-a-times required to re-set it after certain defined number of run-times.
13. Threshold of Solution cost and other parameters
Many a times it is observed that the voltage and angle convergence is achieved while referring the analysis report, but the Solution is declared as Invalid. Generally, it is due to high cost of the solution exceeding the threshold limit as defined for it. Either the threshold limit of Solution Cost is increased temporarily or further tuning is done to handle such problems.
Fig.20: Threshold of Solution Cost in SE Application at NLDC
14. Unexpected connectivity changes at the site level
Due to various construction related problems (like Right of Way i.e. RoW, Contractual issues, material management issues, labour issues, modification in transmission planning, etc.) the line and bay connectivity changes either temporarily or permanently. It is many-a-times not known to the operator and when informed requires corresponding modeling change in SCADA and Network database.
It is also observed that many lines are modelled in database but do not get commissioned on site due to delay in construction. Such lines are set to “manually remove” from Network Database.
Fig.21: Re-arrangement of connectivity at the site level
An example of temporary re-arrangement is shown in Fig.21. In was observed that certain sections of few 400kV lines were not complete and hence re-arrangement as shown in Fig.21 above was done on temporary basis to facilitate early use of assets by the utilities. To compensate it, re-modeling of lines was done in database at NLDC. Moreover, two circuits of 765kV level were not
commissioned in time. So these circuits were set to “manually removed” from Network.
Fig.22: Parallel connection of ICT in same bay
In a special case at Mandaula substation as shown in Fig.22 it was found that the spare 400/220kV ICT was connected in parallel with ICT-1 in the same bay in order to meet the high load in Delhi during Commonwealth Games 2010 and High Summer Peak Load in 2015. In all such cases the parameters of ICTs must be put accordingly.
IV. Solution Quality of SE
After continuous correction of database parameters, connectivity model, topology errors and rectifying the bad-data by getting it corrected from the field, the cost of SE solution decreased significantly.
Fig.23: Reduction in SE Solution cost
V. Conclusion
Bad data and Incorrect Network Model Database severely affects the output of State Estimator and it needs to be corrected and maintained with utmost importance. As Topology formation is an initial and critical part of SE application but due to various reasons its telemetry is not correctly available from site. Efforts shall be made by the State and Central Utilities to provide the correct status of the switching devices by rectifying the related issues at site. Topology Estimation shall provide feature of auto-detecting the incorrect status of switching device on the basis of comparing the status with corresponding device MW flow and simultaneously correcting it. After all the efforts in tuning SE, it was found that Cost of State Estimator Solution decreased and a better converged solution was obtained from State Estimator Application at NLDC.
ACKNOWLEDGEMENT
Authors are grateful to the POWERGRID and POSOCO management along with all the load despatchers for their support and encouragement for continual improvement in quality of measurements and running of State Estimator.
REFERENCES
[1] Power generation, operation and control, Allen J. Wood and Bruce F. Wollenberg, Second edition, 1996.
[2] Power System State estimation – Theory and Implementation, Ali Abur and Antonio Gomez Exposito, 2004 edition.