Embed Size (px)
Citation preview

MAKING RESEARCH RELEVANT
AMERICAN INSTITUTES FOR RESEARCH® | AIR.ORG
Standards for the Economic Evaluation of Educational and Social Programs APRIL 2021
Cost Analysis Standards Project


Standards for the Economic Evaluation of Educational and Social Programs APRIL 2021
Cost Analysis Standards Project
1400 Crystal Drive, 10th Floor Arlington, VA 22202-3289 202.403.5000
www.air.org
Notice of Trademark: “American Institutes for Research” and “AIR” are registered trademarks. All other brand, product, or company names are trademarks or registered trademarks of their respective owners.
This work is licensed under a Creative Commons Attribution-NonCommercial 4.0 (CC BY-NC 4.0) International License. Permission is not required from AIR to copy and redistribute in any medium or format or to adapt the material for any noncommercial purpose as long as proper attribution is provided.


Standards for the Economic Evaluation of Educational and Social Programs
AMERICAN INSTITUTES FOR RESEARCH® | AIR.ORG iii
Contents Page
Acknowledgments............................................................................................................................ v
Introduction .................................................................................................................................... 1
Intended Audiences and Use of the Document ......................................................................... 1
Structure of This Document ........................................................................................................ 2
Economic Evaluation ................................................................................................................... 3
Chapter 1: Understanding Costs ..................................................................................................... 6
New Programs Without Preexisting Services ............................................................................. 7
Supplementary (or “Add-On”) Programs .................................................................................... 7
Partially Substituting Programs .................................................................................................. 9
Fully Substituting Programs ...................................................................................................... 10
Chapter 2: Cost Analysis Standards .............................................................................................. 12
Introduction to Cost Analysis Standards................................................................................... 12
Evaluation Design: Cost Analysis .............................................................................................. 13
Data Collection: Cost Analysis ................................................................................................... 17
Analyzing the Data: Cost Analysis ............................................................................................. 24
Reporting the Results: Cost Analysis ........................................................................................ 32
Chapter 3: Cost-Effectiveness Analysis Standards ........................................................................ 36
Introduction to Cost-Effectiveness Analysis Standards ............................................................ 36
Evaluation Design: Cost-Effectiveness Analysis ........................................................................ 36
Data Collection: Cost-Effectiveness Analysis ............................................................................ 39
Analyzing the Data: Cost-Effectiveness Analysis ...................................................................... 42
Reporting the Results: Cost-Effectiveness Analysis .................................................................. 45
Chapter 4: Cost-Benefit Analysis Standards ................................................................................. 50
Introduction to Cost-Benefit Analysis Standards ...................................................................... 50
Evaluation Design: Cost-Benefit Analysis ................................................................................. 51
Data Collection: Cost-Benefit Analysis ...................................................................................... 54
Analyzing the Data: Cost-Benefit Analysis ................................................................................ 56
Reporting the Results: Cost-Benefit Analysis ........................................................................... 61
References .................................................................................................................................... 64
Appendix A. Standards Checklist .................................................................................................. 73
Appendix B. Glossary .................................................................................................................... 82
Appendix C. Standards Creation Process ...................................................................................... 90

Standards for the Economic Evaluation of Educational and Social Programs
AMERICAN INSTITUTES FOR RESEARCH® | AIR.ORG iv
Exhibits Page
Exhibit I.1. Research Phases for Economic Evaluations .................................................................. 2
Exhibit I.2. Information Required to Conduct CA, CEA, and CBA ................................................... 4
Exhibit I.3. CASP Recommended Reference Case Parameters ....................................................... 5
Exhibit 1.1. Incremental, Total, and Gross Costs When Considering a Single Supplementary Program With BAU as the Control Condition ........................................................ 8
Exhibit 1.2. Incremental and Total Costs When Considering Two Alternative Programs That Supplement Underlying Programming (BAU) ......................................................................... 9
Exhibit 1.3. Incremental and Total Costs When Considering an Alternative Program That Partially Substitutes Underlying Programming ............................................................................. 10
Exhibit 1.4. Incremental and Total Costs When Considering Two Alternative Programs, Each of Which Fully Replaces Underlying Programming .............................................................. 11
Exhibit 2.1. Checklist for Elements To Be Included in an Economic Evaluation Plan and Report ........................................................................................................................................... 14
Exhibit 2.2. Resource Details to Document in the Ingredients Template .................................... 20
Exhibit 2.3. Possible Methods for Determining or Assigning Partial Value for a Shared Resource........................................................................................................................................ 21
Exhibit 2.4. Checklist of Cost Metrics to Calculate and Report .................................................... 30
Exhibit 2.5. Cost Data and Analysis Information to Include in Reporting Spreadsheet ............... 33
Exhibit 3.1. Checklist for Reporting in a Comparative Cost-Effectiveness Analysis ..................... 49
Exhibit 4.1. Checklist for reporting in a cost-benefit analysis ...................................................... 63
Exhibit C.1. CASP Panel Working Group Members ....................................................................... 92
Exhibit C.2. Considerations for Drafting, Reviewing, and Discussing Draft Standards ................. 93
Exhibit C.3. Summary of CASP Panel Timeline .............................................................................. 94

Standards for the Economic Evaluation of Educational and Social Programs
AMERICAN INSTITUTES FOR RESEARCH® | AIR.ORG v
Acknowledgments
This effort was made possible through funding provided by the American Institutes for
Research and was led by panelists Brooks Bowden (University of Pennsylvania), Fiona Hollands
(Teachers College, Columbia University), and Jesse Levin with project management by Amanda
Danks (both from American Institutes for Research). We appreciate the invaluable input from
the following invited panelists and reviewers, along with helpful guidance from Allen Ruby (U.S.
Department of Education Institute of Education Sciences):
Panelists
Clive Belfield, Queens College, City University of New York
Jay G. Chambers, American Institutes for Research
Max Crowley, Pennsylvania State University
David Greenberg, University of Maryland, Baltimore County
Henry Levin, Teachers College, Columbia University
Lynn Karoly, RAND Corporation
Tammy Kolbe, University of Vermont
AnnaMaria McCutcheon, Mathematica
Patrick J. McEwan, Wellesley College
Robert Shand, American University
Louisa Treskon, MDRC
Caitlin Tulloch, International Rescue Committee
Reviewers
Katie Dahlke, American Institutes for Research
David Knight, University of Washington
Rebecca Maynard, University of Pennsylvania
Aidan Vining, Simon Fraser University
Suggested citation: Cost Analysis Standards Project. (2021). Standards for the economic
evaluation of educational and social programs. American Institutes for Research.

Standards for the Economic Evaluation of Educational and Social Programs
AMERICAN INSTITUTES FOR RESEARCH® | AIR.ORG vi

Standards for the Economic Evaluation of Educational and Social Programs
AMERICAN INSTITUTES FOR RESEARCH® | AIR.ORG 1
Introduction
To make well-informed choices about the policies and programs that impact people’s lives,
decision makers need accurate, reliable, and actionable information. A crucial piece of that
information is the effectiveness of a program at improving intended outcomes. However,
without information on the costs associated with program effectiveness, decision makers lack
the evidence needed to optimize the use of limited resources to improve outcomes (Levin,
2009). To advance the production of high-quality information on the economic costs and
benefits of implementing educational and other social programs, the American Institutes for
Research (AIR) convened a panel of experts in designing and conducting economic evaluations
of educational and social programs to develop the Standards for Economic Evaluation of
Educational and Social Programs contained in this document. The intent of the standards is to
make clear for researchers, funders, and consumers of research (both policymakers and
practitioners) what constitutes rigorous economic evaluations of educational and social
programs.1 This document includes standards for cost analysis (CA), cost-effectiveness analysis
(CEA), and cost-benefit analysis (CBA). To increase the quality of information for decision
makers, the expert panel set out to accomplish the following goals:
• Provide guidance to researchers on the elements of a rigorous economic evaluation as they
design and conduct program evaluations.
• Direct researchers toward consistent practices that promote transparency and
comparability across economic evaluations.
• Develop standards that reviewers and consumers of research can use to evaluate economic
evaluations, including research proposals, study plans, and reported results.
Intended Audiences and Use of the Document The primary audience for these standards is researchers designing and conducting economic
evaluations of educational and social policies and programs. The standards provide guidelines
for best practices and include a thorough discussion of each standard and its importance in
economic evaluations. The standards can serve as a reference when planning, conducting, and
reporting studies that incorporate an economic evaluation. Importantly, this document does
not serve as a substitute for formal training on how to conduct economic evaluations. Many
excellent resources can be used to this end, many of which are referenced in this document.
The secondary audiences for these standards are funders and consumers of research who can
1 This work builds on numerous prior efforts toward establishing standardized practices in economic evaluation (e.g., Belfield & Bowden, 2019; Boardman et al., 2018; Crowley et al., 2018; Hollands et al., 2020; Karoly, 2012; Levin et al., 2018; National Academies of Sciences, Engineering, and Medicine [NASEM], 2016; Zerbe et al., 2010).

Standards for the Economic Evaluation of Educational and Social Programs
AMERICAN INSTITUTES FOR RESEARCH® | AIR.ORG 2
use them to assess whether researchers are, in fact, conducting rigorous economic evaluations
and what the risks are when specific standards are not met.
Structure of This Document
This document has four chapters and three appendices. Chapter 1 describes important cost
concepts as used in the standards in this document. Chapters 2–4 contain the standards for
each type of economic evaluation: CA, CEA, and CBA (with each described in more detail,
below). Each standard includes a discussion section that describes the standard’s importance
when conducting a rigorous economic evaluation. Within each evaluation type, the standards
are further organized across four research phases: design, data collection, analysis, and
reporting, as described in Exhibit I.1. This organization will support readers in understanding at
which phase of research each standard should be applied. Chapters 2–4 can be used
individually as needed by researchers, funders, and consumers of research, depending on the
focus of their particular study or proposal. However, it is expected that most readers will review
the document through the chapter on CA (Chapter 2) and then decide to continue on to one or
both chapters addressing CEA and CBA (Chapters 3 and 4). Chapters 3 and 4 on CEA and CBA
assume that the costs supporting these types of evaluations are estimated following the
standards in Chapter 2.
Exhibit I.1. Research Phases for Economic Evaluations
Research
phase Description
Design Designing an economic evaluation includes determining the type of evaluation needed
(CA, CEA, CBA); the data available; the conditions to be analyzed or compared; and,
where applicable, a rationale for sampling. In addition, the program’s theory of change
(including key assumptions) and information about a counterfactual condition (if
applicable) should be explored and described.
Data
collection
Cost data collection involves systematically gathering information about the types of
personnel and nonpersonnel resources or “ingredients” used in a program, their qualities,
and the quantities needed for implementation. Also, price information for all resources
must be systematically identified. For CEA and CBA, it is necessary to generate or obtain
extant estimates of the impacts of the program on outcomes of interest. CBA also
requires data about the monetary value of outcomes.
Analysis The analysis of cost and outcome data should align with the research questions, purpose,
and audience. Analytic choices should be consistent with economic evaluation standards,
whereby costs are comprehensive (based on the economic concept of opportunity cost),
and outcome changes are causally estimated. Sensitivity analysis to explore the ranges of
plausible values of costs and benefits should be conducted. All analytical assumptions
must be transparent to support program comparisons and replicability. The analysis of

Standards for the Economic Evaluation of Educational and Social Programs
AMERICAN INSTITUTES FOR RESEARCH® | AIR.ORG 3
Research
phase Description
data should occur in such a way to support reporting of appropriate summary metrics
and other details that are useful to decision makers and other researchers.
Reporting Results reported from an economic evaluation should include information about the
ingredients used, their prices and corresponding costs, a summary of cost metrics,
causally estimated impacts (CEA and CBA), and monetized estimates of impacts on
outcomes of interest and summary measures of economic returns (CBA). Reports should
provide transparency about the analysis, facilitate replicability, comment on
generalizability, and promote comparability across studies and programs. Assumptions
made throughout the research process along with limitations, also should be reported.
Although the standards are comprehensive, it is important to consider that the effort a
researcher puts into collecting and analyzing data should be commensurate with the value of
the information derived from those efforts (Farrow & Zerbe, 2013). Researchers should
consider this principle of proportionality as they incorporate these standards into their work.
Not every evaluation will succeed in meeting every standard because this may not be feasible.
Nevertheless, the standards serve as an important guide to help researchers maximize the rigor
of their work and consumers gauge the quality of research they review.
Appendix A lists the CA, CEA, and CBA standards without the discussion sections and is intended
to serve as a checklist when planning an economic evaluation and/or assessing the quality of
information provided by an evaluation. Appendix B is a glossary of terms used in the document
and their definitions to promote consistent terminology in the field. Appendix C describes the
process used to create these standards, including a list of the expert panelists and how they
were recruited, the drafting guidelines provided to the expert panelists, a description of the
deliberation meetings in which the draft standards were discussed, and the project timeline.
Economic Evaluation
Economic evaluation is the overarching term for analyses that estimate the economic costs of the
resources required to implement programs and achieve specific outcomes and, in some cases, the
monetary value of the outcomes achieved (benefits). In economic evaluation, costs are premised on
the concept of opportunity costs versus reflecting only direct or planned expenditures and
budgetary data. That is, if a resource is used in whole or in part for one program, that same whole
or part of the resource is rendered unavailable for any other purpose. Capturing the cost of that lost
opportunity to employ the resource in its next best use is how the resource is valued.
An economic evaluation differs from an expenditure analysis or a budgetary analysis. While an
expenditure analysis involves data analysis based on planned implementation or recorded

Standards for the Economic Evaluation of Educational and Social Programs
AMERICAN INSTITUTES FOR RESEARCH® | AIR.ORG 4
spending, which may not account for the comprehensive set of resources used, economic
evaluation relies on a firm understanding of actual program implementation to calculate the
opportunity costs associated with all resources used in the program. Cost estimates based on
opportunity costs therefore provide an accurate measure of what the cost would be to
replicate a given program in a similar context. The standards in this document pertain to the
three types of economic evaluation, defined as follows:
• Cost analysis (CA) estimates the opportunity costs associated with all resources used in
program implementation. This information helps decision makers understand the quantity
and value of all resources needed to implement a program, determine whether they can
afford the program, and understand how the program’s costs may fit into existing financial
structures. Conducting a CA is an essential first step in conducting both CEAs and CBAs.
• Cost-effectiveness analysis (CEA) compares the outcomes (effects) of program alternatives
on equivalent outcomes relative to their costs. Costs to achieve effects are estimated
relative to costs expended on a control or comparison group. Costs and effects are
combined into a cost-effectiveness ratio and compared to determine which program
alternative produces a given effect for the least cost.
• Cost-benefit analysis (CBA) compares programs based on the differences between their
monetized outcomes (benefits) and costs. This allows researchers to determine whether
undertaking a particular program is a worthwhile endeavor (i.e., whether benefits are
greater than costs) and if investment in one program is preferable to another. CBA also is
known as benefit-cost analysis.
Selecting the Economic Evaluation Type
The first step in conducting an economic evaluation is to select the appropriate type. Analysts
should select an evaluation type based on the research questions they aim to address and the
data available. Exhibit I.2 summarizes the types of data required to conduct CA, CEA, and CBA.
Exhibit I.2. Information Required to Conduct CA, CEA, and CBA
Information required CA CEAa CBAa
Well-defined intervention ✓ ✓ ✓
Type, quantity, quality, and prices of resources needed for implementation ✓ ✓ ✓
Well-defined comparison ✓ ✓
Valid measures of impacts on outcomes generated by the program(s) of interest
✓ ✓
Data that allow outcome impacts to be converted into monetary units
✓
a Both CEA and CBA require a CA.

Standards for the Economic Evaluation of Educational and Social Programs
AMERICAN INSTITUTES FOR RESEARCH® | AIR.ORG 5
Achieving Comparability Through Reference Case Analysis
Economic evaluations of educational and social programs offer decision makers an opportunity
to compare alternative programs and determine which one (or ones) best suits their needs and
resource availability. After selecting an evaluation type, it is helpful for analysts to design and
conduct a study that consumers of research can compare with other studies to inform decision
making. Conducting a “reference case analysis” allows analysts to provide findings that
facilitate legitimate comparisons across studies.
In a reference case analysis, comparability is facilitated by adopting a standard set of
prespecified parameters and assumptions in the economic evaluation to produce a reference
case.2 The Cost Analysis Standards Project (CASP) recommends the common parameters in
Exhibit I.3 that all researchers should use in a reference case analysis for educational and social
program research.
Exhibit I.3. CASP Recommended Reference Case Parameters
• Adoption of a societal perspective when determining costs and benefits
• Use of national average prices to value costs and benefits
• Use of a discount rate of 3% to calculate present values
A researcher can present an analysis using the reference case parameters as the only analysis
or include it as a supplementary analysis if a different set of parameters is more appropriate for
the specific context and research questions. As more studies adopt the use of reference case
parameters, information about costs, effects, and benefits will be more readily available to
decision makers to make accurate comparisons across program alternatives.
2 The recommendation for a reference case analysis follows recommendations by (a) the Panel on Cost-Effectiveness in Health and Medicine for a standardized reference case in CEA (Neumann et al., 2016; Russell et al., 1996; Siegel et al., 1996; Weinstein et al., 1996); (b) Robinson et al. (2019) for a reference case for CBA in global health and development; and (c) Hollands et al. (2020) for a reference case in the economic evaluation of educational programs.

Standards for the Economic Evaluation of Educational and Social Programs
AMERICAN INSTITUTES FOR RESEARCH® | AIR.ORG 6
Chapter 1: Understanding Costs
The economic cost of a program is the monetary value of the personnel and nonpersonnel
inputs used for implementation in a particular setting.3 Inputs are valued according to their
opportunity costs—that is, the value of their next most valuable alternative use. The
opportunity costs of a resource often are captured by a market price, such as personnel
compensation or the purchase price of materials and equipment. In cases where a market price
is not readily available, for example, when newly developed curricular materials (i.e., not
available for purchase) are being evaluated for their efficacy, the analyst must assign an
estimated value or “shadow price.”
For educational and social programs4, the inputs often are primarily personnel time, but they
also may include nonpersonnel resources, such as materials, equipment, and physical space. An
economic evaluation conducted from a societal perspective assesses the value of all resources
required to implement a program regardless of whether they are new inputs, existing resources
reallocated from other purposes, or in-kind (donated) resources. An economic evaluation
provides valuable information about what it would cost to replicate the program in a similar
context and differs from typical accounting of program spending. Program budgets and balance
sheets describe how dollars are (or are planned to be) spent, but they do not necessarily
describe what inputs were actually used by a particular program and would be required for
program replication (Hartman et al., 2001; Kolbe & Feldman, 2018; Levin et al., 2018).
Moreover, data included in budget and expenditure files may record spending supported only
by specific revenue sources, rendering an incomplete account of inputs covered by other
sources or donated to the program.
When estimating program costs, analysts typically focus on the resources required to introduce
the program versus the resources used in an existing condition representing “business as usual”
(BAU) or in an alternative program. Occasionally, there are no preexisting services, but, more
often, newly introduced programs supplement existing services, partially substitute them, or
substitute them completely. Each type of scenario has different implications for the ease with
which program costs can be accurately estimated. We explain these scenarios in this section
and use Exhibits 1.1–1.4 to depict definitions of “gross,” “total,” and “incremental” costs. Gross
cost is the sum of the cost of implementing a program and the cost associated with any existing
supporting services that the program may be added on top of. Total cost is the cost of
implementing the program itself. Incremental cost is the difference in gross costs between any
3 In the economic evaluation of educational and social programs, inputs often are referred to as ingredients or more generally as resources. This document uses all three terms interchangeably. 4 Note that throughout this document, the terms program, intervention, and policy are used interchangeably as they are all often used in evaluations of educational and social programs.

Standards for the Economic Evaluation of Educational and Social Programs
AMERICAN INSTITUTES FOR RESEARCH® | AIR.ORG 7
two conditions (i.e., either two different programs or a given program and BAU).5 In practice,
determining the incremental cost often does not require the calculation of gross costs.
Although each evaluation should be based on the context and comparisons being made, the
exhibits in this chapter provide a guide to improve the clarity and consistency of terminology
used in economic evaluation.
New Programs Without Preexisting Services
In cases without a preexisting program, for example, if a new community center is established
in a town where no similar services were previously available to residents, the analyst should
capture the value of all resources required to build and operate the center and describe these
as total costs. Following the cost definitions listed previously, in this example, the total cost
(cost of the program itself) is equal to both the gross cost (the costs of the program and any
underlying services) and the incremental cost (the difference in the gross costs of the treatment
and control conditions) because the cost of the control condition is zero.
Supplementary (or “Add-On”) Programs
When a new program supplements BAU without replacing any existing activities, a cost analysis
focuses on the additional costs of the program rather than estimating the gross costs of
underlying services plus the new program. As shown in Exhibits 1.1 and 1.2, the resources
required to implement a new supplementary program are all incremental to the resources used
to implement BAU.6 However, because the sum of these incremental costs represents all the
costs associated with implementing the new program, this metric can also be described as total
costs. Therefore, the total cost of a supplementary program represents the incremental costs
compared with BAU. Gross costs also would include the costs of BAU resources that are
necessary as a base for the supplementary program (e.g., the costs of regular classroom
instruction to which a new instructional program was added). However, given that the focus of
economic evaluations often is on identifying the incremental costs associated with
supplementary programs, the calculation of gross costs is rarely required.
5 Some analysts use the term “net costs” instead of “incremental costs.” Because “net costs” is also used by other analysts to mean cost savings or averted costs that arise as a result of program implementation, or to refer to costs borne by stakeholders after considering transfers, CASP avoid the term throughout the standards document. If analysts use “net costs” in reporting, the CASP recommends they clearly define the term to ensure clarity. 6 Some analysts use the term “marginal cost” to refer to the costs described here as incremental costs. However, the CASP defines marginal costs as the costs incurred to serve one additional participant, site, or other unit.

Standards for the Economic Evaluation of Educational and Social Programs
AMERICAN INSTITUTES FOR RESEARCH® | AIR.ORG 8
Exhibit 1.1. Incremental, Total, and Gross Costs When Considering a Single Supplementary
Program With BAU as the Control Condition
Exhibit 1.2 illustrates a comparison between two programs that supplement BAU. In this
scenario, an additional measure of incremental cost can be calculated: the incremental cost
between Programs 1 and 2. The total cost of each program is still the sum of costs that are
incremental to BAU. The gross cost for each program would, again, additionally include the
costs of BAU resources.7
7 Note, to reduce clutter the labels for gross costs are not included in Exhibit 1.2 or any of the remaining exhibits.

Standards for the Economic Evaluation of Educational and Social Programs
AMERICAN INSTITUTES FOR RESEARCH® | AIR.ORG 9
Exhibit 1.2. Incremental and Total Costs When Considering Two Alternative Programs That
Supplement Underlying Programming (BAU)
Partially Substituting Programs A more complicated scenario is depicted by in Exhibit 1.3, where a new program partially
substitutes activities occurring under BAU. For example, a tutoring program could take place
partly during the regular instructional period, replacing activities that would have otherwise
occurred during that time, and partly after school. For partially substituting programs, the
analyst should estimate the total costs of the program as the sum of the costs of new
resources used to implement the program plus the costs of resources reallocated to the
program from BAU activities. Analysts should not include resources used for the part of BAU
that is unchanged (i.e., not reallocated to program activities). Gross costs, if calculated, would
include the costs of new, reallocated, and unchanged resources.
As in other scenarios, the incremental cost technically reflects the difference in gross costs
between the partially substituting program and BAU. Here the incremental cost is the portion
of program cost associated with the new resources used for implementation.

Standards for the Economic Evaluation of Educational and Social Programs
AMERICAN INSTITUTES FOR RESEARCH® | AIR.ORG 10
Exhibit 1.3. Incremental and Total Costs When Considering an Alternative Program That
Partially Substitutes Underlying Programming
Fully Substituting Programs
In some instances, a new program fully replaces an existing one. It may cost less, more, or the
same as the program it replaces. For example, Exhibit 1.4 might depict a scenario in which a
regular brick-and-mortar school program (BAU) is fully replaced by one of two virtual schools.
For fully substituting programs, the analyst should estimate the total costs of the program as
the sum of the costs of resources reallocated from BAU activities, plus the costs of any
additional resources, or minus the costs of any resources no longer needed. In this scenario,
because all BAU resources are either reallocated to or unused by the fully substituting
programs, total costs and gross costs are the same.
The incremental or differential costs between each fully substituting program and the BAU
condition are the differences in the value of the resources devoted to each program and the
BAU condition that is completely replaced. In Exhibit 1.4, the cost of Program 1 is less than the
cost of the BAU condition, resulting in a net cost savings or a negative incremental cost. In
contrast, the cost of Program 2 is greater than the cost of BAU condition, so the incremental

Standards for the Economic Evaluation of Educational and Social Programs
AMERICAN INSTITUTES FOR RESEARCH® | AIR.ORG 11
cost is positive. The third incremental cost between the two alternative programs is the
difference in their total costs.
Exhibit 1.4. Incremental and Total Costs When Considering Two Alternative Programs, Each of
Which Fully Replaces Underlying Programming

Standards for the Economic Evaluation of Educational and Social Programs
AMERICAN INSTITUTES FOR RESEARCH® | AIR.ORG 12
Chapter 2: Cost Analysis Standards
Introduction to Cost Analysis Standards Cost estimation and analysis (hereafter, “cost analysis” or CA) are essential elements of a
rigorous economic evaluation and form the basis of CEAs and CBAs, as well as other types of
economic evaluations, such as cost-feasibility analysis and cost-utility analysis. The CA
standards are informed by numerous prior efforts to provide guidance and standards to
improve the quality of economic evaluations.8
The CA standards will help analysts assess the economic value of resources required to
implement a program and communicate the resource requirements and costs to decision
makers and researchers. The standards promote consistency and transparency about the
methods, data, and assumptions that produced the results to allow for replicability and
facilitate comparisons across CAs. They emphasize the need to document variations in costs
across time, population groups, or settings caused by intentional or unintentional differences in
implementation. Transparency of cost data, including descriptive details about resources used
and their respective quantities and prices, is encouraged to allow for verification and replication
of the findings by other analysts. This will promote the credibility of cost analysis as a
systematic and disciplined practice and provide exemplars to help build capacity for economic
evaluation in educational and other social programs.
CA findings may be used to support recommendations about future implementation and
operation at the original study site, for example, whether to continue the program, modify
delivery, or scale it up to serve more participants. Studies that compare the costs of
implementing different programs serving the same purpose can help decision makers optimize
the use of resources. CA results also can be useful to decision makers at other locations
considering whether to implement a program. For these consumers of the research, it is
essential to report enough detail on the types and quantities of resources needed for high-
quality implementation to allow an assessment of the resource availability and likely costs in
their own context (e.g., see Hollands & Pan, 2018; Mastri & McCutcheon, 2015).
Research funding allocated to the CA should reflect the complexity of the study design in terms
of the number of sites and organizations or stakeholders from which data must be collected;
the ease of accessing and analyzing the needed data; and, where relevant, the number of
alternative programs being evaluated.
8 See Child Welfare Research and Evaluation Cost Workgroup (2013); Chambers (1999); Crowley et al. (2018); Dhaliwal et al. (2014); Ferrari et al. (2018); Greenberg & Appenzeller (1998); Hartman et al. (2001); Hollands et al., 2016; Hollands et al. (2020); Jones et al. (2019); Karoly (2012); Levin (1975, 1983); Levin & Belfield (2015); Levin & McEwan (2001); Levin et al. (2018); NASEM (2016); and Weinstein et al. (1996) for more information.

Standards for the Economic Evaluation of Educational and Social Programs
AMERICAN INSTITUTES FOR RESEARCH® | AIR.ORG 13
Evaluation Design: Cost Analysis
1. Whenever possible, plan cost analyses in advance of the implementation period to be
studied and conduct them concurrently with program implementation and operation.
Planning a CA prior to implementation of the program, that is, prospectively, allows time to
develop a comprehensive and systematic data collection and analysis plan. Data collection that
is concurrent with program implementation facilitates the capture of program costs as they are
incurred and is likely to produce the most accurate estimate of costs. There are, however,
instances when analysts need to estimate costs in advance of program implementation (i.e.,
prospectively). Although somewhat speculative, prospective analysis can be useful to inform
strategic planning or allow time for financing to be raised before implementation. In other
cases, it may be possible for analysts to collect cost data only after a program has already been
implemented and is no longer in operation at the relevant sites (i.e., retrospectively).
Retrospective analysis can inform a decision about restarting or replicating a program and can
provide cost data that line up with past performance data. (For more information, see Child
Welfare Research and Evaluation Cost Workgroup, 2013; Crowley et al., 2018, p. 375; Ferrari et
al., 2018, p. 30; Levin & Belfield, 2015, p. 412; Levin et al., 2018, pp. 51 & 62.)
Retrospective analysis can suffer from measurement error and incompleteness because of
reduced access to data and inaccurate recollections of implementers regarding time and other
resource use. If the program is ongoing, implementation may have changed in substantive ways
that may affect outcomes and costs for others adopting the program (e.g., a technology-based
mathematics program may have shifted from downloadable software to being accessible
online). Prospective analysis also might suffer from inaccuracy because it reflects expected
rather than actual resource use.
2. Develop a cost analysis plan that describes the study motivation and context, the
program being analyzed, and study design considerations.
Thorough CA plans facilitate proactive preparation for known challenges and design
considerations. Transparency in the CA process and context ensures accountability for
decisions, clarifies the uncertainty of assumptions and analytical decisions made, provides more
context for study findings, and facilitates replication. In the design stage, analysts should
develop a cost analysis plan to address the items listed in Exhibit 2.1 regarding study motivation
and context, descriptive information about the program being analyzed, and study design
considerations. Updates and changes to the plan should be documented throughout the
execution of the CA. (For more information, see Ferrari et al., 2018, p. 19; Hollands et al., 2020,
pp. 4–8; Karoly, 2012, p. 35; Levin et al., 2018, Chapter 2;and Zerbe et al., 2010, pp. 35–36.)

Standards for the Economic Evaluation of Educational and Social Programs
AMERICAN INSTITUTES FOR RESEARCH® | AIR.ORG 14
Exhibit 2.1. Checklist for Elements To Be Included in an Economic Evaluation Plan and Report
Study motivation and context The decision or research questions to be informed by the economic evaluation (if part of a larger study,
how the evaluation fits with any broader research questions addressed by the study) The type of economic evaluation being conducted (cost estimation, CA, cost-feasibility analysis, CEA, CBA,
cost-utility analysis) Whether the economic evaluation is prospective, concurrent, or retrospective The audience for the results
The perspective(s) taken (e.g., societal, public, private, education agency, participant) Prevailing conditions and policies
Descriptive information about the program being analyzed Logic model/theory of change, including components for the program being evaluated to illustrate how
inputs/resources and activities, including duration, frequency, and time period during which the program is implemented, are expected to lead to intended outcomes for specified recipients
Whether the program is in a start-up or steady-state phase and, if both phases are spanned, which activities are considered start-up versus steady-state
Scale of implementation o Number of participants served o Type, number, and location(s) of study sites (e.g., classroom, school, state)
Whether the intervention is stand-alone, supplementing, replacing, or partially substituting an existing program
BAU or other condition experienced by the control group participants, including the typical practice(s) being replaced or supplemented by the program received by the treatment group participants
Characteristics of the population served Resource categories, including key types of staff
Study design considerations The time period and specific year(s) for which CA, CEA, and CBA data are collected and reported (time
horizon) For multiyear programs, the reference year to which costs and benefits will be discounted to account for
the time value of money and the discount rate used for this adjustment The scope of cost data collection (i.e., whether the analysis includes costs of any preexisting program, such
as regular school instruction, or focuses on the resources required for the introduction of a new treatment) Any sampling strategy used for collecting data from a subset of sites or participants The methods used to collect cost data and estimate costs and benefits A timeline for data collection
Sources of data on resources and prices used to calculate costs Instruments used to collect cost data (e.g., interview protocols, surveys) Interest rate used to amortize the costs of durable assets Discount rate used to obtain present values of costs and benefits Methods used to identify rigorous (causal) outcome impacts to measure effectiveness
Sources of price data on the willingness to pay for outcomes used to calculate benefits Whether national or local prices are used and for which country and geographic region Currency and year in which costs and benefits are expressed in constant currency Any applications of specified inflation and/or geographical indices to adjust prices The summary metrics and cost breakdowns that will be presented
How cost metrics are aligned/combined with outcome metrics, including whether costs are estimated for the treatment-on-the-treated or intent-to-treat sample
Sensitivity analyses
Informed by Crowley et al. (2018), Karoly (2012), Levin et al. (2018), and NASEM (2016).

Standards for the Economic Evaluation of Educational and Social Programs
AMERICAN INSTITUTES FOR RESEARCH® | AIR.ORG 15
3. Align data collection sources and methods with the research questions.
The research questions and objectives should guide the design of the economic evaluation. The
CA plan should articulate a clear and coherent link between the research questions and the
tools, data sources, and procedures that will be used to collect data on program costs (Levin
et al., 2018, pp. 29–42 and 71–74). For example, the analyst should justify the type of economic
evaluation that will be conducted (e.g., CA, CEA, CBA); the study design, sites, and, where
relevant, comparison conditions included in the analysis; how the outputs or outcomes that will
be measured fit with the theory of change; the participants involved in the study; and the time
horizon.
4. Use a perspective aligned with the research objectives. Choose the perspective
prior to collecting data and justify the choice of perspective.
‒ In the absence of a rationale to do otherwise, the societal perspective is
preferred and is the standard for the reference case analysis.
‒ Consider using the perspective of the main implementing agency (e.g., school,
district, state education agency) if it can usefully inform a decision.
‒ Consider the perspective of participants (e.g., teachers, families, or students)
when it is important to assess whether the program is worth the necessary time
and effort from the participants’ point of view.
In economic evaluations, “perspective” refers to which stakeholders’ resource contributions are
documented. The perspective chosen should depend on the purpose of the study and the
research questions. If the intent of cost estimation is to generate results to inform prospective
implementers about the necessary types, quantities, and costs of resources, a comprehensive
societal perspective is appropriate. However, if the “client” is a specific party that bears only a
share of the costs, then this party’s perspective may be preferred. The societal perspective
allows future researchers to isolate costs by stakeholder to facilitate comparisons to studies
that use different perspectives.
When applying the societal perspective, analysts should plan to collect cost data for all
resources contributed by all parties, including education agencies, participants and their
families, volunteers, and community partners. For other perspectives, the analyst should plan
to provide cost estimates for only those resources supplied by the relevant entity. However,
analysts should collect descriptive information about the contributions needed from other
parties to help potential implementers in other locations understand the resources needed for
operating the program.

Standards for the Economic Evaluation of Educational and Social Programs
AMERICAN INSTITUTES FOR RESEARCH® | AIR.ORG 16
5. In evaluations that include multiple sites, plan to estimate the costs of the program
for all sites (and, where relevant, the costs of the counterfactual or control
condition) using data from multiple locations or contexts. If possible, plan to collect
data from all sites. When this is not practicable, employ a method of sampling sites
that supports valid inferences to the population of interest.
Cost estimates depend heavily on variable aspects of the implementation context, including the
preexisting resources at each site, the levels of program buy-in and uptake of services,
differences in student needs, and the capacity of the implementing staff. If collecting data from
all sites is not possible or practicable, analysts should choose a site sampling strategy that is
representative of the variation in characteristics of subjects and sites in the study population.
For example, analysts may randomly select sites or purposefully choose sites based on
differences in student needs or in the seniority and qualifications of the implementing staff.
They should include as many sites implementing the program as possible within available
funding and, where relevant, sites implementing the comparison condition. Research
consumers should proceed with caution when generalizing cost estimates from one context to
another (Ferrari et al., 2018, p. 32; Levin & Belfield, 2015, pp. 413–414; Levin et al., 2018, pp.
123–124). If the analyst does not collect information on the resources used for comparable
services in the comparison condition, the analyst may overstate the incremental costs of the
program being evaluated.
6. The unit of analysis for costs should be the level at which the program is delivered.
This may differ from the unit of analysis for determining effects, which often is at
the individual participant level. The units of analysis must be aligned for the
purposes of a cost-effectiveness analysis or cost-benefit analysis.
For educational programs, the program often is delivered at the classroom or school level,
whereas effects are usually measured at the student level. For a CEA or CBA, the costs and
effects must be expressed at the same level, which may, for example, require aggregating
student-level metrics to classroom- or school-level metrics or averaging classroom- and school-
level metrics across students. In either case, costs incurred by the district, state education
agency, or other institutions and organizational levels should be included in per school, per
class, or per student cost estimates. Consumers of the cost analysis may misunderstand the
resource requirements and costs of delivering a program if they are not aligned with the visible
mode of delivery. Any assumptions made to align the unit of analysis for costs with the unit of
analysis for effects or benefits should be stated, clearly acknowledging potential limitations. For
example, calculating the costs of a districtwide program per school, summing these values, and
then dividing this number by the total student enrollment for the district to report costs per
student will mask cost variations due to differing school sizes.

Standards for the Economic Evaluation of Educational and Social Programs
AMERICAN INSTITUTES FOR RESEARCH® | AIR.ORG 17
Data Collection: Cost Analysis
7. Collect data on the resources required to implement all activities necessary to
produce the observed outputs or impacts of the program at the implementation
site(s) under typical conditions and, where relevant, the control sites. Exclude sunk
costs and costs of activities that occur after the implementation period studied.
The cost of a program represents the value of all resources used to implement activities in a
particular setting that produce the observed outputs or impacts. This may include start-up
activities, such as program design, planning, hiring, and initial training, and ongoing activities,
such as service delivery, administration, and monitoring. The latter incur ongoing, operational,
steady-state, or maintenance costs.
If the purpose of the analysis is to determine what it would cost to implement a fully developed
program at a different site, sunk costs for resources used at the original site that are not
needed to implement the program in a new setting should not be included in the cost estimate.
As a result, resource use and resulting cost estimates for implementation at a new site may be
different from those at the original site of program implementation. In addition, costs of
developing the program and research or program evaluation costs that do not contribute to
program outputs or effects should not be included in a cost estimate of program
implementation. Events and activities that occur after the implementation period, which may
result in savings, averted costs, or induced costs (e.g., college enrollment), also should not be
included in the cost of program implementation. Instead, these should be documented
separately so that they may be understood and considered by decision makers or by analysts
conducting CEA and CBA (Levin et al., 2018; Rice, 1997).
8. Collect data to assess the economic value of all resources required to implement
and operate programs in practice, as represented by their opportunity costs.
Data should be collected on all resources used to implement a program, including new inputs,
existing resources reallocated to implement the program (such as teacher time or physical space),
and in-kind or donated resources (such as equipment and volunteer or family time). Resources
used by a program should be valued according to their opportunity costs (i.e., the next most
valuable alternative use) regardless of how they are financed or provided. Calculating the
economic value of a program stands in contrast to a standard accounting approach to track
program spending. Program budgets and balance sheets describe how dollars are (or will be)
spent but do not necessarily describe what resources were actually used by a program and would
be required for program replication. Specifically, the actual resources used to implement a
program may deviate significantly from those planned in a budget. Further, even when final
expenditure reports from the implementing organization include actual spending, these often

Standards for the Economic Evaluation of Educational and Social Programs
AMERICAN INSTITUTES FOR RESEARCH® | AIR.ORG 18
omit dollar values for resources provided by other parties not in charge of implementation (e.g.,
volunteers or resources paid for by an external grant). In addition, the data may not be granular
enough to identify the portion of existing resources that are shared with the program (e.g., school
staff who spend only part of their time on program implementation).
When estimating program costs, analysts should focus on the difference in quantity and value
of the resources required to introduce the program compared with an existing condition (i.e.,
BAU) or an alternative program. (See Exhibits 1.1–1.4 and associated notes in this document;
for more information, see Hartman et al., 2001; Kolbe & Feldman, 2018; and Levin et al., 2018.)
9. Use a recognized method for identifying and valuing the resources needed to
implement and operate the program being studied.
The analyst should estimate costs using a method that systematically captures the value of all
resources needed to produce the observed or expected program outputs or effects. The
ingredients method (Levin, 1975, 1983; Levin & Belfield, 2015; Levin & McEwan, 2001; Levin
et al., 2018), also known as the resource cost model (Chambers, 1999; Chambers & Parrish,
1994a, 1994b), is currently the most commonly used method for identifying and valuing
resources used in educational programs. It is the only method that values resources based on
their opportunity costs. This method requires the analyst to (a) identify and specify the
resources or “ingredients” used to implement a program, (b) value and price ingredients, and
(c) calculate measures of program cost.
The ingredients method produces comprehensive estimates of the cost of implementing a
program. The method also provides a clear and coherent framework for communicating
information about the resources used in implementation, their value, program cost, and the
distribution of costs among stakeholders. This information is useful for comparing resources
and costs across multiple implementation sites or programs and can help decision makers
understand what is required to replicate a program in a different setting. In addition, a
recognized and systematic method supports the replication of the results in future research and
in new contexts.
10. Collect information on the actual resources used to implement and operate the
program and, wherever possible, draw on multiple sources of information.
For concurrent or retrospective CA, the cost analyst should identify the actual resources used to
implement a program in practice in a particular setting. A priori assumptions about the
amounts and kinds of resources that a program might use can be beneficial for understanding
expected resource use, but they may not reflect resources used during actual implementation

Standards for the Economic Evaluation of Educational and Social Programs
AMERICAN INSTITUTES FOR RESEARCH® | AIR.ORG 19
(Levin et al., 2017). The analyst should prioritize primary data sources to obtain a direct account
of the actual resources used in program implementation.
Information on the types and amounts of resources used by a program can be obtained from
multiple sources, including interviews with program leadership, staff, and participants; staff
time and activity logs; surveys on the use of materials and equipment; and observations of the
program in action. Priority should be placed on collecting information on resources that likely
will account for the greatest portion of costs (e.g., personnel time). Depending on the
perspective of the analysis, it also may be important to focus on resources that may not be
accounted for in formal records, such as volunteer and family time and in-kind donations of
materials and equipment.
The analyst should seek to validate information on resource usage across multiple sources. In
addition to the primary sources, the sources may include extant data sources such as
administrative data, documents that describe the program, implementation guides,
implementation and evaluation reports, program budgets, and financial statements (expenditure
data). However, these extant data sources may not fully reflect resource use in practice.
11. Systematically record and categorize, in a transparent and reproducible manner, all
resources required to implement and operate a program in practice. Create
resource categories that are mutually exclusive and exhaustive and, at a minimum,
separately list personnel, materials and equipment, facilities, and other inputs.
Analysts should use a cost template or other systematic approach to enumerate and categorize
resources according to a common framework (see examples in Burwick et al., 2017; Chambers,
1999; Hollands et al., 2020; Knight, 2012; Kolbe & O’Reilly, 2017; Levin et al., 2018; Rice, 1997;
Rice & Hall, 2008; and J-PAL9). Adopting such a framework ensures a full accounting of the
resources needed to implement the program and their subsequent valuation. Reporting
resource and valuation information transparently helps decision makers understand what
resources are required to implement a program in another setting.
At a minimum, the analyst should record and categorize resource information according to the
following categories: personnel; materials and equipment; facilities; and other inputs, such as
transportation, travel and lodging, contracted services, or resources contributed by program
participants or others (Burwick et al., 2017; Levin et al., 2018). The analyst also may choose to
organize resources according to specific program activities (e.g., instructional coaching,
program administration).
9 The resources developed by J-PAL including a cost template are available at https://www.povertyactionlab.org/resource/conducting-cost-effectiveness-analysis-cea.

Standards for the Economic Evaluation of Educational and Social Programs
AMERICAN INSTITUTES FOR RESEARCH® | AIR.ORG 20
For each resource enumerated in the template, the analyst should document the details listed
in Exhibit 2.2. Resources should be further categorized according to the organizational unit
(e.g., district, school, classroom, teacher, student) and, where applicable, the program
component that consumed the resource. The analyst should clearly describe how each resource
is distributed among the participants served (e.g., one interventionist might serve 12 students
per semester, a science kit might be shared between two classrooms of 30 students each).
It is especially important to clearly communicate resource requirements when market prices
are unavailable, determined by an uncompetitive market, or volatile. For example, there may
be no market price for caregivers in a remote rural area, but these personnel may be critical for
the program to operate. Failing to document this resource would result in an underestimate of
the costs to replicate the program in other areas where there is a market for caregiving labor. In
this instance, it would be necessary for the analyst to identify an appropriate shadow price for
caregivers in a remote rural area.
Exhibit 2.2. Resource Details to Document in the Ingredients Template
Essential characteristics of each resource, including its type (e.g., mathematics intervention specialist) and qualities (e.g., personnel with master’s degrees and 15 years of teaching experience). This information is needed to identify an appropriate price for the resource.
The unit and quantity of the resource that was consumed during the implementation period being studied (e.g., three classroom teachers; 25 student workbooks; 900 square feet of classroom space).
The percentage of time usage attributable to the program in question (e.g., 25% full-time equivalent for each of the three teachers, 10% of the time a laptop is available for use). This information is needed to assign an appropriate share of the resource’s value to the program.
o For personnel, the analyst should base calculations on the number of workdays in a year for the position and how many work hours in a day.
o Supplies and materials used to implement and operate the program, such as licenses, workbooks, assessment items, and classroom materials, should be described in their original units. The analyst should include the type and amount consumed during the period for which costs are estimated.
o For durable/nonconsumable items, the analyst should document the expected usable life of owned items, such as furniture, computer hardware, or classroom space, or the number of years during which the costs of an ingredient can be justifiably spread (e.g., ingredients used in initial training may be spread across several years). Provide any amortization formula used. For leased or rented resources, the analyst should record the rental or leasing fees attributable to the program being evaluated.
The activity or function the resource serves in implementing the program (e.g., coteach mathematics classes). This information helps the analyst and the evaluation consumer understand how resources are deployed to support implementation.
Information on average tenure (in years) of personnel in the positions relevant to the program studied and/or on frequency of training is useful to allow initial training costs to be spread across time.
For multiyear programs, the program year(s) in which the resource was consumed.

Standards for the Economic Evaluation of Educational and Social Programs
AMERICAN INSTITUTES FOR RESEARCH® | AIR.ORG 21
12. If a resource is shared across multiple programs, determine an appropriate
percentage of use to attribute to the program being evaluated.
If a resource is used to implement more than one program, only the amount consumed by the
program being evaluated should be included when estimating its costs. Exhibit 2.3 suggests
possible methods for determining or assigning partial values for shared resources. Some of
these methods are arbitrary and should be acknowledged as such when reporting the results.
Exhibit 2.3. Possible Methods for Determining or Assigning Partial Value for a Shared
Resource
Divide the number of hours the resource is used for the program by the total number of hours the resource could be available for use during the study period.
To estimate an appropriate share of indirect costs, determine the proportion of direct costs of the program being studied from the total direct costs of all programs that use that resource and apply the same proportion to indirect costs of the program (this presumes costs of all relevant programs and total indirect costs are known).
Allocate a proportion of time to a resource based on the number of programs it serves. For example, if the resource is used in five programs and one is being evaluated, assign 20% of the value of the resource to the evaluated program.
Use the proportion of people reached by the program being evaluated divided by the total number of people reached by all programs that use the resource. For example, a building receptionist at a community center may serve participants in a variety of different programs, so it would be difficult to trace the receptionist’s time to any specific program. The cost analyst could calculate the proportion of total visitors to the center who participate in the particular program being studied to estimate a proportion of the receptionist’s time to attribute to that program.
Use time logs, diaries, interviews, or other time-use study methods to capture primary data on the percentage of time to attribute to the program being evaluated. This is especially worthwhile if the resource in question is expected to represent a large proportion of the total resources used to implement a program (e.g., personnel).
13. Record information about how resources used to implement the program are
financed, including
‒ which entity bears the costs of each resource (e.g., school, district, family);
‒ whether each resource is newly purchased (i.e., represents a new expenditure),
is an existing resource reallocated from other uses, or is contributed in-kind; and
‒ where possible, the source of funding (e.g., annual school budget, Title I federal
grant, district office discretionary funds).
Costs and financing are two distinct concepts in economic evaluation. Costs represent the value
of resources; financing addresses who funds or otherwise bears the burden of these costs.
Program costs in education often are financed by a variety of stakeholders, including federal
and state governments, schools, districts, and families. Parsing costs among stakeholders allows

Standards for the Economic Evaluation of Educational and Social Programs
AMERICAN INSTITUTES FOR RESEARCH® | AIR.ORG 22
different perspectives to be presented and informs decision makers for which aspects of the
program they are financially responsible.
It also is helpful to decision makers to know to what extent the program requires new
expenditures or relies on existing resources reallocated from other activities. Accordingly, the
analyst should document whether each resource is newly hired/purchased specifically for the
program (e.g., an additional interventionist may need to be hired or implementation guides
purchased for a new curriculum), or whether the resource already exists at the site and is
simply reallocated wholly or in part to implement the program (e.g., a classroom teacher’s
time). Alternatively, the resource may be contributed without any direct charge (e.g., parents
may volunteer their time to help implement a small-group reading intervention; a local
company may donate laptops for a digital initiative). Whenever feasible, analysts should collect
information about the source of funding (e.g., a professional development activity for teachers
may be funded by Title II funds and/or a state education agency grant to the district). This
information can provide useful insights about sustainability and scalability of the program at
the study site and elsewhere.
14. Identify a market or shadow price for each resource, record the year and source of
the price, identify the unit (e.g., hourly wage, annual salary, construction cost per
square foot), and identify to which geographical location it is relevant.
Each resource used to implement a program should be valued using a price that reflects its
opportunity cost, often represented by a market price (i.e., the price a consumer would pay for
the resource on the open market). When a market price is unavailable for a particular resource,
the analyst should identify a reasonable estimate or a “shadow price” to reflect its opportunity
cost (Levin et al., 2018, pp. 48–49). For example, the analyst could use an average of several
textbook prices as a shadow price for equivalent curricular materials developed by a project
and provided free of charge to the study participants.
When using market prices to value personnel time, the price should reflect total compensation,
including wages/salary and any fringe benefits or bonuses. Participants should be assigned a
price only if they are of an employable age. The analyst should note any special conditions that
may affect current market prices (e.g., teacher shortages; union contracts; differential salaries
in difficult-to-staff schools, locations, or subjects; or external shocks that impact input market
prices in an unusual way). If market prices are unavailable, the analyst should value the
resource using shadow prices.
Supplies and materials should be valued using a market price (e.g., a student workbook would
be valued at its purchase price) or an appropriate shadow price.

Standards for the Economic Evaluation of Educational and Social Programs
AMERICAN INSTITUTES FOR RESEARCH® | AIR.ORG 23
Durable/nonconsumable items should be valued using market or shadow prices amortized
(spread) across the asset’s useful lifetime, using a specified interest rate (e.g., a digital device
might be assigned its purchase price amortized over 3 years).
Physical spaces used for program implementation should be valued using real estate purchase
(replacement) value or construction costs amortized over the expected remaining lifetime of
the building or rental rates for equivalent spaces.
In-kind goods and services used to implement a program, which may include volunteer time,
donated space (e.g., classroom, community center), equipment (e.g., printers, computer), or other
items (e.g., food, books) should be valued using market prices or appropriate shadow prices.
Time spent by volunteers should be valued based on the tasks undertaken and any required
qualifications or experience. This compensation should be commensurate with the market
compensation for the role being fulfilled or services provided. If a market analog does not exist,
possible options include the average compensation rate for occupations requiring similar skills
and training. When considering time spent by parents or other family members, the analyst
should value time spent on activities in which they would not routinely engage (e.g., picking up
a child from an afterschool intervention when the child would normally take the school bus).
For indirect or overhead costs, an appropriate portion of an organization’s indirect, overhead, or
administrative costs should be allocated to the program being studied. If this information cannot
be obtained from program personnel or documents, it may be estimated for the program being
evaluated. The analyst may be able to identify a standard indirect cost rate for the organization
implementing the program. For example, agencies that receive federal funding negotiate
indirect cost rates and establish a negotiated indirect cost rate agreement. However, such rates
may be very high at some institutions, such as research universities, so they are not always the
best source for the indirect costs of programs being evaluated. If using an indirect cost rate, the
analyst should clarify to what base amount of direct costs the rate is applied (e.g., all resources,
labor only). In addition, the analyst should clearly list the resources included as indirect costs to
avoid double counting items as both direct and indirect costs. It is important to consider indirect
costs from all organizational levels that contribute toward implementing the program.
Data on indirect costs also may be identifiable from existing sources, such as the Census Bureau
or, for education agencies, state and local finance data collected by the National Center for
Education Statistics (e.g., F-33, School-Level Finance Survey10).
10 The U.S. Census Bureau and the National Center for Education Statistics Annual Survey of School System Finances (F-33) and School-Level Finance Survey data are available at https://nces.ed.gov/ccd/f33agency.asp and https://nces.ed.gov/ccd/pub_sfr_report.asp, respectively.

Standards for the Economic Evaluation of Educational and Social Programs
AMERICAN INSTITUTES FOR RESEARCH® | AIR.ORG 24
15. Collect a price for each resource in the currency of the country in which the
program is implemented. The type of prices (e.g., national average, local average,
local actual) assigned to resources should reflect the intended audience and level
to which the analyst wishes to generalize the findings. In all cases, record the year
to which each price is relevant. For the reference case, use national average prices.
Prices assigned to resources should reflect the intended audience and level to which the analyst
wishes to generalize the findings. Consider the following examples:
• Local actual prices to inform a single school principal
• Local average prices to inform program directors across several schools in a district
• Statewide average prices to inform multiple district leadership teams across a single state
and the state education agency
• National averages to inform policymakers or education agencies across multiple states and
provide estimates that are comparable across economic evaluations conducted in different
locations.
Analyzing the Data: Cost Analysis
16. When a program is implemented across multiple years, discount resource costs to a
present value using a single reference year.
It is necessary to discount costs to their present values (PVs) to reflect preferences for making
expenditures later rather than earlier and recognize the time value of money or the fact that a
dollar of cost (and effects or benefits in the case of CEA and CBA, discussed later) that occurs in
more recent years is more valuable than one incurred (or generated/accrued) in more distant
years. To avoid distortions in decisions and properly account for differences in the timing of
costs, effects, and benefits, the analyst should determine a single reference year to which all
costs, benefits, and effects arising in different years are discounted (NASEM, 2016). In most
cases, this should be the year when a program begins because that is when a relevant decision
will occur. Other reference year choices can be valid but should be justified and stated clearly.
The selection of an appropriate discount rate will depend greatly on the context of the project
(e.g., time frame, geographic location, level of risk, stakeholders involved). Analysts should
consult authoritative references on the topic and provide transparency and justification for
their choice of a discount rate (e.g., Boardman et al., 2018; Zhuang et al., 2007). For U.S.
contexts, the CASP recommends a real (i.e., net of inflation) discount rate of 3% for a reference
case analysis that serves to allow comparisons across programs or projects (as per Neumann
et al., 2016). For analyses with time horizons spanning multiple years, the discount rate should

Standards for the Economic Evaluation of Educational and Social Programs
AMERICAN INSTITUTES FOR RESEARCH® | AIR.ORG 25
be varied in sensitivity analyses. Adjustment for inflation should be treated independently from
discounting to the PV (see Standard 17).
Failing to discount costs (and, where relevant, effects or benefits) to their PV risks overstating
the value of costs and benefits occurring after the base year of program implementation. For
most programs, many costs occur immediately, whereas benefits may stretch far into the
future, so failing to discount future values to the reference year may lead to an overestimation
of the value of benefits relative to costs.
17. Choose one year in which to express costs and convert nominal prices from different
years into constant currency (i.e., real prices) for that year, by adjusting for inflation
using published inflation indices or a justifiable, predicted inflation rate.
Program costs and benefits often occur over multiple years (e.g., Reynolds et al., 2011). The
observed or expected values of costs (i.e., nominal prices) and benefits in the future will tend to
be higher because of inflationary pressures on prices. For example, the same program
resources purchased for $1,000 in the first year of implementation may cost $1,100 in the third
year of implementation because their price levels have risen. To account for the fact that the
value of a dollar (or other unit of currency) may be unstable across time, the researcher must
adjust the values of all costs and benefits to reflect the currency value in a single year (often,
the final year of implementation; Boardman et al., 2008; Hollands et al., 2020; Levin et al.,
2018). This is achieved by applying a reliable inflation index to translate the observed or
expected costs and benefits measured in nominal terms for each specific year into real terms
that reflect the currency’s unit value in the target year chosen. In the United States, the Bureau
of Labor Statistics (CPI-U) is commonly used. For international comparisons, the World Bank
national Gross Domestic Product Deflator is a reliable source.11
There may be specific circumstances under which prices used in education do not follow overall
inflation rates. For example, at the time of writing, the U.S. inflation rate is negligible, but
teacher shortages exacerbated by the coronavirus pandemic are likely to lead to teacher
salaries rising more swiftly than the CPI-U might suggest. Under such circumstances, the analyst
may need to apply a higher inflation rate to certain personnel prices based on observed salary
increases.
Not adjusting the values associated with costs and benefits for inflation can result in estimates
for recent periods that are too high relative to older periods (unless there is no inflation in the
relevant periods) or too high if current prices are applied to past resource use. The inaccuracy
11 The World Bank Gross Domestic Product Deflator data is available at https://data.worldbank.org/indicator/NY.GDP.DEFL.KD.ZG?locations=US.

Standards for the Economic Evaluation of Educational and Social Programs
AMERICAN INSTITUTES FOR RESEARCH® | AIR.ORG 26
resulting from a failure to adjust values for inflation will be greater the larger the inflation rate
and the length of the time period during which costs and benefits occur.
18. If the analysis combines data from multiple geographical locations within one
country, use national average prices or apply geographical indices to standardize
prices across geographical sites to avoid mixing local prices from one locality with
local prices from another. Prices from different countries should not be mixed.
Local prices from a particular geographical location may be useful to inform decision makers in
that same locality. However, if the purpose of the economic evaluation is to (a) compare
resource requirements and costs at different geographical locations or (b) inform decision
makers at a number of different localities within or across states, local prices should be
adjusted for comparability. For example, if the analyst collects prices from Texas, North
Carolina, and New York, the prices should all be adjusted to one of the states or to a national
U.S. price for comparability. Mixing prices from different localities conflates differences in
resource use with differences in purchasing power.
For an average cost estimate based on sites from multiple locations, the analyst may choose to
do one of the following:
• Apply prices from one locality to the resources used at all locations.
• Use state, regional, or national average prices to value resources from all localities.
• Adjust local prices from different localities to a common location using geographical price
adjustments. Two common indices used to adjust prices of educational resources include
the Comparable Wage Index developed by Lori Taylor (Taylor & Fowler, 2006) and the more
recent Comparable Wage Index for Teachers developed by Lori Taylor and staff from the
National Center for Education Statistics and the U.S. Census Bureau (Cornman et al.,
2018).12
For international comparisons of programs implemented in countries with similar purchasing
power parity (PPP), analysts should choose a single currency in which to express costs and use
stated market exchange rates to convert all prices to this currency. The analyst should conduct
sensitivity analysis to assess how the findings change depending on the rates used. For
economies with substantially different PPP, caution is warranted in making comparisons about
costs, benefits, and cost-effectiveness. The analyst should use a PPP exchange rate, while
acknowledging that the PPP may not be based on a basket of goods that reflects those used in
12 The Comparable Wage Index and Comparable Wage Index for Teachers data are available at https://bush.tamu.edu/research/taylor-cwi/ and https://nces.ed.gov/programs/edge/Economic/TeacherWage, respectively.

Standards for the Economic Evaluation of Educational and Social Programs
AMERICAN INSTITUTES FOR RESEARCH® | AIR.ORG 27
the program of interest and may therefore substantially distort its apparent price (e.g., by
expressing in U.S. prices; Dhaliwal et al., 2014, pp. 42–44).
19. When adopting a societal perspective, do not include monetary transfers when
calculating program costs, except for the costs of administering them. Instead,
account for monetary transfers when conducting a financial analysis of who pays
for or provides resources for program implementation or when conducting an
analysis from the perspective of the payers or recipients of the transfers.
For cost analyses conducted from a societal perspective, a monetary transfer (also known as a
transfer payment) generally does not use up any new resources or produce any new output and
thus does not represent a cost or a benefit in an economic sense. Instead, a transfer payment is
merely a financial transaction shifting the financial burden or benefits of a program between
stakeholders. For example, college students may pay a technology fee, thereby transferring the
costs of technology from the college to the student. However, this fee should not be counted in
addition to the original costs borne by the college. Although it is important to document
transfers, counting them as costs when taking a societal perspective increases the risk of
“double counting,” whereby the actual resources contributing to a program’s intended
outcomes and the means for paying for those resources could erroneously both be counted.
Transfer payments do not entail direct costs, but they may have indirect costs to society that
should be considered, including administrative costs and deadweight loss resulting from
behavioral distortions caused by the transfer mechanism (e.g., reduced economic output
caused by a lower incentive to work if taxes must be increased to provide revenue to fund a
program). When taking the perspective of a subset of stakeholders, for example, the taxpayer
or the individual, relevant transfer payments may be counted as costs or benefits (Levin et al.,
2018, p. 201).
20. Calculate summary cost metrics and any additional cost breakdowns identified in
the cost analysis plan.
The analysis should produce a series of summary metrics (Exhibit 2.4) that align with the
research questions, inform decision makers, and support the reporting standards outlined in
the Reporting the Results: Cost Analysis section. At a minimum, analysts should calculate the
total costs of the program (see Exhibits 1.1–1.4) and the average costs per participant. Total
costs are informative for considering the overall resource requirements to implement and
operate a program to achieve a change in the targeted outcome. Average per participant costs
are total costs divided by the number of participants. The count of participants and whether to
include those who have attritted from (dropped out of) the program and/or the study should
align with the research questions and any outcome metrics.

Standards for the Economic Evaluation of Educational and Social Programs
AMERICAN INSTITUTES FOR RESEARCH® | AIR.ORG 28
It is rare that costs per individual are available for educational programs. Even when they are,
they should be interpreted with caution because factors that influence costs such as dosage or
intensity may be related to unobserved characteristics of the individuals or subgroups (Crowley
et al., 2018). When available and appropriate, they can be presented but should include
cautions against causal interpretations of individual differences in costs.
When comparing the program to an alternative program or condition, analysts should present
incremental costs (or savings) of the program reflecting the difference in resource requirements
between the program and the alternative. In some cases, for example, when the program is
supplementing BAU, these incremental costs may be the same as the total costs (see
Exhibits 1.2 and 1.3).
When it makes sense for the research questions and relevant decisions, analysts should break
down costs by individual sites or clusters for multisite programs, again noting that site-level
cost differences may be influenced by unobserved factors, such as differences in the population
served (Bowden & Belfield, 2015).
For multiyear programs, the analyst should amortize (spread) start-up costs across the lifetime
of the program or, where applicable, the lifetime of the resources to present the economic
costs of the program. In addition, where helpful to inform potential implementers about the
initial investments required, a separate account of start-up costs can be calculated. However,
start-up costs should be excluded from a cost estimate that is provided to indicate what it
would cost to continue to operate an already-existing program.
21. Calculate a range of results to reflect systematic variation in implementation
and/or in the sensitivity of the cost estimates to different analytical assumptions.
To the extent possible, vary the assumptions that are most likely to alter results in
ways that are relevant to policy or practice or are the most uncertain.
Although costs often are viewed as measured with perfect confidence, as with the effectiveness
measures, they may vary systematically because of intentional or unintentional differences in
implementation and participants served or randomly because of various sources of uncertainty.
This can include (a) random uncertainty or error from site sampling that may not be
representative of all sites implementing the program or (b) measurement error resulting from
imprecision in the data collection instruments, missing data, or inaccurate reporting on the part
of respondents. It is useful for decision makers to understand the range of possible costs that
may be incurred to implement a program. Calculating and presenting the “best estimate” based
on the judgment of the research team as well as best case (lowest cost) and worst case (highest
cost) scenarios for the cost estimates can help decision makers anticipate possible variations in
resource use.

Standards for the Economic Evaluation of Educational and Social Programs
AMERICAN INSTITUTES FOR RESEARCH® | AIR.ORG 29
Analysts should address systematic variations in implementation by calculating a range of costs
to reflect the observed variation, for example, costs by site (e.g., Mastri & McCutcheon, 2015). If
there are relatively few units for which costs are calculated (e.g., schools, classrooms, individual
students), with a rule of thumb benchmark of approximately 10, then the range of costs across
sites itself can be used as high and low estimates. If there are a substantial number of sites
(more than 30 as a rule of thumb), a standard error can be computed by dividing the standard
deviation of costs across sites by the square root of the number of sites. Confidence intervals
can be generated by adding or subtracting an appropriate number of standard error units from
the mean cost. For example, for a 95% confidence interval, mean +/- (t0.05,df * standard error),
where t0.05,df is the critical t-value for a two-sided test with an error level of 5% and degrees of
freedom (df) equal to the number of sites minus 1 and must be looked up in a t-distribution
table.
Where uncertainty arises because the analyst must make assumptions, the analyst should
describe these assumptions and perform sensitivity analyses to demonstrate how the cost
estimates are affected, focusing on assumptions that are the most consequential for the
results. Sensitivity analysis can be performed by varying one or more variables in the analysis
about which there is uncertainty to investigate whether and how the cost results change. This
could include varying prices assigned to key ingredients if standardized prices have been
applied, for example, to reflect the possibility that some sites might employ a greater number
of veteran teachers, whereas others may experience higher turnover and employ newer
teachers with lower salaries. Alternatively, quantities of resources used and how they are
distributed could be varied, for example, assessing the cost implications of interventionists
working with groups of four students rather than pairs of students if the precise configurations
employed are unknown. For studies with long time horizons, varying the discount rate may
have a substantial impact on the results.
In a partial sensitivity analysis, the analyst varies one assumption at a time. If there are many
assumptions to be varied, the sheer number of possible combinations of parameter values can
become untenable, creating a large burden on the analyst and also producing so many
different results that make it difficult for the end user to interpret the findings. In these cases,
simultaneously testing several different assumptions at once to produce extreme values for a
range of estimates or, conversely, to determine at what levels of assumptions a relevant
decision might change (breakeven analysis) can be a more parsimonious way to address this
standard. Monte Carlo analysis can simultaneously vary several assumptions or parameter
values based on their probabilities.

Standards for the Economic Evaluation of Educational and Social Programs
AMERICAN INSTITUTES FOR RESEARCH® | AIR.ORG 30
Exhibit 2.4. Checklist of Cost Metrics to Calculate and Report
The analyst should calculate and report cost metrics, with ranges, as follows:
Summary metrics
The total costs of implementing and operating the program, that is, the value of all resources needed to introduce the program to supplement or substitute BAU in the context being studied (often the same as incremental costs relative to existing programming or BAU)
Average per participant, or per class, or per school costs as relevant
Alternative summary metrics to reflect systematic variation in implementation and the results of sensitivity analyses performed to test assumptions
Where applicable
Incremental costs compared with BAU or alternative programs serving the same purpose
Costs per site (e.g., school, district) with proposed explanations for observed variations
Cost breakdowns
In addition, where helpful and feasible to answer research questions or inform a decision, costs may usefully be calculated and reported by the following:
Category (e.g., personnel, materials and equipment, facilities, other inputs)
Stage of program (e.g., start-up versus maintenance/steady-state/ongoing operation)
Program year for multiyear programs
Funding status (e.g., new expenditure, reallocation of existing resource, in-kind)
Funding source (e.g., school’s general funds, district office discretionary funds, federal grant, volunteers)
Percentage of the burden of costs borne by each stakeholder or agency (e.g., federal government, district office, school, families)
Major program components
Subgroups of participants served
22. Determine and clearly document the populations and contexts to which the
analysis is generalizable, as well as factors that could affect generalizability (e.g.,
sample served, local market conditions and resource availability, relative price
levels and currency conversions, time period over which implementation occurred).
In addition to the usual considerations for generalizability, such as the population served, local
conditions, and the time period during which implementation occurred, the analyst should
determine and document any factors that may affect the availability and prices of resources
needed to implement the program being evaluated (e.g., the availability of key resources at
market prices, relative price levels, and currency conversions, if relevant). The analyst should
note any resources used at the study site(s) that may be more difficult to procure elsewhere.
For example, if volunteers are an important resource at the study site(s) but may need to be
replaced by instructional aides elsewhere, this would have important implications for costs at
other locations.

Standards for the Economic Evaluation of Educational and Social Programs
AMERICAN INSTITUTES FOR RESEARCH® | AIR.ORG 31
23. For established programs being considered for scale-up, determine which resources
incur fixed, variable, or lumpy costs and estimate the marginal costs of serving an
additional participant or site at a specified scale.
To scale up a program, it is necessary to know the additional quantities of each resource
needed to serve additional participants. Resources for which the quantity required remains
constant regardless of the number of participants being served within a given context represent
fixed costs (e.g., time dedicated by a district assistant superintendent to supervising a particular
program). Resources for which the quantity varies directly in proportion to the number of
participants served represent variable costs (e.g., student workbooks). Resources for which the
quantity steps up at intervals represent lumpy costs (e.g., an additional teacher and classroom
needed for every 26th student).
The marginal cost of serving one additional unit will likely depend on what margin is in
question, such as one additional student, classroom, school, or province. Marginal costs may
be nonlinear because the marginal cost at one level of production may be significantly higher
than at other levels (e.g., the marginal cost of adding one student to a class may be trivial for
the first 25 students but then substantial for the 26th student if an additional classroom needs
to be opened).
The observed marginal cost can inform scale-up within modest changes to scale, but with larger
changes, the observed marginal cost alone will not be sufficient to assess scaling costs for two
reasons:
• At vastly different scales, programs may feature economies or diseconomies of scale
because of operational efficiencies (e.g., shared management, bulk purchasing, sharing best
practices across many sites) or inefficiencies (e.g., a program becomes so large that it
becomes unwieldy to manage).
• These standards assume that most programs in question are small enough to be “price
takers” on a market and thus do not have general equilibrium effects on the market itself
(i.e., they do not cause changes to market prices), but sufficiently large programs, such as a
statewide class size reduction, will alter market supply and demand and have dynamic
effects on market prices.
24. Optional/advanced standard: Gather empirical evidence and conduct analysis on
the representativeness and generalizability of the cost analysis sample and context
under study.
To generalize cost estimates from one study context to another, factors that substantially affect
costs must be similar in both. For example, if the level of student need is a factor that strongly

Standards for the Economic Evaluation of Educational and Social Programs
AMERICAN INSTITUTES FOR RESEARCH® | AIR.ORG 32
influences cost through intensity or dosage of treatment, measures of the level of need for the
sample should be documented and then compared with those measures in a broader
population and in any new contexts to which the program is being considered for adoption.
25. Optional/advanced standard: Ensure that the results are replicable by performing
cost analyses repeatedly in identical or similar contexts.
CA often relies on numerous assumptions about the use of resources. To check the validity of
cost results, multiple analysts could independently conduct CAs of the same implementation or
perform analyses across multiple sites with similar contexts, implementation, and participants
to determine if the estimated costs are consistent and similar across sites. Demonstrating the
replicability of the CA results will help assure their credibility.
Reporting the Results: Cost Analysis
26. Provide a report on the cost analysis, including the study motivation and context,
descriptive information about the program analyzed and any comparison
conditions, and cost analysis design choices.
The analyst should provide a CA report that addresses the elements listed in Exhibit 2.1 to
clearly communicate the study findings, promote comparability, and allow for an evaluation of
the study’s credibility and replicability. This may be incorporated within the report of a broader
study, such as an implementation analysis or an impact study.
27. Provide summary cost metrics and any additional cost breakdowns identified in the
cost analysis plan. In addition, provide data spreadsheets to facilitate replication of
results.
CA results should be useful to decision makers at the study site and other locations that may be
considering program implementation in their own settings. Providing an array of summary
metrics and breakdowns of costs (Exhibit 2.4) will facilitate use of the CA results to inform
decisions and compare alternative programs. In addition, to facilitate replication of the CA
results, the analyst should make available spreadsheets of cost data and analysis (Exhibit 2.5).

Standards for the Economic Evaluation of Educational and Social Programs
AMERICAN INSTITUTES FOR RESEARCH® | AIR.ORG 33
Exhibit 2.5. Cost Data and Analysis Information to Include in Reporting Spreadsheet
The list of resources required to implement the program
The quantity of each resource needed, unit of measure, and source of these data
The percentage of each resource used for the program
The useful lifetime of durable/nonconsumable resources (e.g., 30 years for buildings, 3 years for computers) and the depreciation formula used
The unit price of each resource in the original currency, aggregated only if needed to mask sensitive information; source of price including, where possible, a URL to each publicly available price source
The currency in which the results are presented, year(s), the geographical location to which the prices are relevant, and any currency exchange rate used
For example, for personnel, the analyst should report the number of full-time-equivalent
positions; wages; and, where relevant, fringe benefits. Additional labels for each resource in the
spreadsheet may be useful to facilitate cost breakdowns relevant to the decisions being
informed.
Disaggregating cost results to the level of individual inputs will allow others to replicate the
analysis or estimate the costs of implementing the program in different contexts. For
international evaluations, detailed results permit other analysts to apply different exchange
rates when creating comparative analyses that draw on evidence from multiple countries.
Where necessary to avoid sharing information that may lead to the identification of subjects or
sites, the analyst should consider providing generic descriptions or position titles that are not
unique to a particular education agency (e.g., “senior K–12 district administrator” instead of
“area superintendent”). Alternatively, the analyst may group personnel to avoid isolating
unique positions within the education agency.
28. Costs or savings not directly associated with resources used to implement and
operate the program or that arise after the program period should be reported
separately as induced or averted costs.
Program participants may need more or fewer services from other sources as a result of the
program (Bowden et al., 2017). Costs related to these other services are termed “induced” or
“averted” costs, respectively. They are not costs of implementing the original program and,
therefore, are not included in the cost metrics for a cost analysis of program implementation.
However, it is important to recognize any resources needed to fully realize the goals of the
program because these are relevant to decision makers and are included in CEAs or CBAs. If
decision makers are unaware of the interdependencies of various services, they will not have a
full picture of the resources needed to produce the intended outcomes of the program being
evaluated. This may lead to a lower success rate for the program if important follow-up services

Standards for the Economic Evaluation of Educational and Social Programs
AMERICAN INSTITUTES FOR RESEARCH® | AIR.ORG 34
are unavailable. On the other hand, if decision makers are unaware of potential savings from a
reduction in the need for other services, they may decide against implementing a potentially
effective program.
When conducting CAs, the CASP recommends that analysts document and report induced or
averted costs separately from the costs of program implementation. In CEAs, any induced (or
averted) costs that contribute to the production of the observed effect are included in the cost
estimate. In CBAs, induced costs should be included as negative benefits, and averted costs as
positive benefits (Crowley et al., 2018; Karoly, 2012).
29. Report the major sources of uncertainty in the analysis.
The analyst should describe sources of uncertainty that may significantly impact the cost
estimate. It is important to document assumptions, strategies applied to handle missing data,
and any known omitted costs that could influence the results (i.e., cause over- or
underestimation of the costs). The analyst should describe the sensitivity analyses conducted to
test assumptions, reporting the alternative summary metrics produced by the sensitivity
analysis and indicating whether these point to different conclusions (Crowley et al., 2018;
Karoly, 2012).
30. Present conclusions, recommendations, and limitations of the study and discuss the
generalizability of the results to other populations and localities.
Study findings may be used to support recommendations about implementation at the study
site itself, for example, whether to continue the program, modify delivery, or scale it up to
serve more students at the same or nearby schools. The analyst can provide useful information
to local decision makers and implementers by identifying key cost drivers and using sensitivity
analysis to demonstrate how costs would vary under different scenarios. Studies that compare
the costs of implementing different programs serving the same purpose can help decision
makers optimize the use of resources. However, analysts should ensure that the costs of each
program are measured under similar implementation contexts (Crowley et al., 2018).
The analyst should comment on the generalizability of findings to other contexts, including
other geographical locations, populations, or levels of scale. The analyst should note any special
conditions at the study site(s) (e.g., lack of public transportation; a glut of high school STEM
[science, technology, engineering, and mathematics] teachers) that may not prevail elsewhere.
This will improve the decision maker’s ability to determine the feasibility of implementing the
program with fidelity in a different setting.

Standards for the Economic Evaluation of Educational and Social Programs
AMERICAN INSTITUTES FOR RESEARCH® | AIR.ORG 35
31. For established programs being considered for scale-up, the analyst should
categorize and report costs as fixed, variable, or lumpy at the scale of operation
studied and report the marginal costs of serving an additional participant,
classroom, school, or site. The analyst should indicate the relevant increments for
lumpy costs (e.g., a classroom space is required for every 25 students) and at what
point of program expansion (or contraction) a fixed cost would change.
If a program is deemed successful at achieving its intended outcomes, it is important for
decision makers to understand how resource requirements may vary if they decide to serve a
different number and set of participants (e.g., to scale up the program). By labeling costs as
fixed, variable, or lumpy and reporting the marginal costs of serving additional participants, the
analyst can help the decision maker assess whether scale-up is feasible and if participants may
experience any economies or diseconomies of scale.

Standards for the Economic Evaluation of Educational and Social Programs
AMERICAN INSTITUTES FOR RESEARCH® | AIR.ORG 36
Chapter 3: Cost-Effectiveness Analysis Standards
Introduction to Cost-Effectiveness Analysis Standards CEA combines effects with costs to examine the comparative efficiency among program
alternatives to address a common goal (Levin, 1975). This metric requires the estimation of the
costs to achieve the effects observed. In this type of economic evaluation, estimated effects
and costs reflect the difference between treatment and control (i.e., incremental). CEA informs
future efforts to replicate an effective intervention by detailing the resources provided to
achieve the effects and examine comparable interventions. To accomplish these goals, the CEA
standards focus on two main objectives: transparency and comparability.
• Transparency. CEA requires transparency in how the study was designed, the assumptions
made, and the estimates produced. Transparent reporting is necessary to assess the quality
of the research, support replication and program adaptation efforts by providing clear
information on the costs to produce the effects, and assess the comparability of results
across evaluations.
• Comparability. CEA compares the costs to produce the effects of alternative interventions
that address common outcomes. Thus, a second requirement of any CEA is to consider the
comparability of estimation methods and results from a given study to existing literature or
across program alternatives. For domestic studies, using the recommended reference case
strengthens the comparability of costs across evaluations. The reference case, as discussed
in this document, is fundamental to the goal of comparability. Thus, the CEA standards
complement the reference case, especially the application of the principle of opportunity
cost by including all ingredients and costs, regardless of who finances them. The standards
in this chapter were written with the intention that comparability for methods should be
considered during all stages of conducting a CEA.
The following standards are substantially informed by the work of Henry Levin and the textbook
on economic evaluation in education and the topic of cost-effectiveness, Economic Evaluation
in Education: Cost-Effectiveness and Benefit-Cost Analysis (Levin et al., 2018). The CEA
standards assume that costs were estimated following the standards set out in Chapter 2.
Evaluation Design: Cost-Effectiveness Analysis
32. At the design phase, a cost-effectiveness analysis should be embedded within an
experimental or quasi-experimental evaluation of the focal intervention (i.e.,
program, policy, or practice).
In CEA, the plan to estimate costs should be designed in conjunction with the plan to estimate
effects and other components of an evaluation to ensure that the costs correspond to the

Standards for the Economic Evaluation of Educational and Social Programs
AMERICAN INSTITUTES FOR RESEARCH® | AIR.ORG 37
effects (Bowden, 2018). Ideally, data on the characteristics and quantities of the ingredients or
resources allocated during an effectiveness study should be collected during program delivery
to accurately measure the costs of implementation. Data collection is generally more efficient
when cost data are considered together with data needed to observe implementation. If site
visits, interviews, surveys, and other data collection activities can be combined or aligned,
participant burden is minimized. Also, when the cost component is planned along with the
effectiveness and fidelity components of an evaluation, the components are more easily
connected to describe the production of effects and related observed variation.
33. The primary outcome(s) from the impact evaluation to be used in a cost-
effectiveness analysis should be identified at the design phase and aligned with the
program’s theory of change. The outcomes should be (a) meaningful for the study’s
audience and (b) permit comparison of the cost-effectiveness results to those from
other impact evaluations.
Following the theory of change, the primary, secondary, and exploratory outcomes that will be
used to estimate effects should be clearly identified during the design phase of a CEA. The goal
is to prevent the positive selection of outcomes that produce the most promising results but
may not be well aligned with the intended program outcomes documented in the theory of
change. Ideally, the plan to observe outcomes and estimate costs and effects should be
preregistered (e.g., in education, see the Registry of Efficacy and Effectiveness Studies13). The
outcomes selected also should be of interest to the key audience(s) to which the evaluation is
directed, which may include policymakers, practitioners, funders, or other interested
stakeholders. Outcomes that are policy relevant or meaningful for the study’s audience are
prioritized in CEA because the purpose of this type of evaluation is to inform decisions among
intervention alternatives.
The selection of which outcomes to measure in an evaluation is important because cost-
effectiveness is determined by comparing ratios of costs to effects among interventions that
target equivalent outcomes. If the outcomes measured are overly aligned with a specific
intervention, the broader implications of any effects are difficult to interpret, and the
comparability of that effect to other interventions is then limited. For example, a teacher
training program that is tested using a measure developed by the intervention team to
specifically observe fidelity of implementation of the content of the intervention is overaligned,
leading to biased results (What Works Clearinghouse, 2020). This creates limitations in the
interpretation of the effectiveness results for a broader policy audience and in the
13 For more information about the Registry of Efficacy and Effectiveness Studies, please visit https://sreereg.icpsr.umich.edu/sreereg/.

Standards for the Economic Evaluation of Educational and Social Programs
AMERICAN INSTITUTES FOR RESEARCH® | AIR.ORG 38
comparability of the study’s effects to another intervention’s effects. However, if studies of
both interventions identify a policy relevant outcome as the primary outcome, the studies are
more easily interpreted for resource allocation decisions and more easily compared in CEA.
34. Identify alternative programs with evidence of effectiveness on the primary
outcome(s) being studied to establish relevant comparisons for the evaluation’s
effects and costs, when available.
Available literature on prior evaluations of program costs and effects, as well as literature on
alternative interventions that target equivalent outcomes, should be reviewed at the design
stage. Because CEA is inherently comparative, when estimating the costs and effects within any
given study, the literature on credible alternatives for the program being evaluated is important
to document early in the evaluation process. Depending on the literature base, this may
establish a comparison set against which to interpret the results of the evaluation.
35. To the extent possible during design, describe what the intervention will be
compared to in the evaluation, often a control or a business as usual condition, and
the expected difference in resource requirements between the treatment and
control conditions.
The design of an evaluation of costs and effects should clearly state which conditions are being
compared (NASEM, 2016). This is important because the cost and effectiveness estimates
reflect the incremental differences in costs and outcomes, respectively, between conditions.
During the design phase, data collection should be planned based on the theory of change and
the expected programming being provided (or lack thereof) to the control group or the BAU
condition. The evaluation also will be strengthened by having a clear description of the design
of the intervention under study, the plan for its implementation, and expected changes it may
cause in access to or use of other resources. Knowing this will be helpful in planning the data
collection and analysis (Bowden, 2018). If there are no corresponding services provided to the
control condition, then the cost value of that condition is zero.
36. The sample design to estimate effects should guide the sample design for the cost-
effectiveness analysis to ensure that costs are estimated using observations that
are representative of the effectiveness study sample. Ideally, costs and effects will
be estimated using data observed from all units in the sample.
In CEA, the measured costs must reflect the resources used to produce effects. If the sample
from which data on costs are gathered is not representative of the sample from which effects
are estimated, then any cost-effectiveness ratio created from these two numbers may be biased
in unknown directions and potentially misleading. Thus, the sample used to estimate

Standards for the Economic Evaluation of Educational and Social Programs
AMERICAN INSTITUTES FOR RESEARCH® | AIR.ORG 39
incremental costs should be representative of the sample for which effects are estimated, such
that the incremental cost estimate accurately reflects the resources expended to produce the
given effects (whether in the full sample or a subgroup thereof). In cases where only a subset of
schools or sites is used to determine costs, researchers should document how the subsample of
cost sites was selected and provide information on the comparability of the subsample of sites
to the larger sample in terms of implementation factors, such as staffing or intervention dosage.
37. The sample design for the cost study should facilitate the estimation of cost-
effectiveness ratios for subgroups when the theory of change indicates variation
(heterogeneity) in expected effects among evaluation groups or when the
evaluation prespecifies subgroup analyses. Cost estimates from one subgroup
should not be substituted for estimates from another subgroup when calculating
subgroup cost-effectiveness ratios.
Information on the heterogeneity of effects and costs across subgroups may be important for
answering questions among the study’s audience, for instance, where a decision maker is
particularly concerned that students who are marginalized show gains in skill development
equivalent to or larger than other groups. Where the study objectives include questions about
whether an intervention is more or less cost-effective for different subgroups or across
different sites, the groups/areas of interest must be clearly identified to design the sampling
strategy so that the overall cost estimate and cost-effectiveness ratios can be examined for
variation across these different subgroups.
The sample size required to detect differences in effects, including cost-effectiveness, among
participant subgroups may be beyond the scope of some evaluations. In these instances, the
CASP recommends transparently stating the aims of the intervention to improve outcomes
among subgroups and the limitations of the sample as designed.
Data Collection: Cost-Effectiveness Analysis
38. Cost data should be collected to reflect the same intervention implementation and
treatment contrast as the outcomes data used to estimate effects. Approaches for
collecting costs and outcomes should be similar between the treatment and control
conditions.
Following the theory of change, data on costs and effects should be collected from the same
implementation of an intervention to identify treatment contrast (also called achieved relative
strength). The treatment contrast in resources reflects the difference between what the
treatment group received and the control group or the BAU condition. In an experimental
design, this difference is what produces the estimated effect. The data must reflect the same

Standards for the Economic Evaluation of Educational and Social Programs
AMERICAN INSTITUTES FOR RESEARCH® | AIR.ORG 40
implementation and contrast to correspond to the production of effects and support the
combination of costs and effects into a cost-effectiveness ratio.
The cost estimate used in a cost-effectiveness ratio is the difference in costs between the
treatment and control conditions, reflecting the production of estimated effects. The methods
used to estimate costs should be consistent across the experimental or evaluation conditions to
ensure that the relative cost estimate accurately reflects the differential resources that led to
the change in outcomes.
39. Data on costs and effects should be collected on the number of participants who
did and did not receive the treatment in both the treatment and control groups.
In CEA, costs and effects must be converted to common units (e.g., at the student, school, or
teacher level). Calculating an average cost per student requires information on the number of
participants and how the sample that received treatment changed across time. Thus, accurately
estimating the cost to achieve an effect requires gathering data on the number of participants,
noting attrition (What Works Clearinghouse, 2020), contamination, and dosage. These data will
be needed to calculate per participant costs, which may vary depending on how the sample is
used to estimate effects, including intent-to-treat, treatment-on-the-treated, and dosage
analyses. In many evaluations, there is imperfect compliance with the offer of a treatment. Not
all schools or students in the treatment group receive the offered treatment, whereas some
may receive it in the control group (though not intentionally).
If an intervention serves more individuals or sites than the sample being used for an impact
evaluation, the study should collect the data necessary to allocate the relevant proportion of
any costs related to serving the total population to individuals in the study sample. For
example, if a study is conducted in 40 schools but the program office serves 60 schools, the
analyst should inquire with the program office about how their resources are allocated among
the 40 and 60 schools. If the program office reports allocating time and resources equally
across all 60 sites, the program office resources must be appropriately apportioned so that
1/60th of those resources are attributed to a site rather than 1/40th. Another example may be
teacher coaches. If 20 teachers are in the evaluation sample, but each coach served
20 additional teachers who were not in the study, the effect of the coach is the result of a
caseload of 40 teachers, and the coach time per teacher should be calculated using the full
caseload rather than the smaller sample in the evaluation. Again, this requires investigating
whether the coaches distributed their time equally among their total caseload or allocated
different amounts of time to each teacher.

Standards for the Economic Evaluation of Educational and Social Programs
AMERICAN INSTITUTES FOR RESEARCH® | AIR.ORG 41
40. If the theory of change indicates that the intervention may induce changes in other
services that likely will affect the outcomes of interest, data on these induced costs
should be collected for both the treatment and control conditions to include these
indirect changes in costs as a component of the cost to produce an effect.
Cost data should be collected for all components of an intervention theorized to produce the
target outcomes, including core components, enhancements, and induced costs (Bowden et al.,
2017). Between the first implementation of the intervention and the measurement of effects,
other inputs or services in the wider system that also influence the outcome may be changed as
a result of the intervention. These changes in costs should be considered relevant for the
production of the outcome. For example, if a reading curriculum reduces the need for other
supplemental programs that support literacy skill development, the reduction in supplemental
support should be reflected as induced cost savings. Another example is a high school
intervention that causes more students to enroll in postsecondary programs and then graduate
from college. The costs to attend postsecondary programs were induced by the program and
are required to achieve the effect on college completion.
The timing of changes in other services that mediate the effect should be noted so that
analyses can be conducted that align costs with effects at various time points.
41. Outcomes should be measured with policy-relevant instruments that are
appropriate for the theory of change and the grade level or age group of interest.
Effectiveness studies designed to inform future implementation of the intervention should
collect outcome data using measurement tools that are relevant for both policymakers and
decision makers (Levin & Belfield, 2015). Widely available tests or tools that are reliable and
valid should be used whenever possible (What Works Clearinghouse, 2020). Using common
measurement instruments encourages appropriate comparisons across evaluations of the same
intervention or alternative interventions that target equivalent outcomes. For example, an
educational program must use an instrument that is appropriate for the grade level or age
group of interest. If an outcome of interest does not have a well-tested, widely available
measurement tool, then the analyst should be very transparent about the measure’s properties
(reliability and validity) and the limitations of using a measure developed by the study team.
A proximal or specific measure may lead to larger effect estimates than a more widely used
assessment as a function of the timing of the test or the overalignment between what is tested
and what was taught (What Works Clearinghouse, 2020). This would result in a more attractive
cost-effectiveness result as a function of the assessment rather than a true reflection of the
intervention’s effects (Levin & Belfield, 2015).

Standards for the Economic Evaluation of Educational and Social Programs
AMERICAN INSTITUTES FOR RESEARCH® | AIR.ORG 42
42. When studying an outcome that would appropriately be aggregated across
multiple years (e.g., earnings), it is useful to collect data on the outcome across
time to allow for the discounting of effects.
Data collection should include information about the time periods when the outcomes were
observed. When conducting a comparative CEA and additive outcomes occur across time, then
it is necessary to discount the effects. Similar to costs, an effect of the same magnitude
occurring in an earlier year is preferable to one in the future; therefore, those that occur later
should be discounted (Levin et al., 2018, pp. 135–136). This is especially important when effects
may not be the same at each time period during the study because of fade-out or ratchet-up
effects of the treatment. Collecting year-disaggregated effect data enables the analyst to
appropriately conduct time discounting during analysis.
43. When subgroup analyses are planned, gather outcome data to allow for
disaggregation and analysis by subgroups and assessment of the distribution of
effects.
When subgroup analyses are planned, the study requires robust estimates of impacts for
subgroups to estimate group-specific cost-effectiveness ratios. When conducting a study that
involves multiple sites or contexts and includes subgroup analysis, analysts should collect data
on the demographics of the samples at each site and the resource levels across contexts if they
plan to examine differences within the sample among sites or across treatment groups.
If subgroup analyses are described as important research questions in an evaluation’s design, it
is critical to collect data during the study to address these questions and report variation
(heterogeneity) of effects and costs, especially when examining historical legacies of disparate
outcomes or inequality.
Analyzing the Data: Cost-Effectiveness Analysis
44. Effects should be estimated using an appropriate research design that rules out
common threats to internal validity and allows for causal interpretation. The
effects should be standardized to facilitate comparisons with effects from other
studies.
CEA is a tool to aid decision making and support comparisons of alternative interventions that
improve equivalent outcomes. To support comparisons and produce internally valid results, the
effectiveness estimate must be identified causally following widely approved standards based
on the type of study design (e.g., following What Works Clearinghouse standards; What Works
Clearinghouse, 2020). Effects are estimated relative to a control condition or other treatment
arms.

Standards for the Economic Evaluation of Educational and Social Programs
AMERICAN INSTITUTES FOR RESEARCH® | AIR.ORG 43
One option is to leave the effects in the natural units of measurement. For example, earnings,
years of schooling, credits earned, and days attended would all be easily translatable and
comparable across studies to examine the cost-effectiveness of interventions targeting these
outcomes. When an outcome is continuously measured, such as academic skill development, it
is common to convert effects into standard deviation units using an appropriate method to
produce standardized effect sizes. Other policy-relevant units that support comparisons across
evaluations also are helpful and should be explained for transparency and comparability.
45. Standard errors for measures of effectiveness should be reported to correctly
account for design issues, such as cluster-randomization, and report tests of the
null hypothesis where the observed effect is zero.
The standard error of effect estimates always should be reported. When an adequate number
of cost estimates is available (e.g., for multiple schools), CEA would ideally include confidence
intervals for the incremental cost estimate(s) and the resulting cost-effectiveness ratios (e.g.,
see Fieller’s theorem as a sensitivity test for CEA in education [Levin et al., 2018, pp. 257–258]
and health [Briggs et al., 2002]). This allows analysts to assess whether estimates of ratios differ
in their magnitudes and whether these differences are statistically distinguishable from zero
(i.e., whether the study provides evidence of a significant advantage in cost-effectiveness of a
particular intervention).
46. Estimated costs to produce effects should be based on the incremental costs (i.e.,
the differences in resources used) between the treatment and control conditions.
Costs should be analyzed to reflect the cost of treatment minus the cost of the control to reflect
the incremental resources that produced the incremental effect.
47. Analyze the distribution of costs incurred by different stakeholder groups.
Multiple stakeholder groups may contribute resources used in delivering the program. The
types and number of stakeholders may vary widely across studies. In education, this may
include costs borne by the school for reallocating classroom space or teacher time, purchasing
materials, and hiring substitute staff; costs borne by volunteers for providing tutoring, traveling
to the school, or time for training; costs borne by community partners for providing
supplemental or extracurricular supports for students or presenting during a career fair; costs
borne by external providers for donated goods; and costs borne by programs to provide the
intervention. Costs also may be considered across agencies within a state or other jurisdiction
to explore the contributions from each partner to deliver an intervention.
This is an important component of CEA because it demonstrates the distribution of costs to
clearly describe how the resources or ingredients were provided (Levin et al., 2018). Cost

Standards for the Economic Evaluation of Educational and Social Programs
AMERICAN INSTITUTES FOR RESEARCH® | AIR.ORG 44
distributions complement cost estimates and inform replication efforts by specifying how
economic costs are allocated across stakeholders. Any one stakeholder bears a portion of the
cost, and that breakdown allows stakeholders to explore the resources they will need, including
those from external partnerships, to deliver the intervention. For example, if a school is
considering an intervention that requires volunteer tutors, the school’s decision-making
process can evaluate the intervention’s feasibility by considering whether there is an adequate
local supply of volunteers or if the school needs to hire aides to fulfill this role.
48. The cost-effectiveness ratio should be constructed using estimated effects on the
primary outcome(s) identified at the design phase.
‒ When a study has multiple primary outcomes, especially across different
domains (e.g., health and education), there should be multiple cost-
effectiveness ratios, each including the full cost per participant in the
numerator.
‒ In cases of prespecified subgroup analyses, cost-effectiveness ratios should be
calculated for each subgroup.
Cost-effectiveness ratio(s) are calculated by dividing the estimate of incremental costs by the
estimate of effectiveness, using corresponding units (e.g., per student) for both costs and
effects. The primary outcome(s) should be used in calculating the ratio to ensure that the ratio
reflects the main outcome that was intended to be changed by the intervention according to
the theory of change. The CASP recommends this to encourage transparency and support
future comparative analysis.
Because of concerns of validity of the resulting ratio, it is best if the cost-effectiveness ratio is
calculated by the team evaluating the intervention rather than presenting costs and effects
without calculating the ratio. The evaluation team is the closest to the theory of change and the
implementation of the intervention during the study period and thus is best informed to
calculate the ratio and report any limitations of the metric. Otherwise, retrospective
calculations of cost-effectiveness ratios may introduce bias unknowingly by creating a metric
(e.g., the cost-effectiveness ratio) with costs that do not correspond to the effects reported.
In the event that an intervention has multiple primary outcomes, a ratio can be calculated for
each outcome, where the estimated incremental cost is divided by each estimate of
effectiveness. Costs should not be apportioned across outcomes because the costs reflect the
intervention and the inputs that resulted in the effects. The costs cannot be arbitrarily divided
without accompanying tests of effects.

Standards for the Economic Evaluation of Educational and Social Programs
AMERICAN INSTITUTES FOR RESEARCH® | AIR.ORG 45
When subgroup analyses are conducted, the cost-effectiveness ratios for each subgroup should
be calculated. This may not be feasible in some studies, but, if possible, an analysis of the costs
and effects per subgroup allows for the examination of efficiency within the study’s
subpopulations to examine equity.
49. Analyze variation in costs that are caused by differences in program scale, market
fluctuations, or intervention dosage because these aspects of delivery relate to
effectiveness.
Costs may vary in ways that are important for interpreting the average cost estimate and the
cost-effectiveness ratio. Sensitivity analysis should be conducted of the incremental costs and
resulting cost-effectiveness ratio for different factors that may influence the average cost
estimate (e.g., program scale, variation in local markets that may drive price differences, or
intervention dosage) to inform future iterations of the intervention.
50. Analyze uncertainty in costs, effects, and cost-effectiveness to identify what may
be caused by model uncertainty, structural uncertainty, heterogeneity,
measurement error, or stochastic uncertainty.
It is important to analyze the uncertainty surrounding estimates of costs, effects, and cost-
effectiveness. When possible, analysts should identify sources of uncertainty (as defined in the
glossary: model uncertainty, structural uncertainty, heterogeneity, measurement error, or
stochastic uncertainty) and provide information about the implications of that uncertainty to
ensure that the results are interpreted and used with appropriate caution. At a minimum, a
study should provide good documentation of assumptions and limitations to support
transparency and thereby strengthen the validity of the findings.
Reporting the Results: Cost-Effectiveness Analysis
51. Report corresponding incremental costs and effects in the same unit of analysis
with descriptions of what was received by the control or comparison group.
Describe the groups to which the costs and effects pertain and likely limits to their
generalizability.
CEA reports must include a description of the results, details on the intervention, and study
methods. Providing this information is critical to give others confidence in the reliability of the
results and make it possible for future analysts to use the information on the studied
intervention in comparative analyses.

Standards for the Economic Evaluation of Educational and Social Programs
AMERICAN INSTITUTES FOR RESEARCH® | AIR.ORG 46
Costs and effects should be reported incrementally, relative to a control or another condition.
The control or comparative condition should be described to promote transparency and allow
the work to be assessed for rigor and feasibility in new contexts.
To compute a cost-effectiveness ratio, costs and effects must reflect the same unit of analysis
(e.g., student, class, school, or site). For example, if effects are estimated at the student level,
costs should correspondingly be reported at the student level, for the same group of students
(e.g., students offered treatment).
When costs are reported per student or school on average, the computation and underlying
assumptions should be stated for transparency. Sensitivity analyses, robustness checks, and
explorations of uncertainty should be reported. In addition, where possible, the generalizability
of results should be reported.
52. Following the reporting of costs and effects, a cost-effectiveness ratio should be
reported for primary outcome(s). When effect sizes for primary outcomes are
statistically indistinguishable from zero, it is not appropriate to calculate a ratio
except when the null effect is precisely estimated to be zero.
The cost-effectiveness ratio(s) that reflect(s) the costs and effects found in the evaluation
should be reported. Where a study finds null results for effectiveness, the analyst should
attempt to distinguish between null results that reflect a precise estimation of zero impact
versus null results that reflect imprecise estimation of a plausibly positive or negative impact.
Precisely estimated zeroes should be interpreted as showing “no effect,” whereas imprecisely
estimated zeroes should be interpreted as not providing evidence for or against cost-
effectiveness.
53. Report variance in costs and effects and discuss the main sources of variation in
costs (e.g., scale, input prices). Discuss the implications for that intervention’s cost-
effectiveness across a plausible range of values in those factors.
When possible, the sources of variation in costs and effects should be reported. For example,
the scale at which costs and effects are observed should be reported because scale can affect
the cost-effectiveness estimates, especially for programs with a high proportion of fixed costs.
For example, a cost-effectiveness study of a reading program implemented in Pakistan showed
that the fixed costs of program monitoring and oversight at the district level did not change
based on the number of schools in each district. As a result, the fixed costs per child were five
times higher in districts with fewer than 50 schools than in districts with more than
300 schools representing the existence of economies of scale. Another example is input prices.
If sensitivity testing shows that the price value selected for an ingredient changes the

Standards for the Economic Evaluation of Educational and Social Programs
AMERICAN INSTITUTES FOR RESEARCH® | AIR.ORG 47
magnitude of the cost estimate or the conclusion of a comparison among cost-effectiveness
ratios, this information must be clearly reported.
54. Outcomes targeted by the intervention but not included in the evaluation should be
clearly listed with justification for not including them in the analysis.
An intervention might target multiple outcomes that may be primary, secondary, or
exploratory. Some outcomes may be proximal, whereas others may be distal, and they may
carry varying weights in decision making. A critical aspect of CEA is to transparently report all
outcomes indicated in the theory of change, even if all outcomes may not be included in an
evaluation of the program’s effects (Belfield & Bowden, 2019). In this case, the excluded
outcomes should be reported with a justification for not including them in the analysis, which
will support future comparisons of the results.
55. A comparative cost-effectiveness analysis compares reported costs, effects, and
cost-effectiveness ratios, often across different studies, of two or more
interventions that target equivalent outcomes. When comparing cost-
effectiveness, costs and effects should be plotted on a cost-effectiveness plane in
addition to presenting costs, effects, and cost-effectiveness ratios in a table.
A comparative CEA compares estimates of costs, effects, and cost-effectiveness ratios for
alternative programs that target equivalent outcomes. These studies often rely on reported
results from multiple evaluations. These results can be used to suggest judgments about the
relative cost-effectiveness of alternative uses of resources.
As a primary condition, the validity of the comparison must be established by reporting
decisions and assumptions to demonstrate that costs and effects are comparable. Although
comparative CEAs merit standards, careful design, and reporting in their own right, a section
devoted to comparative CEA would simply repeat the standards listed earlier. Thus, we intend
for comparative CEAs to rely on the standards previously presented. The discussion here
focuses specifically on comparative aspects that warrant special attention. For more in-depth
consideration of the risks and complexities of comparing cost-effectiveness ratios, readers
should turn to Levin et al. (2018) and Levin and Belfield (2015).
As stated earlier, when only a single ratio is reported from an evaluation, other cost-
effectiveness ratios available in the literature from evaluations of the same or competing
interventions with equivalent outcome measures should be discussed. In a multiarm trial, cost-
effectiveness comparisons are embedded within the design because the study yields at least
two cost-effectiveness ratios that can be compared.

Standards for the Economic Evaluation of Educational and Social Programs
AMERICAN INSTITUTES FOR RESEARCH® | AIR.ORG 48
When comparing cost-effectiveness ratios, costs and effects should be estimated and reported
similarly, relying on similar assumptions. Analysts should note clearly when comparability is
limited. Exhibit 3.1 identifies criteria to guide reporting for a comparative CEA to demonstrate
the validity of the comparison. For example, effects should be measured in consistent ways
(e.g., policy-relevant or widely available and validated measures), effects should be reported in
consistent ways (e.g., consistent units, standardized effects, effect sizes), and costs should be
measured using similar assumptions (e.g., approach to missing data because of model
uncertainty, the discount rate for PV calculation, and inflation-adjusted constant dollars).
The results of a CEA should compare and rank order cost-effectiveness ratios to provide
guidance on resource allocation. As part of this analysis, costs and effects should be plotted on
a cost-effectiveness plane, where the y-axis represents cost estimates and the x-axis represents
estimates of effect (Black, 1990; Levin et al., 2018, pp. 177-179). The plane visualizes both
dimensions that determine cost-effectiveness and provides the opportunity to illustrate
negative or zero results.
In some cases, the difference between two cost-effectiveness ratios is small (e.g., a 5%
difference). The magnitude of a small difference is likely to be statistically indistinguishable
from zero given the other sources of variance in cost-effectiveness ratios. If possible, analysts
should not only compare the magnitude of cost-effectiveness ratios but also further test
hypotheses about whether ratios are statistically distinguishable from one another. This is
possible only if the cost-effectiveness ratios are accompanied by confidence intervals.

Standards for the Economic Evaluation of Educational and Social Programs
AMERICAN INSTITUTES FOR RESEARCH® | AIR.ORG 49
Exhibit 3.1. Checklist for Reporting in a Comparative Cost-Effectiveness Analysis
Framework
Purpose of study: Carefully define the problem and identify a set of intervention alternatives that target equivalent outcomes under consideration.
Audience: Clearly specify the audience and the perspective taken in each intervention evaluation being compared.
Study design for causal inference: Alternatives are evaluated according to described theories of change using internally valid methods to estimate effects.
Population: Study participants are described, and differences across studies are identified.
Date range: Specify the time horizon for the evaluations included and the outcomes of interest.
Cost
Cost method: Report the sampling frame, including the time horizon and data sources.
Correspondence: Explain how the cost analysis corresponds to the effectiveness estimate, including limitations of the correspondence between costs and effects.
Data collection (ingredients): Describe all ingredients for each alternative in detail, along with their sources.
Data collection (prices):
− Consider ingredient quantities and prices separately in cost calculations.
− Clearly specify if national or local costs are being calculated.
− Calculate and describe shadow prices used for inputs for which there is no market or where the market price is distorted (e.g., for markets that are changing).
− Express costs in constant dollars discounted to present values, amortized across the lifetime over which inputs remain useful where applicable.
Effectiveness
Criteria for effectiveness: Justify the appropriateness of the measures of effectiveness.
Metrics of effectiveness: Report effects in common and comparable units.
Timing of effects: Report the timing of effects and measurement of outcomes.
Combining costs and effects to compare cost-effectiveness
Cost-effectiveness ratios: Calculate the ratios using corresponding costs and effects.
Compare ratios: Compare the cost-effectiveness of alternative programs that impact equivalent outcomes.
Limitations: Include limitations on the costs, effects, and their correspondence. Clearly state limitations of comparability across cost-effectiveness ratios, including where differences in estimates are small.
Sensitivity tests: Explain the choice to report metrics precisely or with ranges or confidence intervals and apply appropriate sensitivity analyses.

Standards for the Economic Evaluation of Educational and Social Programs
AMERICAN INSTITUTES FOR RESEARCH® | AIR.ORG 50
Chapter 4: Cost-Benefit Analysis Standards
Introduction to Cost-Benefit Analysis Standards CBA is a method to measure and compare the value of the outcomes generated by a program
(benefits) relative to its costs. The standards in this chapter are informed by books and articles
detailing CBA in educational and other social programs.14 Similar to CEA, a CBA requires the
estimation of incremental costs associated with the resources used to achieve the causal
effects measured through impact evaluation. Hence, the CBA standards that follow assume that
costs were estimated following the CA standards in Chapter 2. However, a CBA then monetizes
the causal impacts of the intervention (i.e., program, policy, or practice in question) on
outcomes to estimate benefits that resulted from its implementation. The results of CBA can
answer two important questions: (a) Is implementing a program desirable in that the benefits it
generates outweighs its costs? and (b) How preferable is undertaking a given program
compared with alternative investment opportunities?
Importantly, CBA allows one to compare the expected returns of alternative programs that may
produce a wide variety of outcomes. This is in contrast to CEA, which compares only the cost-
effectiveness (cost per unit of outcome produced) of alternative programs intended to promote
the same outcome. However, it can be argued that CBA is generally more burdensome to apply
because it requires the extra step of monetizing outcomes. In addition to taking into account
observable outcomes, an analyst must consider those for which a causal program impact may
not have been directly estimated by the analyst. For example, the effects of a program
designed to improve high school graduation rates would need to consider the myriad of
outcomes associated with graduation to which monetary values could be applied (e.g.,
improvements in employment prospects, earnings, income tax revenues, life expectancy, health
service needs at both private and public expense, criminal activity and associated burden on
the judicial and penal systems).
The usefulness of a CBA in answering the question of whether one investment opportunity is
preferable to another largely rests on the degree to which results can be legitimately compared
across studies. CBA requires that the analyst make a number of decisions (assumptions), which
may influence the analysis findings concerning whether one program is desirable or preferable
to other investment alternatives under consideration. To this end, it is vitally important to be
transparent about the analysis assumptions used to ensure that comparisons between the
results of two CBA studies are not driven by the methodological decisions made by the
respective researchers.
14 See Belfield (2015); Boardman et al. (2018); Crowley et al. (2018); Farrow & Zerbe (2013); Institute of Medicine & National Research Council (2014); Karoly (2012, 2016); Levin et al. (2018); NASEM (2016); and Zerbe et al. (2010) for more information.

Standards for the Economic Evaluation of Educational and Social Programs
AMERICAN INSTITUTES FOR RESEARCH® | AIR.ORG 51
Evaluation Design: Cost-Benefit Analysis
56. A cost-benefit analysis should begin with careful planning in advance of conducting
the analysis, including specifying which outcomes will be monetized, the methods
used to calculate the monetary value of outcomes (benefits), and the time horizon
during which costs and benefits will be measured.
Ideally, a CBA will be conducted concurrently with implementation of the program under
investigation to maximize the accuracy of the data being collected and the corresponding
results. Although CBAs are sometimes conducted retrospectively (after an implementation
ends), this is a second-best option. Regardless of whether the CBA is performed concurrently or
retrospectively, conducting a high-quality analysis requires several upfront considerations and
evaluation activities. For instance, analysts should ensure that all design decisions are properly
aligned with the research questions. This will include determining the perspective from which
costs and benefits will measured (i.e., the party or parties of interest for whom accrued benefits
and incurred costs will be described), often defined as private, public, or societal.
Prior to performing data collection and analysis, determinations must be made concerning
which outcomes will be considered, the associated benefits that will be measured, and how
they will be monetized. Outcomes should be prespecified and chosen from those described in
the intervention’s theory of change and/or identified in the research literature. As well as being
informed by the theory of change, the choice of outcomes should be driven by the availability
of causally estimated effects, the ability with which they can be monetized, and ensuring that
any outcomes to be monetized are independent of one another to avoid double counting of the
benefits. A distinction should be made between those benefits that will be observed during the
investigation versus those that will accrue afterward and must be predicted for the purposes of
the CBA. In addition, the analysis plan should identify a time period (horizon) during which
benefits/costs will occur, note which impacts are expected to either ratchet up or fade out
across time, and specify how the corresponding monetization of benefits will address these
phenomena. As mentioned in Chapter 2 describing the standards underlying a rigorous CA, the
planning and reporting elements pertaining to economic evaluations listed in Exhibit 2.1 also
apply to CBA. Engaging in a careful research design in advance of CBA data collection, analysis,
and reporting promotes transparency, facilitates more comprehensive and accurate estimates
of benefits and costs, and holds the CBA to similar prospective decision making as other
evaluation components such as impact analyses. (For more information, see Crowley et al.,
2018, pp. 372–374; Levin et al., 2018, pp. 29–42, 274; Drummond et al., 2015; Institute of
Medicine & National Research Council, 2014, p. 30; Karoly, 2012, pp. 35–36; Kuklinski et al.,
2012; and Zerbe et al., 2010, pp. 35–36).

Standards for the Economic Evaluation of Educational and Social Programs
AMERICAN INSTITUTES FOR RESEARCH® | AIR.ORG 52
57. A cost-benefit analysis should have a clearly defined time horizon that represents
the period during which all costs and benefits associated with the program are
either observed or expected to occur.
The program theory of change often provides guidance as to when costs and benefits are
expected to occur. Costs and benefits do not necessarily occur in the same period, so a CBA
must take into account these periods to accurately capture the full costs and benefits
associated with the program. The costs of a program that affect the outcomes of a cohort of
participants typically occur within a limited time span (e.g., one academic year), whereas the
observed or expected benefits associated with the primary outcomes of interest may accrue
well beyond that period. For example, the observed benefits from a program promoting high
school graduation might include higher earnings in early career and associated tax revenues,
whereas expected benefits may include both higher earnings and tax revenues during a
participant’s working career and improved health and increased longevity in one’s lifetime. (For
more information, see Belfield et al., 2006; Institute of Medicine & National Research Council,
2014, p. 30; and Levin et al., 2018, p. 200.)
58. Costs and benefits used in a given cost-benefit analysis should be calculated from
the same perspective (i.e., stakeholders from the private sector, the public sector,
or society as a whole) and aligned with the study research question of interest.
When the appropriate perspective to take is not clear, the analyst should use the
societal perspective and then consider whether other perspectives, such as that of
the program implementer and/or participants, should additionally be adopted.
Costs considered for inclusion in a CBA might be incurred by various entities and can be
categorized as private (e.g., individuals, philanthropies), public (governmental organizations or
agencies funded by tax dollars), or societal (inclusive of both the private and public sectors).
Therefore, costs may be calculated from any of these perspectives. For example, the costs of a
program that increases high school graduation may be borne by private entities such as
students/families and philanthropic organizations (costs incurred from a private perspective),
public organizations such as districts and schools through the use of federal, state, or local
funding (costs incurred from a public perspective), or a combination of private and public
efforts (costs incurred from a societal perspective). Similarly, benefits may accrue to these
different types of recipients. For instance, a program intended to promote high school
graduation may result in a myriad of benefits to different parties, including better job market
prospects and higher wages to individual graduates (private benefits) and increased income tax
revenues and less reliance on public services (public benefits). When conducting a CBA, the
analyst must keep in mind the perspective from which costs and benefits will be calculated. The
same perspective should generally be used for both costs and benefits and aligned with the

Standards for the Economic Evaluation of Educational and Social Programs
AMERICAN INSTITUTES FOR RESEARCH® | AIR.ORG 53
research question(s) being addressed. Otherwise, mixing different perspectives for costs and
benefits must be justified and transparently documented. A recommended default strategy is
for the analyst to calculate costs and benefits from a societal perspective, as recommended for
the reference case analysis, which provides a comprehensive account of the overall costs and
benefits (both private and public) associated with the program. In addition, the analyst will then
be well positioned to provide costs and benefits from the private and public perspectives. (For
more information, see Levin et al., pp. 35–37, 201–202, 231; and Rouse, 2007.)
59. The present value of costs used in a cost-benefit analysis should represent
incremental costs, defined as the difference in the value of resources associated
with the program (treatment) condition and the resources expended in the
counterfactual (control) condition used to estimate the outcome effects on which
benefits are measured.
The cost estimation plan for a CBA should clearly state which conditions are being compared.
The analyst should identify the difference in resource requirements and associated differences
in costs (incremental cost) between the conditions used to estimate impacts that will be
monetized (NASEM, 2016).
60. The measures of changes in outcomes associated with a program used in a cost-
benefit analysis should be rigorous causal estimates of impact relative to the
comparison condition. Any anticipated or known bias in the impact estimates used
in the cost-benefit analysis should be disclosed and the implications for the
estimates of economic returns discussed.
Similar to economic evaluations using CEA, for a CBA, the measures of change in outcomes
associated with a program should be derived from causally estimated impacts, based on
evaluations using rigorous experimental or quasi-experimental methods. Any threats to the
validity of causal interpretation of the estimates and subsequent consequences for the analysis
should be fully disclosed and discussed. The requirement to use causal impact estimates is
applicable to both primary outcomes observed during the investigation and longer term
secondary outcomes that are anticipated. Any linkages between expected longer term
outcomes and those directly observed should be supported by causal evidence found in prior
research literature or directly by the analyst through rigorous estimation methods. (For more
information, see Athey et al., 2019; Crowley et al., 2018, pp. 373, 386; Levin et al., 2018,
pp. 141–149.)

Standards for the Economic Evaluation of Educational and Social Programs
AMERICAN INSTITUTES FOR RESEARCH® | AIR.ORG 54
61. The unit used for calculating primary benefits in a cost-benefit analysis should align
with the unit of analysis at which program impacts are estimated with the
understanding that
‒ secondary benefits may be calculated using a different unit of analysis, and
‒ all benefits must be aggregated for calculating and reporting final summary
analysis metrics.
The unit of analysis to calculate primary benefits in a CBA must align with the units in which
changes in outcomes resulting from the program are measured. For example, given that the
goal of most educational programs is to support student learning, the primary unit of analysis
for CBAs in education often is the student. However, sometimes CBAs might include secondary
benefits that accrue at the district, school, or classroom levels. In these cases, other units of
analyses can (and should) be included when relevant. Regardless of the units in which benefits
and costs are calculated, they must be combined to generate summary analysis metrics, such as
the net present value (NPV) or the benefit-cost (BC) ratio (Karoly, 2016; Temple & Reynolds,
2007).
Data Collection: Cost-Benefit Analysis
62. Outcomes should be expressed in monetary terms using an accepted shadow
pricing technique, with discussion of the validity of the method. Shadow prices
derived from extant research may be used, assuming a formal benefit transfer
mechanism has been conducted that demonstrates how the prices are applicable to
the outcomes and context being investigated.
Educational and social programs generate many outcomes where calculating corresponding
monetary values may not be straightforward. The specific challenge lies in determining the
monetary value of outcomes for which there is no market (e.g., student grades, health status)
or where a market exists but prices are distorted, in which case the analyst must rely on
shadow pricing techniques. Here, a shadow pricing method should be declared, used, and
justified for each benefit stemming from outcomes. The main methods are as follows: the
market method, the defensive expenditure method, the hedonic pricing method, the trade-off
method, and contingent valuation. The analyst should consider the validity of the selected
method and account for any potential biases in the shadow price values.
Shadow prices derived from existing studies by applying a benefit transfer mechanism (i.e.,
using shadow prices established from previous research conducted in a similar context) support
the credibility of benefit estimates and allow comparability across CBAs. However, these
independent shadow prices should be applied only after formally determining their validity for

Standards for the Economic Evaluation of Educational and Social Programs
AMERICAN INSTITUTES FOR RESEARCH® | AIR.ORG 55
the study in question; they should not simply be “plugged into” any CBA without considering
whether the context in which the calculation of the source shadow price was made can be
generalized to the context in which it is to be applied.
As an example, the intended outcomes of educational programs often include measures of
achievement or attainment. Further, there is considerable evidence of a causal link between
these types of educational outcomes and improved labor market outcomes (e.g., employment
prospects, earnings). However, there are some educational outcomes for which causal evidence
of a direct relationship with monetizable labor market outcomes does not exist (e.g., social-
emotional skills). In these cases, it may be necessary to identify a causal link between these
outcomes and other monetizable outcomes, such as achievement or attainment (Belfield et al.,
2015). For instance, a study focused on outcomes for which there is no direct relationship to
employment and earnings may identify causal links between the study outcomes and high
school graduation, for which there is considerable evidence of a connection to enhanced labor
market outcomes. To this end, achievement, attainment, and other educational outcomes
should be monetized based on established causal relationships with labor market outcomes in
adulthood and applying appropriate shadow prices, adjusting for external factors affecting
labor market outcomes.
For many outcome metrics, it is valid to project forward a labor market gain, such as earnings,
from enhanced educational attainment. The magnitude of this gain will depend on the extent of
the expected increase in education and need not be monotonic, linear, or proportionate.
Further, raw gaps in earnings between students treated by the program and their control
counterparts may not accurately capture the economic value of education. The gaps should be
adjusted for potential differences between students affected by the program and the typical
student (e.g., if those graduates to whom the gains are attributed are not equivalent to the
average graduate in terms of their labor market productivity and corresponding earnings). Also,
whenever possible, the gaps should adjust for variation in “full earnings” (i.e., accounting for
differences in rates of labor market participation, hours worked, employment stability, and
fringe benefits). Finally, it is important not to double count when assigning monetary values to
interrelated outcomes. For example, consider quantifying the benefits of a program shown to
improve both the earnings and health of participants. Because the enhanced earnings also may
positively affect health outcomes (and vice versa), then in calculating benefits, it is necessary to
consider (monetize) only the program impacts on health and earnings that are independent of
one another (Levin et al., 2018).
The calculation of benefits from evidence-backed improvements in outcomes that directly
affect spending on educational operations (e.g., disciplinary action, grade retention, teacher
absenteeism, progress of English learners and students with disabilities) also should take into

Standards for the Economic Evaluation of Educational and Social Programs
AMERICAN INSTITUTES FOR RESEARCH® | AIR.ORG 56
account any savings gained. (For more information, see Bartik et al., 2012; Belfield et al., 2015;
Haveman & Wolfe, 1984; Levin et al., 2018, pp. 207–217; and Vining & Weimer, 2010, 2019.)
63. A cost-benefit analysis should take into account all relevant benefits associated
with outcomes that accrue to program participants and other individuals, including
those associated with the labor market (higher employability and earnings),
health, and crime. Benefits that spill over to nonparticipants in a program also
should be accounted for where relevant. Monetized outcome impacts should be
derived using a demand-supply market framework.
The outcomes of educational and social programs confer a variety of benefits to individuals,
taxpayers, and society. In addition to benefits in the labor market associated with an increase in
the supply of educated workers, economic consequences occur in other realms for both
program participants and nonparticipants, including benefits to health, social order (lower rates
of crime), and changes in government revenues and expenditures. For a full evaluation, all
benefits should be counted (accounting for transfers between groups that do not involve new
resources). Where appropriate and possible, these benefits should be analyzed using a market
framework, changing either supply or demand within that market. For example, if the demand
for health services falls (the demand curve shifts inward), this will reduce expenditures on
health services (depending on the shape of the supply function for health services). Otherwise,
direct expenditures may be counted, based on applying one of the methods for shadow pricing
(see Standard 62). The analyst should be transparent in documenting not only all monetized
benefits but also those important nonmonetized benefits for outcomes that the analyst was
unable to monetize because of a lack of information and nonmonetary benefits for intangible
outcomes for which there are no obvious monetary equivalents (e.g., happiness). (For more
information, see Belfield & Levin, 2007; Blomquist et al., 2014; Cohen & Piquero, 2009; Levin
et al., 2018, p. 200; and Trostel, 2010.)
Analyzing the Data: Cost-Benefit Analysis
64. Program costs and benefits that occur across multiple years should be expressed in
constant terms, reflecting the value of a dollar or other currency for a given year.
Program costs and benefits often occur across multiple years. Nominal costs and benefits will
tend to increase across time because of inflationary pressures on prices. For example, the same
program resources purchased for $1,000 in the first year of implementation may cost $1,100 in
the third year of implementation because price levels have risen. To take this into account, the
analyst must adjust values of the prices underlying all costs and benefits to reflect the currency
value for a single year (e.g., the final year of implementation). This is done by applying a reliable
price index to translate the nominal resource prices used to calculate the observed or expected

Standards for the Economic Evaluation of Educational and Social Programs
AMERICAN INSTITUTES FOR RESEARCH® | AIR.ORG 57
costs and benefits measured for each specific year into real prices that reflect the currency’s
unit value in the target year chosen.
The conversion of prices used to calculate costs and benefits should be done using published
inflation indices that consider the types of resources for which costs and benefits are being
calculated. A variety of indices are available for adjusting prices into a specific target year, and
great care should be taken to use an index that appropriately aligns with the nature of the
resources underlying the various costs and benefits. Specifically, the price levels of
nonpersonnel items often are adjusted using the U.S. Bureau of Labor Statistics CPI-U (for
adjustments of U.S. dollars) or the World Bank National Gross Domestic Product Deflator (for
international currencies). (For more information, see Boardman et al., 2018, pp. 215–220; Levin
et al., 2018, pp. 94–95; and Reynolds et al., 2007, 2011.)
65. Program consequences should be expressed in monetary values. Adverse (negative)
benefits should not be classified as costs when calculating summary measures of
economic returns such as the net present value or the benefit-cost ratio.
The monetized outcomes resulting from the implementation of an educational or social
program—defined by the term “benefits”—can be positive (e.g., increased earnings
attributable to enhanced productivity or savings on criminal justice spending) or negative (e.g.,
additional spending for college programs). One benefit that should be included, which may be
positive or negative, is the change in efficiency caused by a loss or gain in surplus to consumers
and producers when government spending and revenue are affected (often referred to as
deadweight loss or marginal excess tax burden). All resource changes should be summed to
yield total benefits as the sum of “positive benefits” and “negative benefits.” These total
benefits can then be compared with total costs to yield a NPV or BC ratio. When calculating
these summary measures of economic returns, negative benefits should not be treated as
program or intervention costs for three reasons. First, it is confusing to combine the costs of
implementing a program with the negative benefits caused by the program. Second,
mathematically, the NPV and the BC ratio will be different if negative benefits are defined as
costs rather than benefits (i.e., placed in the denominator rather than correctly placed in the
numerator of the ratio). Finally, it is hard to compare the affordability of alternative programs
when negative benefits are included as costs. (For more information, see Boardman et al.,
2018, pp. 279–286; Crowley et al., 2018, p. 379; Levin et al., 2018, p. 201; Farrow & Zerbe,
2013; Karoly, 2012, p. 28; and Perez-Arce et al., 2012.)
66. A cost-benefit analysis should include separate calculations of the present values of
the total benefits and the incremental costs associated with implementation of the
program being investigated, in addition to calculation of the net present value,

Standards for the Economic Evaluation of Educational and Social Programs
AMERICAN INSTITUTES FOR RESEARCH® | AIR.ORG 58
defined as the present value of total benefits minus the present value of incremental
costs. Calculation of additional summary metrics, including the benefit-cost ratio, the
internal rate of return, and the break-even point should be considered.
Estimation of the PVs of both the incremental costs associated with a program15 and the total
benefits corresponding to the outcomes produced provide insight into the value of resource
consumption relative to the value of what was generated. In other words, calculating the NPV
contextualizes the production of outcomes by a program in the context of its cost. However, also
calculating both the PV benefit and PV cost components of the NPV increases the transparency
of CBA. For instance, program costs are important for many stakeholders to understand, which is
particularly relevant to programs that have a high cost of entry/adoption. In such cases, even the
most efficient programs may be cost prohibitive in low-resource settings. The analyst may want
to calculate a host of additional summary metrics for reporting out, including the BC ratio (PV
benefits divided by PV costs), the internal rate of return (IRR; the discount rate which equates PV
costs and benefits), and the breakeven point (the time point when cumulative PV costs equal
cumulative PV benefits). (For more information, see Bowden et al., 2015; Crowley et al., 2018,
p. 384; Haddix et al., 2003; Husereau et al., 2013; and Neumann et al., 2016.)
67. A cost-benefit analysis should evaluate the sensitivity of results by performing
calculations that use the largest and smallest of the plausible alternative values for
each parameter (a partial sensitivity analysis). In addition, a Monte Carlo analysis
that addresses uncertainty resulting from sampling variation should be conducted
whenever possible. In the absence of conducting a Monte Carlo simulation, a best-
or worst-case analysis should be performed.
CBA estimates may be sensitive to parameter uncertainty (the specific values used to make
calculations of costs and benefits such as impact estimates, the levels of various inputs, their
unit prices, and discount rates), structural uncertainty (elements of the theoretical framework
or mechanism through which the model dictates how and when outcomes are generated), and
sample variability. Results generated from a base case CBA are based on several assumptions
that typically assume the most likely values of key parameters (Boardman et al., 2018, pp. 279–
280)—for example, the values of the discount rate, time horizon, decay or growth rates of
impacts, and shadow prices. These values often are drawn from the literature based on what
appears to be the most plausible set of values. However, alternative values can usually be
found in the same literature, which suggests an uncertainty about the appropriate parameter
values. Sensitivity analysis capable of addressing uncertainty associated with the values
15 The incremental costs are equal to the aggregate total costs of a program when they are simply added on top of the comparison control condition. (See Exhibits 1.1–1.4 for graphical depictions of total and incremental costs.)

Standards for the Economic Evaluation of Educational and Social Programs
AMERICAN INSTITUTES FOR RESEARCH® | AIR.ORG 59
selected for key parameters can be conducted using several different approaches. The first of
these is a partial sensitivity analysis in which the values for each parameter used in the base
case, especially those thought to have the greatest influence on the results, are replaced one at
a time with the largest or the smallest of the range of plausible values to see whether the NPV
is sensitive to this substitution.
A second approach for evaluating the sensitivity of a CBA, one that addresses uncertainty
resulting from sampling variation and is sometimes used to treat other types of uncertainty, is
Monte Carlo simulation. This involves randomly drawing each impact estimate from among all
the possible estimates for that impact within the normal distribution implied by the standard
errors of the impact estimates (and cost estimates if standard errors are available). Once this is
done for all the impact estimates, it provides one set of draws and an estimate of net gain or
loss, with the process repeated many (e.g., thousands of) times. The mean and standard
deviation of the NPVs generated by the repeated trials is then reported along with a
corresponding histogram to convey the uncertainty surrounding the true NPV. Further, the
proportion of the positive estimates indicates the probability that the program’s benefits
exceed the program’s costs, even if some of the underlying observed costs or estimated
impacts underlying the benefits are not statistically significant. Varying parameters such as the
discount rate and the decay rate could be incorporated into a series of Monte Carlo analyses by
using the maximum and minimum plausible values as end points in a distribution and making
an assumption about the shape of the distribution (e.g., the normal distribution or uniform
distribution, as appropriate).
The final approach to investigating the sensitivity of CBA findings is to conduct a best- or worst-
case analysis, in which the largest and smallest of the plausible alternative values for each
parameter are first selected. Then the set of alternative parameter values that are most likely
to turn a positive NPV negative or a negative NPV positive are substituted for the base case
values. This approach tests the robustness of a positive finding to the least favorable set of
plausible values and a negative finding to the most favorable set of plausible values. However,
the use of best- and worst-case analysis should occur only when Monte Carlo simulation is
impractical. (For more information, see Boardman et al., 2018, pp. 279–290, 299–302, 308–313;
Gubits et al., 2018; Hendra et al., 2011; Karoly, 2012, pp. 31–32, 35; Schaberg & Greenberg,
2020; Vining & Weimer, 2010; Weimer & Vining, 2009, p. 267.)

Standards for the Economic Evaluation of Educational and Social Programs
AMERICAN INSTITUTES FOR RESEARCH® | AIR.ORG 60
68. All impacts, regardless of their statistical significance, should be monetized and
included in the calculation of summary measures of economic returns, such as the
net present value and the benefit-cost ratio.
The objective of CBA is to improve decision making. It is not motivated by hypothesis testing as
to whether specific impacts are statistically significant. Instead, the focus is on substantive
significance (i.e., how likely the NPV of a program is positive, taking all information into account).
The lack of obtaining a statistically significant estimate does not necessarily imply that the point
estimate is wrong (biased); it may not be measured with sufficient precision (because of, for
instance, an underpowered sample). By ignoring statistically insignificant impacts, the analyst is
“throwing away” information that may be relevant in three respects: (a) statistical insignificance
does not always imply a lack of substantive significance for calculating summary measures of
economic returns such as the NPV, (b) all impacts influence the precision of NPV estimates, and
(c) all impacts should be accounted for when conducting sensitivity analysis. In turn, all impacts
should then be monetized and included in the calculation of measures of economic returns. (For
more information, see Crowley et al., 2018; Farrow & Zerbe, 2013, p. 370; Greenberg et al.,
2009; Levin et al., 2018, p. 232 & 261; and Weimer, 2015.)
69. Benefits and costs that cannot be quantified and monetized should be listed and
assessed in terms of how their exclusion might have affected the findings given the
benefits and costs that were quantified and monetized. In such a qualitative cost-
benefit analysis, it is especially important to consider whether a finding of a
positive or negative net present value could potentially be reversed if any missing
nonmonetized benefits and costs were taken into account.
Sometimes because of a lack of time and resources, available data, and/or analyst capacity,
quantification and subsequent monetization of potentially important outcomes does not occur.
Consider a program that increases high school graduation. Examples of possible benefits and
costs omitted from the formal CBA might include impacts on the quality of life, health, future
success as a parent, civic participation, future receipt of government welfare payments, crime,
and displacement (i.e., a person who graduates from high school as a result of the program may
obtain a job that would otherwise be held by someone else). In this case, the analyst should
engage in qualitative CBA, where potentially important benefits and costs are not ignored, even
if they are quantitatively missing from the formal CBA. Instead, these should be documented
and evaluated in terms of how their inclusion would have changed the formal CBA findings
given the benefits and costs that were quantified and monetized. The key goal of this exercise is
to consider whether a finding of a positive or negative NPV would potentially be reversed after
considering the nonmonetized benefits and costs.

Standards for the Economic Evaluation of Educational and Social Programs
AMERICAN INSTITUTES FOR RESEARCH® | AIR.ORG 61
Extant research can support qualitative CBAs. For example, sometimes nonmonetized impact
estimates are available that can provide information on orders of magnitude, which can serve to
inform whether the combined quantified and unquantified program benefits would outweigh
corresponding costs. For instance, a rigorous evaluation of a high school graduation program
might include a follow-up survey asking individuals in the sample about their health status and
life satisfaction several years later. In addition, studies of outcomes later in life as the result of
education have been conducted and show the relationship between school achievement and the
propensity to commit crime and the effects of parental school achievement on the outcomes of
children. (For more information, see Boardman et al., 2018, p. 44; Gubits et al., 2018; and
Schaberg & Greenberg, 2020.)
Reporting the Results: Cost-Benefit Analysis
70. The reported summary measures of economic returns from the cost-benefit
analysis should include, at a minimum, the present values of costs and benefits and
the net present value.
The NPV is a key summary measure of the economic returns to a program that should be
reported as a part of a CBA. Defined as the PV of the outcomes generated by a program minus
the PV of the costs of implementation, the NPV serves to demonstrate both the attractiveness
of a program and whether it is a worthwhile investment. However, for transparency purposes,
it also is necessary to report out its constituent elements: the PVs of both the total benefits and
the incremental costs. These provide important information to decision makers to better
understand the magnitudes of costs and benefits. Importantly, the scale of the program (e.g.,
the number of participants) should be reported to provide context with which to compare the
program’s economic returns to those of alternative investments. Additional summary metrics
to be reported may include the BC ratio, the IRR, and the breakeven point. Any limitations on
these additional metrics should be acknowledged (e.g., the BC ratio providing no information as
to the magnitudes of the costs or benefits, the possible nonuniqueness of the IRR). (For more
information, see Crowley at al., 2018; Levin et al., 2018, pp. 222–229; and NASEM, 2016.)
71. Report summary measures of economic returns using a perspective (stakeholders
from the private sector, public sector, or societal as a whole) that is aligned with
the study research questions. When it is not clear which perspective to take, the
analyst should report the summary measures from a societal perspective, which
includes all relevant stakeholder subgroups in the private and public sectors.
Most programs have distributional consequences that will not be evident unless studies report
details on the different entities financing the costs and receiving the benefits. Specifically, the
costs of a program often are shared by a host of entities, including those in the private sector

Standards for the Economic Evaluation of Educational and Social Programs
AMERICAN INSTITUTES FOR RESEARCH® | AIR.ORG 62
(e.g., program participants and private philanthropic organizations) and public sector (e.g.,
governmental entities at the federal, state, and local levels, such as the implementing
districts/schools and state education agencies). Similarly, the benefits of a program may accrue
to a variety of stakeholders in both the private and public sectors. To the extent that the costs
and benefits are differentially shared across stakeholders, economic returns will vary across
parties. The study questions may call for findings that are associated with specific perspectives
of one or more stakeholder groups in the private and/or public sectors, thus requiring the
investigation to report disaggregated summary measures of economic returns for each. When
this is not the case, the analyst should report the results from the societal perspective, which
includes the costs and benefits associated with all stakeholders. (For more information, see
Crowley at al., 2018; Levin et al., 2018, pp. 33–37; and NASEM, 2016.)
72. Reports of cost-benefit analysis findings should include a host of information
pertaining to implementation context, the different treatment and control
conditions on which the incremental costs and outcome impacts are based, the
time horizon during which costs and benefits are estimated, the pricing and
discounting methods used in estimating costs and benefits, summary measures of
economic returns, a sensitivity analysis of estimates, and breakdowns of costs and
benefits by various stakeholder perspectives.
Rigorous CBA requires reporting a variety of information that documents the data and methods
used, as well as important decisions made by the analyst. Careful and inclusive reporting of
data, methods, and analytical decisions serves to increase both the transparency and
comparability of study findings for researchers/practitioners attempting to gain a better
understanding of the extent to which program benefits exceed their costs. Given that a rigorous
CA is a prerequisite for any CBA, all reporting requirements for CA also apply and will not be
repeated here (see Exhibit 2.1). However, many additional components of a CBA must be
reported in a transparent fashion to allow readers to fully understand the methods and
assumptions involved, as well as to make appropriate comparisons to other studies. The critical
reporting elements should include the outcomes considered and their associated impacts, the
contexts within which the program is implemented, the pricing methods used to monetize
outcomes and resource costs, the time horizon during which benefits and costs are estimated,
key summary measures of economic returns, and sensitivity analysis. Exhibit 4.1 provides a
checklist of these key items that should accompany the reporting of CBA findings.

Standards for the Economic Evaluation of Educational and Social Programs
AMERICAN INSTITUTES FOR RESEARCH® | AIR.ORG 63
Exhibit 4.1. Checklist for Reporting in a Cost-Benefit Analysis
Framework
Description of the Program: Describe the implemented program.
Description of the Theory of Change: Describe how the intervention or program is intended to affect the
proximal and distal outcomes of interest.
Description of Study Conditions: Describe the contrasting BAU and alternative program conditions.
Characteristics of Study Sites and Participants: Document the characteristics of sites in the study sample,
including location, scale of operations, and participant demographics by programmatic condition.
Perspectives: Describe the stakeholder group perspective(s) for which the CBA will be conducted.
Overview of Research Design for Measuring Impacts: Document the research designs used to estimate causal
impacts for primary outcomes and any secondary outcomes drawn from extant sources, as well as potential
biases in estimates associated with threats to internal validity.
Outcomes: Describe the key outcomes considered in the study, differentiating them as follows:
o outcomes either directly measured and monetized by the analyst or taken from extant research versus
outcomes that are not monetized but that may be relevant to the CBA
o monetized outcomes based on measured impacts during the study period versus those projected for a
longer period
Time Horizon: Document the time horizon during which impacts and costs are measured directly and which
future impacts and costs are projected.
Valuing Outcomes Not Measured in Monetary Units
Shadow Prices: Document the sources of the shadow prices used to value outcomes for which no (well-
functioning) market exists and the procedures for converting measured outcomes to monetary terms.
Adjustments for Geographic Price Variation: Describe the price index and assumptions used in standardizing
prices to a specific geographic level (local, regional, state, or national).
Reference Year for Pricing: Specify the reference year for converting cost data to constant dollars and the
price index or other assumptions used for conversion.
Discount Rate: Report the annual discount rate used to convert benefits or costs to PVs for the reference
year.
Amortization: Specify details about the amortization of costs for goods and services that remain useful for
multiple years.
Metrics
Key Measures: Report key summary measures of economic returns, including PVs of overall benefits and costs
and the overall NPV. Consider reporting additional measures, including the BC ratio, the IRR, and the
breakeven point.
Breakdowns of Key Summary Measures: Report breakdowns of key summary measures of economic returns
as follows:
o PVs of the benefits associated with each outcome that has been monetized
o By relevant stakeholder perspectives (societal, public, and private)
Sensitivity Analysis
o Report mean and variation in both estimated implementation costs and the outcomes used to generate
benefits.
o List alternative estimates of the NPV resulting from partial sensitivity analysis yielding large changes to
summary return metrics, estimates that consider only a limited set of outcomes to better understand the
contribution of each to the NPV, and findings from a best- or worst-case analysis.
o Provide the mean, standard deviation, and histogram of NPV estimates generated by a Monte Carlo
simulation, as well as the probability that the NPV is positive.

Standards for the Economic Evaluation of Educational and Social Programs
AMERICAN INSTITUTES FOR RESEARCH® | AIR.ORG 64
References
Athey, S., Chetty, R., Imbens, G., & Kang, H. (2019). The surrogate index: Combining short-term
proxies to estimate long-term treatment effects more rapidly and precisely (NBER
Working Paper No. 26463). National Bureau of Economic Research.
https://www.nber.org/papers/w26463
Bartik, T. J., Gormley, W., & Adelstein, S. (2012). Earnings benefits of Tulsa’s pre-K program for
different income groups. Economics of Education Review, 31(6), 1143–1161.
https://doi.org/10.1016/j.econedurev.2012.07.016
Belfield, C. (2015). Cost-benefit analysis and cost-effectiveness analysis. In M. Goertz & H. Ladd
(Eds.), Handbook of research in education finance and policy (2nd ed., pp. 141–156).
Routledge.
Belfield, C., & Bowden, A. B. (2019). Using resource and cost considerations to support
educational evaluation: Six domains. Educational Researcher, 48(2), 120–127.
https://doi.org/10.3102/0013189X18814447
Belfield, C. R., Bowden, A. B., Klapp, A., Levin, H. M., Shand, R., & Zander, S. (2015). The
economic value of social and emotional learning. Journal of Benefit-Cost Analysis, 6(3),
508–544. https://doi.org/10.1017/bca.2015.55
Belfield, C., & Levin, H. (Eds.). (2007). The price we pay: Economic and social consequences of
inadequate education. Brookings Institution Press.
Belfield, C., Nores, M., Barnett, S., & Schweinhart, L. (2006). The High/Scope Perry Preschool
Program: Cost–benefit analysis using data from the age-40 followup. Journal of Human
Resources, 41, 162–190. https://www.jstor.org/stable/40057261
Black, W. C. (1990). The CE plane: A graphic representation of cost-effectiveness. Medical
Decision Making, 10(3), 212–214. https://doi.org/10.1177/0272989X9001000308
Blomquist, G. C., Coomes, P. A., Jepsen, C., Koford, B. C., & Troske, K. R. (2014). Estimating the
social value of higher education: Willingness to pay for community and technical
colleges. Journal of Benefit-Cost Analysis, 5(1), 3–41. https://doi.org/10.1515/jbca-2013-
0009
Boardman, A. E., Greenberg, D. H., Vining, A. R., & Weimer, D. L. (2018). Cost-benefit analysis:
Concepts and practice (5th ed.). Cambridge University Press.

Standards for the Economic Evaluation of Educational and Social Programs
AMERICAN INSTITUTES FOR RESEARCH® | AIR.ORG 65
Bowden, A. B. (2018, March). Designing research on costs within randomized field trials. Paper
presented at the annual meeting of the Society for Research on Educational
Effectiveness, Washington, DC, United States.
Bowden, A. B., & Belfield, C. R. (2015). Evaluating the Talent Search TRIO program: A benefit-
cost analysis and cost-effectiveness analysis. Journal of Benefit-Cost Analysis, 6(3), 572–
602. https://doi.org/10.1017/bca.2015.48
Bowden, A. B., Belfield, C. R., Levin, H. M., Shand, R., Wang, A., & Morales, M. (2015). A benefit-
cost analysis of City Connects. Teachers College, Columbia University, Center for Benefit-
Cost Studies in Education.
https://static1.squarespace.com/static/583b86882e69cfc61c6c26dc/t/58cfdcba1b631bf
52d377cd8/1490017468049/CityConnects.pdf
Bowden, A. B., Shand, R., Belfield, C. R., Want, A., & Levin, H. M. (2017). Evaluating educational
interventions that induce service receipt: A case study application of City Connects.
American Journal of Evaluation, 38(3), 405–419.
https://doi.org/10.1177/1098214016664983
Briggs, A. H., O’Brien, B. J., & Blackhouse, G. (2002). Thinking outside the box: Recent advances
in the analysis and presentation of uncertainty in cost-effectiveness studies. Annual
Review of Public Health, 23, 377–401.
https://doi.org/10.1146/annurev.publhealth.23.100901.140534
Burwick, A., McCutcheon, A., LaFlair, L., Herard, J., & Strong, D. (2017). Understanding the costs
of services to address trauma in adults and children: Data collection instruments and
guidance for cost analyses of trauma-specific evidence-based programs. Mathematica
Policy Research. https://www.mathematica.org/our-publications-and-
findings/publications/understanding-the-costs-of-services-to-address-trauma-in-adults-
and-children-data-collection
Cellini, R., & Kee, E. (2015). Cost-effectiveness and cost-benefit analysis. In K. Newcomer,
H. Hatry, & J. Wholey (Eds.), Handbook of practical program evaluation (4th ed.,
pp. 636–672). Wiley.
Chambers, J. G. (1999). Measuring resources in education: From accounting to the resource cost
model approach. U.S. Department of Education, National Center for Education Statistics.
https://nces.ed.gov/pubs99/199916.pdf

Standards for the Economic Evaluation of Educational and Social Programs
AMERICAN INSTITUTES FOR RESEARCH® | AIR.ORG 66
Chambers, J., & Parrish, T. (1994a). Developing a resource cost database. In W. S. Barnett (Ed.),
Cost analysis for education decisions: Methods and examples (Vol. 4, pp. 23–44).
JAI Press.
Chambers, J., & Parrish, T. (1994b). Modeling resource costs. In W. S. Barnett (Ed.), Cost
analysis for education decisions: Methods and examples (Vol. 4, pp. 7–21). JAI Press.
Child Welfare Research and Evaluation Cost Workgroup. (2013). Cost analysis in program
evaluation: A guide for child welfare researchers and service providers. U.S. Department of
Health and Human Services, Administration for Children and Families, Children’s Bureau.
https://www.acf.hhs.gov/sites/default/files/documents/cb/cost_analysis_guide.pdf
Cohen, M. A., & Piquero, A. R. (2009). New evidence on the monetary value of saving a high-risk
youth. Journal of Quantitative Criminology, 25(1), 25–49.
https://link.springer.com/article/10.1007/s10940-008-9057-3
Cornman, S. Q., Nixon, L. C., Spence, M. J., Taylor, L. L., & Geverdt, D. E. (2019). Education
demographic and geographic estimates (EDGE) program: American Community Survey
Comparable Wage Index for Teachers (ACS-CWIFT) (NCES 2018-130). U.S. Department of
Education, National Center for Education Statistics.
https://nces.ed.gov/programs/edge/docs/EDGE_ACS_CWIFT_FILEDOC.pdf
Crowley, D. M., Dodge, K. A., Barnett, W. S., Corso, P., Duffy, S., Graham, P., Greenberg, M.,
Haskins, R., Hill, L., Jones, D. E., Karoly, L. A., Kuklinski, M. R., & Plotnick, R. (2018).
Standards of evidence for conducting and reporting economic evaluations in prevention
science. Prevention Science, 19(3), 366–390. https://doi.org/10.1007/s11121-017-0858-1
Dhaliwal, I., Duflo, E., Glennerster, R., & Tulloch, C. (2014). Comparative cost-effectiveness
analysis to inform policy in developing countries: a general framework with applications
for education. In P. Glewwe (Ed.), Education policy in developing countries (pp. 285–
338). The University of Chicago Press.
Drummond, M. F., Sculpher, M. J., Claxton, K., Stoddart, G. L., & Torrance, G. W. (2015).
Methods for the economic evaluation of health care programmes. Oxford University
Press.
Farrow, R. S., & Zerbe, R. O. (Eds.). (2013). Principles and standards for benefit-cost analysis.
Edward Elgar Publishing.

Standards for the Economic Evaluation of Educational and Social Programs
AMERICAN INSTITUTES FOR RESEARCH® | AIR.ORG 67
Ferrari, G., Torres-Rueda, S., Michaels-Igbokwe, C., Watts, C., & Vassall, A. (2018). Guidelines for
conducting cost analyses of interventions to prevent violence against women and girls in
low- and middle-income settings. What Works to Prevent Violence.
https://www.whatworks.co.za/resources/project-resources/item/557-guidelines-for-
conducting-cost-analyses-of-interventions-to-prevent-violence-against-women-and-
girls-in-low-and-middle-income-settings
Greenberg, D. H., & Appenzeller, U. (1998). Cost analysis step by step: A how-to guide for
planners and providers of welfare-to-work and other employment and training
programs. Manpower Demonstration Research Corp.
https://www.mdrc.org/sites/default/files/full_66.pdf
Greenberg, D., Deitch, V., & G. Hamilton. (2009). A synthesis of random assignment benefit-cost
studies of welfare-to-work programs. Journal of Benefit-Cost Analysis, 1(1), 1–30.
https://doi.org/10.2202/2152-2812.1005
Gubits, D., Stapleton, D., Bell, S., Wood, M., Hoffman, D., Croake, S., Mann, D. R., Geyer, J.,
Greenberg, D., Nichols, A., McGuirk, A., Carroll, M., Kattel, U., & Judkins, D. (2018).
BOND implementation and evaluation: Final evaluation report. Abt Associates and
Mathematica Policy Research.
https://www.ssa.gov/disabilityresearch/documents/BOND%20Deliv%2024e2%20FER%2
0Vol%201%2020181018.pdf and
https://www.ssa.gov/disabilityresearch/documents/BOND%20Deliv%2024e2%20FER%2
0Vol%202%20Appendix%2020181018.pdf
Haddix, A. C., Teutsch, S. M., & Corso, P. S. (Eds.). (2003). Prevention effectiveness: A guide to
decision analysis and economic evaluation. Oxford University Press.
Hartman, W. T., Bolton, D., & Monk, D. (2001). A synthesis of two approaches to school-level
financial data: The accounting and resource cost model approaches. In William J. Fowler,
Jr. (ed.), Selected Papers in School Finance, 2000–01 (NCES 2001–378). U.S. Department
of Education, National Center for Education Statistics.
https://nces.ed.gov/pubs2001/2001378.pdf
Haveman, R. H., & Wolfe, B. L. (1984). Schooling and economic well-being: The role of
nonmarket effects. Journal of Human Resources, 19(3), 377–407.

Standards for the Economic Evaluation of Educational and Social Programs
AMERICAN INSTITUTES FOR RESEARCH® | AIR.ORG 68
Hendra, R., Riccio, J.A., Dorsett, R., Greenberg, D.H., Knight, G., Phillips, J., Robins, P.K., Vegeris,
S., & Walter, J. (2011). Breaking the Low-Pay, No-Pay Cycle: Final Evidence from the UK
Employment Retention and Advancement (ERA) Demonstration. Sheffield, U.K.:
Department for Work and Pensions.
Hollands, F. M., Kieffer, M. J., Shand, R., Pan, Y., Cheng, H., & Levin, H. M. (2016). Cost-
effectiveness analysis of early reading programs: A demonstration with
recommendations for future research. Journal of Research on Educational Effectiveness,
23(1), 30–53.
Hollands, F. M., & Pan, Y. (2018). Evaluating digital math tools in the field. Middle Grades
Review, 4(1), 8. https://files.eric.ed.gov/fulltext/EJ1175679.pdf
Hollands, F., Pratt-Williams, J., & Shand, R. (2020). CAP project: Cost analysis standards &
guidelines 1.0. https://capproject.org/resources
https://static1.squarespace.com/static/5eb0d7c7df68b75104fbc784/t/5f15293674141a
78699c058d/1595222328873/CAP+Project+Cost+Analysis+Guidelines_1.0.pdf
Husereau, D., Drummond, M., Petrou, S., Carswell, C., Moher, D., Greenberg, D.,
Augustovski, F., Briggs, A. H., Mauskopf, J., & Loder, E. (2013). Consolidated health
economic evaluation reporting standards (CHEERS) statement. Cost Effectiveness and
Resource Allocation, 11(1), Article 346. https://www.bmj.com/content/346/bmj.f1049
Institute of Medicine and National Research Council. (2014). Considerations in applying benefit-
cost analysis to preventive interventions for children, youth, and families: Workshop
summary. The National Academies Press. https://doi.org/10.17226/18708
Jones, D. E., Bierman, K. L., Crowley, D. M., Welsh, J. A., & Gest, J. (2019). Important issues in
estimating costs of early childhood educational interventions: An example from the REDI
program. Children and Youth Services Review, 107, Article 104498.
https://doi.org/10.1016/j.childyouth.2019.104498
Karoly, L. A. (2012). Toward standardization of benefit-cost analysis of early childhood
interventions. Journal of Benefit-Cost Analysis, 3(1), 1–45.
https://doi.org/10.1515/2152-2812.1085
Karoly, L. A. (2016). The economic returns to early childhood education. The Future of Children,
26(2), 37–55. https://eric.ed.gov/?id=EJ1118537
Knight, D. S. (2012). Assessing the cost of instructional coaching. Journal of Education Finance,
38(1), 52–80. https://eric.ed.gov/?id=EJ979245

Standards for the Economic Evaluation of Educational and Social Programs
AMERICAN INSTITUTES FOR RESEARCH® | AIR.ORG 69
Kolbe, T., & Feldman, R. (2018). Estimating educational policy and program costs. In
C. Lochmiller (Ed.), Complementary research methods in educational leadership and
policy studies (pp. 281–304). Palgrave MacMillan.
Kolbe, T., & O’Reilly, F. (2017). The cost of increasing in-school time: Evidence from the
Massachusetts Expanded Learning Time Initiative. Leadership and Policy in
Schools, 16(4), 563–601. https://eric.ed.gov/?id=EJ1161147
Kuklinski, M. R., Briney, J. S., Hawkins, J. D., & Catalano, R. F. (2012). Cost-benefit analysis of
Communities That Care outcomes at eighth grade. Prevention Science, 13(2), 150–161.
https://doi.org/10.1007/s11121-011-0259-9
Levin, H. M. (1975). Cost-effectiveness analysis in evaluation research. In M. Guttentag & E. L.
Struening (Eds.), Handbook of evaluation research (Vol. 2, pp. 346–368). Sage
Publications.
Levin, H. M. (1983). Cost effectiveness: A primer. Sage Publications.
Levin, H. M. (2009). The economic payoff to investing in educational justice. Educational
Researcher, 38(1), 5–20. https://doi.org/10.3102/0013189X08331192
Levin, H. M., & Belfield, C. (2015). Guiding the development and use of cost-effectiveness
analysis in education. Journal of Research on Educational Effectiveness, 8, 400–412.
https://doi.org/10.1080/19345747.2014.915604
Levin, H. M., Catlin, D., & Elson, A. (2007). Costs of implementing adolescent literacy programs.
In D. Deshler, A. S. Palincsar, G. Biancarosa, & M. Nair (Eds.), Informed choices for
struggling adolescent readers: A research-based guide to instructional programs and
practices (pp. 61–91). International Reading Association.
Levin, H. M., & McEwan, P. J. (2001). Cost-effectiveness analysis: Methods and applications
(2nd ed.). Sage Publications.
Levin, H., McEwan, P., Belfield, C., Bowden, A. B., & Shand, R. (2018). Economic evaluation in
education: Cost effectiveness and benefit-cost analysis (3rd ed.). Sage Publications.
Mastri, A., & McCutcheon, A. (2015). Costs of services provided by the WIA adult and dislocated
worker programs. Mathematica Policy Research and Social Policy Research Associates.
https://www.mathematica.org/our-publications-and-findings/publications/costs-of-
services-provided-by-the-wia-adult-and-dislocated-worker-programs

Standards for the Economic Evaluation of Educational and Social Programs
AMERICAN INSTITUTES FOR RESEARCH® | AIR.ORG 70
National Academies of Sciences, Engineering, and Medicine. (2016). Advancing the power of
economic evidence to inform investments in children, youth, and families. The National
Academies Press. https://doi.org/10.17226/23481
Neumann, P. J., Sanders, G. D., Russell, L. B., Siegel, J. E., & Ganiats, T. G. (Eds.). (2016). Cost-
effectiveness in health and medicine. Oxford University Press.
Perez-Arce, F., Constant, L., Loughran, D. S., & Karoly, L. A. (2012). A cost-benefit analysis of the
national guard youth ChalleNGe program (TR-1193-NGYF). RAND Corporation.
https://www.rand.org/pubs/technical_reports/TR1193.html
Reynolds, A. J., Temple, J. A., White, B., Ou, S., & Robertson, D. L. (2011). Age-26 cost-benefit
analysis of the child-parent center early education program. Child Development, (82)1,
379–404. https://doi.org/10.1111/j.1467-8624.2010.01563.x
Rice, J. K. (1997). Cost analysis in education: Paradox and possibility. Educational Evaluation and
Policy Analysis, 19(4), 309–317. https://doi.org/10.3102/01623737019004309
Rice, J., & Hall, L. J. (2008). National Board Certification for teachers: What does it cost and how
does it compare? Education Finance and Policy, 3(3), 339–373.
https://doi.org/10.1162/edfp.2008.3.3.339
Robinson, L. A., Hammitt, J. K., Cecchini, M., Chalkidou, K., Claxton, K., Cropper, M., Hoang-Vu
Eozenou, P., de Ferranti, D., Deolalikar, A. B., Guanais, F., Jamison, D. T., Kwon, S., Lauer,
J. A., O’Keefe, L., Walker, D., Whittington, D., Wilkinson, T., Wilson, D., & Jamison, D. T.
(2019). Reference case guidelines for benefit-cost analysis in global health and
development. Harvard T. H. Chan School of Public Health.
https://cdn1.sph.harvard.edu/wp-content/uploads/sites/2447/2019/05/BCA-
Guidelines-May-2019.pdf
Rouse, C. (2007). Consequences for the labor market. In C. Belfield & H. Levin (Eds.), The price
we pay: Economic and social consequences of inadequate education (pp. 99–124).
Brookings Institution Press.
Russell, L. B., Gold, M. R., Siegel, J. E., Daniels, N., & Weinstein, M. C. (1996). The role of cost-
effectiveness analysis in health and medicine. Journal of the American Medical
Association, 276(14), 1172–1177. https://doi.org/10.1001/jama.1996.03540140060028
Schaberg, K., & Greenberg, D. (2020). Long-term effects of a sectoral advancement strategy:
Costs, benefits, and impacts from the WorkAdvance Demonstration. MDRC.
https://www.mdrc.org/sites/default/files/WorkAdvance_5-Year_Report-Final.pdf

Standards for the Economic Evaluation of Educational and Social Programs
AMERICAN INSTITUTES FOR RESEARCH® | AIR.ORG 71
Siegel, J. E., Weinstein, M. C., Russell, L. B., & Gold, M. R. (1996). Recommendations for
reporting cost-effectiveness analyses. Journal of the American Medical Association,
276(16), 1339–1341.
Taylor, L., & Fowler, W. (2006). A comparable wage approach to geographic cost adjustment
(NCES 2006-321). U.S. Department of Education, National Center for Education
Statistics. https://nces.ed.gov/pubs2006/2006321.pdf
Temple, J. A., & Reynolds, A. J. (2007). Benefits and costs of investments in preschool
education: Evidence from the Child–Parent Centers and related programs. Economics of
Education Review, 26(1), 126–144. https://doi.org/10.1016/j.econedurev.2005.11.004
Trostel, P. A. (2010). The fiscal impacts of college attainment. Research in Higher Education,
51(3), 220–247.
Vining, A., & Weimer, D. L. (2010). An assessment of important issues concerning the
application of benefit-cost analysis to social policy. Journal of Benefit-Cost Analysis, 1(1),
1–40. https://doi.org/10.2202/2152-2812.1013
Vining, A., & Weimer, D. L. (2019). The value of high school graduation in the United States: Per-
person shadow price estimates for use in cost-benefit analysis. Administrative Sciences,
9(4), 1–15. https://doi.org/10.3390/admsci9040081
Weimer, D. L. (2015). The thin reed: Accommodating weak evidence for critical parameters in
cost-benefit analysis. Risk Analysis, 35(6), 1101–1113.
https://doi.org/10.1111/risa.12329
Weimer, D., & Vining, A. (2009). Investing in the disadvantaged: Assessing the benefits and
costs of social policies. Georgetown University Press.
Weinstein, M. C., Siegel, J. E., Gold, M. R., Kamlet, M. S., & Russell, L. B. (1996).
Recommendations of the Panel on Cost-Effectiveness in Health and Medicine. Journal of
the American Medical Association, 276(15), 1253–1258.
What Works Clearinghouse. (2020). What Works Clearinghouse Standards Handbook, Version
4.1. Washington, DC: U.S. Department of Education, Institute of Education Sciences,
National Center for Education Evaluation and Regional Assistance.
https://ies.ed.gov/ncee/wwc/handbooks
World Bank. (n.d.). Inflation, GDP deflator.
https://data.worldbank.org/indicator/NY.GDP.DEFL.KD.ZG?locations=US

Standards for the Economic Evaluation of Educational and Social Programs
AMERICAN INSTITUTES FOR RESEARCH® | AIR.ORG 72
Zerbe, R. O., Jr., Davis, T. B., Garland, N., & Scott, T. (2010). Toward principles and standards in
the use of benefit-cost analysis. University of Washington, Benefit-Cost Analysis Center.
Zhuang, J., Zhihong, L., Tun, L., & Franklin De Guzman, F. (2007). Theory and practice in the
choice of social discount rate for cost-benefit analysis: A survey (ERD Working Paper No.
94). Asian Development Bank.
https://www.adb.org/sites/default/files/publication/28360/wp094.pdf

Standards for the Economic Evaluation of Educational and Social Programs
AMERICAN INSTITUTES FOR RESEARCH® | AIR.ORG 73
Appendix A. Standards Checklist
This appendix lists the standards enumerated in Chapters 2–4 without the discussion sections.
It can serve as a checklist to guide and evaluate CA, CEA, and CBA.
Cost Analysis Standards Checklist
Evaluation Design: Cost Analysis
1. Whenever possible, plan cost analyses in advance of the implementation period to be studied
and conduct them concurrently with program implementation and operation.
2. Develop a cost analysis plan that describes the study motivation and context, the program
being analyzed, and study design considerations.
3. Align data collection sources and methods with the research questions.
4. Use a perspective aligned with the research objectives. Choose the perspective prior to
collecting data and justify the choice of perspective.
– In the absence of a rationale to do otherwise, the societal perspective is preferred and is
the standard for the reference case analysis.
– Consider using the perspective of the main implementing agency (e.g., school, district,
state education agency) if it can usefully inform a decision.
– Consider the perspective of participants (e.g., teachers, families, or students) when it is
important to assess whether the program is worth the necessary time and effort from
the participants’ point of view.
5. In evaluations that include multiple sites, plan to estimate the costs of the program for all sites
(and, where relevant, the costs of the counterfactual or control condition) using data from
multiple locations or contexts. If possible, plan to collect data from all sites. When this is not
practicable, employ a method of sampling sites that supports valid inferences to the population
of interest.
6. The unit of analysis for costs should be the level at which the program is delivered. This may
differ from the unit of analysis for determining effects, which often is at the individual
participant level. The units of analysis must be aligned for the purposes of a cost-effectiveness
analysis or cost-benefit analysis.
Data Collection: Cost Analysis
7. Collect data on the resources required to implement all activities necessary to produce the
observed outputs or impacts of the program at the implementation site(s) under typical

Standards for the Economic Evaluation of Educational and Social Programs
AMERICAN INSTITUTES FOR RESEARCH® | AIR.ORG 74
conditions and, where relevant, the control sites. Exclude sunk costs and costs of activities that
occur after the implementation period studied.
8. Collect data to assess the economic value of all resources required to implement and operate
programs in practice, as represented by their opportunity costs.
9. Use a recognized method for identifying and valuing the resources needed to implement and
operate the program being studied.
10. Collect information on the actual resources used to implement and operate the program and,
wherever possible, draw on multiple sources of information.
11. Systematically record and categorize, in a transparent and reproducible manner, all resources
required to implement and operate a program in practice. Create resource categories that are
mutually exclusive and exhaustive and, at a minimum, separately list personnel, materials and
equipment, facilities, and other inputs.
12. If a resource is shared across multiple programs, determine an appropriate percentage of use to
attribute to the program being evaluated.
13. Record information about how resources used to implement the program are financed,
including
– which entity bears the costs of each resource (e.g., school, district, family);
– whether each resource is newly purchased (i.e., represents a new expenditure), is an
existing resource reallocated from other uses, or is contributed in-kind; and
– where possible, the source of funding (e.g., annual school budget, Title I federal grant,
district office discretionary funds).
14. Identify a market or shadow price for each resource, record the year and source of the price,
identify the unit (e.g., hourly wage, annual salary, construction cost per square foot), and
identify to which geographical location it is relevant.
15. Collect a price for each resource in the currency of the country in which the program is
implemented. The type of prices (e.g., national average, local average, local actual) assigned to
resources should reflect the intended audience and level to which the analyst wishes to
generalize the findings. In all cases, record the year to which each price is relevant. For the
reference case, use national average prices.
Analyzing the Data: Cost Analysis
16. When a program is implemented across multiple years, discount resource costs to a present
value using a single reference year.
Standards for the Economic Evaluation of Educational and Social Programs
AMERICAN INSTITUTES FOR RESEARCH® | AIR.ORG 75
17. Choose one year in which to express costs and convert nominal prices from different years into
constant currency (i.e., real prices) for that year, by adjusting for inflation using published
inflation indices or a justifiable, predicted inflation rate.
18. If the analysis combines data from multiple geographical locations within one country, use
national average prices or apply geographical indices to standardize prices across geographical
sites to avoid mixing local prices from one locality with local prices from another. Prices from
different countries should not be mixed.
19. When adopting a societal perspective, do not include monetary transfers when calculating
program costs, except for the costs of administering them. Instead, account for monetary
transfers when conducting a financial analysis of who pays for or provides resources for
program implementation or when conducting an analysis from the perspective of the payers or
recipients of the transfers.
20. Calculate summary cost metrics and any additional cost breakdowns identified in the cost
analysis plan.
21. Calculate a range of results to reflect systematic variation in implementation and/or in the
sensitivity of the cost estimates to different analytical assumptions. To the extent possible, vary
the assumptions that are most likely to alter results in ways that are relevant to policy or
practice or are the most uncertain.
22. Determine and clearly document the populations and contexts to which the analysis is
generalizable, as well as factors that could affect generalizability (e.g., sample served, local
market conditions and resource availability, relative price levels and currency conversions, time
period over which implementation occurred).
23. For established programs being considered for scale-up, determine which resources incur fixed,
variable, or lumpy costs and estimate the marginal costs of serving an additional participant or
site at a specified scale.
24. Optional/advanced standard: Gather empirical evidence and conduct analysis on the
representativeness and generalizability of the cost analysis sample and context under study.
25. Optional/advanced standard: Ensure that the results are replicable by performing cost analyses
repeatedly in identical or similar contexts.
Reporting the Results: Cost Analysis
26. Provide a report on the cost analysis, including the study motivation and context, descriptive
information about the program analyzed and any comparison conditions, and cost analysis
design choices.

Standards for the Economic Evaluation of Educational and Social Programs
AMERICAN INSTITUTES FOR RESEARCH® | AIR.ORG 76
27. Provide summary cost metrics and any additional cost breakdowns identified in the cost
analysis plan. In addition, provide data spreadsheets to facilitate replication of results.
28. Costs or savings not directly associated with resources used to implement and operate the
program or that arise after the program period should be reported separately as induced or
averted costs.
29. Report the major sources of uncertainty in the analysis.
30. Present conclusions, recommendations, and limitations of the study and discuss the
generalizability of the results to other populations and localities.
31. For established programs being considered for scale-up, the analyst should categorize and
report costs as fixed, variable, or lumpy at the scale of operation studied and report the
marginal costs of serving an additional participant, classroom, school, or site. The analyst
should indicate the relevant increments for lumpy costs (e.g., a classroom space is required
for every 25 students) and at what point of program expansion (or contraction) a fixed cost
would change.
Cost-Effectiveness Analysis Standards Checklist
Evaluation Design: Cost-Effectiveness Analysis
32. At the design phase, a cost-effectiveness analysis should be embedded within an experimental
or quasi-experimental evaluation of the focal intervention (i.e., program, policy, or practice).
33. The primary outcome(s) from the impact evaluation to be used in a cost-effectiveness analysis
should be identified at the design phase and aligned with the program’s theory of change. The
outcomes should be (a) meaningful for the study’s audience and (b) permit comparison of the
cost-effectiveness results to those from other impact evaluations.
34. Identify alternative programs with evidence of effectiveness on the primary outcome(s) being
studied to establish relevant comparisons for the evaluation’s effects and costs, when available.
35. To the extent possible during design, describe what the intervention will be compared to in the
evaluation, often a control or a business as usual condition, and the expected difference in
resource requirements between the treatment and control conditions.
36. The sample design to estimate effects should guide the sample design for the cost-effectiveness
analysis to ensure that costs are estimated using observations that are representative of the
effectiveness study sample. Ideally, costs and effects will be estimated using data observed
from all units in the sample.
37. The sample design for the cost study should facilitate the estimation of cost-effectiveness ratios
for subgroups when the theory of change indicates variation (heterogeneity) in expected effects

Standards for the Economic Evaluation of Educational and Social Programs
AMERICAN INSTITUTES FOR RESEARCH® | AIR.ORG 77
among evaluation groups or when the evaluation prespecifies subgroup analyses. Cost
estimates from one subgroup should not be substituted for estimates from another subgroup
when calculating subgroup cost-effectiveness ratios.
Data Collection: Cost-Effectiveness Analysis
38. Cost data should be collected to reflect the same intervention implementation and treatment
contrast as the outcomes data used to estimate effects. Approaches for collecting costs and
outcomes should be similar between the treatment and control conditions.
39. Data on costs and effects should be collected on the number of participants who did and did
not receive the treatment in both the treatment and control groups.
40. If the theory of change indicates that the intervention may induce changes in other services that
likely will affect the outcomes of interest, data on these induced costs should be collected for
both the treatment and control conditions to include these indirect changes in costs as a
component of the cost to produce an effect.
41. Outcomes should be measured with policy-relevant instruments that are appropriate for the
theory of change and the grade level or age group of interest.
42. When studying an outcome that would appropriately be aggregated across multiple years (e.g.,
earnings), it is useful to collect data on the outcome across time to allow for the discounting of
effects.
43. When subgroup analyses are planned, gather outcome data to allow for disaggregation and
analysis by subgroups and assessment of the distribution of effects.
Analyzing the Data: Cost-Effectiveness Analysis
44. Effects should be estimated using an appropriate research design that rules out common
threats to internal validity and allows for causal interpretation. The effects should be
standardized to facilitate comparisons with effects from other studies.
45. Standard errors for measures of effectiveness should be reported to correctly account for
design issues, such as cluster-randomization, and report tests of the null hypothesis where the
observed effect is zero.
46. Estimated costs to produce effects should be based on the incremental costs (i.e., the
differences in resources used) between the treatment and control conditions.
47. Analyze the distribution of costs incurred by different stakeholder groups.
48. The cost-effectiveness ratio should be constructed using estimated effects on the primary
outcome(s) identified at the design phase.

Standards for the Economic Evaluation of Educational and Social Programs
AMERICAN INSTITUTES FOR RESEARCH® | AIR.ORG 78
– When a study has multiple primary outcomes, especially across different domains (e.g.,
health and education), there should be multiple cost-effectiveness ratios, each including
the full cost per participant in the numerator.
– In cases of prespecified subgroup analyses, cost-effectiveness ratios should be
calculated for each subgroup.
49. Analyze variation in costs that are caused by differences in program scale, market fluctuations,
or intervention dosage because these aspects of delivery relate to effectiveness.
50. Analyze uncertainty in costs, effects, and cost-effectiveness to identify what may be caused by
model uncertainty, structural uncertainty, heterogeneity, measurement error, or stochastic
uncertainty.
Reporting the Results: Cost-Effectiveness Analysis
51. Report corresponding incremental costs and effects in the same unit of analysis with
descriptions of what was received by the control or comparison group. Describe the groups to
which the costs and effects pertain and likely limits to their generalizability.
52. Following the reporting of costs and effects, a cost-effectiveness ratio should be reported for
primary outcome(s). When effect sizes for primary outcomes are statistically indistinguishable
from zero, it is not appropriate to calculate a ratio except when the null effect is precisely
estimated to be zero.
53. Report variance in costs and effects and discuss the main sources of variation in costs (e.g.,
scale, input prices). Discuss the implications for that intervention’s cost-effectiveness across a
plausible range of values in those factors.
54. Outcomes targeted by the intervention but not included in the evaluation should be clearly
listed with justification for not including them in the analysis.
55. A comparative cost-effectiveness analysis compares reported costs, effects, and cost-
effectiveness ratios, often across different studies, of two or more interventions that target
equivalent outcomes. When comparing cost-effectiveness, costs and effects should be plotted
on a cost-effectiveness plane in addition to presenting costs, effects, and cost-effectiveness
ratios in a table.
Cost-Benefit Analysis Standards Checklist
Evaluation Design: Cost-Benefit Analysis
56. A cost-benefit analysis should begin with careful planning in advance of conducting the analysis,
including specifying which outcomes will be monetized, the methods used to calculate the

Standards for the Economic Evaluation of Educational and Social Programs
AMERICAN INSTITUTES FOR RESEARCH® | AIR.ORG 79
monetary value of outcomes (benefits), and the time horizon during which costs and benefits
will be measured.
57. A cost-benefit analysis should have a clearly defined time horizon that represents the period
during which all costs and benefits associated with the program are either observed or
expected to occur.
58. Costs and benefits used in a given cost-benefit analysis should be calculated from the same
perspective (i.e., stakeholders from the private sector, the public sector, or society as a whole)
and aligned with the study research question of interest. When the appropriate perspective to
take is not clear, the analyst should use the societal perspective and then consider whether
other perspectives, such as that of the program implementer and/or participants, should
additionally be adopted.
59. The present value of costs used in a cost-benefit analysis should represent incremental costs,
defined as the difference in the value of resources associated with the program (treatment)
condition and the resources expended in the counterfactual (control) condition used to
estimate the outcome effects on which benefits are measured.
60. The measures of changes in outcomes associated with a program used in a cost-benefit analysis
should be rigorous causal estimates of impact relative to the comparison condition. Any
anticipated or known bias in the impact estimates used in the cost-benefit analysis should be
disclosed and the implications for the estimates of economic returns discussed.
61. The unit used for calculating primary benefits in a cost-benefit analysis should align with the
unit of analysis at which program impacts are estimated with the understanding that
– secondary benefits may be calculated using a different unit of analysis, and
– all benefits must be aggregated for calculating and reporting final summary analysis
metrics.
Data Collection: Cost-Benefit Analysis
62. Outcomes should be expressed in monetary terms using an accepted shadow pricing technique,
with discussion of the validity of the method. Shadow prices derived from extant research may
be used, assuming a formal benefit transfer mechanism has been conducted that demonstrates
how the prices are applicable to the outcomes and context being investigated.
63. A cost-benefit analysis should take into account all relevant benefits associated with outcomes
that accrue to program participants and other individuals, including those associated with the
labor market (higher employability and earnings), health, and crime. Benefits that spill over to
nonparticipants in a program also should be accounted for where relevant. Monetized outcome
impacts should be derived using a demand-supply market framework.

Standards for the Economic Evaluation of Educational and Social Programs
AMERICAN INSTITUTES FOR RESEARCH® | AIR.ORG 80
Analyzing the Data: Cost-Benefit Analysis
64. Program costs and benefits that occur across multiple years should be expressed in constant
terms, reflecting the value of a dollar or other currency for a given year.
65. Program consequences should be expressed in monetary values. Adverse (negative) benefits
should not be classified as costs when calculating summary measures of economic returns such
as the net present value or the benefit-cost ratio.
66. A cost-benefit analysis should include separate calculations of the present values of the total
benefits and the incremental costs associated with implementation of the program being
investigated, in addition to calculation of the net present value, defined as the present value of
total benefits minus the present value of incremental costs. Calculation of additional summary
metrics, including the benefit-cost ratio, the internal rate of return, and the break-even point
should be considered.
67. A cost-benefit analysis should evaluate the sensitivity of results by performing calculations that
use the largest and smallest of the plausible alternative values for each parameter (a partial
sensitivity analysis). In addition, a Monte Carlo analysis that addresses uncertainty resulting
from sampling variation should be conducted whenever possible. In the absence of conducting
a Monte Carlo simulation, a best- or worst-case analysis should be performed.
68. All impacts, regardless of their statistical significance, should be monetized and included in the
calculation of summary measures of economic returns, such as the net present value and the
benefit-cost ratio.
69. Benefits and costs that cannot be quantified and monetized should be listed and assessed in
terms of how their exclusion might have affected the findings given the benefits and costs that
were quantified and monetized. In such a qualitative cost-benefit analysis, it is especially
important to consider whether a finding of a positive or negative net present value could
potentially be reversed if any missing nonmonetized benefits and costs were taken into
account.
Reporting the Results: Cost-Benefit Analysis
70. The reported summary measures of economic returns from the cost-benefit analysis should
include, at a minimum, the present values of costs and benefits and the net present value.
71. Report summary measures of economic returns using a perspective (stakeholders from the
private sector, public sector, or societal as a whole) that is aligned with the study research
questions. When it is not clear which perspective to take, the analyst should report the
summary measures from a societal perspective, which includes all relevant stakeholder
subgroups in the private and public sectors.

Standards for the Economic Evaluation of Educational and Social Programs
AMERICAN INSTITUTES FOR RESEARCH® | AIR.ORG 81
72. Reports of cost-benefit analysis findings should include a host of information pertaining to
implementation context, the different treatment and control conditions on which the
incremental costs and outcome impacts are based, the time horizon during which costs and
benefits are estimated, the pricing and discounting methods used in estimating costs and
benefits, summary measures of economic returns, a sensitivity analysis of estimates, and
breakdowns of costs and benefits by various stakeholder perspectives.

Standards for the Economic Evaluation of Educational and Social Programs
AMERICAN INSTITUTES FOR RESEARCH® | AIR.ORG 82
Appendix B. Glossary
Amortization: Spreading costs of a resource across its useful years and applying an appropriate
discount rate to represent the annual opportunity cost of using that resource.
Averted costs: Costs avoided as a result of a program; for example, early remediation of
reading deficiencies may reduce or eliminate the costs associated with grade repetition.
Benefit transfer: Application of shadow prices established in previous studies to value benefits
for similar outcomes generated by the intervention under investigation.
Best- or worst-case sensitivity analysis: Assessment of the robustness of CA, CEA, or CBA
results by using the highest and lowest plausible values for uncertain parameters. For example,
in CBA, when the NPV is positive, the full set of plausible parameter values that are most likely
to turn the NPV negative are substituted for the base case parameters, or vice versa.
Business as usual (BAU): The program(s) in place prior to (or in the absence of) the introduction
of the program being studied.
Concurrent cost analysis: A cost analysis that coincides with the timing of program
implementation.
Contingent valuation (for determining shadow prices): Using a survey across a sample of
individuals to gauge their willingness to pay for desirable outcomes and/or willingness to accept
undesirable impacts.
Cost: The economic value of all resources used to implement a program in a particular setting
based on the forgone opportunity of using the resources in an alternative use.
Cost accounting: A systematic approach to recording resource descriptions, quantities, and
prices.
Cost analysis (CA): An economic evaluation that extends cost estimation by categorizing costs
to implement a program; varying key assumptions; and, where possible, addressing the
accuracy of the cost estimates (e.g., with confidence intervals or upper and lower bound
estimates).
Cost-benefit analysis (CBA): A type of economic evaluation that compares the present
discounted monetary values of intervention costs and outcomes (also referred to as benefit-
cost analysis).

Standards for the Economic Evaluation of Educational and Social Programs
AMERICAN INSTITUTES FOR RESEARCH® | AIR.ORG 83
Cost-effectiveness analysis (CEA): A comparative analysis in which two or more alternative
means of obtaining the same objective are assessed based on their costs per unit of
effectiveness. Because CEA is comparative, a program can be considered cost-effective only
relative to something else.
Cost-effectiveness ratio: Incremental costs of implementing and operating a program divided
by the incremental gains relative to a comparison group (i.e., effects). Interpreted as the cost to
achieve an effect (e.g., cost per additional high school graduate or cost per standard deviation
gain).
Cost estimation: A systematic method for identifying and documenting the quantity, quality,
and economic value, as represented by opportunity costs, of all resources such as personnel,
materials, equipment, and facilities used to implement and operate a program.
Cost-feasibility analysis: A method of assessing the resource requirements to implement a
program in a particular context and determine whether an entity possesses or can procure
sufficient resources to implement it.
Cost-utility analysis: A type of economic evaluation in which the incremental costs of an
intervention are compared with incremental units of utility, overall usefulness, or stakeholder
satisfaction. This type of evaluation is typically used when a program impacts multiple
outcomes and involves weighting the multiple outcome measures according to how much they
are valued by various stakeholder groups.
Counterfactual: Theorized to be what participants would experience in the absence of the
intervention/program of focus.
Deadweight loss (marginal excess tax burden): A measure of lost economic efficiency in the
form of lower consumer and/or producer surplus when the quantity of a good or service is not
produced at a socially optimal level.
Decay rate: The rate at which program impacts are predicted to grow or decline across time.
Defensive expenditure method (for determining shadow prices): Using the amount of money
the typical individual is willing to pay to avoid or mitigate unpleasant effects to estimate the
value of a service, good, or outcome. The savings on defensive expenditures as a result of a
policy or program implementation is one way to estimate a shadow price.
Development costs: Initial costs of designing and creating the program that will not be incurred
by others replicating it.

Standards for the Economic Evaluation of Educational and Social Programs
AMERICAN INSTITUTES FOR RESEARCH® | AIR.ORG 84
Direct costs: Costs incurred specifically to implement and operate the program in question.
Discount rate: Interest rate selected in a study to adjust costs and benefits to reflect the fact
that dollars (or other currency) available in the future are worth less than an equal amount of
dollars today.
Economic evaluation: An analysis that examines the costs to produce outputs or effects and
supports examinations of investment efficiency or resource allocation to achieve a goal. Used in
the standards as an umbrella term to refer to CA, CEA, and CBA.
Education agency’s perspective: The subset of costs that accrue to the district, school, college
system, state education agency, or intermediary organization implementing a program.
Effect size: The effect’s magnitude often expressed in terms of standard deviations of the
outcome variable in the control group.
External validity (of costs): The extent to which a cost estimate can be generalized to other
contexts (e.g., other sites, population groups, time periods).
Fixed costs: Costs that, for the scale of program implementation being analyzed, do not depend
on the number of participants (e.g., an assistant superintendent may spend 5% of their time
supervising a school nurse program regardless of the number of nurses, schools, or students
served).
Gross costs: The costs of all resources needed to implement and operate a program, regardless
of whether the resources are being reallocated from an existing use or are newly procured. For
programs that supplement or partially substitute BAU, gross costs include the costs of any
underlying programming (i.e., BAU), plus the incremental costs of the program. For programs
that substitute BAU, gross costs are the costs of the program alone. See Chapter 1 for
comprehensive illustrations of cost concepts.
Hedonic pricing method (for determining shadow prices): Using regression to isolate the
marginal impact of a single resource attribute on its overall price for prices not available in the
market.
Incremental (or differential): Costs of program implementation and operation above or below
the costs of an alternative program. Because incremental costs are relative, they can be positive
or negative (decremental). See Chapter 1 for comprehensive illustrations of cost concepts.
Indirect costs: The value of resources that contribute to the production of the program in
question but not incurred specifically to implement and operate it. These may include overhead

Standards for the Economic Evaluation of Educational and Social Programs
AMERICAN INSTITUTES FOR RESEARCH® | AIR.ORG 85
costs such as building maintenance, utilities, human resources, other centralized functions, or
induced costs.
Induced costs (aka external or mediated costs): Costs arising from behavioral change after an
intervention has been implemented that results in additional resources to be expended (Levin
et al., 2018, pp. 52, 201 & 225). These include spillovers and additional costs incurred as a result
of an intervention. For example, an intervention may have the positive effect of more students
going to college, but this incurs costs to the students for tuition and foregone earnings and to
the government in terms of financial aid and subsidies. In CBA, they are counted as negative
benefits.
Ingredients method (aka resource cost model): A method of accurately and consistently
estimating the costs of a program through identification, quantification, and pricing of the
comprehensive collection of personnel and nonpersonnel resources used for its
implementation.
Internal rate of return: The discount rate that makes the present discounted values of costs
and benefits equal. It is the rate that makes the NPV equal to zero.
Local prices: Prices of goods in the context of the local market that may differ from national
prices. For example, teacher wages in one local context could vary significantly from a national
average wage.
Lumpy costs: Costs that increase in steps at predictable thresholds (e.g., an additional school
bus may be needed for every 73rd student).
Marginal costs: Costs incurred to add one additional participant, site, or other unit to a
program.
Market method (for determining shadow prices): Use of the market value of a publicly
provided service or good to estimate costs or benefits.
Monetize: To translate changes in program outcomes attributable to a program (impacts) into
dollar terms.
Monte Carlo analysis: Simulations used to determine a range of results that reflect the
uncertainty to which cost-benefit findings are subject.
Negative benefits: Costs arising from behavioral change after an intervention has been
implemented that results in additional resources to be expended (Levin et al., 2018, pp. 52, 201
& 225). These include spillovers and additional costs incurred as a result of an intervention. For

Standards for the Economic Evaluation of Educational and Social Programs
AMERICAN INSTITUTES FOR RESEARCH® | AIR.ORG 86
example, an intervention may have the positive effect of more students going to college, but
this incurs costs to the students for tuition and foregone earnings and to the government in
terms of financial aid and subsidies. In CA and CEA, they are considered to be induced costs.
Net costs: A term used in multiple ways. Some analysts use “net” interchangeably with
“incremental”; some use it to refer to the balance of costs of implementation and any cost
savings or averted costs that arise as a result of the program, and some use it to refer to the
costs to a stakeholder after considering any transfers.
Net present value (NPV): A summary measure from CBA defined as the present discounted
value of the stream of benefits minus the present discounted value of the stream of costs
associated with an intervention. See also benefit-cost ratio and internal rate of return.
Operational costs: The costs to run the program after the start-up period is complete. Also
termed “steady-state,” “ongoing,” “recurrent” or “maintenance” costs. This may include staff
time, space, equipment, facilities, indirect costs, supplies and materials, costs of contracted
service providers or consultants, and other miscellaneous costs such as travel.
Opportunity cost: “The value of what is sacrificed by using a specific resource in one way rather
than in its best alternative use” (Levin & Belfield, 2015, p. 403). In practice, this often means
assigning a market price to a resource (e.g., salary and fringe benefits for personnel).
Outcome: Consequence of program implementation as measured by changes in behavior,
performance, or other measure of interest.
Overhead costs: Costs of operating an organization that are not directly attributable to a
specific program, such as building maintenance, utilities, human resources, and other
centralized functions. These are a subset of indirect costs.
Partial sensitivity analysis: An analysis in which an analyst varies one assumption or parameter
value used in the primary analysis to determine the sensitivity or robustness of results to that
assumption or value. In CEA and CBA, the largest or smallest plausible value for each parameter
used to estimate an NPV or a cost-effectiveness ratio is substituted in turn for the value used in
the base case to determine whether the findings are sensitive to the substitution.
Participants’ perspective: includes only the costs and benefits borne by program participants
and sometimes their families, for example, the opportunity costs of time for students attending
college, who could otherwise be in the workforce.
Price: The amount of money required to purchase a particular good in the market.

Standards for the Economic Evaluation of Educational and Social Programs
AMERICAN INSTITUTES FOR RESEARCH® | AIR.ORG 87
Program implementation: The operational stage of a program. Economic evaluation data
collection activities are most accurate when they occur as close to the program implementation
as possible.
Proportionality principle: Effort put into collecting and analyzing data should be commensurate
with the value of the information derived from those efforts.
Prospective cost analysis: Occurs before the program in question is implemented and involves
program planning and identification of all anticipated program costs.
Qualitative cost-benefit analysis: After monetizing as many benefits and costs as possible in a
CBA, qualitative estimates are made of the relative importance of the remaining benefits and
costs.
Reference case: “A standard set of practices that all analyses should follow to improve their
comparability and quality” (Robinson et al., 2019, p. i).
Resource cost model: “An ingredients-based approach which builds expenditure estimates
from the bottom up and organizes resource information around the structures of service
delivery” (Chambers, 1999, p. 130).
Resources: Tangible inputs, such as personnel, materials, equipment, and facilities (physical
spaces).
Retrospective cost analysis: Cost analysis that occurs after the program in question was
implemented.
Savings: A reduction in resource use as a result of a program. For example, a successful social-
emotional learning intervention may reduce the time an assistant principal spends on behavior
management. The value of that reduction represents the savings as a result of the program.
Sensitivity analysis: An analysis varying assumptions or parameter values used in the primary
analysis to determine sensitivity or robustness of results to those assumptions.
Shadow price: “An estimate of an economic value when market-based values are unavailable”
(Crowley et al., 2018, p. 378).
Site: The location where a program is implemented and most information on resource use is
gathered. For example, the site can be a classroom, point of service, county, or state.

Standards for the Economic Evaluation of Educational and Social Programs
AMERICAN INSTITUTES FOR RESEARCH® | AIR.ORG 88
Societal perspective: Takes into account the opportunity costs of all resources required to
implement and operate a program, regardless of who pays for or contributes the resources.
This perspective also accounts for program benefits to all stakeholders.
Total costs: The value of all resources needed to implement a program above and beyond BAU
in the context being studied. See Chapter 1 for comprehensive illustrations of cost concepts.
Trade-off method (for determining shadow prices): Leveraging the relationship between a
given outcome with an established monetary value and an intermediary outcome to determine
a shadow price for a third outcome that is related to the intermediary.
Start-up costs: The costs required to put the program in place or the “upfront investments that
might be required to launch a program” (Burwick et al., 2017, p. 21). This may include
recruitment and/or training of staff; purchase of program licenses; initial purchase of materials
and/or equipment; time spent by staff planning for the program; and developing partnerships,
policies, or procedures for the program.
Steady-state costs: The costs to run the program after the start-up period is complete. Also
termed “operational,” “ongoing,” “recurrent” or “maintenance” costs. This may include staff
time, space, equipment, facilities, indirect costs, supplies and materials, costs of contracted
service providers or consultants, and other miscellaneous costs such as travel.
Sunk costs: “Investments previously made in a program or project, such as original research
and development costs, as compared to ongoing costs” (Cellini & Kee, 2015, p. 505). These may
be a component of start-up costs.
Time horizon: The total period during which benefit and cost streams are either observed or
predicted.
Transfer: A financial mechanism, such as a fee, tax, toll, subsidy, or payment, that redistributes
the burdens or benefits of an intervention among different stakeholders. The transfer does not
change the net costs or benefits to society and has no opportunity cost because it does not
consume any real resources.
Uncertainty: Uncertainty in cost analysis can take several forms:
• Model uncertainty: Occurs when a cost model is misspecified because of unknown
elements of a theory of change (such as parental involvement) leading to omitted costs.
• Structural uncertainty: Occurs when there are systematic, unobserved differences in
implementation or variability in mechanisms (not random noise, which is discussed in

Standards for the Economic Evaluation of Educational and Social Programs
AMERICAN INSTITUTES FOR RESEARCH® | AIR.ORG 89
stochastic uncertainty) that are not documented in the cost analysis because it is unknown
or unobserved to the analyst, to participants/informants, and/or data are insufficient.
• Heterogeneity: Refers to differences in costs (and/or effects and benefits) based on the
sample and population.
• Measurement error: Under- or overestimation of costs (and/or effects and benefits)
because of inaccurate or imprecise instruments, incomplete data, or faulty memory of
respondents.
• Stochastic uncertainty: Uncertainty introduced simply because of random noise, or minor
fluctuations in cost (and/or effects or benefits) from site to site, or from participant to
participant, and questions about whether the sample of sites is sufficiently large and
representative to generalize to the study population.
Variable costs: Costs that vary proportionally with the number of program participants (e.g.,
the costs of individual student workbooks) or the number of sites, such as schools, districts or
provinces implementing the program).

Standards for the Economic Evaluation of Educational and Social Programs
AMERICAN INSTITUTES FOR RESEARCH® | AIR.ORG 90
Appendix C. Standards Creation Process
Recruitment and Panelist Selection In April 2020, AIR initiated the Cost Analysis Standards Project (CASP) by developing a plan for
the establishment and dissemination of standards for economic evaluation of educational and
other social programs. Dr. Jesse Levin of AIR invited Dr. Brooks Bowden from the University of
Pennsylvania and Dr. Fiona Hollands from Teachers College, Columbia University to co-lead this
initiative and help form a panel of experts to formulate the standards. The leadership team
structured the panel based on the three forms of economic evaluation most often applied to
social programs: CA, CEA and CBA.
A list of potential candidates to serve as expert panelists was developed based on the
leadership team’s knowledge of the field of economic evaluation and of authors of existing
standards for the economic evaluation of social programs. In addition, the leadership team
invited nominations from a variety of organizations. The following types of organizations,
mostly in the United States, were sources for the panelists:
• Research organizations
• Academic institutions
• Funding organizations
• Nongovernmental organizations
• Education agencies
• Providers of other social programs
For the following organizations at which multiple individuals were known to conduct economic
evaluations or where it was unclear whether there was a qualified expert, nominations were
sought from organizational leaders:
• Abt Associates
• Augenblick, Palaich and Associates
• Education Development Center
• Education Endowment Foundation
• J-PAL (Abdul Jameel Poverty Action Lab at Massachusetts Institute of Technology)
• MDRC
• Mathematica

Standards for the Economic Evaluation of Educational and Social Programs
AMERICAN INSTITUTES FOR RESEARCH® | AIR.ORG 91
• RAND
• Stanford Research International
• WestEd
• Westat
• World Bank
Criteria were established for the selection of panelists and applied to a list of approximately
50 candidates identified by the leadership team or nominated by the previous organizations.
The criteria for selection as a panelist were as follows:
• Criterion 1: Evidence of experience in executing economic evaluations (CA, CEA, or CBA) of
educational or other social programs.
• Criterion 2: Authorship of at least three written reports, journal articles, books, or other
publications on economic evaluations.
• Criterion 3: Creating/providing tools and supports for economic evaluations.
• Criterion 4: Providing instruction/training/technical assistance in economic evaluations.
• Criterion 5: Reviewing publications focused on economic evaluations.
• Criterion 6: Reviewing grant proposals focused on economic evaluations.
• Criterion 7: Serving as contributors/consultants on economic evaluations for
proposals/grants/projects submitted/led by others.
• Criterion 8: Setting Request for Applications requirements for research on social programs.
All panelists had to meet at least Criteria 1 and 2, as determined by leadership team reviews of
résumés and publications. Criteria 3–8 were additional considerations. The leadership team
invited 16 candidates who met at least Criteria 1 and 2 to serve as panelists, all but one of
whom accepted the invitation. Panelists received an honorarium from AIR for their contribution
to the standards process. Based on their relevant expertise, the 15 panelists were each
assigned to one of three working groups: CA (led by Dr. Hollands), CEA (led by Bowden), and
CBA (led by Dr. Levin). Exhibit C.1 lists the members of the expert panel assigned to each
working group.
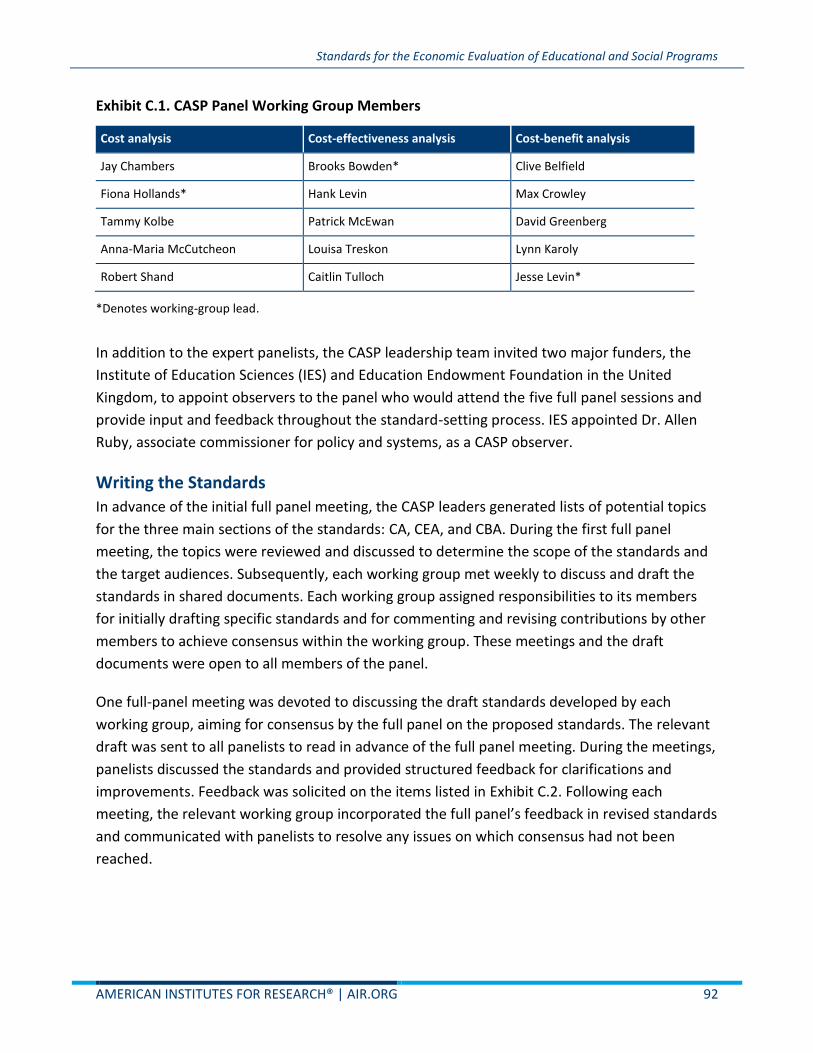
Standards for the Economic Evaluation of Educational and Social Programs
AMERICAN INSTITUTES FOR RESEARCH® | AIR.ORG 92
Exhibit C.1. CASP Panel Working Group Members
Cost analysis Cost-effectiveness analysis Cost-benefit analysis
Jay Chambers Brooks Bowden* Clive Belfield
Fiona Hollands* Hank Levin Max Crowley
Tammy Kolbe Patrick McEwan David Greenberg
Anna-Maria McCutcheon Louisa Treskon Lynn Karoly
Robert Shand Caitlin Tulloch Jesse Levin*
*Denotes working-group lead.
In addition to the expert panelists, the CASP leadership team invited two major funders, the
Institute of Education Sciences (IES) and Education Endowment Foundation in the United
Kingdom, to appoint observers to the panel who would attend the five full panel sessions and
provide input and feedback throughout the standard-setting process. IES appointed Dr. Allen
Ruby, associate commissioner for policy and systems, as a CASP observer.
Writing the Standards In advance of the initial full panel meeting, the CASP leaders generated lists of potential topics
for the three main sections of the standards: CA, CEA, and CBA. During the first full panel
meeting, the topics were reviewed and discussed to determine the scope of the standards and
the target audiences. Subsequently, each working group met weekly to discuss and draft the
standards in shared documents. Each working group assigned responsibilities to its members
for initially drafting specific standards and for commenting and revising contributions by other
members to achieve consensus within the working group. These meetings and the draft
documents were open to all members of the panel.
One full-panel meeting was devoted to discussing the draft standards developed by each
working group, aiming for consensus by the full panel on the proposed standards. The relevant
draft was sent to all panelists to read in advance of the full panel meeting. During the meetings,
panelists discussed the standards and provided structured feedback for clarifications and
improvements. Feedback was solicited on the items listed in Exhibit C.2. Following each
meeting, the relevant working group incorporated the full panel’s feedback in revised standards
and communicated with panelists to resolve any issues on which consensus had not been
reached.

Standards for the Economic Evaluation of Educational and Social Programs
AMERICAN INSTITUTES FOR RESEARCH® | AIR.ORG 93
Exhibit C.2. Considerations for Drafting, Reviewing, and Discussing Draft Standards
Consideration of
standards Discussion prompts
Completeness The body of standards are complete and thorough in covering all essential components of an
economic evaluation.
• Are there any missing standards that are essential to a rigorous economic evaluation?
Standard
placement
Standards are in a user-friendly order for all intended audiences.
• Is the standard placed in the correct stage (design, data collection, analysis, reporting?
• Are the standards in a logical sequence?
Risk of not
meeting standard
The risks associated with not meeting the standards should be described.
• How well is the risk of not meeting the standard described?
• Is it clear what the consequences are for researchers and consumers of research if the
standard is not met?
Clear and concise Standards need to be clear and concise to be used in the field.
• Can any words/phrases be eliminated from the standard without losing meaning?
• Is there anything confusing about the standards that could be more clearly stated?
Avoiding
“how-to”
The standards should not be a “how-to” document. Instead they should provide the reader
with what needs to be included in a rigorous cost study.
• Does this standard give too many “how-to” details?
• How can any “how-to” details be eliminated while maintaining the intended meaning of
this standard?
Examples in the
literature
As appropriate, references should be provided to point readers toward more information to
support conducting and interpreting economic evaluations.
• Are references provided to support researchers and consumers of research?
Once each set of standards was finalized by the respective working groups, AIR staff and the panel
co-leads synthesized all the standards into a draft of the final document. Panelists provided
feedback on this draft during the last full panel meeting. Once panelists’ comments were
incorporated, external reviewers were asked to provide feedback. These included individuals who
were not experts in economic evaluations but would be the types of researchers who would be
expected to conduct such evaluations as the demand from funders and policymakers increases.
These reviewers were asked to assess the usability of the standards, in particular with respect to
language and structure. Katie Dahlke (American Institutes for Research) served as the reviewer in
this capacity. In addition, the following experts in economic evaluation served as reviewers of the
rigor of the content and applicability to practical evaluation and decision making: David Knight

Standards for the Economic Evaluation of Educational and Social Programs
AMERICAN INSTITUTES FOR RESEARCH® | AIR.ORG 94
(University of Washington), Rebecca Maynard (University of Pennsylvania), and Aidan Vining (Simon
Fraser University). Feedback from external reviewers was incorporated in the final draft of this
document.
Details about the timeline for panel meetings and standards development are summarized in
Exhibit C.3.
Exhibit C.3. Summary of CASP Panel Timeline
Description Date
Meeting 1: Kickoff and Define Scope 7/23/2020
Work Period 1: Working Groups Develop Draft Standards 7/24/2020–8/21/2020
Meeting 2: First Deliberation: CA Standards 8/28/2020
Meeting 3: Second Deliberation: CEA standards 9/18/2020
Meeting 4: Third Deliberation: CBA standards 10/02/2020
Work Period 2: AIR Development of Draft Synthesis 10/03/2020–11/24/2020
Meeting 5: Panel Feedback on Synthesis 12/04/2020
Work Period 3: Internal/External Review of Draft Synthesis 02/01/2021
Work Period 4: Response to Synthesis Review Feedback 02/05/2021–04/09/2021
Work Period 5: Final Quality Assurance and Publication Services Production 04/30/2021
CASP Membership
CASP Leadership
A. Brooks Bowden, University of Pennsylvania
Fiona Hollands, Teachers College, Columbia University
Jesse Levin, American Institutes for Research
Amanda Danks, American Institutes for Research (Project Manager)
CASP Panelists
Clive Belfield, Queens College, City University of New York
Jay G. Chambers, American Institutes for Research
Max Crowley, Pennsylvania State University
David Greenberg, University of Maryland, Baltimore County
Henry Levin, Teachers College, Columbia University
Lynn Karoly, RAND Corporation

Standards for the Economic Evaluation of Educational and Social Programs
AMERICAN INSTITUTES FOR RESEARCH® | AIR.ORG 95
Tammy Kolbe, University of Vermont
AnnaMaria McCutcheon, Mathematica
Patrick J. McEwan, Wellesley College
Robert Shand, American University
Louisa Treskon, MDRC
Caitlin Tulloch, International Rescue Committee

LOCATIONS
Domestic: Arlington, VA (HQ) | Sacramento and San Mateo, CA | Chicago, IL | Indianapolis, IN | Waltham, MA | Rockville, MD |
Chapel Hill, NC | Austin, TX
International: Ethiopia | Haiti
14622_04/21
Established in 1946, the American Institutes for
Research® (AIR®) is a nonpartisan, not-for-profit
organization that conducts behavioral and social
science research and delivers technical assis-
tance both domestically and internationally in the
areas of education, health, and the workforce.
AIR’s work is driven by its mission to generate
and use rigorous evidence that contributes to a
better, more equitable world. With headquarters
in Arlington, Virginia, AIR has offices across the
U.S. and abroad. For more information, visit
www.air.org.
MAKING RESEARCH RELEVANT
AMERICAN INSTITUTES FOR RESEARCH
1400 Crystal Drive, 10th Floor
Arlington, VA 22202-3289 | 202.403.5000
www.air.org