Embed Size (px)
Citation preview
Standard Operating Procedure for the Determination of Lead in PM10 by Inductively Coupled Plasma Mass Spectrometry (ICP-MS) with Hot
Block Dilute Acid and Hydrogen Peroxide Filter Extraction
Prepared by
Eastern Research Group, Inc 601 Keystone Park Drive, Suite 700
Morrisville, NC 27560

1.0 SCOPE AND APPLICATION
This procedure details the acid extraction and trace elemental lead (Pb) analysis of ambient air samples using an inductively coupled plasma-mass spectrometer (ICP-MS). The extraction procedures are suitable for low-volume PM10 ambient air samples collected, as described in 40 CFR Appendix Q to part 50, Reference Method for the
Determination of Lead in Particulate Matter as PM10 Collected From Ambient Air, on Teflon® membrane filters, sized up to 47 mm in diameter.
This procedure is applicable to the analysis of suspended particulate matter collected with Teflon® filters. Acid digestion of samples and filtration (if necessary) is required prior to analysis of Teflon® filter extracts.
2.0 METHOD SUMMARY This procedure describes the determination of total Pb by ICP-MS in ambient air samples collected on 47mm Teflon® filters. The filters are digested in a HotBlock™ set to 95˚C for 2.5 hours using an extraction fluid containing 1.85% nitric acid (HNO3), 0.5% hydrochloric acid (HCl), and 0.17% hydrofluoric acid (HF). One aliquot of hydrogen peroxide (H2O2) is added after 1.5 hours of extraction and is allowed to effervesce. . After extraction, the extract is poured off and diluted to a final volume of 50 mL. The extract is analyzed by ICP-MS and the data are collected using the manufacturer’s software. The Method Detection Limit (MDL) was determined to be 0.0008 1 µg/m3 using spiked Teflon® filters analyzed in accordance to 40 CFR Part 136, Appendix B with an assumed filter volume of 24 m3 (see Table 21-1). This method is derived from the requirements of EPA Method IO- 3.5 and SW-846 Method 6020A.
3.0 DEFINITIONS AND ABBREVIATIONS
3.1 Definitions
3.1.1 Analytical Duplicate (DUP) – A second aliquot of a sample extract that is treated the same as the original sample in order to determine the precision of the method. Due to the fact that Teflon® filters are not collected as duplicates, the DUP in this method is performed by analyzing a second aliquot of the parent sample digestate as an analytical duplicate. See Section 13.4 for further elaboration on duplicates.
3.1.2 Blank (BLK) – An analytical sample designed to assess specific sources of
contamination.
3.1.3 Blank Spike/Blank Spike Duplicate (BS/BSD) – A spiked aliquot of laboratory reagent blank (LRB) with a blank Teflon® filter used as a quality control sample (QCS) to demonstrate spike recoveries and precision.
3.1.4 Calibration Blank – A blank solution containing all of the reagents in the same concentration as those used in the analytical sample preparation. This blank is not subject to the preparation method.

3.1.5 Calibration Standards – A series of known standard solutions used by the analyst for calibration of the instrument (i.e., preparation of the analytical curve). The solutions are not subject to the preparation method but contain the same matrix (i.e., the same amount of reagents and/or preservatives) as the sample preparations to be analyzed.
3.1.6 Continuing Calibration Blank (CCB) - A volume of ASTM Type I water acidified with the same acid matrix as is present in the calibration standards used to verify after every continuing calibration verification (CCV) that the instrument blank checks are reading ~ MDL.
3.1.7 Continuing Calibration Verification (CCV) – A Pb standard solution
prepared by the analyst and used to verify the stability of the instrument calibration with time, and the instrument performance during the analysis of samples. The CCV is the original calibration standard whose concentration is at the midpoint of the calibration curve that is re-analyzed as a sample.
3.1.8 Field Blank (FB) – This is any sample that is submitted from the field and is identified as a blank. This also includes trip blanks.
3.1.9 High Standard Verification (HSV) – The HSV is the highest calibration standard that is reanalyzed to verify the accuracy of the calibration curve at that concentration at the beginning of the analytical run.
3.1.10 Initial Calibration Blank (ICB) – A volume of ASTM Type I water acidified with the same acid matrix as is present in the calibration standards, which is analyzed after the ICV and used to verify that the instrument blank checks are ~ MDL.
3.1.11 Initial Calibration Verification (ICV) – A solution prepared from a stock standard solution obtained from a source separate from that utilized to prepare the calibration standards. The ICV is used to verify the concentration of the calibration standards and the adequacy of the instrument calibration.
3.1.12 Interferents – Substances (atoms, ions, polyatomic ions, etc.) which may affect the analytical result for the element of interest.
3.1.13 Internal Standard (ISTD) – A non-target element added to a sample at a known concentration after preparation but prior to analysis. Instrument responses to internal standards are monitored as a means of assessing overall instrument performance.
3.1.14 Laboratory Control Sample (LCS) – A spiked aliquot of LRB with a blank Teflon® filter used as a QCS that is prepared and brought through the entire digestion/extraction and analytical process to demonstrate spike recoveries.
3.1.15 Laboratory Reagent Blank (LRB) – An aliquot of ASTM Type I water that is treated exactly as a sample including exposure to all labware, equipment,
solvents, reagents and internal standards that are used with other samples. The LRB is used to determine if method analytes or other interferences are present in the laboratory environment, the reagents or apparatus.
3.1.16 Limit of Quantiation (LOQ) – The lowest concentration of an analyte that produces a signal/response that is sufficiently greater than the signal/response of lab reagent blanks to enable reliable detection and quantification during routine lab operating conditions. Statistically defined, this is the concentration of analyte in sample matrix that produces an instrument signal/response that is 10 times the standard deviation above the LRB (at 99% confidence, n-1 degree freedom).
3.1.17 Linear Dynamic Range (LDR) – The concentration range over which the analytical working curve generated from the calibration standards remains linear.
3.1.18 Lower Limit of Quantitation Check (LLQC) – The check sample is used to both establish and confirm the lower limit of quantitation and is prepared by spiking a low concentration of analyte into reagent water and carrying the solution through the entire preparation and analytical procedure.
3.1.19 Lower Limit of Quantitation Limit (LLQL) – The lower limit of quantitation is considered the lowest reliable laboratory reporting concentrations and should be established from the lower limit of quantitation check sample and then confirmed using either the lowest calibration point or from a low level calibration check standard.
3.1.20 Low Level Calibration Verification (LCV) – A stock standard solution prepared using the same source as the calibration standards that is analyzed to verify the LLQL. The standard is prepared at the same concentration as the LLQL and must meet an acceptance criteria of ± 30%. An LCV is analyzed at the beginning and end of every analysis.
3.1.21 Matrix Interference/Effect – In general, the interference and/or effect particular matrix constituents may cause during sample processing and/or analysis. Matrix effects may be determined to exist from the careful interpretation of QC samples and criteria. Examples of observed effects include but are not limited to poor recoveries of spikes/ISTD and poor percent differences.
3.1.22 Method Blank (MB) – An aliquot of LRB with a blank Teflon® filter that is carried through the entire preparation and extraction process to demonstrate background contamination contribution from the filter and process.
3.1.23 Method Detection Limit (MDL) – The minimum concentration of an analyte that can be identified, measured and reported with 99% confidence that the analyte concentration is greater than zero.
3.1.24 Performance Evaluation (PE) Sample – A sample of known composition provided by a source outside the laboratory for analysis that evaluates the laboratory’s analytical performance.
3.1.25 Quality Control Sample (QCS) – A solution containing known concentrations of Pb that is used to fortify an aliquot of LRB matrix. The QCS is prepared from a source(s) external to the laboratory and is used to verify the laboratory’s analytical performance.
3.1.26 Serial Dilution (SRD) – The dilution of a sample by a factor of five. If the undiluted parent sample concentration is minimally a factor of 50 above the MDL, the diluted sample should agree with the parent sample concentration within ± 10% when corrected by the dilution factor. The SRD may indicate the influence of interferents.
3.1.27 Standard Reference Material (SRM) – A prepared standard material that has certified metals concentrations, for example the NIST SRM 1648a (Urban particulate matter with certified concentrations of lead at 0.655 ± 0.033 mass fraction (in %)). The SRM is used to verify the extraction procedure.
3.1.28 Stock Standard Solution – A commercially prepared standard solution (traceable to NIST or other certified standard sources), which can be diluted to derive other standards.
3.1.29 Tuning Solution – A solution used to determine acceptable instrument performance prior to calibration and sample analyses. This solution is used for mass calibration, nebulizer optimization, auto lens optimization, and daily performance reports. Acceptable instrument performance is demonstrated by the analysis of the tuning solution in accordance with the instrument manufacturer.
3.2 Abbreviations
amu Atomic Mass Units ASTM American Society for Testing and Materials COC Chain of Custody cps Counts Per Second
DI Deionized L Liter(s)
LDPE Low Density Polyethelyene LIMS Laboratory Information Management System M~ Megohm m Meter(s) m3
Cubic Meter(s) mg Milligram mg/L Milligram(s) per Liter(s) min Minute(s) mL Milliliter(s)
ng Nanogram(s) ng/mL Nanogram(s) per milliliter(s) NIST National Institute of Standards and Technology µg/L Microgram(s) per liter µg/m3 Microgram(s) per cubic meter µL Microliter (s) µm Micrometer(s) v/v volume to volume ratio
4.0 INTERFERENCES
Note: The background level of Pb on a given lot of Teflon® filters can vary. Any background levels found on blanks should be documented for all the filters from the corresponding lot. It is recommended to consult 40 CFR Appendix G to part 50, Section 6.1 for guidance.
4.1 Laboratory Interferences
4.1.1 Wear powder-free nitrile gloves when handling unexposed or exposed filters.
4.1.2 Clean all equipment used in the sample preparation and analysis in a manner consistent with good laboratory practices for metals analysis (See Sections 13.9).
4.1.3 Use ASTM Type I DI water or equivalent, with a resistivity greater than 17.3 MΩ·cm, for sample extraction and standard preparation. Record the water resistivity prior to use.
4.2 Chemical Interferences
Pay close attention to the nature of solutions introduced to the ICP-MS.
4.2.1 Nitric acid must be less than 2% (v/v) for ICP-MS analysis to minimize the damage to the interface and to minimize isobaric molecular interferences. The use of platinum cones and other acid-resistant sample introduction components can be used for more aggressive acid matrices.
4.2.2 The final dilutions of sample extracts must match the acid content of the calibration standards in order to match potential interferences.
4.2.3 The concentrations of dissolved solids in analysis solutions should be less than 2% to protect the sample interface on the instrument and prevent signal suppression. Higher concentrations may plug the sample and/or skimmer cone orifices.
Note: Protect the channel electron multiplier from high chemical concentrations (high ion currents). The channel electron multiplier suffers from fatigue after being exposed to high ion currents. This fatigue can last from several seconds to hours depending on the extent of exposure. During this period, response factors are

constantly changing, which causes instrument instability that invalidates the calibration curve, and thereby, invalidates all associated sample results. A sodium bicarbonate (NaHCO3) sample matrix is known to cause this problem.
4.3 Instrument Interferences
4.3.1 Isobaric molecular and doubly charged ion interferences are caused by more than one atom or more than one charge.
4.3.2 Spectral interferences result from the presence of other isotopes or ions that have the same atomic weight or mass number as the analyte.
4.3.3 Transport interferences are a specific physical interference associated with the sample nebulization and transport process through the instrument. These usually result from sample matrix components that influence the aerosol formation or cause a change in the surface tension or viscosity. Changes in the matrix composition can cause observed signal suppression or enhancement.
4.3.4 Matrix interferences may be caused by elemental chemical and physical properties in the samples. For matrices of known composition, match the composition of the calibration and QC standards to that of the samples. For matrices of unknown composition, use an ISTD that has been matched to the analytes’ chemical and physical properties (i.e., ionization potential, ±50 amu) so that the ISTD and element of interest behave similarly during the analytical process.
4.3.5 Memory interferences can occur when there are large concentration differences between samples or standards that are analyzed sequentially. Sample deposition on the sample and skimmer cones, spray chamber, peristaltic pump tubing and the type of nebulizer all affect the extent of the memory interferences that are observed. The rinse period between samples must be long enough to eliminate significant memory interferences.
4.3.6 Lead values are reported from isotope 208; however, all three isotopes must be used to quantitate lead to allow for the variability of lead isotopes in nature. The following correction equation must be applied to isotope 208:
(1.000) (206Pb) + (1.000) (207Pb) + (1.000) (208Pb)
5.0 SAFETY
5.1 Personal protection should be used for all work performed in the inorganic laboratory, (e.g., gloves, safety glasses, laboratory coats, etc.).
5.2 The compressed gas cylinders must be stored and handled according to relevant safety codes outlined in the laboratories health and safety manuals. In use, the

cylinders must be secured to an immovable structure and moved using a gas cylinder cart.
5.3 Make sure that sample vials are kept capped and in racks to prevent spills.
5.4 All personnel should be trained in the handling, extraction and analysis of acid samples for inorganic analysis.
5.5 Strong acids must not be stored with organic solvents or samples.
6.0 EQUIPMENT
6.1 ICP-MS
This method uses the PerkinElmer SCIEX™ ELAN® 9000 ICP-MS, or equivalent. The system must consist of an inductively coupled plasma source, ion optics, a quadrupole mass spectrometer, a computer that controls the instrument, data acquisition and data handling software, a printer, an autosampler and a recirculator. The quadrupole mass spectrometer has a mass range of 2 to 270 amu. The ICP-MS should be maintained appropriately according to manufacturer recommendations.
6.2 Digestion System
Environmental Express HotBlock™ Digestion System or equivalent system capable of maintaining a temperature of 95°C within ± 2˚C. This temperature will heat the samples to a temperature of ~80°C (±5°C).
7.0 MATERIALS
7.1 Graduated polypropylene sample vials with screw caps, 50 mL volume (certified to be within ± 0.2mL).
7.2 Pipetters with adjustable volumes ranging from 0.5 µL to 10 mL and disposable tips. Mechanical pipettes must be verified for accuracy quarterly (or every three
months). Repeatable, mechanical pipettes, such as Eppendorf Research®, may be used and their accuracy should be verified on a quarterly basis to be within the manufacturer’s specifications. If a pipette’s accuracy exceeds the manufacturer’s specifications its use should be discontinued and it should be replaced or sent in for repair.
7.3 Miscellaneous: powder-free nitrile gloves; disposable laboratory wipes; self adhesive labels.
7.4 Volumetric flasks. Teflon®, Class A, 50, 100, 250 and 500 mL capacities.
7.5 Storage bottles. Wide and narrow mouth, Teflon® FEP (fluorinated ethylene propylene) with Tefzel® ETFE (ethylene tetraflourethylene) screw closure, 100, 250 500, 1,000 and 2,000 mL capacities.

7.6 Reflux caps and FilterMate™ 2 µm Teflon® filters.
7.7 Wash bottles made of LDPE and Teflon® having 500 mL and 1 L capacities.
7.8 Plastic or Teflon® coated tweezers.
8.0 CHEMICALS, REAGENTS, STANDARDS AND THEIR PREPARATION
Note: In general, chemicals, reagents and commercial stock standards expire when specified by the manufacturer. If the manufacturer does not provide an expiration date then they shall expire one year from the opened date. Standards and other solutions prepared in-house expire as specified throughout the procedure.
8.1 High Purity Acids - Concentrated ultrapure acids stored in Teflon® Bottles. These reagents are used for the preparation of sample extraction fluid and all standards. 8.1.1 60-70% Nitric Acid (HNO3) 8.1.2 32-35% Hydrochloric Acid (HCl)
8.1.3 47-51% Hydrofluoric Acid (HF)
8.1.4 Extraction fluid (0.5% HCl, 1.85% HNO3, 0.17% HF)
Preparation: The standard solvent is prepared by adding 5 mL of HCl, 18.5 mL of HNO3 and 1.7 mL of HF to ~900 mL ASTM Type I DI water and brought to a final volume of 1,000 mL. Mix thoroughly.
8.1.5 Standard Solvent (0.3% HCl, 1.11% HNO3, and 0.102% HF)
Preparation: The standard solvent is prepared in a 1000 mL volumetric flask by adding 3 mL of HCl, 11.1 mL of HNO3, and 1.02 mL of HF to ~900 mL ASTM Type I DI water. Dilute to 1000 mL with DI water and mix thoroughly.
8.2 30-32% Hydrogen Peroxide (H2O2) – Concentrated ultrapure stored in Teflon® bottles. This reagent is used for the extraction procedure.
8.3 Nitric Acid – Trace Metal Grade in 2.5 L glass for rinse blank and labware cleaning.
8.3.1 Rinse blank (2% HNO3, 0.5% HCl)
Preparation: The rinse blank is prepared by adding 20 mL of trace metal grade HNO3 and 5 mL of HCl, to ~900 mL ASTM Type I DI water and brought to a final volume of 1 L.

8.3.2 10% HNO3 acid bath for labware cleaning.
Preparation: The acid bath solution is prepared by adding 2.5L of concentrated trace metal grade HNO3 to 22.5 L of ASTM Type I DI water.
8.4 ASTM Type I deionized water – With a resistivity greater than 17.3 MΩ·cm.
8.5 Argon gas – Purity > 99.996%, Oxygen < 5 mg/L, Hydrogen < 1 mg/L, Nitrogen < 20 mg/L and Water < 4 mg/L.
8.6 Calibration Working Standard – Prepared standard used to create the calibration standards.
Preparation: The calibration working standard is prepared at a lead concentration of 0.2 µg/mL by diluting 0.02 mL of a 1,000 µg/mL Pb standard to 100 mL with standard solvent as described in Section 8.1.5.
8.7 Secondary Source Control Standards – A commercially prepared Pb element secondary source (different manufacturer from the calibration standard) NIST traceable calibration standards utilized to produce the ICV is run as a verification
of the instrument’s calibration for accuracy and precision (99.99 – 99.999% pure).
8.8 Single-Element Stock Standard Solutions – Commercially prepared NIST traceable standards from ultra high-purity grade Pb (99.99 – 99.999% pure) with a concentration of 1,000 µg/mL designed for use with ICP-MS instruments.
8.9 Smart Tune Solution – Although custom tuning solutions may be used, the tuning solution for this procedure may be purchased through the manufacturer or prepared in-house using single-element standards. Solutions prepared in-house should follow the manufacturer’s recommendations for added elements and concentrations.
8.10 Dual Detector Cross Calibration Solution – Refer to Section 10.3 for the purpose of this solution. Although custom cross calibration solutions can be used, it may be purchased through the manufacturer or prepared in-house using single-element standards.
8.11 ISTD stock standard – A commercially prepared 1,000 µg/mL bismuth standard is used to prepare the internal standard, which can be purchased from vendors, such as High Purity™ Standards.
8.12 Internal Standard Spike Solution – Prepared standard used to manually spike all calibration and QC standards as well as all samples that are analyzed by the ICP-MS.
Preparation: The internal standard solution is prepared at a Bi concentration of 35 µg/mL by diluting 3.5 mL of a 1,000 µg/mL Bi standard to 100 mL with standard solvent. For every 10 mL of sample, 20 µL of ISTD spike solution should be added prior to instrument analysis.

8.13 Blank Spike (BS) Standard – The BS standard is used to spike the blank spike (BS) and blank spike duplicate (BSD) (See Section 13.3).
Preparation: The blank spike standard is prepared at a lead concentration of 0.5 µg/mL by diluting 0.025 mL of a 1,000 µg/mL Pb standard (± 3%) to 50 mL with standard solvent. Information on how to prepare the spiked sample can be found in Section 11.1.
8.14 Second Source Working Standard – The second source working standard is used to create the ICV.
Preparation: The second source working standard is prepared at a lead concentration of 0.005 µg/mL by diluting 0.10 mL of a 1,000 µg/mL Pb (± 3%) secondary source control standard to 100 mL with standard solvent. The ICV is then prepared by diluting 0.50 mL of the second source working standard to 100 mL with standard solvent.
8.15 Citranox® Acid Cleaner and Detergent, or equivalent – Prepare a 5% solution for labware cleaning and decontamination. This detergent bath should be changed once every month, depending on use.
8.16 Standard Reference Material (SRM) – The standard reference material used to
prepare the SRM samples. NIST SRM 1648a (Urban particulate matter with certified concentrations of lead at 0.655 ± 0.033 mass fraction (in %) is used to verify the extraction procedure.
Preparation: The SRM sample is prepared for extraction by adding a Teflon filter to a clean sample vial as described in Section 11.1.2. The loaded vial is then placed on an analytical 5-place balance and zeroed. Add no less than 5.0 mg of NIST SRM 1648a to the sample vial, but do not exceed 7.0 mg. The SRM is then ready for extraction as described in Section 11.
8.17 Lower Limit of Quantitation Check (LLQC) –This quality control sample is used to determine the LLQL, and is prepared by creating a spike solution that will create a final concentration of analyte in the sample matrix that produces and instrument signal/response that is 10x the standard deviation above the lab reagent blank (at 99% confidence; n-1 degrees of freedom). Lower limits of quantitation are verified when all analytes in the LLQC sample are detected within ± 30% of their true value.
Preparation: This quality control check is prepared by spiking an aliquot of prepared spiking standard into 10mL of extraction fluid (Section 8.1.4) and bring to a final volume 50mL with DI water. When brought to volume, the final solution is representative of the standard solvent (Section 8.1.5).
9.0 COLLECTION, PRESERVATION, SHIPMENT, AND STORAGE
9.1 Collection and Handling of Filters
Whenever the filter is handled use clean disposable nitrile gloves and if necessary clean Teflon® coated (no exposed metal surfaces) or plastic tweezers. Never touch the membrane of the filter and take care not to puncture or damage the filter with the tweezers. See also Section 13.1.
9.2 Preservation and Storage of Filters
Samples do not have a preservative and can be stored for up to 180 days in ambient conditions. Upon retrieval from field sampling during humid or rainy conditions be certain the filter is not moisture-laden. Damp filters may stick to the sample transport container causing damage and thereby invalidating the sample. If the sample is found to be moisture-laden allow the membrane to dry before enclosing in the transport container. Once the filter arrives at the laboratory, a unique laboratory identification number is assigned and placed on the outside of the COC, sample envelope and/or container for tracking and storage purposes. Filters are consumed during sample preparation. No extra sample storage is needed.
9.3 Shipment of Filters
When filters are shipped to or from the laboratory follow proper handling instructions in Section 9.1 and take proper precautions when packing so filters are not exposed to contaminants or damage during shipment.
10.0 CALIBRATION AND STANDARDIZATION
10.1 Daily Optimization Procedures
Daily optimization is performed according to instrument manufacturer recommendations. Refer to the instrument user manual for specific information on how to perform optimizations.
10.2 Mass Calibration and Resolution
Before performing any kind of calibration or optimization, allow a period of not less than 30 minutes (preferably 1 hour) for instrument warm-up. After the warm-up, the mass calibration and resolution may be optimized using the tuning solution by running a mass calibration and resolution optimization. Resolution at low mass is indicated by magnesium isotopes 24, 25, and 26. Resolution at high mass is indicated by lead isotopes 206, 207, and 208. For optimal performance, adjust spectrometer mass calibration to ± 0.05 amu and the resolution to produce a peak width of 0.70 ± 0.1 amu at 5% peak height. Repeat mass calibration and resolution optimization if it has shifted by more than ± 0.05 or ±0.1 amu respectively.
10.3 Dual Detector Cross Calibration
The dual detector cross calibration is used to provide a smooth transition from the pulse counting mode to the analog mode, which extends the linear dynamic range of the detector. This calibration should be performed daily or when instrument maintenance to the sample introduction system generates unsatisfactory performance reports.
10.4 Daily Performance
10.4.1 The daily performance report must be generated before each analysis.
10.4.2 Instrument stability must be demonstrated by running a daily performance check using the tuning solution. A minimum of five replicates with resulting relative standard deviations of absolute signals for all analytes of less than 5% is required prior to calibration. Consult the instrument manufacturer’s manual for specific daily performance criteria.
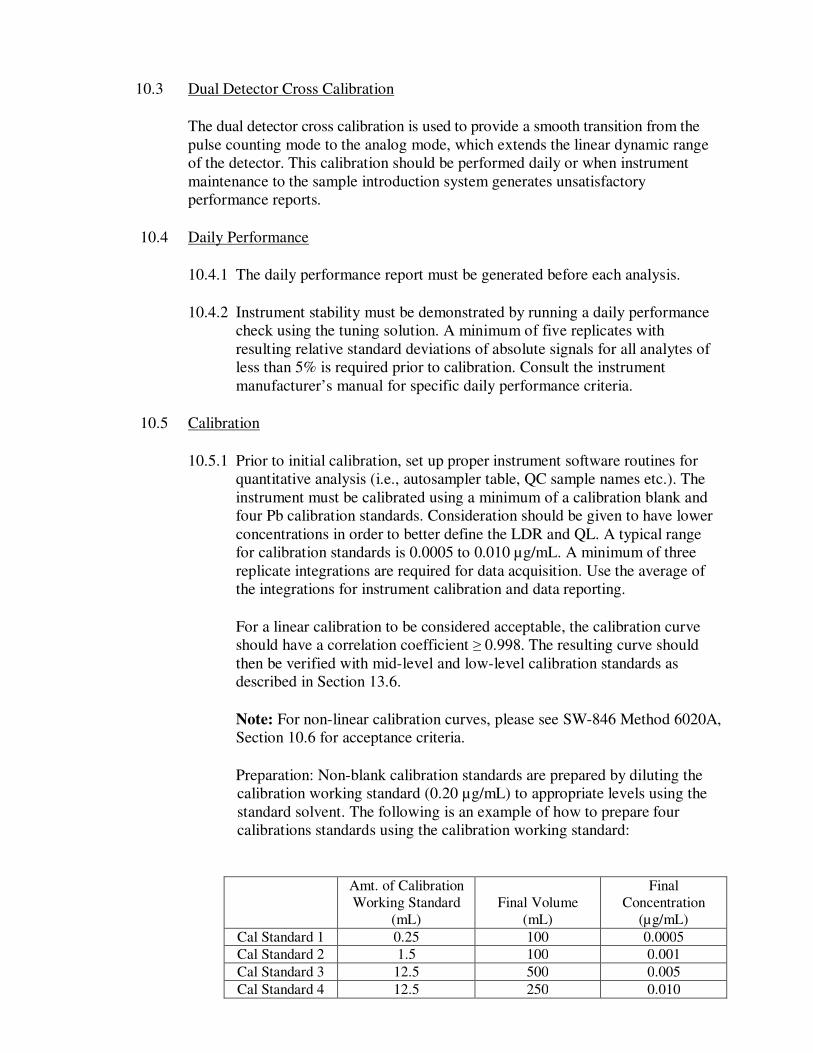
10.5 Calibration
10.5.1 Prior to initial calibration, set up proper instrument software routines for quantitative analysis (i.e., autosampler table, QC sample names etc.). The instrument must be calibrated using a minimum of a calibration blank and four Pb calibration standards. Consideration should be given to have lower concentrations in order to better define the LDR and QL. A typical range for calibration standards is 0.0005 to 0.010 µg/mL. A minimum of three replicate integrations are required for data acquisition. Use the average of the integrations for instrument calibration and data reporting.
For a linear calibration to be considered acceptable, the calibration curve should have a correlation coefficient ≥ 0.998. The resulting curve should then be verified with mid-level and low-level calibration standards as described in Section 13.6.
Note: For non-linear calibration curves, please see SW-846 Method 6020A, Section 10.6 for acceptance criteria.
Preparation: Non-blank calibration standards are prepared by diluting the calibration working standard (0.20 µg/mL) to appropriate levels using the standard solvent. The following is an example of how to prepare four calibrations standards using the calibration working standard:
Amt. of Calibration Working Standard
(mL) Final Volume
(mL)
Final Concentration
(µg/mL)
Cal Standard 1 0.25 100 0.0005
Cal Standard 2 1.5 100 0.001
Cal Standard 3 12.5 500 0.005
Cal Standard 4 12.5 250 0.010

10.5.2 For matrices of known composition, match the composition of the calibration and QC standards to that of the samples. For matrices of unknown composition, use an ISTD that has been matched to the analytes chemical and physical properties (i.e., ionization potential, ±50 amu) so that the ISTD and Pb response behave similarly during the analytical process.
10.5.3 The rinse blank should flush the system between solution changes for blanks, standards, and samples. Allow sufficient rinse time (~ 1 min) to remove traces of the previous sample. Solutions should aspirate for at least 30 seconds prior to the acquisition of data to establish equilibrium.
10.5.4 Refer to Section 8.1.5 for the acid concentrations at which to prepare the standard solvent. Once prepared, all calibration standards must be stored in Teflon® bottles/flasks.
Note: Commercial stock standards used to prepare calibration standards and other quality control standards must be used within their expiration date. Calibration blanks/standards and other QC standards made from the stock standards may be set to expire no later than any reagent’s or standard’s expiration date used for preparation.
10.5.5 Refer to the quality control requirements presented in Table 21-2 for calibration acceptance criteria.
10.6 Internal Standardization
10.6.1 Internal standardization must be used in all analyses to correct for instrument drift and physical interferences. ISTD quality control requirements as described in Section 13.7 must be followed.
10.6.2 The ISTD for this method is 209Bi, or another element suitable for internal standardization of high mass elements; 165Ho may be used but is not ideal. The internal standard must be manually added to each calibration standard after they are brought to volume.
10.6.3 Concentrations of the ISTDs for this method are determined by the concentration of each element that will produce an intensity that is sufficiently stable. Typical intensities are between 200,000 and 500,000 cps; however, ideal intensities may be as high as 1,000,000 cps.
10.6.4 The concentration of the ISTD must be added equally and in the same manner to the calibration blank/standards, QC standards and samples. For each 10 mL of blank, standard, or sample to be loaded onto the autosampler, 0.02 mL of ISTD solution must be added with a mechanical pipette prior to analysis. For example, after pipetting 0.02 mL of ISTD solution into an autosampler tube add 10 mL of sample and mix with pipette. If a 50 mL tube were used instead, then 0.10 mL of ISTD would be added.
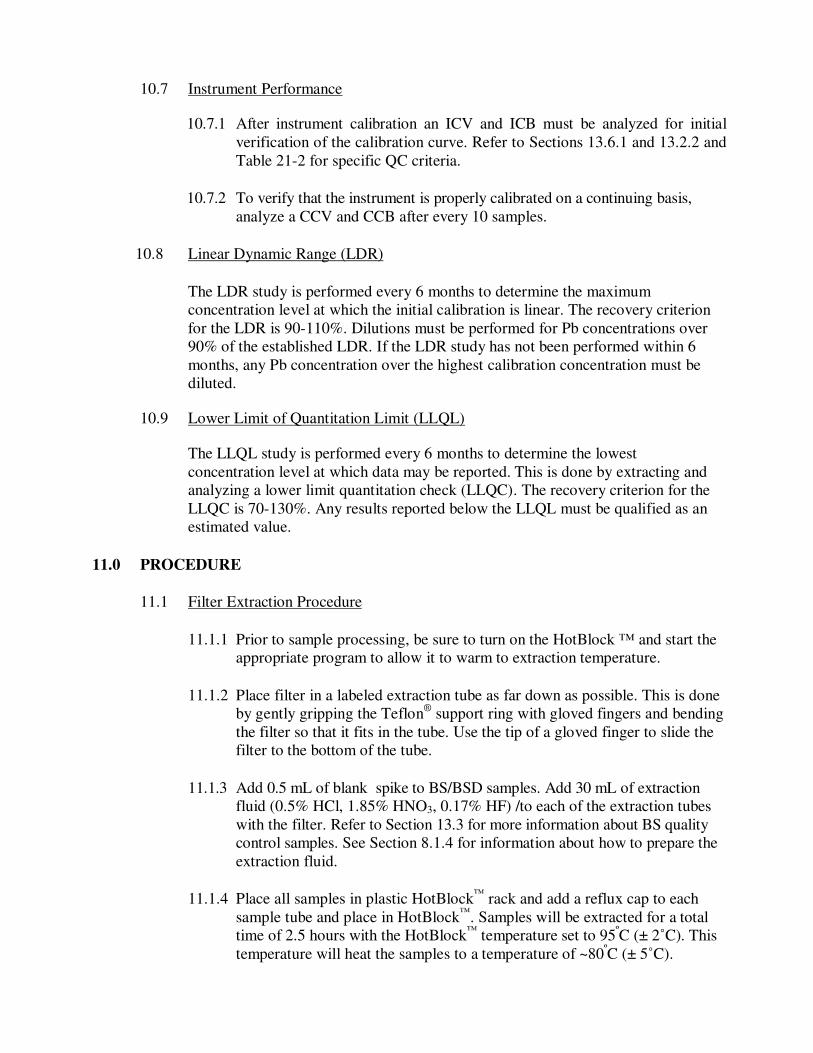
10.7 Instrument Performance
10.7.1 After instrument calibration an ICV and ICB must be analyzed for initial verification of the calibration curve. Refer to Sections 13.6.1 and 13.2.2 and Table 21-2 for specific QC criteria.
10.7.2 To verify that the instrument is properly calibrated on a continuing basis, analyze a CCV and CCB after every 10 samples.
10.8 Linear Dynamic Range (LDR)
The LDR study is performed every 6 months to determine the maximum concentration level at which the initial calibration is linear. The recovery criterion for the LDR is 90-110%. Dilutions must be performed for Pb concentrations over 90% of the established LDR. If the LDR study has not been performed within 6 months, any Pb concentration over the highest calibration concentration must be diluted.
10.9 Lower Limit of Quantitation Limit (LLQL)
The LLQL study is performed every 6 months to determine the lowest concentration level at which data may be reported. This is done by extracting and analyzing a lower limit quantitation check (LLQC). The recovery criterion for the LLQC is 70-130%. Any results reported below the LLQL must be qualified as an estimated value.
11.0 PROCEDURE
11.1 Filter Extraction Procedure
11.1.1 Prior to sample processing, be sure to turn on the HotBlock ™ and start the appropriate program to allow it to warm to extraction temperature.
11.1.2 Place filter in a labeled extraction tube as far down as possible. This is done by gently gripping the Teflon® support ring with gloved fingers and bending the filter so that it fits in the tube. Use the tip of a gloved finger to slide the filter to the bottom of the tube.
11.1.3 Add 0.5 mL of blank spike to BS/BSD samples. Add 30 mL of extraction fluid (0.5% HCl, 1.85% HNO3, 0.17% HF) /to each of the extraction tubes with the filter. Refer to Section 13.3 for more information about BS quality control samples. See Section 8.1.4 for information about how to prepare the extraction fluid.
11.1.4 Place all samples in plastic HotBlock™ rack and add a reflux cap to each sample tube and place in HotBlock™. Samples will be extracted for a total time of 2.5 hours with the HotBlock™ temperature set to 95ºC (± 2˚C). This temperature will heat the samples to a temperature of ~80ºC (± 5˚C).

Note: Monitor sample temperature with a thermometer in an extraction tube with a reflux cap and 30 mL of extraction fluid.
11.1.5 After 1.5 hours of extraction, add 1.8 mL of H2O2 and allow to effervesce until the total extraction time is completed.
11.1.6 Check the filters occasionally during extraction. If a filter floats out of the acid, use acid-cleaned Teflon® stirring rod to push the filter below the extraction fluid.
11.1.7 After extraction, Samples must be removed from the HotBlock™ as soon as possible so they are not allowed to heat to dryness. Allow the sample to cool to room temperature.
11.1.8 Leaving the Teflon filter in the sample vial, bring the sample volume to the 50 mL line on the vial (certified Class A vessel with a tolerance of 0.5% or 0.25 mL for a 50 mL vial) with a wash bottle filled with ASTM Type I DI water and cap.
Note: If the final volume exceeds 50 mL, ± 0.25 mL, measure the amount exceeded using an appropriate pipette (usually the 1 or 5 mL) and record the final sample volume. Using the pipettor, pull sample from the vial in varying increments until enough liquid is removed so that the sample line is level with the 50 mL line on the vial. Add the amount of liquid removed to 50 mL and record that as the final volume. This information must be entered into the LIMS so that the final sample concentration is calculated and reported correctly. Overfilling may be avoided by using fine streamed wash bottles to add the D.I. water.
11.1.9 Homogenize the sample by inverting three times. Should the sample contain noticeable particulate material, an aliquot of the sample may be poured off and filtered with the use of a FilterMate™. Alternatively, the sample may be allowed to rest until all debris settle. Care should be taken to not disturb the sample when transferring sample extract to an autosampler tube. For samples with no noticeable particulate matter, it is not necessary to allow the sample to settle prior to analysis.
11.2 Filter Analysis Procedure
11.2.1 Prior to analyzing samples, check the instrument performance as described in Sections 10.1, 10.2 and 10.3. Refer to the instrument manual for manufacturer recommended performance specifications. If the performance check fails, follow the optimization procedures recommended by the instrument manufacturer.
11.2.2 Before starting the calibration adequately flush the sample introduction system with rinse blank and be certain the rinse blank bottle has enough solution for the analysis.

11.2.3 Pour off the calibration blank/standards and initial/continuing QC standards (ICV, ICB, HSV, CCV, CCB) into autosampler tubes and add the appropriate amount of ISTD. Place the tubes in the appropriate autosampler positions. See Section 10.6.4 for specific instruction on how to add ISTD to standards.
11.2.4 Start the analysis. Once the calibration has been completed and reviewed, save the calibration file and print a calibration report to be included with the sequence files.
11.2.5 Label autosampler tubes with the correct QCS or sample ID and spike 20 µl of ISTD into the bottom of each empty tube if using 10 mL of sample. Carefully pipette 10 mL of the sample for analysis and add to the appropriate tube. Once the sample has been dispensed into the tube it may be re-pipetted with the same pipette tip to mix 2 times. Then place the samples in the appropriate autosampler location for analysis. See Section 10.6.4 for specific instruction on how to add ISTD to QCS and samples.
11.2.6 Samples with Pb concentrations greater than 90% of the current LDR must be diluted and re-analyzed.
11.3 Data Review
All instrument data should be first reviewed by the analyst and a secondary reviewer.
11.3.1 Initial Calibration
In addition to the requirements outlined in Table 2 1-2, the analyst and reviewer must also verify that the intensities measured for reportable analytes in the calibration blank are acceptable and will not interfere with the sensitivity. A review of previously analyzed calibration blanks can demonstrate acceptable intensity values. The intensities of the internal standards in the calibration standard should be monitored relative to the intensities seen in the calibration blank.
11.3.2 Internal Standards
Internal standards must be monitored for each sample throughout a sequence; the measured intensities must stay between 60 and 125% of the measured intensity of the calibration blank. See Section 13.7 for corrective actions to remedy internal standard intensities that are measured outside of this range.
11.3.3 Relative Standard Deviation (RSD)
Follow the prescribed acceptance criteria for RSDs for calibration standards as listed in Table 2 1-2. Sample RSDs should also be monitored throughout analysis, especially for analyte concentrations greater than the limit of

quantitation (LOQ). High RSDs (greater than 20%) can indicate memory interference from previous samples, as well as other instrumentation issues that may need to be corrected before analysis can be continued.
11.3.4 Multiple Isotopes
Pb must be monitored for all three isotopes (206, 207, and 208). Examine the concentration calculated for each isotope, or isotope ratios, to detect a possible spectral interference. Consider both primary and secondary isotopes when evaluating the Pb concentration. In some cases, secondary isotopes may be less sensitive or more prone to interferences than the primary recommended isotope (208); therefore, differences between the results do not necessarily indicate a problem with data calculated for the primary isotopes.
11.3.5 Reprocessing Data
Reprocessed data must include reprocessing of all calibration standards and QC samples associated with the reprocessed sample results. Original data shall be kept with the reprocessed data and annotated with the reason for reprocessing. It is imperative that the reprocessed calibration file be saved as a separate file from the original calibration file.
12.0 CALCULATIONS
12.1 Analyte Concentration
Metal concentration in the air sample should be calculated as follows:
C = (Ci × Vf) Vs t d
Where: C = concentration, µg metal/m3 Ci = metal concentration determined from Section 11.2, µg metal/L Vf = total sample extraction volume from extraction procedure (i.e., 0.05 L) Vs t d = standard air volume pulled through the filter, m3
12.2 Relative Percent Difference (RPD) The RPD is calculated as follows:
RPD = (R1 - R2)/[(R1 + R2)/2] × 100
Where:
R1, R2 = values that are being compared (i.e., response factors in calibration verification)

12.3 Percent Recovery
Percent Recovery is calculated as follows:
Percent Recovery = (Analytical result/Theoretical result) x 100 12.4
Relative Standard Deviation (RSD)
RSD is calculated as follows:
RSD = (Standard Deviation/Average) x 100
13.0 QUALITY CONTROL
The analyst must perform the quality control checks listed in Table 21-2 and meet the requirements in this section. Method Quality Objectives (MQO) and data assessment criteria are determined from the results of the quality control samples. The MQO criteria are summarized in Table 2 1-2.
13.1 Sample Collection Quality Control
13.1.1 Filters which are dropped or become contaminated with any foreign matter (i.e., dirt, finger marks, ink, liquids, etc.) are invalid.
13.1.2 Filters with tears or pinholes, which occurred before, during or after sampling, are invalid.
13.1.3 A power failure during a field sample collection event invalidates the sample collected during that event.
13.2 Blanks
13.2.1 The Rinse Blank must be used to flush the system between standards and samples. Refer to Section 8.3.1 for preparation details.
13.2.2 Initial Calibration Blank (ICB) is analyzed immediately following the initial calibration verification. The absolute value of the instrument response should be less than the method detection limit. If the ICB fails it may be re-analyzed once. If the ICB still does not pass, the analysis should be terminated, the problem corrected and, if appropriate, the ICV and ICB must be verified again before the analysis can continue. If the ICV or ICB still fail, recalibrate the instrument and verify the ICV and ICB again before continuing. If recalibration fails to correct the problem, all QC and samples included in the sequence must be flagged.
13.2.3 Continuing Calibration Blanks (CCB) are analyzed following each continuing calibration verification sample. The acceptance criteria are the same as the ICB. If the first CCB analyzed fails, it may be reanalyzed once. If it fails again the analysis should be terminated, the instrument recalibrated
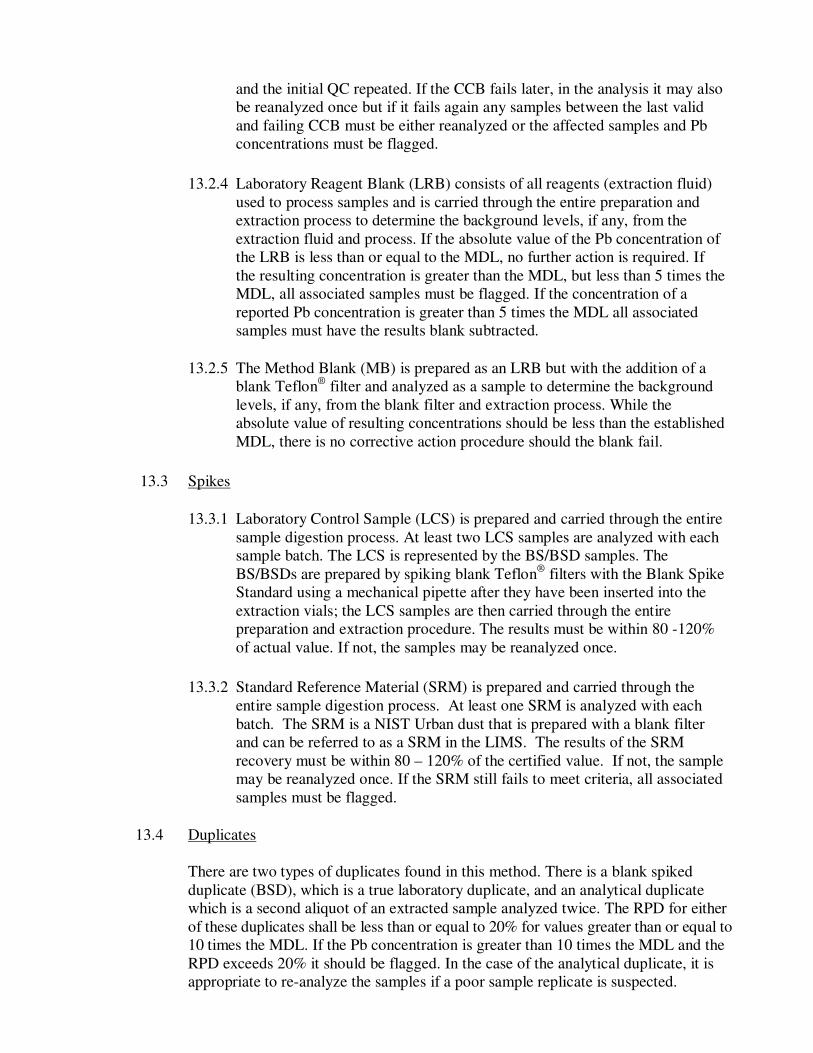
and the initial QC repeated. If the CCB fails later, in the analysis it may also be reanalyzed once but if it fails again any samples between the last valid and failing CCB must be either reanalyzed or the affected samples and Pb concentrations must be flagged.
13.2.4 Laboratory Reagent Blank (LRB) consists of all reagents (extraction fluid) used to process samples and is carried through the entire preparation and extraction process to determine the background levels, if any, from the extraction fluid and process. If the absolute value of the Pb concentration of the LRB is less than or equal to the MDL, no further action is required. If the resulting concentration is greater than the MDL, but less than 5 times the MDL, all associated samples must be flagged. If the concentration of a reported Pb concentration is greater than 5 times the MDL all associated samples must have the results blank subtracted.
13.2.5 The Method Blank (MB) is prepared as an LRB but with the addition of a blank Teflon® filter and analyzed as a sample to determine the background levels, if any, from the blank filter and extraction process. While the absolute value of resulting concentrations should be less than the established MDL, there is no corrective action procedure should the blank fail.
13.3 Spikes
13.3.1 Laboratory Control Sample (LCS) is prepared and carried through the entire sample digestion process. At least two LCS samples are analyzed with each sample batch. The LCS is represented by the BS/BSD samples. The BS/BSDs are prepared by spiking blank Teflon® filters with the Blank Spike Standard using a mechanical pipette after they have been inserted into the extraction vials; the LCS samples are then carried through the entire preparation and extraction procedure. The results must be within 80 -120% of actual value. If not, the samples may be reanalyzed once.
13.3.2 Standard Reference Material (SRM) is prepared and carried through the entire sample digestion process. At least one SRM is analyzed with each batch. The SRM is a NIST Urban dust that is prepared with a blank filter and can be referred to as a SRM in the LIMS. The results of the SRM recovery must be within 80 – 120% of the certified value. If not, the sample may be reanalyzed once. If the SRM still fails to meet criteria, all associated samples must be flagged.
13.4 Duplicates
There are two types of duplicates found in this method. There is a blank spiked duplicate (BSD), which is a true laboratory duplicate, and an analytical duplicate which is a second aliquot of an extracted sample analyzed twice. The RPD for either of these duplicates shall be less than or equal to 20% for values greater than or equal to 10 times the MDL. If the Pb concentration is greater than 10 times the MDL and the RPD exceeds 20% it should be flagged. In the case of the analytical duplicate, it is appropriate to re-analyze the samples if a poor sample replicate is suspected.

13.5 Performance Evaluation (PE) Samples
Performance evaluation samples should be obtained from independent sources and analyzed as a routine sample. PE samples are prepared and analyzed like field samples and should be analyzed in duplicate to verify results.
13.6 Standard Checks
13.6.1 Immediately after the initial calibration, the ICV is analyzed. The measured concentrations should be ±10% or within 90-110% of the actual concentration. If the criteria are not met, reanalyze the standard. If the criteria are still not met, repeat the initial calibration and ICV.
13.6.2 The HSV must be analyzed after the ICB and prior to analysis of samples. The measured concentration should be within 95% to 105% of the actual concentration. If the HSV fails it may be reanalyzed once. If the HSV still fails, recalibrate.
13.6.3 Before the analysis of samples and after every 10 samples during a batch analysis, the calibration must be verified using the CCV. Results must be within ±10%, or 90% to 110% of the target value for Pb to verify that the calibration is valid. If a standard check exceeds the limit, the analysis must be stopped and the check standard must be reanalyzed. If the target value exceeds the limit again, the instrument must be recalibrated and any samples between the last valid and failing CCV must be reanalyzed.
13.6.4 Following the first and last CCV of each analysis an LCV must be analyzed. The measured concentration should be ± 30% of the true concentration. If the criteria are not met, reanalyze the standard once. If criteria still are not met, terminate the analysis, correct any issues, and repeat the initial calibration.
Note: The intended use of this SOP is determination of lead. If additional elements are to be analyzed by ICP-MS using this SOP, an interference check solution (ICS) shall be prepared to contain known concentrations of interfering elements that will demonstrate the magnitude of interferences and provide an adequate test of any corrections. See EPA Method 6020A for additional details on recommended ICS solution concentrations and potential interferences.
13.7 Internal Standards
The intensities of all ISTDs must be monitored for every analysis (see Table 21-3 for isotopes). When the intensity of any ISTD fails to register between 60 to 125% of the intensity of that ISTD in the calibration blank, the following procedure is implemented:
13.7.1 Check that the intensity levels of the ISTD for the calibration blank and sample(s) of interest are within 60% - 125% of the intensity level of the

ISTD of the original calibration blank. If the intensities are too high as a result of the ISTD being present in the sample, the sample must be diluted and reanalyzed with the addition of appropriate amounts of ISTD.
13.7.2 Repeat and increase the dilution until the ISTD intensities fall within the prescribed window.
13.7.3 If the intensities are determined to be a result of instrument drift, stop the analysis, find and correct the problem, recalibrate if needed and reanalyze the affected samples since the last acceptable ISTD recoveries.
13.8 Dilutions
13.8.1 Serial Dilution
The SRD analysis must be performed on one sample per batch, preferably with the parent sample chosen for the analytical duplicate. The same sample matrix used to extract the parent sample must be used as the diluent. After the dilution is applied to the SRD results, the analyte concentration should be within 90% and 110% of the undiluted sample results if the parent sample Pb concentration is at least a factor of 50 above the MDL in the original sample. If the SRD fails, it should be reprepared and analyzed a second time. If the SRD still fails, a matrix effect must be suspected and the data flagged for this sample.
13.8.2 Sample Dilution
Any samples needing dilution due to concentrations exceeding the LDR or the presence of ISTD in the sample causing ISTD recoveries to fail shall be diluted in an appropriate manner to bring the diluted concentration within the calibration curve and preferably near the mid-point. If the SRD was performed on the parent sample of a DUP, the results from the SRD may be used to report values of that parent sample if the 5 times dilution was appropriate.
13.9 Decontaminating/Cleaning Labware
13.9.1 Soak labware using tap water and detergent (preferably a 1-2% Citranox®
solution, but Liqui-Nox® or other lab detergents may be used in same concentrations) for a minimum of one hour, but preferably overnight.
13.9.2 Rinse labware with hot tap water to remove detergent completely. Place
labware in DI water bath for transporting “to acid bath.”
13.9.3 Place in a 10% nitric acid bath overnight. Remove labware from acid bath and place in DI bath “from acid bath.”

13.9.4 Rinse labware three times with DI water. Allow glassware to air dry. Place labware such that open orifices are facing down.
13.9.5 The nitric bath is monitored for contamination by analyzing the bath solution.
The nitric acid bath is changed at least every 6 months or when contamination levels are significantly elevated. The nitric bath solution is disposed of by placing in the appropriate drum in the hazardous waste room by qualified personnel.
14.0 PREVENTION
When possible, minimize the amount of chemicals used in the preparation and analysis of the metals filters to reduce waste.
15.0 DATA REVIEW AND CORRECTIVE ACTION
15.1 Data Review Documentation
Project files including at a minimum the information required in Section 19 are assembled and maintained by the performing analyst. Documentation for Pb analysis by ICP/Mass Spectrometry will be reviewed for completeness and meeting acceptance criteria by a secondary reviewer as described in this section. Corrections and flags are added to the data consistent with the corrective action required for each review finding.
16.0 WASTE MANAGEMENT
Hazardous waste disposal should be handled according to laboratory guidelines. Sample digestate, including the extracted filter, is retained in its original tube for a period of at least 6 months from the sample date. After this time, sample digestate is disposed of by pouring it off in the satellite waste containers located in the laboratory. Used sample vials and extracted filters are disposed of in the laboratory waste bin.
17.0 MAINTENANCE
Instrument maintenance should be performed in accordance with the instrument manufacturer’s recommendations.
18.0 SHORTHAND PROCEDURE
The flow chart shown in Figure 21-1 shows the procedural steps and sequence for analysis of inorganic samples.
19.0 DOCUMENTATION AND DOCUMENT CONTROL
19.1 All information concerning sample preparation, standard preparation, instrument conditions, etc., must be documented in the appropriate binders (i.e., Extraction Log,

Daily Performance Reports, Standards Log etc.) and/or electronically in either the LIMS or the local instrument computer.
19.2 All calculations and the type of method for determining concentration must be recorded in the analyst's notebook. Any unusual problems or conditions must also be noted.
19.3 Record all maintenance performed on the instrument in the maintenance logbook for this particular instrument.
19.4 Record all sample analyses, including quality control samples, performed by the instrument in the ICP-MS run logbook for this particular instrument.
19.5 All analysis-related logbooks should be reviewed periodically by the analysis task lead or secondary reviewer.
19.6 It is imperative the project documentation be updated and backed up electronically following each analysis. Analysts will copy raw instrument and QC files to a designated corporate network shared drive at the completion of each analysis sequence or batch.
19.7 Reporting
19.7.1 The filter results must be reported in ng/mL as analyzed. Any additional dilutions done must be accounted for in the instrument software. The internal standard recoveries must be included in the result calculation. Final results should be reported in ng/m3 to three significant figures as shown in Section 12.1. If required by the sampling organization, results can also be reported in µg/m3 by multiplying the ng/m3 results by 1,000.
19.7.2 Sample results should not be corrected based on lead results from the
laboratory blanks, field, trip, or filter lot blanks provided by sampling agency. Samples are flagged if the LRB is detected as described in Section 13.2.4.
19.7.3 As stated in Section 11.2.6, samples with Pb concentrations greater than 90%
of the current LDR must be diluted and re-analyzed. The diluted value will be reported to the sampling agency.
19.7.4 Data should meet all specifications as presented in Table 21-2. If data does
not meet specifications, corrective reporting actions listed must be followed (flag or invalidate data).
20.0 REFERENCES
Ashley, K., R. N. Andrews, L. Cavazos, and M. Demange. 2001. Ultrasonic Extraction as a Sample Preparation Technique for Elemental Analysis by Atomic Spectroscopy. Journal of Analytical Atomic Spectrometry 16:1147-1153.

Butler, O. T. and A. M. Howe. 1999. Development of an Internation Standard for the Determination of Metals and Metalloids in Workplace Air Using ICP-AES: Evaluation of Sample Dissolution Procedures Through an Interlaboratory Trial. Journal of Environmental Monitoring 1:23-32.
Code of Federal Regulations, 40, Ch. 1, Part 136, Appendix B – Definition and Procedure for the Determination of the Method Detection Limit – Revision 1.11.
Determination of Metals in Ambient Particulate Matter Using Inductively Coupled Plasma/Mass Spectrometry (ICP/MS). Compendium Method IO-3.5, In: Compendium of Methods for the Determination of Inorganic Compounds in Ambient Air. Center for Environmental Research Information, Office of Research and Development, U.S. Environmental Protection Agency, Cincinnati, OH, 45268, June 1999.
EPA Great Lakes Monitoring, Great Lakes Environmental Database website: http://epa.gov/greatlakes/monitoring/data_proj/glenda/codes/r_lim_tp.pdf.
Jalkanen, L. M. and E. K. Hasanen. 1996. Simple Method for the Dissolution of Atmospheric Aerosol Samples for Analysis by Inductively Coupled Plasma Mass Spectrometry. Journal of Analytical Atomic Spectrometry 11:365-369.
National Environmental Laboratory Accreditation Conference. 2003 NELAC Standard, EPA/600/R0-04/003, Approved June 5, 2003, Effective July 1, 2005.
Pekney, N. J. and C. I. Davidson. 2005. Determination of Trace Elements in Ambient Aerosol Samples. Analytica Chimica Acta 540:269-277.
PerkinElmer Elan® Version 3.4 Software Reference Guide, 2007. PerkinElmer Elan® 9000
Hardware Guide, 2003.
Selection, Preparation and Extraction of Filter Material. Compendium Method IO-3.1, In:
Compendium of Methods for the Determination of Inorganic Compounds in Ambient Air. Center for Environmental Research Information, Office of Research and Development, U.S. Environmental Protection Agency, Cincinnati, OH, 45268, June 1999.
EPA Method 6020A, Inductively Coupled Plasma – Mass Spectroscopy. In: EPA SW-846, “Test Methods for Evaluating Solid Waste, Physical/Chemical Methods”.
Reference Method for the Determination of Lead in Particulate Matter as PM10 Collected From Ambient Air. Code of Federal Regulations Title 40, Part 50, Appendix Q [2008].
Spectron Cone Cleaning Guide. By Lawrence Neufeld, Spectron, Inc. Website: http://www.spectronus.com/uploadcache/1253135846-Cone_Cleaning_Final_909.pdf
Standard Operating Procedure (SOP) For The Trace Elemental Analysis of Ambient Air Particulate Samples Using Inductively Coupled Plasma - Mass Spectrometry (ICP-MS).
California Environmental Protection Agency, Air Resources Board, (SOP MLD 061), Rev. No. 1, January 1, 2007.
USEPA Contract Laboratory Program, Statement of Work for Inorganic Analysis, Multi-Media, Multi-Concentration, ILM05 .3, Analytical Methods for Inductively Coupled Plasma – Mass Spectroscopy, Exhibit D, G – Part B, March 2004.
Yamashige, T., M. Yamamoto, and H. Sunahara. 1989. Comparison of Decomposition Methods for the Analysis of Atmospheric Particles by Atomic Absorption Spectrometry. Analyst 114:1071-1077.
21.0 TABLES, DIAGRAMS, FLOWCHARTS, VALIDATION DATA
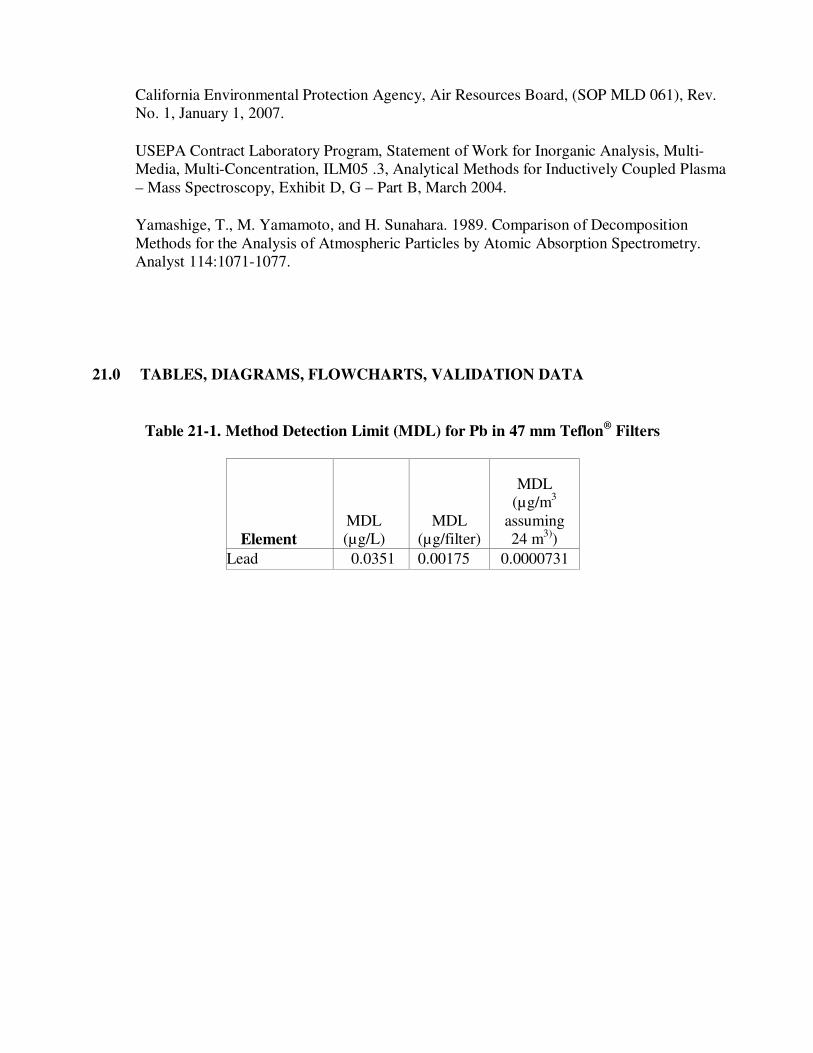
Table 21-1. Method Detection Limit (MDL) for Pb in 47 mm Teflon® Filters
Element MDL (µg/L)
MDL (µg/filter)
MDL (µg/m3
assuming 24 m3))
Lead 0.0351 0.00175 0.0000731

Table 21-2. Summary of Quality Control Procedures for Metals Analysis
Parameter Frequency Acceptance Criteria Corrective Action
Initial Calibration Standards (IC)
Daily, at least 5 calibration points
Correlation coefficient ~ 0.998 & %RSD ~ 10. IC standards with concentrations below an analyte’s MDL may have a %RSD > 10 but < 20
1) Repeat analysis of calibration standards 2) Reprepare calibration standards and reanalyze
Initial Calibration Verification (ICV)
Immediately after calibration
Recovery 90-110% 1) Repeat analysis of IC V 2) Recalibrate and reanalyze
Initial Calibration Blank (ICB)
Immediately after ICV Absolute value must be ~ MDL 1) Locate and resolve contamination problems before continuing 2) Reanalyze or recalibrate or flag failing Pb result
High Standard Verification (HSV)
After ICB and before the ICS.
Recovery 95-105% 1) Repeat analysis of HSV 2) Reprepare HSV
Low Level Calibration Verification (LCV)
After the first and last CCV Recover 70-130% 1) Repeat analysis of LCV 2) Correct any issues 3) Recalibrate and reanalyze the analysis
Continuing Calibration Verification (CCV)
Analyze before samples, after every 10 samples, and at the end of the run
Recovery 90-110% 1) Repeat analysis of CCV 2) Reprepare CCV 3) Recalibrate and reanalyze samples since last acceptable CCV
Continuing Calibration Blanks (CCB)
Analyzed after each CCV Absolute value must be ~ MDL 1) Repeat analysis of CCB 2) Reanalyze samples since last acceptable CCB
Laboratory Reagent Blank (LRB)
1 per 20 samples , minimum of 1 per batch
Absolute value must be ~ MDL 1) Reanalyze 2) If > 5x the MDL then sample results for Pb must be blank subtracted
Method Blank (MB) 1 per 20 samples, minimum of 1 per batch
Absolute value must be ~ MDL, however the MB is used only for the purposes of MDL generation
The QC is not required. There is no corrective action
Duplicate (DUP) 1 per 20 samples, minimum of 1 per batch
±20% RPD for sample and duplicate values ~ ten times the MDL
1) Repeat duplicate analysis 2) Check for matrix interference 3) Flag data
Blank Spike (BS) and Blank Spike Duplicate (BSD)
1 per 20 samples, minimum of 1 per batch
Recovery 80%-120% 1) Reanalyze 2) Flag data
Standard Reference Material (SRM)
1 per 20 samples, a minimum of 1 per batch
Recovery 80-120% 1) Reanalyze 2) Flag sample batch
Serial Dilution (SRD) 1 per 20 samples, minimum of 1 per batch
Recovery 90-110% of undiluted sample if the analyte concentration is minimally a factor of 50 above the MDL in the original sample
1) Re-prepare dilution 2) Flag failed Pb result
Internal Standards (ISTD) Every Calibration, QC and Field Sample
Recovery 60-125% of ISTD response in the calibration blank
1) Reprepare sample 2) If recovery > 125%, dilute sample and reanalyze 3) If drift suspected, stop analysis and determine cause. Recalibrate if necessary

Table 21-3. Analytical Isotopes for Quantitation and Monitoring of Reported Elements
Element Quantitation
Isotope
Monitored/Confirmation
Isotope(s)
Bismuth (ISTD) 209 NA
Lead 206, 207, 208* NA N A = N o t a p pl i ca bl e/ n o n e.
* Se e Se c t io n 4 .3 .6
Figure 21-1. Flow Diagram for ICP-MS Preparation and Analysis for PM10 or TSP
Filters
Receive Sample
Inspect Filter
Prepare filter for analysis (i.e., add acid and extract)
Set up ICPMS for analysis
Calibrate Instrument
Analyze Initial Calibration Verification (ICV)
Analyze Initial Calibration Blank (ICB)
Analyze High Standard Verification (HSV)
Analyze Continuing Calibration Verification (CCV)
Analyze Low Level Calibration Verification (LCV)
Analyze Continuing Calibration Blank (CCB)
Analyze Samples – Including LCS, LRB MS/MSD, SRM and MBs
Analyze CCV and CCB after every 10 samples
![such€¦ · epa ih(.' agency (sip) " ((;aa) ((:],,[(,), epa-[[cbi), \'< ov • epa. • • (•. •.'%.• (].}'•}).\](https://img.dokumen.tips/doc/110x75/5fea5a1bdc048408ab016e1b/such-epa-ih-agency-sip-aa-epa-cbi-ov-a.jpg)