Embed Size (px)
Citation preview
CPSC Staff Statement on the Toxicology Excellence for Risk Assessment Report,
“Concentrations of Selected Elements in Unfinished Wood and Other Natural Materials” March 2015
The report titled, “Concentrations of Selected Elements in Unfinished Wood and Other
Natural Materials,” presents the findings of research conducted by Toxicology Excellence for
Risk Assessment (TERA) under a contract with the U.S. Consumer Product Safety Commission
(CPSC). TERA performed this research to characterize the concentration of seven named
elements1 in unfinished woods, cotton, wool, linen, silk, bamboo, and beeswax. This research
was completed in support of CPSC’s work on third party testing burden reduction consistent with
assuring compliance. CPSC staff will consider this information in evaluating whether staff could
make a recommendation for a Commission determination that some materials do not contain any
of the seven elements in concentrations above the solubility limits listed in Table 1 of ASTM
F963-11, Standard Consumer Safety Specification for Toy Safety, (the Toy Standard), and thus,
may not require third party testing to assure compliance with that portion of the standard.
This report will be posted on CPSC’s website to keep stakeholders informed of the
progress of technical research related to the agency’s regulatory activities
1 The elements researched are antimony, arsenic, barium, cadmium, chromium, mercury, and selenium. The Commission previously determined that lead was not present in the materials specified.
Concentrations of Selected Elements in Unfinished Wood and Other Natural Materials
Task Order 9 Contract Number CPSC-D-12-0001
March 2, 2015 Final Report
Prepared by: Toxicology Excellence for Risk Assessment (TERA)
Contact: Jacqueline Patterson [email protected]
Alison Willis [email protected]
2
Contents List of Figures ................................................................................................................................................................ 4
List of Tables ................................................................................................................................................................. 4
Abbreviations ................................................................................................................................................................ 5
1. Introduction ........................................................................................................................................................... 7
2. Approach and Methods .......................................................................................................................................... 8
2.1 Literature Review Strategy......................................................................................................................... 11
2.1.1 Group 1 .................................................................................................................................................. 11
2.1.2 Group 2 .................................................................................................................................................. 14
2.1.3 Group 3 .................................................................................................................................................. 15
3. Transfer of Elements to the Natural Materials ..................................................................................................... 16
3.1 Plant uptake of elements ............................................................................................................................ 17
3.2 Environmental Concentrations and Bioavailability (Factors 2 and 3) ........................................................ 20
3.2.1 Antimony ............................................................................................................................................... 20
3.2.2 Arsenic ................................................................................................................................................... 22
3.2.3 Barium ................................................................................................................................................... 24
3.2.4 Cadmium ............................................................................................................................................... 25
3.2.5 Chromium .............................................................................................................................................. 26
3.2.6 Mercury ................................................................................................................................................. 28
3.2.7 Selenium ................................................................................................................................................ 29
4. Group 1 Results: Unfinished Wood, Bamboo, Beeswax ..................................................................................... 31
4.1 Unfinished Wood ....................................................................................................................................... 31
4.1.1 Antimony ............................................................................................................................................... 31
4.1.2 Arsenic ................................................................................................................................................... 33
4.1.3 Barium ................................................................................................................................................... 37
4.1.4 Cadmium ............................................................................................................................................... 37
4.1.5 Chromium .............................................................................................................................................. 40
3
4.1.6 Mercury ................................................................................................................................................. 44
4.1.7 Selenium ................................................................................................................................................ 46
4.2 Group 1 Results: Bamboo .......................................................................................................................... 47
4.3 Group 1 Results: Beeswax ......................................................................................................................... 48
4.4 Group 2 Results: Silk ................................................................................................................................. 50
4.5 Group 2 Results: Linen .............................................................................................................................. 52
4.6 Group 2 Results: Cotton ............................................................................................................................. 54
4.7 Group 2 Results: Wool ............................................................................................................................... 56
5. Discussion ............................................................................................................................................................ 58
5.1 Concentrations of ASTM Elements in Group 1 and 2 Materials ............................................................... 60
5.2 Concentrations in Trees, Bamboo Plants, Silkworms, Flax Plants, and Cotton Plants .............................. 61
5.3 Potential for Accumulation from the Environment or Agriculture ............................................................ 62
5.4 Introduction of Elements through Processing or Packaging ...................................................................... 64
6. References ........................................................................................................................................................... 66
Appendix I - Data Tables for Concentrations Below Solubility Limits Appendix II - Literature Search Strategy
4
List of Figures
Figure 1. Hierarchy for data investigation ................................................................................................................... 10
Figure 2. A conceptual model for mechanisms of element exposure and potential uptake. Taken from EPA, 2003
..................................................................................................................................................................................... 17
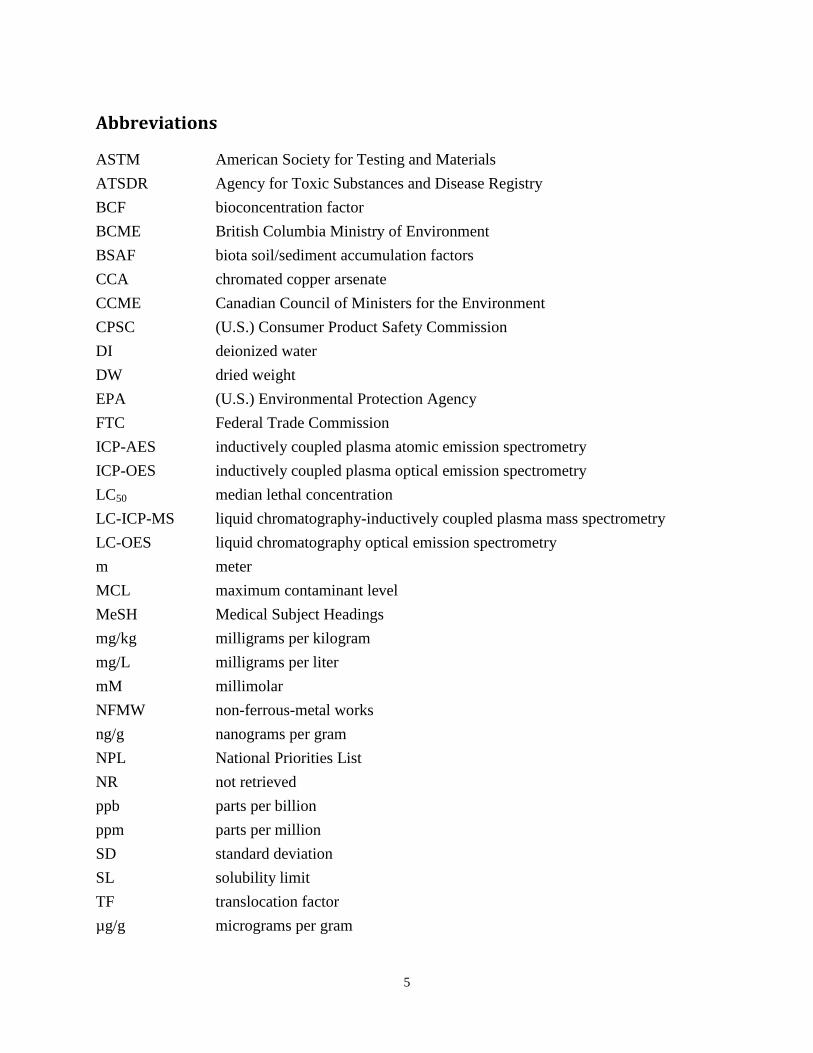
List of Tables
Table 1. Material Groups, Solubility Limits, and Material Types for Selected Elements ............................................. 7
Table 2. Studies reviewed that measured antimony concentrations in trees above the solubility limit (SL) of 60
mg/kg (ppm). ............................................................................................................................................................... 32
Table 3. Studies measuring arsenic concentrations in trees above the solubility limit (SL) of 25 mg/kg (25 ppm)
..................................................................................................................................................................................... 34
Table 4. Studies measuring cadmium concentrations in trees above the solubility limit (SL) of 75 mg/kg (75 ppm) .
..................................................................................................................................................................................... 39
Table 5. Studies measuring chromium concentrations in trees above the solubility limit (SL) of 60 mg/kg (60 ppm).
..................................................................................................................................................................................... 43
Table 6. Studies measuring mercury concentrations in trees above the solubility limit (SL) of 60 mg/kg (60 ppm).
..................................................................................................................................................................................... 46
Table 7. Studies measuring selenium concentrations in trees above the solubility limit (SL) of 500 mg/kg (500 ppm).
..................................................................................................................................................................................... 47
Table 8. Studies measuring any of the element concentrations in bamboo. ................................................................ 48
Table 9. Studies measuring element concentrations in beeswax. ................................................................................ 49
Table 10. Studies measuring concentrations above a solubility limit in silkworms. ................................................... 51
Table 11. Studies measuring concentrations above a solubility limit in flax plants. ................................................... 53
Table 12. Studies measuring concentrations above a solubility limit in cotton or cotton plants. ................................ 56
Table 13. Studies measuring any of the element concentrations in wool. ................................................................... 57
Table 14. Summary of available studies for all elements and all material types ......................................................... 59
5
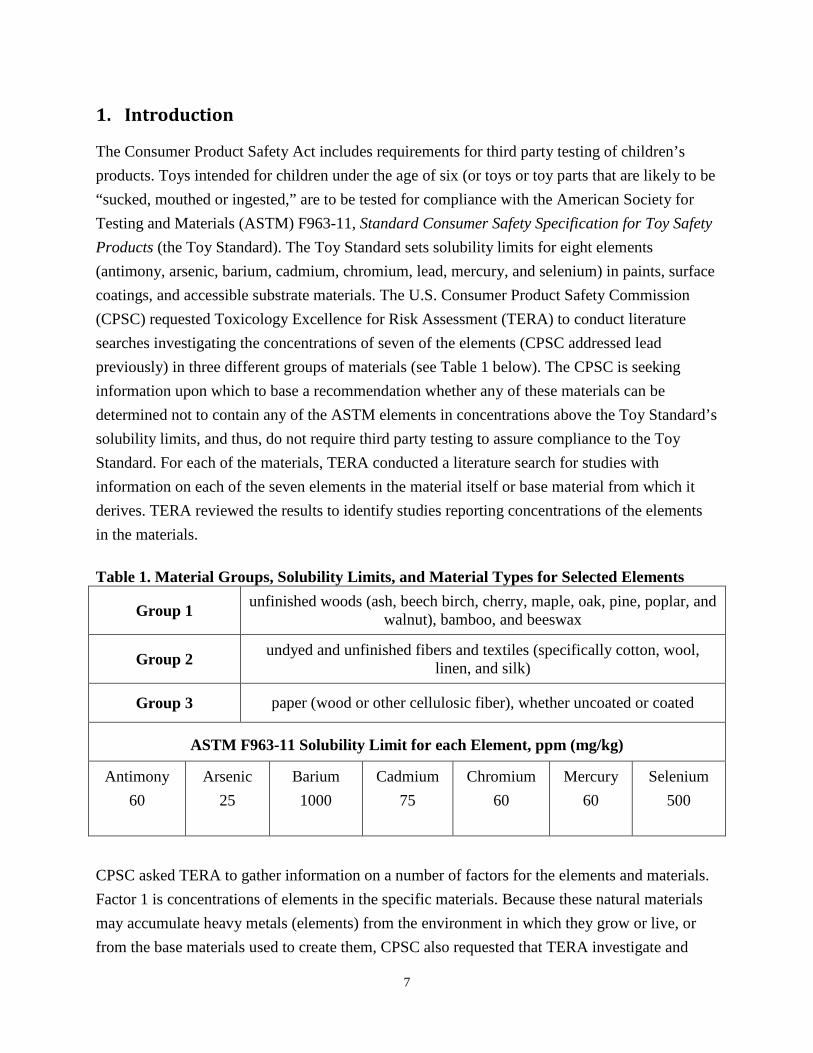
Abbreviations
ASTM American Society for Testing and Materials ATSDR Agency for Toxic Substances and Disease Registry BCF bioconcentration factor BCME British Columbia Ministry of Environment BSAF biota soil/sediment accumulation factors CCA chromated copper arsenate CCME Canadian Council of Ministers for the Environment CPSC (U.S.) Consumer Product Safety Commission DI deionized water DW dried weight EPA (U.S.) Environmental Protection Agency FTC Federal Trade Commission ICP-AES inductively coupled plasma atomic emission spectrometry ICP-OES inductively coupled plasma optical emission spectrometry LC50 median lethal concentration LC-ICP-MS liquid chromatography-inductively coupled plasma mass spectrometry LC-OES liquid chromatography optical emission spectrometry m meter MCL maximum contaminant level MeSH Medical Subject Headings mg/kg milligrams per kilogram mg/L milligrams per liter mM millimolar NFMW non-ferrous-metal works ng/g nanograms per gram NPL National Priorities List NR not retrieved ppb parts per billion ppm parts per million SD standard deviation SL solubility limit TF translocation factor µg/g micrograms per gram

6
µg/kg micrograms per kilogram µg/L micrograms per liter µM micromolar μmol/L micromole per liter USGS United States Geological Survey WSD Washington State Department of Labor and Industries
7
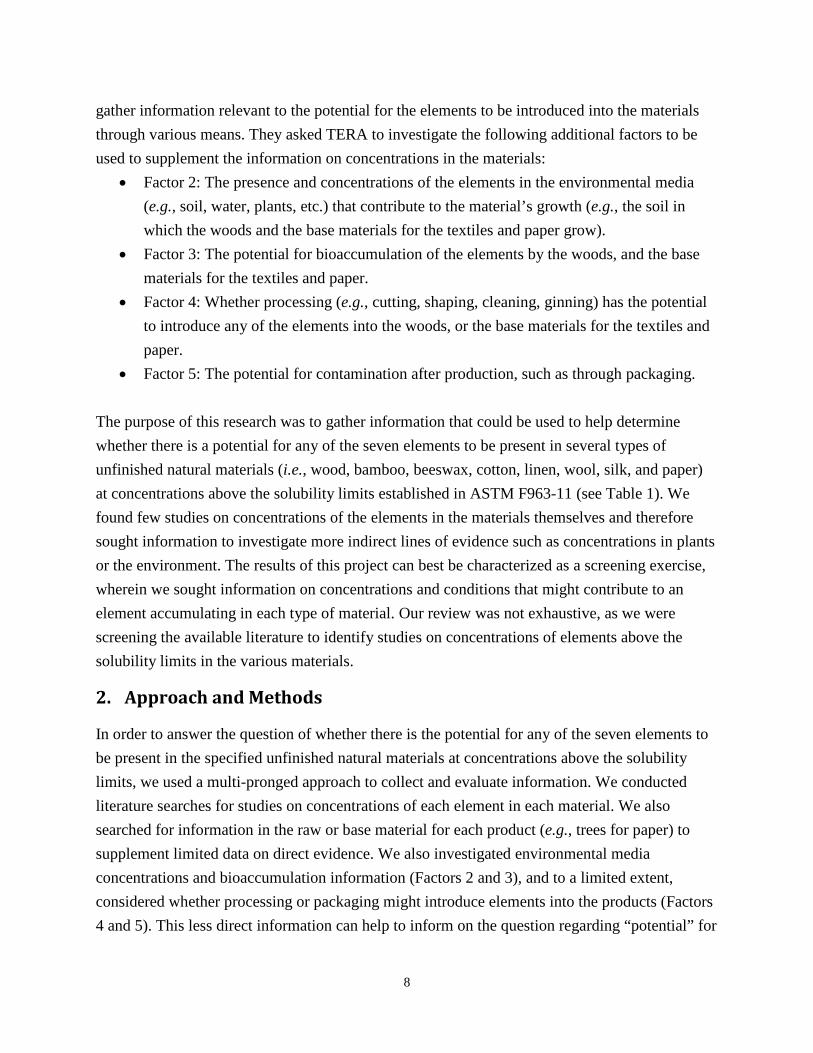
1. Introduction
The Consumer Product Safety Act includes requirements for third party testing of children’s products. Toys intended for children under the age of six (or toys or toy parts that are likely to be “sucked, mouthed or ingested,” are to be tested for compliance with the American Society for Testing and Materials (ASTM) F963-11, Standard Consumer Safety Specification for Toy Safety Products (the Toy Standard). The Toy Standard sets solubility limits for eight elements (antimony, arsenic, barium, cadmium, chromium, lead, mercury, and selenium) in paints, surface coatings, and accessible substrate materials. The U.S. Consumer Product Safety Commission (CPSC) requested Toxicology Excellence for Risk Assessment (TERA) to conduct literature searches investigating the concentrations of seven of the elements (CPSC addressed lead previously) in three different groups of materials (see Table 1 below). The CPSC is seeking information upon which to base a recommendation whether any of these materials can be determined not to contain any of the ASTM elements in concentrations above the Toy Standard’s solubility limits, and thus, do not require third party testing to assure compliance to the Toy Standard. For each of the materials, TERA conducted a literature search for studies with information on each of the seven elements in the material itself or base material from which it derives. TERA reviewed the results to identify studies reporting concentrations of the elements in the materials. Table 1. Material Groups, Solubility Limits, and Material Types for Selected Elements
Group 1 unfinished woods (ash, beech birch, cherry, maple, oak, pine, poplar, and walnut), bamboo, and beeswax
Group 2 undyed and unfinished fibers and textiles (specifically cotton, wool, linen, and silk)
Group 3 paper (wood or other cellulosic fiber), whether uncoated or coated
ASTM F963-11 Solubility Limit for each Element, ppm (mg/kg)
Antimony 60
Arsenic 25
Barium 1000
Cadmium 75
Chromium 60
Mercury 60
Selenium 500
CPSC asked TERA to gather information on a number of factors for the elements and materials. Factor 1 is concentrations of elements in the specific materials. Because these natural materials may accumulate heavy metals (elements) from the environment in which they grow or live, or from the base materials used to create them, CPSC also requested that TERA investigate and
8
gather information relevant to the potential for the elements to be introduced into the materials through various means. They asked TERA to investigate the following additional factors to be used to supplement the information on concentrations in the materials:
• Factor 2: The presence and concentrations of the elements in the environmental media (e.g., soil, water, plants, etc.) that contribute to the material’s growth (e.g., the soil in which the woods and the base materials for the textiles and paper grow).
• Factor 3: The potential for bioaccumulation of the elements by the woods, and the base materials for the textiles and paper.
• Factor 4: Whether processing (e.g., cutting, shaping, cleaning, ginning) has the potential to introduce any of the elements into the woods, or the base materials for the textiles and paper.
• Factor 5: The potential for contamination after production, such as through packaging. The purpose of this research was to gather information that could be used to help determine whether there is a potential for any of the seven elements to be present in several types of unfinished natural materials (i.e., wood, bamboo, beeswax, cotton, linen, wool, silk, and paper) at concentrations above the solubility limits established in ASTM F963-11 (see Table 1). We found few studies on concentrations of the elements in the materials themselves and therefore sought information to investigate more indirect lines of evidence such as concentrations in plants or the environment. The results of this project can best be characterized as a screening exercise, wherein we sought information on concentrations and conditions that might contribute to an element accumulating in each type of material. Our review was not exhaustive, as we were screening the available literature to identify studies on concentrations of elements above the solubility limits in the various materials.
2. Approach and Methods
In order to answer the question of whether there is the potential for any of the seven elements to be present in the specified unfinished natural materials at concentrations above the solubility limits, we used a multi-pronged approach to collect and evaluate information. We conducted literature searches for studies on concentrations of each element in each material. We also searched for information in the raw or base material for each product (e.g., trees for paper) to supplement limited data on direct evidence. We also investigated environmental media concentrations and bioaccumulation information (Factors 2 and 3), and to a limited extent, considered whether processing or packaging might introduce elements into the products (Factors 4 and 5). This less direct information can help to inform on the question regarding “potential” for
9
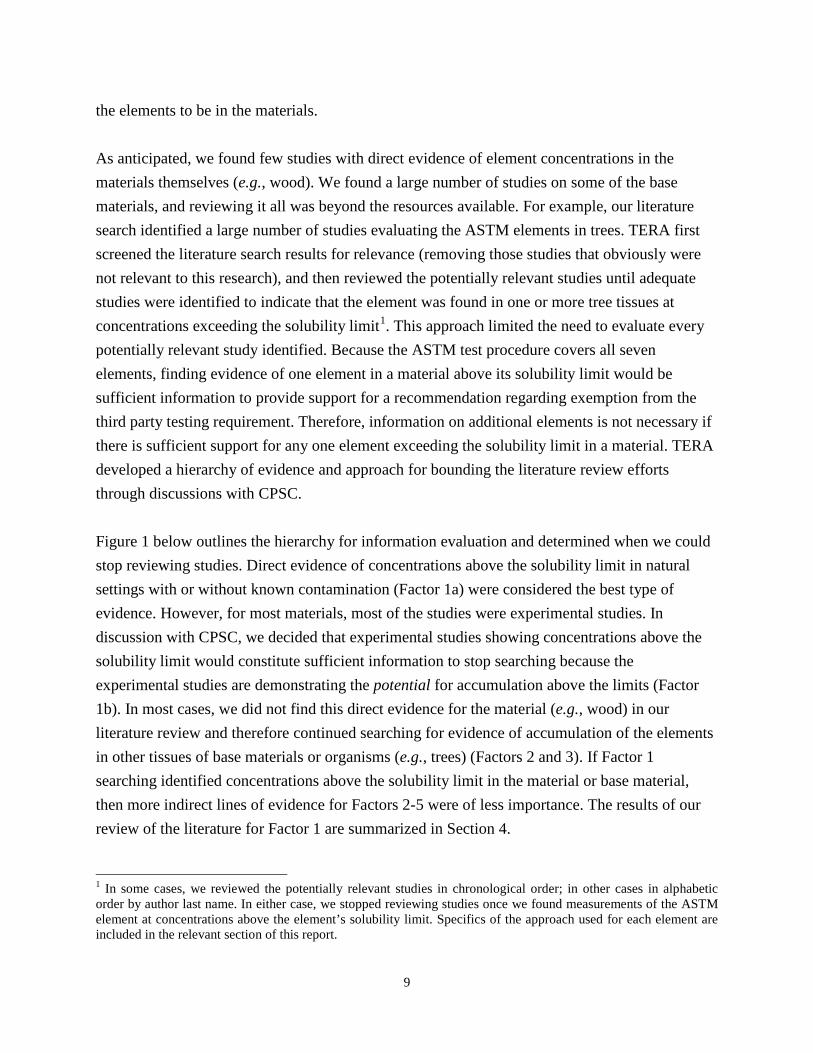
the elements to be in the materials. As anticipated, we found few studies with direct evidence of element concentrations in the materials themselves (e.g., wood). We found a large number of studies on some of the base materials, and reviewing it all was beyond the resources available. For example, our literature search identified a large number of studies evaluating the ASTM elements in trees. TERA first screened the literature search results for relevance (removing those studies that obviously were not relevant to this research), and then reviewed the potentially relevant studies until adequate studies were identified to indicate that the element was found in one or more tree tissues at concentrations exceeding the solubility limit1. This approach limited the need to evaluate every potentially relevant study identified. Because the ASTM test procedure covers all seven elements, finding evidence of one element in a material above its solubility limit would be sufficient information to provide support for a recommendation regarding exemption from the third party testing requirement. Therefore, information on additional elements is not necessary if there is sufficient support for any one element exceeding the solubility limit in a material. TERA developed a hierarchy of evidence and approach for bounding the literature review efforts through discussions with CPSC. Figure 1 below outlines the hierarchy for information evaluation and determined when we could stop reviewing studies. Direct evidence of concentrations above the solubility limit in natural settings with or without known contamination (Factor 1a) were considered the best type of evidence. However, for most materials, most of the studies were experimental studies. In discussion with CPSC, we decided that experimental studies showing concentrations above the solubility limit would constitute sufficient information to stop searching because the experimental studies are demonstrating the potential for accumulation above the limits (Factor 1b). In most cases, we did not find this direct evidence for the material (e.g., wood) in our literature review and therefore continued searching for evidence of accumulation of the elements in other tissues of base materials or organisms (e.g., trees) (Factors 2 and 3). If Factor 1 searching identified concentrations above the solubility limit in the material or base material, then more indirect lines of evidence for Factors 2-5 were of less importance. The results of our review of the literature for Factor 1 are summarized in Section 4. 1 In some cases, we reviewed the potentially relevant studies in chronological order; in other cases in alphabetic order by author last name. In either case, we stopped reviewing studies once we found measurements of the ASTM element at concentrations above the element’s solubility limit. Specifics of the approach used for each element are included in the relevant section of this report.
10
Figure 1. Hierarchy for data investigation
CPSC anticipated that there may not be direct measurement of concentrations above solubility limits in the materials and therefore this task included investigating information on concentrations in the environment and bioaccumulation (Factors 2 and 3). We used secondary sources to compile information on Factors 2 and 3; primarily the Agency for Toxic Substances and Disease Registry (ATSDR) Toxicological Profiles. As needed, we supplemented ATSDR with information from the Canadian Council of Ministers for the Environment (CCME). This information is summarized in Section 3.2. The last line of evidence we investigated was the potential to introduce any of the elements into the base materials through processing (Factor 4) or whether there is potential for contamination after production, such as through packaging (Factor 5). Because we found sufficient indirect support for the potential of one or more elements being above the solubility limit in most of the materials, we address Factors 4 and 5 with a general discussion of potential pathways of contamination in the Discussion, Section 5. Given the hierarchy for data investigation, we focused most of our effort on Factor 1.
11
Information on concentrations in the materials or their base or source material contributes direct evidence of the potential for elements exceeding the solubility limit. The other factors are secondary or indirect evidence and can be used to help confirm the findings of Factor 1, and provide information to evaluate and judge potential.
2.1 Literature Review Strategy
For each of the three material groups, TERA conducted a literature search for studies on the elements and each of the specific materials (see detailed literature search documentation in Appendix II). TERA identified and screened potentially relevant studies for information on concentrations of chemical elements in each material. TERA searched the National Library of Medicine PubMed database (http://www.ncbi.nlm.nih.gov/pubmed) and the CAB Abstracts database (http://www.cabdirect.org/) for primary literature. The keywords searched and resultant hits for each search string are found in Appendix II. All hits for each search string were recorded, saved, and downloaded into a raw EndNote library. After an initial prescreen to remove duplicates, extraneous, and irrelevant studies, a second, more thorough screening, was performed to determine relevancy and likelihood for a study to contain element concentration information in the materials of interest. This was done for each element and each material group.
2.1.1 Group 1
For Group 1, CPSC requested TERA search for chemical concentrations in unfinished wood (specifically ash, beech, birch, cherry, maple, oak, pine, poplar, and walnut), bamboo, and beeswax. These terms were relatively straight forward and were included in the search terms. Timber, tree, and ‘unfinished wood’ were added as additional search terms. Following the data investigation approach, once TERA identified element concentrations above the element’s solubility limit for a material, we were to stop reviewing studies. In the course of reviewing the studies on trees for Group 1 (unfinished wood, beeswax, bamboo), we evaluated and discussed with CPSC issues regarding what would constitute sufficient evidence when the concentrations measured were not in the exact material of interest. For example, are data of concentrations in roots or shoots of trees sufficient to conclude there is potential for concentrations in wood? Are experimental studies relevant when they are testing high concentrations of materials or delivering the element in ways different from what would be done in a natural setting? In addition, a number of studies measured concentrations in plants and trees grown on contaminated sites. In many cases, the purpose of these studies was to evaluate the potential for the plant/tree to accumulate the element in order to aid in cleaning the soil (i.e.,
12
potential for phytoremediation). In many cases these studies used species that were known or anticipated to be hyperaccumulators, or had the ability to take up and store levels of contaminates much higher than most plants. How relevant are those studies? After discussion with CPSC we decided it would be best to report these types of results as we encountered them, because they help provide a more complete picture of the types of information that are available for making determinations. In reviewing the literature for trees, we encountered very large numbers of potentially relevant studies and would not have been able to review all the identified literature. Therefore, we developed a strategy for prioritizing the literature for each element. Because the scope was refined to focus on natural uptake of the specific elements in trees in non-contaminated areas for Group 1, TERA focused the initial research on those data. However, we realized that limiting our reporting to concentrations found in trees from natural uptake in non-contaminated sites may only bias the data to underreport potential for uptake. Because it is currently unknown if trees are harvested from contaminated sites, TERA felt it important to also focus on data on concentrations in trees from natural uptake in contaminated sites as well. Experimental uptake studies were also captured in the search, but were not reviewed as a first priority unless there were no other studies available showing element uptake from contaminated and non-contaminated natural settings. Experimental studies were used to support any studies showing natural uptake. In many cases, this strategy ended up being different for each chemical, and was based on data availability, the number of studies to review, and the types of studies being encountered. In some cases, studies were organized alphabetically and reviewed one by one until sufficient studies were reviewed, in other cases studies were organized by year of publication and reviewed sequentially until sufficient studies were reviewed. In some cases, only a few studies were reviewed before this evidence was found; in other cases, all in-hand studies were reviewed. Note we only reviewed studies available in English and some studies we identified we were not able to obtain copies. The details of each strategy for each chemical are reported in the results section below (Section 4). Also, because data on the transfer of contaminants from plant roots to other plant parts was relevant, but not searched specifically, we included information from the studies on uptake and translocation when we encountered it in our review, and as such, this information is not consistently included across elements and material types. The information presented for wood in Section 4 is not inclusive of the totality of the entire body of literature. While our limited resources did not allow us to review all of the available studies on concentrations of these seven elements in trees, the studies we reviewed showed all seven elements have been measured in tree tissues, and some parts of the tree had concentrations higher
13
than the ASTM solubility limits for at least six of the elements. The data we present for concentrations of the seven elements in trees are sufficient to demonstrate the potential for one or more elements to be taken up into some parts of trees at concentrations above the solubility limits. Results of other studies we did not review for this report may lend additional insight into overall characterization for each element and material as a whole; review of additional studies may find higher (or lower) concentrations than we report here or find concentrations measured in additional tree tissues for one or more of the elements. We found extensive data on reports of high element concentrations in shoots, roots, and sometimes leaves of trees, but far less data on tree trunks or branches2. The limited data on concentrations in tree trunks or tree rings indicated either smaller concentrations than that measured in the other tissues or that trunks are a less tested part of the tree, however several authors commented on the limited translocation of an element to the trunk. Because of this, we report on data for all parts of the trees, but note what data we found for the trunk, wood, or core specifically. For the most part experimental studies showed greater concentrations in the material than studies in natural settings. This is to be expected since the purpose of most experiments is to find the limits or impacts of treatment. These experimental data can be used to demonstrate the potential for concentrations above the solubility limits. To determine whether data on trees grown in contaminated settings would be relevant to concentrations of elements in wood, we looked for information regarding where trees are harvested from to see if there may be some reason why trees would not be harvested from contaminated sites. We did not locate any regulations or industry practices that would ensure this kind of restrictions. There is evidence that tree harvesting mainly comes from privately owned tree farms all across the U.S. and the world (Ecology Communications Group, 2011). Harvested trees for manufacture can also come from tropical forests in Africa, Asia, and South America (Dykstra and Heinrich, 1992). Therefore, we included data on trees and plants grown in contaminated settings.
2While the study authors did not explicitly define parts of the tree, “trunk” is generally defined as the main woody stem of the tree and “branch” is the part of the tree that grows from the trunk and has leaves, flowers, or fruit growing on it.
14
The literature search results for bamboo and beeswax were not as large as that found for trees and we were able to review all the relevant studies available and include the information in this report.
2.1.2 Group 2
For Group 2 CPSC requested TERA include undyed and unfinished fibers and textiles (specifically cotton, wool, linen, and silk) as search terms. A preliminary search to define search terms for Group 2 materials found that the terms ‘undyed and unfinished fibers and textiles’ were much too broad and included many non-natural and synthetic textile blends. Textile fibers come in different forms and combinations, including natural, synthetic/inorganic, or blends. For the purposes of this research, we limited our literature search to natural fibers including proteinaceous (silk, wool) or cellulosic (cotton, linen) (WSD, 2001). We included search terms for ‘unfinished textile’, ‘unfinished fiber’, ‘unfinished fibre’, and some combinations of these terms. We note that in our searching we identified an additional natural fiber, hemp but did not include in this report. The literature search results for Group 2 materials were not as large as that found for trees and we were able to review all the relevant studies available and include the information in this report.
2.1.2.1 Wool
We limited our search results to studies related to animal-sourced wool (to avoid reviewing studies on synthetic wools). The Wool Products Labeling Act states “The term ‘wool’ means the fiber from the fleece of the sheep or lamb or hair of the Angora or Cashmere goat (and may include the so-called specialty fibers from the hair of the camel, alpaca, llama, and vicuna) which has never been reclaimed from any woven or felted wool product” (FTC, 1939). Angora from rabbits was also included if studies were identified, even though this species is not listed in the Wool Labeling Act and we did not specifically search for this term. As such, for this project, the term wool specifically included the hair from sheep, but also included wool sourced from other animals when and if the data were encountered. Other search terms included ‘fleece’.
2.1.2.2 Cotton
For the cotton material, post-harvest processing varies, and the different methods employed may have the potential to either increase or reduce contaminant load. Because of this, we limited our search to specifically include cotton plants and harvested cotton fibers.
15
2.1.2.3 Silk
Search terms for this material included the word silk. Silk, a natural protein fiber comes from the mulberry silk moth pupa (Bombyx mori) and others from the same genus; the organism is traditionally called a silkworm. There were limited studies with information on the ASTM elements measured in silk; however, in reviewing the literature search results we identified a number of studies measuring the elements in silkworms and we have reported information from those studies here, but it was not a specific search term in the literature search. “Corn silk” is another material identified during our literature review but not specifically covered in this report. It reportedly is used in clothing manufacture.
2.1.2.4 Linen
Linen is made from cellulosic fibers of the flax plant (Linum usitatissimum). We did not limit the search to a specific genus or species but generally looked for flax plant. We also included the search term ‘linen’. During our literature review, we learned that linseed is another name for flaxseed and as we encountered studies on linseed we included them, but we did not specifically search the literature for linseed.
2.1.3 Group 3
Most paper comes from trees and tree parts, and often from trees harvested from tree farms. Paper can also come from rice, other plants (including cotton), and recycled fabrics and materials. Different tree parts can be used in paper making, including waste tree parts from logging and sawmill operations, and harvested logs. These materials are transported to paper mills, rinsed, and chipped. These chips are then pulped with various mixtures of steam and chemicals that break down the fibers and separate cellulose and remove/degrade lignin. The pulping process can involve chemical pulping and bleaching. Other approaches use mechanical pulping. During the pulping process, additives can be added to affect paper quality. Then, water is removed from the pulp through various mechanisms and the material is dried, usually using heated rollers, causing the fibers to seal together and forming paper (Idaho Forest Product Commission, 2015; Wikipedia, 2015). Paper can readily be made from recycled fibers as well. Group 3 includes paper (wood or other cellulosic fiber), whether coated or uncoated. During the course of the project, CPSC indicated to TERA that the Group 3 materials were of a lower priority than either Group 1 or Group 2 materials. With limited resources and time, we did not focus on seeking data on paper specifically, but thought that the information gathered on wood in Group 1 was directly relevant to paper, as most paper is made from trees. Tree parts and plant vegetation are also used in paper production. If these trees and plants used in paper production

16
are contaminated with these elements, then these elements might also be found in the final paper product. We did however, conduct the literature search for paper, and included coated and uncoated paper, cellulose pulp, cellulose, wood pulp, rag, grass, lignin, mechanical pulping, and chemical pulping. The raw literature search results (unscreened) can be made available if future work is needed in this area.
3. Transfer of Elements to the Natural Materials
In order to understand the potential contamination of unfinished natural products with the elements it is necessary to understand how the elements can be transported into natural products and specifically into wood, beeswax, bamboo, cotton, linen, wool, silk, and paper. The elements considered in this report are all part of the earth’s crust and can be found naturally in environmental media such as soils, water, and air. To evaluate the potential for elements being found in the natural products, we need to understand the mechanisms by which transport of the elements to the natural products might occur to the various environmental media. Contamination of natural products by the element under consideration (antimony, arsenic, barium, cadmium, chromium, mercury, and selenium) requires transport or transfer of the element through environmental media. The media include element-transport via air, water, solutions other than water, and solids. The following is general information regarding transport mechanisms for air, water, and plants. The elements under consideration do not appear to be particularly prone to transport into air except under somewhat specific and probably local circumstances (e.g., smelter emissions). Elements (or metals) in the base or zero valance state or as cations in salts have essentially no volatility with one exception, mercury. Metallic mercury is the only liquid base state metal at room temperature. It has enough volatility to be toxic in closed spaces but not enough to transport or translocate significant proportions of the originating mass of the base element by air. That is, considering its relatively low vapor pressure, the mass transfer of metallic mercury is a comparatively slow process anticipated to require months or years to completely evaporate a reasonably sized source. Also, such potential sources of evaporating mercury metal are anticipated to be quite rare and, if present, most likely to be known and controlled. The mass transfer of any of the other elements via air is also considered to be essentially nil because of the lack of volatility and the anticipated lack of sources for micronized metals that might become airborne as aerosols. Translocation of elements to plants that are the raw material for the natural product (e.g., trees, bamboo, flax, and cotton), or are the food source for an organism that
17
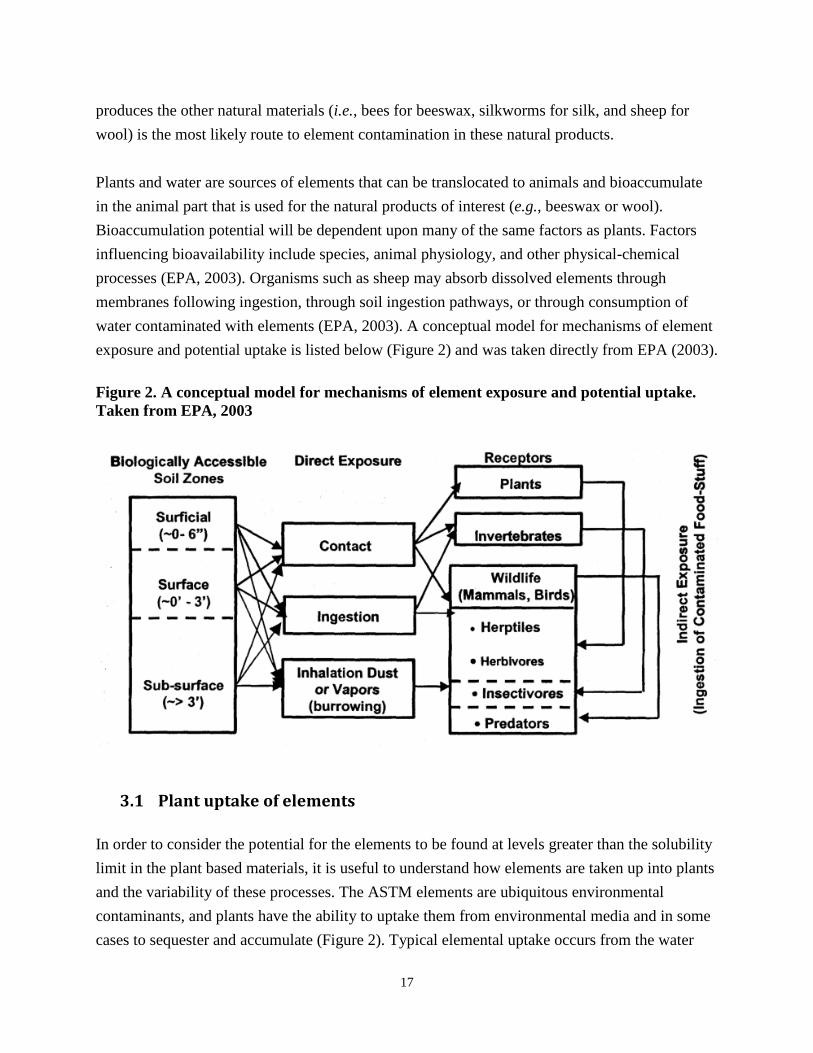
produces the other natural materials (i.e., bees for beeswax, silkworms for silk, and sheep for wool) is the most likely route to element contamination in these natural products. Plants and water are sources of elements that can be translocated to animals and bioaccumulate in the animal part that is used for the natural products of interest (e.g., beeswax or wool). Bioaccumulation potential will be dependent upon many of the same factors as plants. Factors influencing bioavailability include species, animal physiology, and other physical-chemical processes (EPA, 2003). Organisms such as sheep may absorb dissolved elements through membranes following ingestion, through soil ingestion pathways, or through consumption of water contaminated with elements (EPA, 2003). A conceptual model for mechanisms of element exposure and potential uptake is listed below (Figure 2) and was taken directly from EPA (2003). Figure 2. A conceptual model for mechanisms of element exposure and potential uptake. Taken from EPA, 2003
3.1 Plant uptake of elements
In order to consider the potential for the elements to be found at levels greater than the solubility limit in the plant based materials, it is useful to understand how elements are taken up into plants and the variability of these processes. The ASTM elements are ubiquitous environmental contaminants, and plants have the ability to uptake them from environmental media and in some cases to sequester and accumulate (Figure 2). Typical elemental uptake occurs from the water
18
and soil, with less uptake occurring in the foliage from atmospheric deposition (Suter, 2007). Uptake into plants begins with the transfer of the particle into the root tissues (and occasionally the leaf tissues). Once inside the roots, the ASTM elements can be sequestered and stored there, or can be transferred (translocated) from the roots into aerial plant tissues, such as stems, trunks, shoots, branches, leaves, and flowers. Accumulation mechanisms are generally plant species and element specific. The first step of uptake relates to bioavailability from environmental soil and water. Bioavailability of elements in soils is dependent upon a number of factors, including clay content, organic matter content, pH, cation-exchange capacity, soil and element particle size, salinity, partition coefficients, and element solubility and speciation (Suter, 2007; Shaw, 1989; Terry et al., 2000). Other environmental factors that can influence site-specific bioavailability include average temperature, rainfall, and exposure duration (Suter, 2007; Clemens, 2006). ASTM elements that are bound to soil particles are less bioavailable than those dissolved in soil or ground water. Overall, environment-specific characteristics play a large part in the bioavailability of the ASTM elements. The ability of a plant to uptake elements that are bioavailable is highly variable, and uptake factors (the ratio of concentration of element in plant to the concentration of the element in soil) have been shown to vary up to four orders of magnitude from species to species and site to site (Suter, 2007). Traits of the plant itself can impact its ability to uptake and accumulate elements – factors such as plant age, taxonomy, growth stage, root depth, plant genotype and tolerance, and nutrition status, among others (Suter, 2007; Shaw, 1989). Many ASTM elements are essential nutrients for plants, and plants have developed mechanisms to uptake these essential nutrients from soil. Uptake mechanisms for non-essential elements are derived from these nutrient uptake mechanisms for many elements, as these non-essential elements have many similar chemical and physical properties to these nutrients (Suter, 2007; Clemens, 2006). For example, the mechanism for cadmium uptake into plant roots is likely a competitive mechanism related to the plant iron, calcium, and zinc transporter system (Clemens, 2006). Arsenic uptake into plants roots is likely competitive with phosphate or sulfate using anion uptake channels or the phosphate transporter system (Meharg and Hartley-Whitaker, 2002; Clemens, 2006). Selenium uptake into plant roots is competitive with the sulfate transporter systems (Terry et al., 2000). Because these mechanisms for essential nutrient uptake are not entirely specific to one element type, the potential for mechanisms to exist for plant uptake of additional ASTM elements such as antimony, barium, chromium, and mercury are high.
19
Once an element is taken into the root system in plants, its ability to translocate and sequester the compound is again plant species and element specific. This explains the variability of concentration levels of these elements found in different plant tissues. It has been suggested that some factors influencing translocation and sequestration are related to plant water and lipid content, as well as genotype for specific element tolerance, uptake activity, and translocation efficiency (Suter, 2007; Clemens, 2006). Other factors include sequestration capacity of the roots, degree of mobility and accessibility once sequestered, xylem loading activity, and transport efficiency inside the cell and across cell membranes (Clemens, 2006). Element translocation from the roots into other plant tissues is done through the plant xylem, which is the main water and nutrient transport system in plants (Clemens, 2006). In order for an element to be translocated, it must be in the correct speciation, transported to the cell wall, transported across the cell membranes, be actively loaded into the xylem, and have transport ligands available for binding (Clemens, 2006; Terry et al., 2000). Effective transport also relates to some plant characteristics including age of plant, distribution of the element, plant stage of development, and plant physiological condition (Terry et al., 2000). For example, selenium translocation from root to shoot depends on the form of selenium and stage of plant growth, where selenium was found to accumulate in leaves during vegetative stages but accumulated in seeds during plant reproductive stages (Terry et al., 2000). Overall, there is potential for elements that have been taken into the plant roots to be translocated to all parts of the plant, where they can be sequestered. Sequestration of elements, especially more toxic forms, typically happens in the root vacuoles (Clemens, 2006). Sequestration can happen as a protective mechanism in the plants when either element concentrations are too high or an element is particularly toxic (Shaw, 1989). In plant cell types, including roots and other tissue types, once inside the cell the element binds to transporters or other ligands to become stored in the vacuole. Other mechanisms for sequestration also exist, including the complexation with chelator proteins or assimilation into plant cellular proteins or other parts (Meharg and Hartley-Whitaker, 2002; Terry et al., 2000). For example, selenium can be metabolized and assimilated into selenoproteins, chloroplasts, or other cellular machinery (Terry et al., 2000). In total, many factors can influence element bioavailability from environmental media, the ability for plant uptake, the potential for translocation inside the plant, and the ability of a plant to sequester the element. Mechanisms for element uptake and accumulation exist and understanding these mechanisms will help evaluate the plausibility of concentrations reaching
20
levels greater than the solubility limit. Overall, if more specific data are needed, uptake factors, translocation factors, bioaccumulation factors, or biota soil/sediment accumulation factors (BSAF) specific to each element, plant, and soil type can be used to more accurately estimate the potential for the ASTM elements to be taken up by plants.
3.2 Environmental Concentrations and Bioavailability (Factors 2 and 3)
Below we summarize information on environmental concentrations and bioavailability from relevant ATSDR Toxicological Profiles and supplement with information from assessments prepared by CCME. We provide information on concentrations in various environmental media including water and soil that may be relevant to the uptake of specific elements into the materials of interest directly or via bee, silkworm, or sheep food sources. Because we found data on concentrations of the elements for few of the materials of interest themselves, we reviewed and summarized information from concentrations measured in the trees or base materials for the textiles and included that information in Section 4, thereby directly capturing evidence of bioavailability in those discussions. In this section we summarize the information extracted from secondary sources, but did not supplement this with more recent data from the primary literature.
3.2.1 Antimony
The following information on Factors 2 and 3 for antimony is summarized from the ATSDR Toxicological Profile for antimony (ATSDR, 1992). Antimony has many naturally occurring and man-made forms and complexes, as it exists in four valence states (Sb-3, Sb0, Sb+3, and Sb+5). ATSDR (1992) reports chemical properties for antimony, antimony pentasulfide, antimony pentoxide, antimony potassium tartrate, antimony trichloride, antimony trioxide, antimony trisulfide, and stibine, with antimony trioxide being the most stable and common form. ATSDR also lists tartrate as a common complex of antimony with acids. Water concentrations of antimony were below 5 µg/L in all but 70 of 1,077 United States Geological Survey (USGS) entries (spanning from 1960-1988). For those entries above 5 µg/L, the geometric mean was 12 µg/L [standard deviation (SD) 1.93 µg/L]. The authors of the report determined statistically that the geometric mean for all 1,077 sites was 0.25 µg/L (SD 7.16 µg/L). Dissolved antimony concentrations in a number of rivers ranged from 0.197-0.539 µg/L. In rivers heavily contaminated from antimony mining wastes, mean concentrations ranged from 0.6-4.3 µg/L and maximum concentrations ranged from 0.8-8.2 µg/L. Urban runoff tested in 19 cities ranged from 2.6–23 µg/L. Maximum discharges from related industries ranged from 3.4–80 mg/L.
21
Antimony concentrations in groundwater ranged from 0.3-1.2 µg/L. Groundwater containing urban runoff had antimony concentrations below the detection limit. However, elevated concentrations in ground and surface waters were identified at hazardous waste sites with means reported at 40-50 µg/L. At National Priorities List (NPL) sites [contaminated sites prioritization list from the United States Environmental Protection Agency (EPA)], maximum concentrations were 2,100 µg/L in groundwater and 1,000 µg/L in surface water. Antimony can leach from pipes containing antimony-based solder; however, studies suggest that increases in concentration due to leaching are minimal. Leachate from landfills was low at 0.01 mg/L but concentrations in sediment below the leachate outfalls were reported up to 23.9 mg/L. Sediment can be a significant sink for antimony. Levels reported at non-contaminated sites ranged from 0.032-1.9 ppm (mg/kg). However, contaminated but dredged sediments contained a range of antimony concentrations from 0.5-17.5 ppm (mg/kg) with a median concentration of 2.9 ppm (mg/kg). In heavily contaminated sites near smelters, as distance to the smelter decreased, concentrations of antimony in sediments increased from 2-3 times the background (at an 8-15 km diameter) to as high as 12,500 ppm (mg/kg) within 1 km of the site (where heavy slag dumping had occurred). A USGS survey of 1,318 sites found soil concentrations (including sludge treated soils) of antimony ranged from ˂1-8.8 mg/L, with a mean concentration of 0.48 mg/L. Soils near an antimony smelter contained elevated concentrations ranging from 50-260 mg/L, but was thought to result from air deposition as concentrations decreased quickly with depth in soil. There is little data available regarding antimony adsorption to soil generally, but it adsorbs strongly to colloidal materials in soil. Ranges of maximum concentrations reported from NPL sites were 0.084-2,550 mg/L. Ambient concentrations in soil, rock, shale, sandstone, and limestone were reported from 0.05-1.5 mg/L. Speciation and resultant changing characteristics heavily influence bioavailability for the antimony compound. Only low levels of bioaccumulation of antimony have been reported in aquatic organisms. Concentrations of antimony in vegetation, soils, and animals are increased near smelter sites. In animals (voles, shrews, rabbits, and invertebrates), bioaccumulation was not reported when tissue concentrations were compared to food concentrations. In the case of vegetation, the increased concentrations are thought to be due to atmospheric deposition, as uptake from the soil appears to be minor. Antimony concentrations were elevated in grasses near smelters ranging from 6.2-300 mg/kg, compared to background concentrations in grasses of 0.1-4.5 mg/kg. Antimony concentrations in vegetables were reported to range from 0.001-0.003
22
mg/kg and reported in forage crops at about 0.1 mg/kg. ATSDR suggests that once antimony deposits on soil from the atmosphere, it is rapidly converted to more insoluble forms.
3.2.2 Arsenic
The following information on Factors 2 and 3 for arsenic is summarized from the ATSDR Toxicological Profile on arsenic (ATSDR, 2007a). Arsenic has many naturally occurring and man-made forms and complexes, as it exists in three valence states (As-3, As+3, and As+5). ATSDR (2007a) lists and reports chemical properties for arsenic, arsenic acid, arsenic pentoxide, arsenic trioxide, calcium arsenate, gallium arsenide, sodium arsenate, sodium arsenite, arsanilic acid, arsenobetaine, dimethylarsinic acid, disodium methane- arsonate, methanearsonic acid, 3-nitro-4-hydroxy-phenyl-arsonic acid, sodium arsanilate, sodium dimethylarsinate, and sodium methanearsonate. Arsenic is commonly found in water in the United States. Arsenic levels in 293 samples from various rivers reported median concentrations of 1 µg/L and the 3 µg/L at the 75th percentile. In surface waters, arsenic concentrations ranging from 0.138-1,700 µg/L were reported, and concentrations are expected to be impacted by runoff from contaminated sites. For example, a lake highly impacted by cultivation had average arsenic concentrations of 5.12 µg/L, and other contaminated areas ranged from 0.8-55 µg/L. However, concentrations of arsenic from reference sites were reported from 0.9-1.9 µg/L. Average arsenic concentrations in groundwater in the U.S. range from 1-2 µg/L, however, in areas containing volcanic rock or sulfidic mineral deposits, concentrations can be as high as 3,400 µg/L. In some mining areas, concentrations have been reported even higher at 48,000 µg/L. However, in non-impacted sites, groundwater concentrations across the U.S. have ranged from 0.5-278 µg/L. Arsenic is also found in drinking water at an average of 2.4 µg/L, although some counties had elevated concentrations ≥50 µg/L, and the reported range varied widely (˂0.01-620 µg/L). Much of this variation was derived from either contamination or the geology of the area. Arsenic is a natural component of the Earth’s crust and is found in arsenic-bearing minerals. Arsenic typically binds to particulates in sediments. In heavy cultivation areas, sediment concentrations in lakes and wetlands were reported as 5.6 µg/g and 6.7 µg/g, respectively. Natural concentrations in sediments are typically ˂10 µg/g, but have been reported as high as 4,000 µg/g. High concentrations in sediments were mainly found to be near contaminated sites.
23
For example, the mean concentration of arsenic detected near an old gold mining site was 1,920 µg/g. Arsenic can form insoluble complexes with other elements in soils making it relatively immobile. Arsenic has been shown to leach from treated woods and other arsenic containing materials, but tends to stay relatively confined to an area adjacent to the material. Arsenic concentrations in soils are also highly varied, ranging from ˂0.1-97 µg/g in uncontaminated areas and, like in groundwater, depend heavily on area geography and area industry. The mean concentration in soil was reported by USGS at 7.2 µg/g. Arsenic soil concentrations in mining areas and near smelters and other industries are elevated, some reported as high as 50,000 µg/g. Because some pesticides are formulated with arsenic, elevated concentrations are reported in some agricultural areas (22 µg/g in treated areas compared to 2 µg/g in a reference site). Mean reported concentrations for treated soils were 27.8-51.0 µg/g, compared to mean levels at 2.26 µg/g in untreated soils. Some residual arsenic contamination of orchard soils was reported with concentrations as high as 141 µg/g, although it is expected that this type of residual contamination is limited to the upper 6-18 inches or soil. There is some documentation of arsenic bioaccumulation and trophic transfer up the food chain (from algae up to fish), however biomagnification is not apparent. Many environmental factors impact arsenic bioaccumulation including soil and/or water type, organism type, etc. Studies investigating soil bioavailability found 85% of total applied arsenic was phytoavailable immediately following application, but reduced to 46% four months after application. Terrestrial plants can accumulate arsenic through two mechanisms, either through root uptake or leaf absorption. One experimental study reported the main uptake mechanism of leafy plants was absorption from deposition when tested near a factory with emissions of arsenic. However, for root crops, both uptake mechanisms were utilized. Overall, most studies reported relatively low uptake (even in highly contaminated sediments) with just a few species able to accumulate up to high levels. Arsenic concentrations in vegetable soils were reported as generally below 12 µg/kg, with a maximum reported up to 18 µg/kg. Uptake in plants is modulated by arsenic speciation, where organic arsenic had increased translocation compared to inorganic arsenic. In uptake experiments, arsenic uptake was mainly in the roots (85%) with little translocation to the fruit (1%), but did depend on the arsenic species (where monomethylarsonic acid and dimethylarsinic acid had higher accumulation in the shoots/fruits).
24
3.2.3 Barium
The following information on Factors 2 and 3 for barium is summarized from the ATSDR Toxicological Profile on barium (ATSDR, 2007b). Where additional data were needed, a secondary authoritative review [Canadian Council of Ministers for the Environment (CCME)] was used to supplement the ATSDR data (CCME, 2013). Barium is a silvery-white element that takes on a silver-yellow color when exposed to air, and occurs in nature in many different forms, the most stable valence state being Ba+2. ATSDR (2007b) lists and reports chemical properties for barium and barium compounds including barium acetate, barium chloride, barium cyanide, barium hydroxide, and barium oxide, barium carbonate and barium sulfate. Barium sulfate and barium carbonate are often naturally occurring in the environment, and due to their low solubility can persist in the environment. Barium is commonly found in water. Barium was found in approximately 99% of surface water sampled in concentrations averaging 10-60 µg/L, and reaching 15,000 µg/L. Mean concentration levels in drainage basins have ranged from 15 μg/L to 90 μg/L. Aquifer concentrations have been found to range from 18 to 594 μg/L, with a median value of 104 μg/L. Barium was detected in most drinking water supplies at levels <200 μg/L with a mean concentration of 28.6 μg/L. Groundwater concentrations of barium have been found to range from 1.2-10,000 μg/L. Some concentrations exceed the EPA’s maximum contaminant level (MCL) for barium in water of 2.0 mg/L (2,000 μg/L). Locations with leaching and erosion from sedimentary rock are more likely to have high concentrations of barium. Barium has been detected at 798 hazardous waste sites in the U.S. with surface water levels ranging from 0.33-8,100,000 μg/L and groundwater levels ranging from 0.064-2,100,000 μg/L. Mean values in groundwater up to 7,300 µg/L were reported near a coal mining site, with maximum concentrations up to 10,800 µg/L. Barium was detected in soils and sediments (lakes, streams, ponds, etc.) at hazardous waste sites, reaching levels of 54,700 ppm and 17,600 ppm respectively. Barium is a component of the earth's crust and is found in most soils at concentrations ranging from about 15 to 3,500 ppm DW and with mean values between 265 and 835 ppm, depending on soil type. Barium concentrations as high as 37,000 ppm have been reported in soils near barite deposits. Barium in cultivated and uncultivated B horizon soils (subsurface soils) was found at levels ranging from 15 to 5,000 ppm, and 150 to 1,500 ppm in surface horizon soils.
25
The information below related to barium bioaccumulation in other types of plants was summarized from ATSDR (2007b) and supplemented with information from CCME (2013). Barium is typically found in plants at trace levels, but the potential for bioconcentration of barium from soil or uptake in terrestrial plants is not well characterized. Barium is not anticipated to be available to plants via air exposures. Overall, barium is strongly accumulated by certain types of plants (legumes, grain stalks, forage plants, red ash, black walnut, hickory and Brazil nut trees, Douglas fir and plants of the genus Astragallu), and is typically concentrated in the plant roots (although detectable concentrations can be found in leaves, stems, and seeds as well) (CCME, 2013). Some plants show potential for bioconcentration of barium from soil. Corn samples from a number of field studies found barium concentrations ranging from 5-150 ppm with mean concentrations ranging from 15-54 ppm. The barium content in other cultivated plants (e.g., lima beans, cabbage, soybeans, and tomatoes) ranged from 7-1,500 ppm with mean concentrations in various plants ranging between 38 and 450 ppm. Soil amendments and fertilizers have been shown to have barium levels ranging up to 669 μg/g; however, the potential for accumulation of barium in soils due to the application of fertilizers and soil amendments has not been assessed.
3.2.4 Cadmium
The following information on Factors 2 and 3 for cadmium is summarized from the ATSDR Toxicological Profile for cadmium (ATSDR, 2012a). Cadmium is a naturally occurring soft, silver-white element found in the earth’s crust, and only exists in the Cd+2 state. ATSDR (2012a) lists and reports chemical properties for cadmium, cadmium carbonate, cadmium chloride, cadmium oxide, cadmium sulfate, and cadmium sulfide, of which cadmium chloride and cadmium sulfate are soluble in water. Cadmium is found in water around the world, largely as the result of mining and agricultural activity. Samples taken near cadmium-bearing mineral deposits have detected cadmium concentrations of ≥1,000 μg/L. Cadmium levels in natural surface water and groundwater are usually low, measured at <1 μg/L, as compared to the EPA drinking water regulatory limit of <5 μg/L. In a survey of groundwater in the vicinity of waste sites, concentrations reached 6,000 μg/L. Cadmium in wastewater was found to originate from agricultural, industrial, commercial, and residential sources, with the highest levels found in residential sewage. Sediment samples at mining sites found cadmium at concentrations ranging from 0.62 to 300 μg/g DW in the <250 μm sediment fraction and from 0.89 to 180 μg/g DW in the <63 μm fraction. Cadmium content in marine sediments was detected at levels of 0.1 to 1.0 μg/g.
26
Cadmium can bind strongly to organic matter in soils, but is still available for uptake in plants and is able to enter the food chain. Bioavailability and mobility depend on the soil characteristics and on pH. Naturally occurring cadmium concentrations in soils were found to range from 0.01 mg/kg to 2.7 mg/kg, with elevated levels in soils with parent materials such as black shale. Topsoil concentrations were more than twice as high as subsoil levels, possibly as the result of atmospheric fallout. U.S. regulatory limits for cadmium in sewage sludge are less than 20 mg/kg, suggesting soils receiving sewage sludge should not have heightened cadmium levels. Elevated levels of cadmium have been found in the soil of areas in proximity of contaminated sites, with levels reaching greater than 750 mg/kg. Levels in moss at contaminated sites were found to reach greater than 24 mg/kg DW, with a mean concentration of 1.86 mg/kg DW.
Cadmium is known to bioaccumulate in terrestrial organisms, at all levels of the food chain, with the potential for biomagnification. In plants, accumulation depends on uptake by the root system, direct foliar uptake and translocation within the plant, and surface deposition of particulate matter. It is believed that cadmium is absorbed by passive diffusion and translocated freely. Generally, cadmium concentrates in the leaves of plants and therefore is more likely found in leafy vegetables grown in contaminated soil than in seed or root crops. Generally, concentrations of cadmium in crops are reported as less than 1.0 mg/kg, but can be higher in aquatic plants than terrestrial plants, and cadmium is generally recognized as bioavailable to plants. Uptake has been shown to be dependent on soil properties, with absorption decreasing as soil pH increases. Cadmium bioavailability was shown to be higher in wetland soils than in upland soils, and higher in noncalcareous than calcareous soils. Although cadmium bioaccumulates up the food chain, evidence of biomagnification through trophic levels is inconclusive. One study found that mulberry plants grown in cadmium contaminated soils exhibited toxicity starting at soil levels of 75.8 mg/kg, and the authors found impacts in silkworms related to decreased ingestion, digestion, weight of cocoon, and rate of silk reeling at various exogenous cadmium concentrations (Wang et al., 2004). While the authors did not report the concentrations found in the silkworms themselves, this suggests that cadmium levels below the ASTM solubility limit might be toxic to silkworms.
3.2.5 Chromium
The following information on Factors 2 and 3 for chromium is summarized from the ATSDR Toxicological Profile on chromium (ATSDR, 2012b). A secondary authoritative review was
27
used to supplement the ATSDR data (CCME, 1999). Chromium is a naturally-occurring element found in rocks, animals, plants, and soil, where it exists in combination with other elements to form various compounds. The main environmental forms of chromium are Cr+3 and Cr+6, but can range from Cr-2 to Cr+6. ATSDR (2012b) lists and reports chemical properties for chromium(0), chromium(III) acetate monohydrate, chromium(III) nitrate nonahydrate, chromium(III) chloride, chromium(III) chloride hexahydrate, chromite, chromium(III) oxide, chromium(III) phosphate, chromium(III) sulfate, sodium chromite, chromium hydroxide sulfate, chromium(III) picolinate, chromic acid, chromium (IV) oxide, ammonium dichromate, calcium chromate, chromium(VI trioxide), lead chromate, potassium chromate, potassium dichromate, sodium chromate, sodium dichromate dehydrate, strontium chromate, zinc chromate, and sodium dichromate.
Chromium is commonly found in water in the U.S. Sample studies have detected chromium levels of up to 30 μg/L in river water (mean = 10 μg/L), 5μg/L in lake water, and 50 μg/L in ocean water (mean = 0.3 μg/L). Levels tend to be higher in proximity to anthropogenic sources of chromium, including coal and oil production, chrome plating, and manufacturing cooling towers. Chromium levels in groundwater near such anthropogenic sources have been found at levels reaching 25,000 μg/L. Drinking water levels in the U.S. have been reported to range up to 35 μg/L, with most levels less than 5 μg/L. Sediment samples from coastal waters found chromium concentrations of up to 130.9 μg/g. In hazardous waste sites, chromium was identified in 27% of sediment samples tested. Sediment concentrations ranging from 0.8-130.9 µg/g, and as high as 500 mg/kg have been reported. Soil levels of chromium differ greatly depending on the composition of the soil parent rock, with elevated levels correlating with basalt and serpentine soils, ultramafic rocks, and phosphorites. In a survey of 1,319 samples of soils and other surficial materials collected in the U.S., chromium concentrations ranged from 1–2,000 mg/kg, with a mean of 37 mg/kg. At contaminated sites, chromium soil levels have been reported as high as 43,000 mg/kg. In most soil conditions, chromium will be present predominantly in the chromium(III) oxidation state which has very low solubility and low reactivity, leading to low mobility in the environment. However, under oxidizing and other environmental conditions including varying pH, chromium(VI) may be present in soil as CrO4
–2 and HCrO4 in relatively soluble and mobile forms. A study comparing the leachability of several elements found chromium to exhibit the least mobility of all the elements studied. Mobility of chromium(III) may increase due to flooding through the formation of soluble complexes caused by the decomposition of plant
28
detritus. Chromium present in soils as soluble chromium(VI) and chromium(III) complexes are likely to have greater mobility, although the forms comprise only a small percentage of chromium in soil. Chromium uptake has been reported in plants, with higher concentrations reported in plants growing in soil near ore deposits or chromium-emitting industries and soil fertilized by sewage sludge. Levels have been found to rarely exceed 0.5 mg/kg DW in uncontaminated soils, but have been found above 3 mg/kg DW in contaminated sites. Potential for accumulation in plants is possible, but was reported as rarely exceeding 100 mg/kg DW. Most chromium that is taken up in plants is retained in the roots, and only a small fraction is translocated in the aboveground part of edible plants, even for those grown in contaminated soils. Therefore, biomagnification of chromium along the terrestrial food chain (soil-plant-animal) is not anticipated. Mobility of chromium in soil varies with the speciation of chromium, which is a function of redox potential and the pH of the soil.
3.2.6 Mercury
The following information on Factors 2 and 3 for mercury is summarized from the ATSDR Toxicological Profile for mercury (published in 1999, with an addendum published in 2013). Summary information was extracted from both documents (ATSDR, 1999; ATSDR, 2013). Mercury occurs naturally in the environment and exists in several forms, including Hg0, Hg+1, and Hg+2. These forms can be organized into three categories: metallic mercury (elemental mercury), inorganic mercury, and organic mercury. Metallic mercury is a shiny, silver-white metal that is a liquid at room temperature. Metallic mercury is the elemental or pure form of mercury (i.e., it is not combined with other elements). Metallic mercury metal is the familiar liquid metal used in thermometers and some electrical switches. ATSDR (1999) lists and reports chemical properties for mercury, mercuric (II) chloride (inorganic), mercuric (II) sulfide (inorganic), mercurous (I) chloride (inorganic), mercuric (II) acetate (organic), methylmercuric chloride (organic), dimethyl mercury (organic), and phenylmercuric acetate (organic). Mercury is found in the environment due to natural and anthropogenic sources. Man-made sources include industrial processes, including chloralkali production, mining operations and ore processing, metallurgy and electroplating, chemical manufacturing, ink manufacturing, pulp and paper mills, leather tanning, pharmaceutical production, and textile manufacture. Industrial effluents have been reported to contain greater than 10 ppm mercury, contributing to sediment contamination in the vicinity of 4.3 to 316 mg/kg. In an evaluation of 714 NPL hazardous waste
29
sites, mercury was detected in 197 surface water samples, 395 groundwater samples, and 58 leachate samples. Mercury is directly applied to soils through use of inorganic and organic fertilizers (e.g., sewage sludge and compost), lime, and fungicides containing mercury. Mercury in sewage sludge was detected at levels of 2.9 mg/kg, while municipal solid waste levels reached 3.95 ppm (mg/kg). The use of sludge on crop land increased total mercury from 80 to 6,100 μg/kg and increased methylmercury levels from 0.3 to 8.3 μg/kg. The ash from municipal waste incineration contains seasonally varying levels of mercury, ranging from 6.5-58 mg/kg. Samples taken near incinerators showed mercury increases of 2 mg/kg in soil, 4 mg/kg in refuse combustibles, and 100 mg/kg in fly ash. In terrestrial food chains, the potential for bioaccumulation is indicated by the uptake of mercury by the edible mushroom Pleurotus ostreatus, grown on compost containing mercury at concentrations of up to 0.2 mg/kg, with bioaccumulation factors reported from 65 to 140. Samples taken near a lead smelter in Czechoslovakia found mercury in mushroom species Lepista nuda and Lepiota rhacodes at 11.9 mg/kg and 6.5 mg/kg DW, respectively. Studies in plants show mercury concentrations in the roots may be significantly elevated, but that virtually no mercury is taken up from the soil into the shoots of plants such as peas. Corn and wheat plants fertilized for 24 years with sludge containing a mean mercury concentration of 3.3 mg/kg showed no increase in mercury levels in plant tissue.
3.2.7 Selenium
The following information on Factors 2 and 3 for selenium is summarized from the ATSDR Toxicological Profile for selenium (ATSDR, 2003). A second authoritative review was used to supplement the ATSDR information when needed (CCME, 2014). Selenium is a naturally occurring nonmetal element with multiple valence forms including Se-2, Se0, Se+4, and Se+6. ATSDR (2003) lists and reports chemical properties for selenium, hydrogen selenide selenic acid, selenious acid, sodium selenate, potassium selenate, sodium selenide, sodium selenite, selenium dioxide, selenium trioxide, selenocystine, selenomethione, selenium sulfide, and selenium disulfide. Selenium is found in soil and water due to natural and anthropogenic sources, and is typically found as the soluble forms of selenite (SeO3) and selenate (SeO4). The majority of selenium in the environment is the byproduct of coal and oil combustion, mining operations, and manufacturing. Selenium enters the water stream via sewage effluent, agricultural runoff, and
30
industrial waste water. Samples taken from the effluent of industrial sites found levels reaching 0.25 mg/L, and selenium concentrations as high as 0.28 mg/L have been reported for raw sewage, 0.045 mg/L for primary effluent, and 0.050 mg/L for secondary effluent. Background concentrations in different surface water types in Canada were reported to range from 0.001-0.4 μg/L, and it was noted that these concentrations were similar to global range of concentrations. The high end of these reported concentrations (up to 0.4 μg/L) were found at contaminated sites, such as near smelters. The occurrence of concentrations that exceeded these levels were in effluents from smelters, which contained up to 162 μg/L; however, lakes receiving these effluents had concentrations below 5 μg/L. Globally reported mean concentrations in groundwater were estimated at 0.2 μg/L. Selenium concentrations in sediments range from roughly 0.2-4 µg/g. Sediments in contaminated lakes can contain Selenium up to 62.2 µg/g, but are typically much lower. Selenium found in soils is primarily from the leaching and weathering of the parent bedrock material, estimated at 100,000-200,000 metric tons of selenium per year, with a smaller portion due to atmospheric deposition. Selenium content in soils can vary widely, and can depend on geographic properties of bedrock. The mean background soil concentrations identified in Canada were reported at 0.7 μg/g; however, concentrations in a contaminated site near a smelter averaged 177.2 μg/g. It was reported that the Great Plains in the U.S. have particularly high selenium soil concentrations. Selenium may be accumulated by plants under favorable soil conditions, depending on factors including soil type, pH, colloidal content, concentration of organic material, oxidation-reduction potentials in the root-soil environment, and total level of selenium in the soil. Soluble forms of selenium are found to be more easily taken up by plants, including Se4+, Se6+, with selenate most easily absorbed. Basic soil conditions (pH 7.5-8.5) allow for soluble selenate (principally sodium selenate), which comprises most of the naturally occurring accumulation of selenium by plants, and which is readily bioavailable to plants. Soil fertilization with lime and plant ash, which can raise the pH of the soil and favor the formation of selenate, is believed to be a contributing factor in the accumulation of selenium in crops. Under acidic conditions (soil pH 4.5-6.5), selenium in the form of selenate is found to bind to colloids as iron hydroxide selenium complexes, and to be unavailable for plant uptake. Several species of grasses and herbaceous plants have been shown to accumulate selenium. Primary accumulators include Astragalus, Oonopsis, Stanelya, Xylorhiza, and Machaeranthera, which can contain 20-100,000 mg/kg of plant tissue DW. Secondary accumulators include Astor, Gatierreaia, Atriplex, Grindelia, Castillaja, and Comandra, which can contain 25-100 mg/kg of
31
plant tissue DW. Non-accumulating plants generally contain less than 25 mg of selenium/kg of plant tissue DW. In a study of plants grown atop a soil-capped fly ash landfill site, instances of selenium uptake exceeding 5 mg/kg were reported.
4. Group 1 Results: Unfinished Wood, Bamboo, Beeswax
4.1 Unfinished Wood
We searched the literature for studies on measured concentrations of the seven elements in unfinished wood and trees. We found no studies reporting concentrations of any of the elements in wood (or tree trunks or tree rings) at levels above the solubility limits. Concentrations of arsenic were measured in tree branches above the solubility limit. In addition, we found concentrations of antimony, arsenic, cadmium, chromium, and mercury at levels above their respective solubility limits in various tissues or parts of trees. These studies demonstrate that these elements can be taken up by trees and potentially could be present in wood material.
4.1.1 Antimony
The ATSM F963-11, Standard Consumer Safety Specification for Toy Safety lists the solubility limit for antimony at 60 mg/kg (ppm). Screening of the literature search revealed at least 18 potentially relevant studies regarding antimony accumulation in wood or trees. We reviewed the available potentially relevant studies, starting with the most recent. We stopped after reviewing eight studies because we had identified evidence of antimony uptake in trees to above the solubility limit. These studies are described below. Information from the studies we reviewed with concentrations below the solubility limit is included in Section 2.1 of Appendix I. We located and reviewed studies (both naturally occurring and experimental) characterizing antimony uptake in the leaves, leaf litter, roots, trunk, branches, shoots, and pine needles of trees grown in natural settings and contaminated sites (see Table 2). In natural settings, accumulations were less than 1 mg/kg (Lehndorff and Schwark, 2008; Sardans and Penuelas, 2005; Tyler, 2005). Several studies were reviewed that investigated antimony uptake into trees grown on contaminated sites; two of these reported concentrations of antimony in tree roots, shoots, branches, or leaves above the solubility limit of 60 mg/kg. Concentrations of antimony in trees at levels above the solubility limit have been measured in studies sampling trees grown on mine
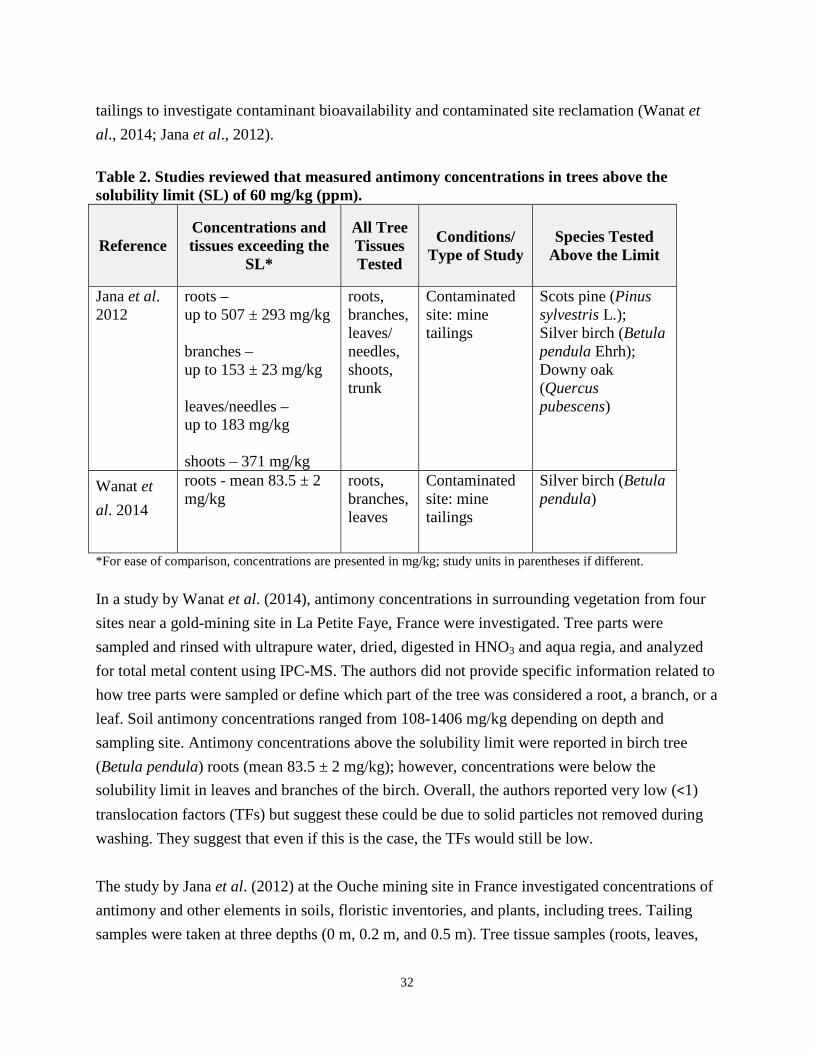
32
tailings to investigate contaminant bioavailability and contaminated site reclamation (Wanat et al., 2014; Jana et al., 2012). Table 2. Studies reviewed that measured antimony concentrations in trees above the solubility limit (SL) of 60 mg/kg (ppm).
Reference Concentrations and tissues exceeding the
SL*
All Tree Tissues Tested
Conditions/ Type of Study
Species Tested Above the Limit
Jana et al. 2012
roots – up to 507 ± 293 mg/kg branches – up to 153 ± 23 mg/kg leaves/needles – up to 183 mg/kg shoots – 371 mg/kg
roots, branches, leaves/ needles, shoots, trunk
Contaminated site: mine tailings
Scots pine (Pinus sylvestris L.); Silver birch (Betula pendula Ehrh); Downy oak (Quercus pubescens)
Wanat et al. 2014
roots - mean 83.5 ± 2 mg/kg
roots, branches, leaves
Contaminated site: mine tailings
Silver birch (Betula pendula)
*For ease of comparison, concentrations are presented in mg/kg; study units in parentheses if different.
In a study by Wanat et al. (2014), antimony concentrations in surrounding vegetation from four sites near a gold-mining site in La Petite Faye, France were investigated. Tree parts were sampled and rinsed with ultrapure water, dried, digested in HNO3 and aqua regia, and analyzed for total metal content using IPC-MS. The authors did not provide specific information related to how tree parts were sampled or define which part of the tree was considered a root, a branch, or a leaf. Soil antimony concentrations ranged from 108-1406 mg/kg depending on depth and sampling site. Antimony concentrations above the solubility limit were reported in birch tree (Betula pendula) roots (mean 83.5 ± 2 mg/kg); however, concentrations were below the solubility limit in leaves and branches of the birch. Overall, the authors reported very low (˂1) translocation factors (TFs) but suggest these could be due to solid particles not removed during washing. They suggest that even if this is the case, the TFs would still be low. The study by Jana et al. (2012) at the Ouche mining site in France investigated concentrations of antimony and other elements in soils, floristic inventories, and plants, including trees. Tailing samples were taken at three depths (0 m, 0.2 m, and 0.5 m). Tree tissue samples (roots, leaves,
33
branches, and trunks) were rinsed with deionized water (DI) prior to analysis, but the authors did not provide specific information related to how tree parts were sampled or define which part of the tree was considered a root, a branch, a trunk, or a leaf. Metalloid concentration was quantified using a graphite furnace atomic absorption spectrometer. Average antimony concentrations reported in all 16 tailings tested ranged from 2229-3246 mg/kg, with the highest mean levels reported at the 0 m depth of 3246 mg/kg (maximum reported 5780 mg/kg). Antimony concentrations above the solubility limit were reported in adult pine tree (Pinus sylvestris) roots (507 ± 293 mg/kg DW) and branches (153 ± 23 mg/kg DW); in birch tree (Betula pendula) roots (70 ± 31 mg/kg DW); and in downy oak tree (Quercus pubescens) roots (475 mg/kg DW; n = 1), shoots (371 mg/kg DW; n = 1), and leaves (183 mg/kg DW; n = 1). In most cases, tree trunks were nearly free of antimony, suggesting low translocation from the roots.
4.1.2 Arsenic
The ATSM F963-11, Standard Consumer Safety Specification for Toy Safety lists the solubility limit for arsenic at 25 mg/kg (ppm). Screening of the literature search revealed at least 50 potentially relevant studies regarding arsenic accumulation in wood or trees. We reviewed the available potentially relevant studies alphabetically by first author last name, starting from the letter “A.” We stopped after reviewing six studies because we identified evidence of arsenic uptake in trees above the solubility limit. These studies are described below. Information from the studies we reviewed with concentrations below the solubility limit is included in Section 2.2, Appendix I. We located and reviewed studies from natural contaminated sites and experimental studies. These studies characterized arsenic uptake in the roots, shoots, leaves, stems, bark, and branches of trees. See Table 3. Several studies were found that investigated arsenic uptake into trees grown under experimental treatments; two reported concentrations of arsenic in tree roots and shoots above the solubility limit of 25 mg/kg. The first study identified with concentrations above the solubility limit was Castillo-Michael et al. (2011). A second study (Lopez et al., 2008) was identified because it was cited in the Castillo-Michael et al. paper. Because both of these studies were experimental studies, we continued to review studies in alphabetic order until we found a study showing uptake in a natural setting (Jana et al., 2012). Even though this study was conducted at a
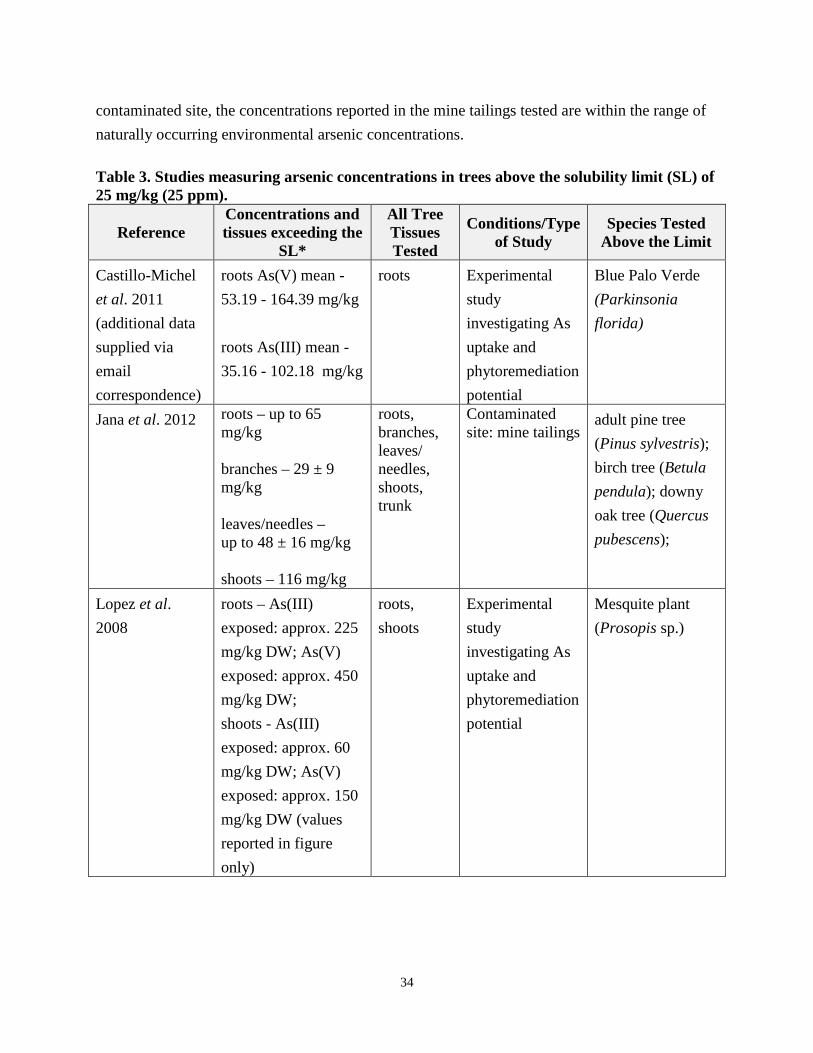
34
contaminated site, the concentrations reported in the mine tailings tested are within the range of naturally occurring environmental arsenic concentrations. Table 3. Studies measuring arsenic concentrations in trees above the solubility limit (SL) of 25 mg/kg (25 ppm).
Reference Concentrations and tissues exceeding the
SL*
All Tree Tissues Tested
Conditions/Type of Study
Species Tested Above the Limit
Castillo-Michel et al. 2011 (additional data supplied via email correspondence)
roots As(V) mean - 53.19 - 164.39 mg/kg roots As(III) mean - 35.16 - 102.18 mg/kg
roots Experimental study investigating As uptake and phytoremediation potential
Blue Palo Verde (Parkinsonia florida)
Jana et al. 2012 roots – up to 65 mg/kg branches – 29 ± 9 mg/kg leaves/needles – up to 48 ± 16 mg/kg shoots – 116 mg/kg
roots, branches, leaves/ needles, shoots, trunk
Contaminated site: mine tailings
adult pine tree (Pinus sylvestris); birch tree (Betula pendula); downy oak tree (Quercus pubescens);
Lopez et al. 2008
roots – As(III) exposed: approx. 225 mg/kg DW; As(V) exposed: approx. 450 mg/kg DW; shoots - As(III) exposed: approx. 60 mg/kg DW; As(V) exposed: approx. 150 mg/kg DW (values reported in figure only)
roots, shoots
Experimental study investigating As uptake and phytoremediation potential
Mesquite plant (Prosopis sp.)
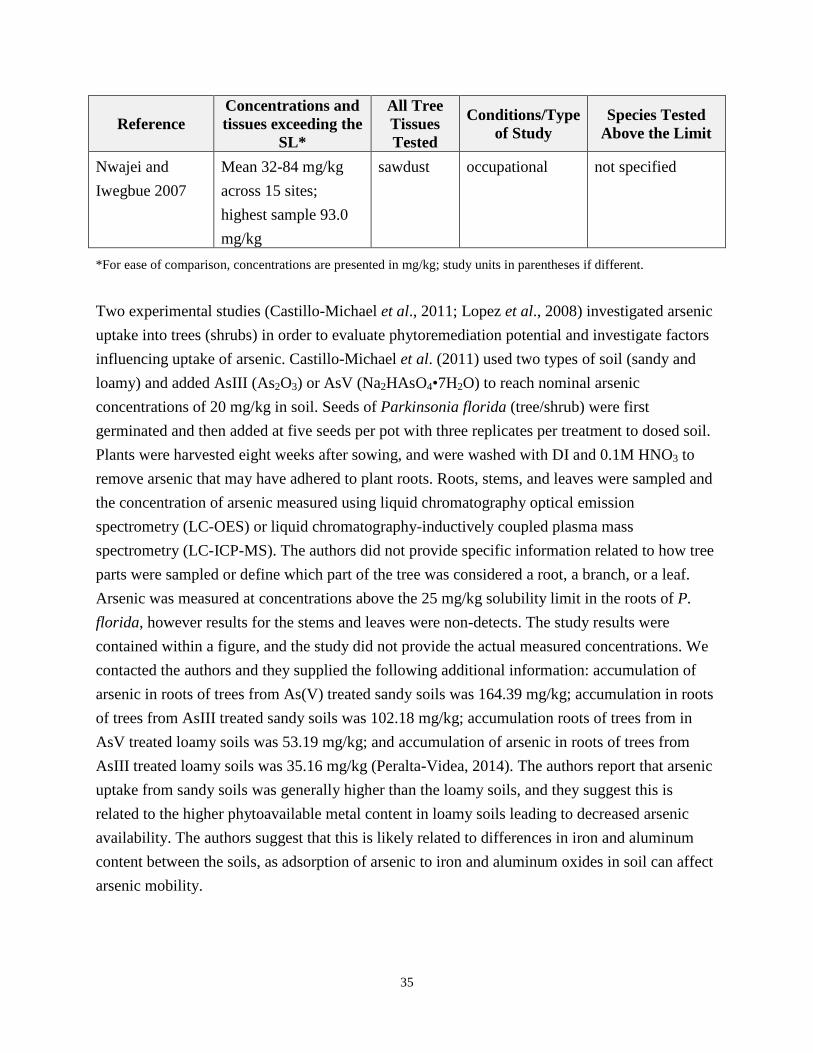
35
Reference Concentrations and tissues exceeding the
SL*
All Tree Tissues Tested
Conditions/Type of Study
Species Tested Above the Limit
Nwajei and Iwegbue 2007
Mean 32-84 mg/kg across 15 sites; highest sample 93.0 mg/kg
sawdust occupational not specified
*For ease of comparison, concentrations are presented in mg/kg; study units in parentheses if different.
Two experimental studies (Castillo-Michael et al., 2011; Lopez et al., 2008) investigated arsenic uptake into trees (shrubs) in order to evaluate phytoremediation potential and investigate factors influencing uptake of arsenic. Castillo-Michael et al. (2011) used two types of soil (sandy and loamy) and added AsIII (As2O3) or AsV (Na2HAsO4•7H2O) to reach nominal arsenic concentrations of 20 mg/kg in soil. Seeds of Parkinsonia florida (tree/shrub) were first germinated and then added at five seeds per pot with three replicates per treatment to dosed soil. Plants were harvested eight weeks after sowing, and were washed with DI and 0.1M HNO3 to remove arsenic that may have adhered to plant roots. Roots, stems, and leaves were sampled and the concentration of arsenic measured using liquid chromatography optical emission spectrometry (LC-OES) or liquid chromatography-inductively coupled plasma mass spectrometry (LC-ICP-MS). The authors did not provide specific information related to how tree parts were sampled or define which part of the tree was considered a root, a branch, or a leaf. Arsenic was measured at concentrations above the 25 mg/kg solubility limit in the roots of P. florida, however results for the stems and leaves were non-detects. The study results were contained within a figure, and the study did not provide the actual measured concentrations. We contacted the authors and they supplied the following additional information: accumulation of arsenic in roots of trees from As(V) treated sandy soils was 164.39 mg/kg; accumulation in roots of trees from AsIII treated sandy soils was 102.18 mg/kg; accumulation roots of trees from in AsV treated loamy soils was 53.19 mg/kg; and accumulation of arsenic in roots of trees from AsIII treated loamy soils was 35.16 mg/kg (Peralta-Videa, 2014). The authors report that arsenic uptake from sandy soils was generally higher than the loamy soils, and they suggest this is related to the higher phytoavailable metal content in loamy soils leading to decreased arsenic availability. The authors suggest that this is likely related to differences in iron and aluminum content between the soils, as adsorption of arsenic to iron and aluminum oxides in soil can affect arsenic mobility.
36
Lopez et al. (2008) added arsenite (AsIII) from As2O3 or arsenate (AsV) from Na2HAsO4•7H2O to soils at 30 mg/kg and 50 mg/kg, respectively. Twenty-five seeds of Prosopis juliflora (a mesquite shrub/tree) were added to each pot, with three replicate pots per treatment. One month after germination, additional treatments hypothesized to impact arsenic uptake were added for other study objectives (not described here), with water used as a control (along with a universal control of no arsenic in the soil). Plants were harvested 15 days after additional treatment. Soil was washed from plant roots with deionized (DI) water and rinsed with 0.01M HNO3 to remove elements adhered to the roots. Arsenic uptake in plants was tested using LC-ICP-MS or inductively coupled plasma optical emission spectrometry (ICP-OES). Results indicated no visible signs of toxicity in any plant treatment group at any arsenic concentration, and concentrations of arsenic uptake in roots and shoots were reported. The authors did not provide specific information related to how tree parts were sampled or define which part of the tree was considered a root or a shoot. For our objectives, only the reported concentrations in the control watered plants are of relevance, as other treatments contained compounds expected to modify arsenic uptake. The reported arsenic concentration measured in roots exposed to AsIII was roughly 225 mg/kg DW and in shoots was roughly 60 mg/kg DW (data reported in figure only). The reported arsenic concentration in roots exposed to AsV was roughly 450 mg/kg DW and in shoots was roughly 150 mg/kg DW (data reported in figure only). Concentrations of arsenic in trees at levels above the solubility limit have also been measured in a study sampling trees growing on mine tailings. The study by Jana et al. (2012) at the Ouche mining site in France investigated concentrations of antimony and other elements in soils, floristic inventories, and plants, including trees. See Section 8.1 - antimony concentrations in wood above for a more detailed description of the study methods. Average arsenic concentrations reported in all 16 tailing areas tested were 578 mg/kg, with the highest mean levels reported at the 0.5 m depth of 641 mg/kg (maximum reported 852 mg/kg). Arsenic concentrations above the solubility limit were reported in adult pine tree (Pinus sylvestris) roots (63 ± 22 mg/kg DW) and branches (29 ± 9 mg/kg DW); in birch tree (Betula pendula) roots (41 ± 17 mg/kg DW); and in downy oak tree (Quercus pubescens) roots (65 mg/kg DW; n = 1), shoots (116 mg/kg DW; n = 1), and leaves (48 ± 16 mg/kg DW; n = 1). In the two tested cases, tree trunks contained only trace levels of arsenic (levels well below the solubility limit), and the authors suggested that most arsenic accumulation was in the roots with low translocation. In addition to the studies of arsenic uptake in trees, we located a study from Nigeria that measured levels of arsenic (as well as cadmium, lead, barium, chromium, and mercury) in sawdust sampled from 15 sawmill locations in Sapele metropolis (Nwajei and Iwegbue, 2007).
37
Because of the paucity of data identified of concentrations of elements in wood itself, we thought this study worth including. Samples were dried and digested in nitric and perchloric acids, and element concentrations were determined using atomic absorption spectrophotometry. The highest arsenic concentration measured was 93.0 mg/kg (mean 32.0-84.0). The authors did not specify what types of trees or wood were processed at the sawmills, but noted that a major industry in the study area is Africa Timber Plywood Industry and mentioned several of the elements (i.e., arsenic, chromium) are used as wood preservatives. Therefore, it is not certain what these sawmills were processing and whether the concentrations measured in these studies represent what is found in natural wood.
4.1.3 Barium
The ATSM F963-11, Standard Consumer Safety Specification for Toy Safety lists the solubility limit for barium at 1000 mg/kg (ppm). Screening of the literature search revealed at least 13 potentially relevant studies regarding barium accumulation in wood or trees. We determined that six of these studies were relevant to this research and we reviewed all six. These studies measured barium (in leaves, leaf litter, wood, and sawdust) and the highest concentration reported was 167 mg/kg; none of the studies we reviewed reported concentrations of barium in tree tissues or wood at levels above the solubility limit. Information from these studies is included in Section 2.3 of Appendix I.
4.1.4 Cadmium
The ATSM F963-11, Standard Consumer Safety Specification for Toy Safety lists the solubility limit for cadmium at 75 mg/kg (ppm). Screening of the literature search revealed at least 37 potentially relevant studies regarding cadmium accumulation in wood or trees. We reviewed the potentially relevant studies alphabetically by first author last name, starting from the letter “A.” We stopped after reviewing 17 studies because we identified evidence of cadmium uptake in trees above the solubility limit. These studies are described below (and see Table 4). Information from the studies we reviewed with concentrations below the solubility limit is included in Section 2.4, Appendix I. Several studies were located that measured concentrations of cadmium in wood in experimental and contaminated soil settings. Algreen et al. (2012, 2014) measured concentrations in wood (tree core samples at a stem height of 1 m, with the outer centimeter containing the bark and the phloem discarded) of several species and reported concentration of cadmium up to 0.66 mg /kg
38
(2012) and 4.75 mg/kg (2014). Evangelou et al. (2013) reported concentrations as high as 15.4 ± 6.5 mg/kg in wood in an experimental study with poplars. We located and reviewed studies of naturally occurring uptake from contaminated sites and experimental studies characterizing cadmium uptake in other parts of trees, including the roots, leaves, bark, and branches of trees under natural, experimental, and contaminated conditions. Several of these identified cadmium concentrations above the solubility limit. In a study designed to investigate the removal of cadmium ions from aqueous solutions by biosorption, Al-Masri et al. (2010) collected branches and leaves from poplar trees grown near Damascus city and reported concentrations of up to 627 ± 29 mg/kg. However, no additional details were presented, as characterization of cadmium in the materials was not the focus of this study. Evangelou et al. (2012) sampled various plant tissues (leaves, wood, and bark) of three tree species adult willow (Salix sp.), poplar (Populus sp.), and birch (Betula pendula) that had grown in trace element contaminated soils at four locations (soil Cd levels ranging from 0.8 - 69.3 mg/kg). Wood and bark samples were taken at 1.5 m above ground and leaves were randomly collected. Tree tissue samples were washed with tap and deionized water, dried, and ground with a Retsch ZM-200 centrifugal titanium mill. Ground samples were then digested in HNO3 and analyzed for cadmium concentration using ICP-OES. The reported concentrations of cadmium in wood and bark samples were below the solubility limit. However, the authors observed at least one cadmium concentration in the leaves of Populus Sp. up to 80 mg/kg. Harada (2010) reported cadmium accumulation willow trees (S. integra and S. gilgiana) hydroponically treated with 25 µM Cd for 4 weeks. Tissues harvested were root, stem bark, stem wood, and current stem and leaf parts. The authors did not provide specific information related to how tree parts were sampled or define which part of the tree was considered the root, stem bark, or stem wood. After sample harvesting, roots were washed with 10 mM CaCl2 and with distilled water to remove adhered cadmium. Samples were then dried and digested in H2O2 and HNO3, and Cd concentration was measured using inductively coupled plasma atomic emission spectrometry (ICP-AES). Harada (2010) showed uptake in both species and in multiple tissues above the solubility limit, however the values are reported in a figure only. Values reported include stem bark at ~450 mg/kg; stem wood at up to ~75 mg/kg; shoot stem at up to ~250 mg/kg; and leaf stem at up to ~150 mg/kg.
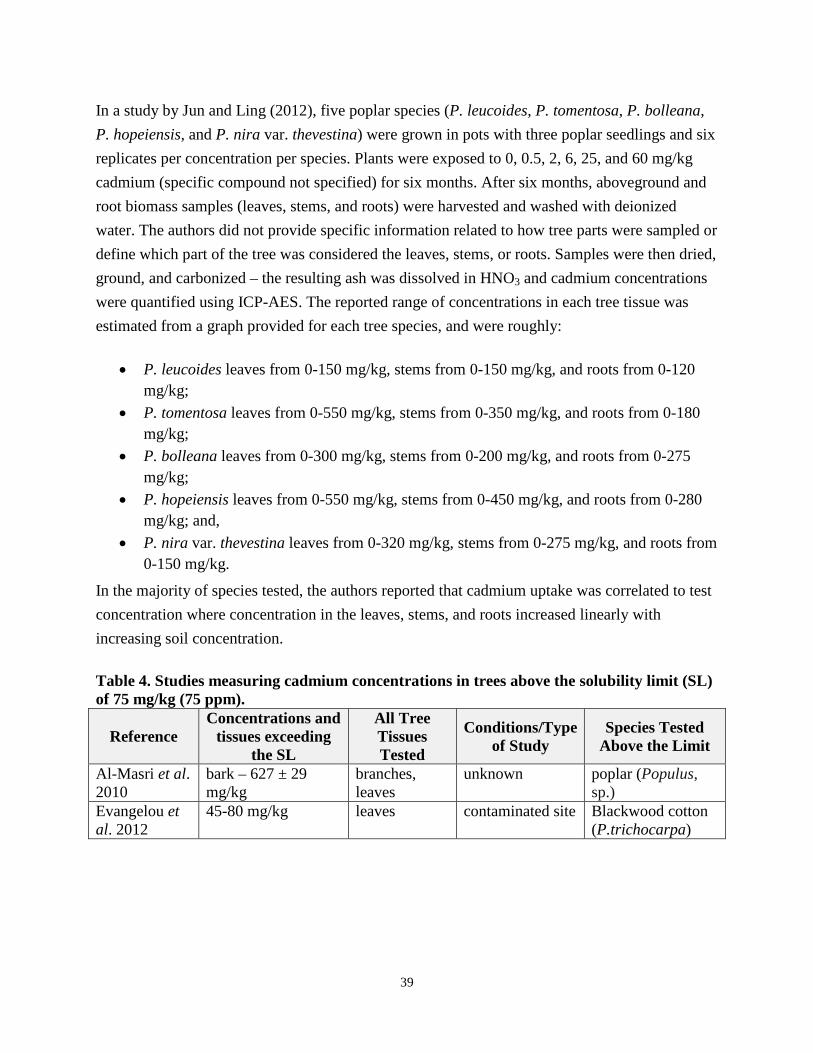
39
In a study by Jun and Ling (2012), five poplar species (P. leucoides, P. tomentosa, P. bolleana, P. hopeiensis, and P. nira var. thevestina) were grown in pots with three poplar seedlings and six replicates per concentration per species. Plants were exposed to 0, 0.5, 2, 6, 25, and 60 mg/kg cadmium (specific compound not specified) for six months. After six months, aboveground and root biomass samples (leaves, stems, and roots) were harvested and washed with deionized water. The authors did not provide specific information related to how tree parts were sampled or define which part of the tree was considered the leaves, stems, or roots. Samples were then dried, ground, and carbonized – the resulting ash was dissolved in HNO3 and cadmium concentrations were quantified using ICP-AES. The reported range of concentrations in each tree tissue was estimated from a graph provided for each tree species, and were roughly:
• P. leucoides leaves from 0-150 mg/kg, stems from 0-150 mg/kg, and roots from 0-120 mg/kg;
• P. tomentosa leaves from 0-550 mg/kg, stems from 0-350 mg/kg, and roots from 0-180 mg/kg;
• P. bolleana leaves from 0-300 mg/kg, stems from 0-200 mg/kg, and roots from 0-275 mg/kg;
• P. hopeiensis leaves from 0-550 mg/kg, stems from 0-450 mg/kg, and roots from 0-280 mg/kg; and,
• P. nira var. thevestina leaves from 0-320 mg/kg, stems from 0-275 mg/kg, and roots from 0-150 mg/kg.
In the majority of species tested, the authors reported that cadmium uptake was correlated to test concentration where concentration in the leaves, stems, and roots increased linearly with increasing soil concentration. Table 4. Studies measuring cadmium concentrations in trees above the solubility limit (SL) of 75 mg/kg (75 ppm).
Reference Concentrations and
tissues exceeding the SL
All Tree Tissues Tested
Conditions/Type of Study
Species Tested Above the Limit
Al-Masri et al. 2010
bark – 627 ± 29 mg/kg
branches, leaves
unknown poplar (Populus, sp.)
Evangelou et al. 2012
45-80 mg/kg leaves contaminated site Blackwood cotton (P.trichocarpa)
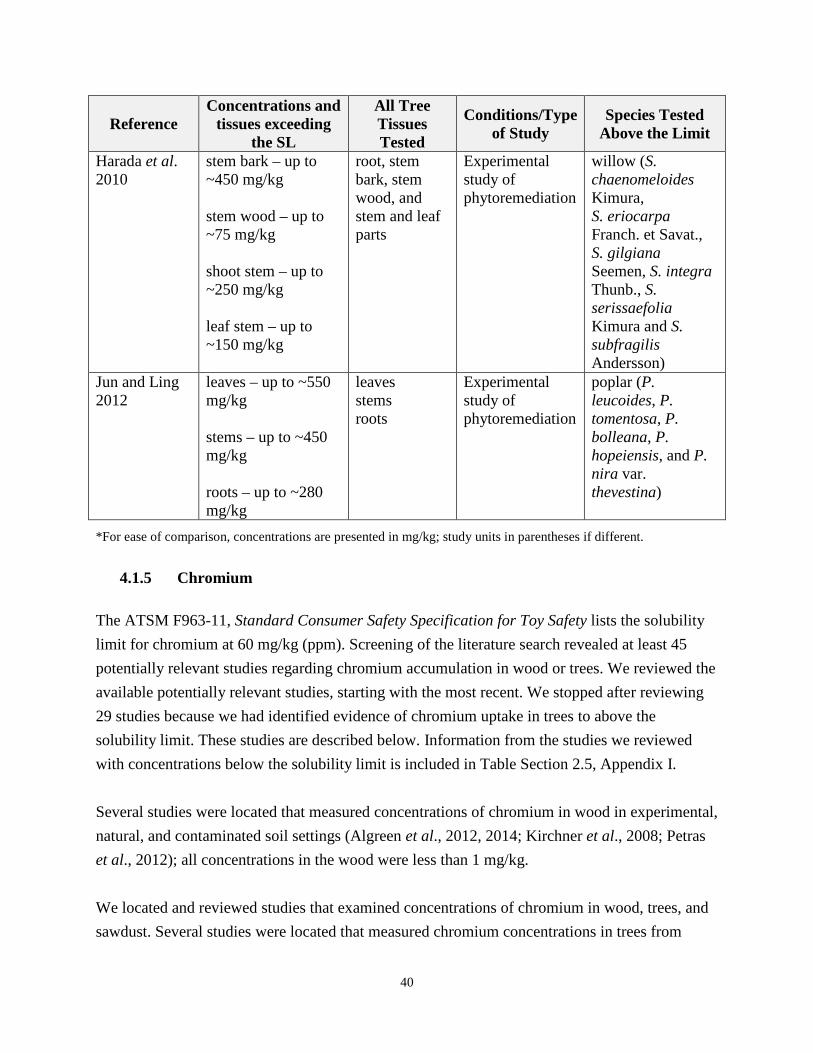
40
Reference Concentrations and
tissues exceeding the SL
All Tree Tissues Tested
Conditions/Type of Study
Species Tested Above the Limit
Harada et al. 2010
stem bark – up to ~450 mg/kg stem wood – up to ~75 mg/kg shoot stem – up to ~250 mg/kg leaf stem – up to ~150 mg/kg
root, stem bark, stem wood, and stem and leaf parts
Experimental study of phytoremediation
willow (S. chaenomeloides Kimura, S. eriocarpa Franch. et Savat., S. gilgiana Seemen, S. integra Thunb., S. serissaefolia Kimura and S. subfragilis Andersson)
Jun and Ling 2012
leaves – up to ~550 mg/kg stems – up to ~450 mg/kg roots – up to ~280 mg/kg
leaves stems roots
Experimental study of phytoremediation
poplar (P. leucoides, P. tomentosa, P. bolleana, P. hopeiensis, and P. nira var. thevestina)
*For ease of comparison, concentrations are presented in mg/kg; study units in parentheses if different.
4.1.5 Chromium
The ATSM F963-11, Standard Consumer Safety Specification for Toy Safety lists the solubility limit for chromium at 60 mg/kg (ppm). Screening of the literature search revealed at least 45 potentially relevant studies regarding chromium accumulation in wood or trees. We reviewed the available potentially relevant studies, starting with the most recent. We stopped after reviewing 29 studies because we had identified evidence of chromium uptake in trees to above the solubility limit. These studies are described below. Information from the studies we reviewed with concentrations below the solubility limit is included in Table Section 2.5, Appendix I. Several studies were located that measured concentrations of chromium in wood in experimental, natural, and contaminated soil settings (Algreen et al., 2012, 2014; Kirchner et al., 2008; Petras et al., 2012); all concentrations in the wood were less than 1 mg/kg. We located and reviewed studies that examined concentrations of chromium in wood, trees, and sawdust. Several studies were located that measured chromium concentrations in trees from
41
experiments and evaluations of naturally occurring and contaminated site investigations. They evaluated chromium concentrations in the roots, shoots, leaves, bark, trunks, limbs, and fruits of trees. Multiple studies were reviewed that demonstrated chromium uptake in tree parts, particularly roots, at levels exceeding the solubility limit of 60 mg/kg. Below we summarize information on four studies (Pulford et al., 2001; Kumar et al., 2014; Sedumedi et al., 2009; Shanker et al., 2005) that measured concentrations of chromium in tree roots, shoots, and bark that exceeded the ASTM solubility limit of 60 mg/kg (see Table 5). These studies investigated chromium phytoaccumulation and concentration in trees in order to investigate phytoremediation potential and/or chromium exposure and speciation. While these studies involved trees grown in contaminated soils and focused on experimental uptake, they demonstrate the potential for chromium to be taken up by trees. Pulford et al. (2001) investigated chromium uptake in three experiments: at a chromite contaminated processing waste site, at a sewage disposal site, and hydroponically. At the chromite contaminated processing waste site leaves, wood, roots, and bark were sampled from naturally colonized birch trees (Betula pendula). Leaves, wood, and bark were sampled from tree heights 4m above and 1–2m above ground, while roots were exposed by hand digging in the soil (leaving the main root bowl of the chosen tree). Root tissue was washed with tap water (followed by an ultrasonic bath) and dried for analysis. Fine roots were found to accumulate up to 157 mg/kg of chromium (large roots up to 43 mg/kg). All other tissues tested from that site were below the detection limit. A second experiment measured chromium uptake in 20 varieties of willow (Salix spp.) that were experimentally grown on a sewage disposal site for up to two years. Wood and bark only were sampled, with trees cut by hand and stems divided into wood and bark tissue. Plant tissues were digested in nitric acid and chromium was measured using flame atomic absorption. Tree bark was found to accumulate as much as 63 mg/kg chromium, while concentrations in wood were below the detection limit. The authors concluded that chromium was taken up poorly in the aerial portion of the trees at these two sites. While aerial was not defined by the authors, it is assumed to be all above-ground parts, which excludes the roots found below ground. They also noted that after two years, the varieties that had the highest uptake in bark had severe reduction in biomass or were killed off. Additionally, Pulford et al. (2001) tested a number of tree species grown hydroponically for their ability to take up chromium. Roots were grown in hydroponic solutions containing 10 mg/L K2Cr2O7. Leaves, shoots, and roots were sampled after 3-4 weeks for chromium uptake using the methods above. In a second hydroponic experiment, two willow species (Salix burjatica and S. viminalis) were exposed to 10 µM CrCl3 and sampled after six weeks. Following digestion in nitric acid, chromium was measured using atomic absorption spectroscopy. In both hydroponic experiments,
42
concentrations of chromium were reported above the solubility limit in roots only, ranging from 610 mg/kg to 3600 mg/kg depending on variety. All other tissues tested had concentrations either below the solubility limit or below the limit of detection. The authors suggest that chromium is poorly translocated from the roots. Sedumedi et al. (2009) sampled bark from trees located near a ferrochrome smelter. In this study, tree bark from sweet thorn trees (Acacia Karoo Hyne) was sampled and digested in concentrated HNO3, HF, and HCl. Tree bark samples were collected as an outer rough peeling of 100 g at a height of 1.5-1.8 m aboveground. Total chromium was measured using an atomic absorption spectrometer. Total chromium in bark was reported at 6022 ± 220 mg/kg for unwashed samples and 5965 ± 195 mg/kg in washed samples. Kumar et al. (2014) tested seeds of (Barringtonia acutangula Gaerth) trees that were germinated for 28 days, transferred to pots, and grown for 21 days prior to treatment with chromium. Seedlings were exposed to 1.0, 2.0, 3.0, 4.0, and 5.0 mM CrVI treatments (as K2CrO4). Seedlings were harvested after seven days of exposure, washed with distilled water and divided into roots and shoots; tissues were digested in mixed acid (HNO3:HClO4; 85:15, v/v) and chromium concentrations were determined using ICP-AES. The authors did not specify specific information related to how tree parts were sampled or as to how they defined which part of the tree was considered the shoot or root. Chromium levels in the tree seedlings ranging from 751 – 2,703 mg/kg DW in roots and 50 – 1,101 mg/kg DW in shoots. These authors suggest that these trees may specifically store chromium in roots as a defense mechanism leading to low translocation to upper tree parts. Shanker et al. (2005) grew three-month old seedlings of oil cake tree (Albizia amara), Australian pine (Casuarina equisetifolia), teak (Tectona grandis), and white leadtree (Leucaena luecocephala) in pot experiments containing either CrIII (chromium sulfate - Cr2(SO4)3•2H2O) or CrVI (potassium dichromate - K2Cr2O7), with additional treatment modifiers for other study objectives (not described here). The authors did not specify specific information related to how tree parts were sampled or as to how they defined which part of the tree was considered the shoot or root. Chromium was shown to be taken up in the roots and shoots of all plant species from chromium treatments (without the additional modifiers). Concentrations in shoots neared and in some cases surpassed the solubility limit (T. grandis at 67.6 mg/kg for CrIII and 56.4 mg/kg for CrVI; and A. amara at 57.2 mg/kg for CrIII). Root concentrations were all well above the solubility limit for CrIII ranging from 425.2 - 599.6 mg/kg and for CrVI ranging from 344.3 – 451.9 mg/kg. The authors state that CrIII was accumulated in trees to significantly higher levels
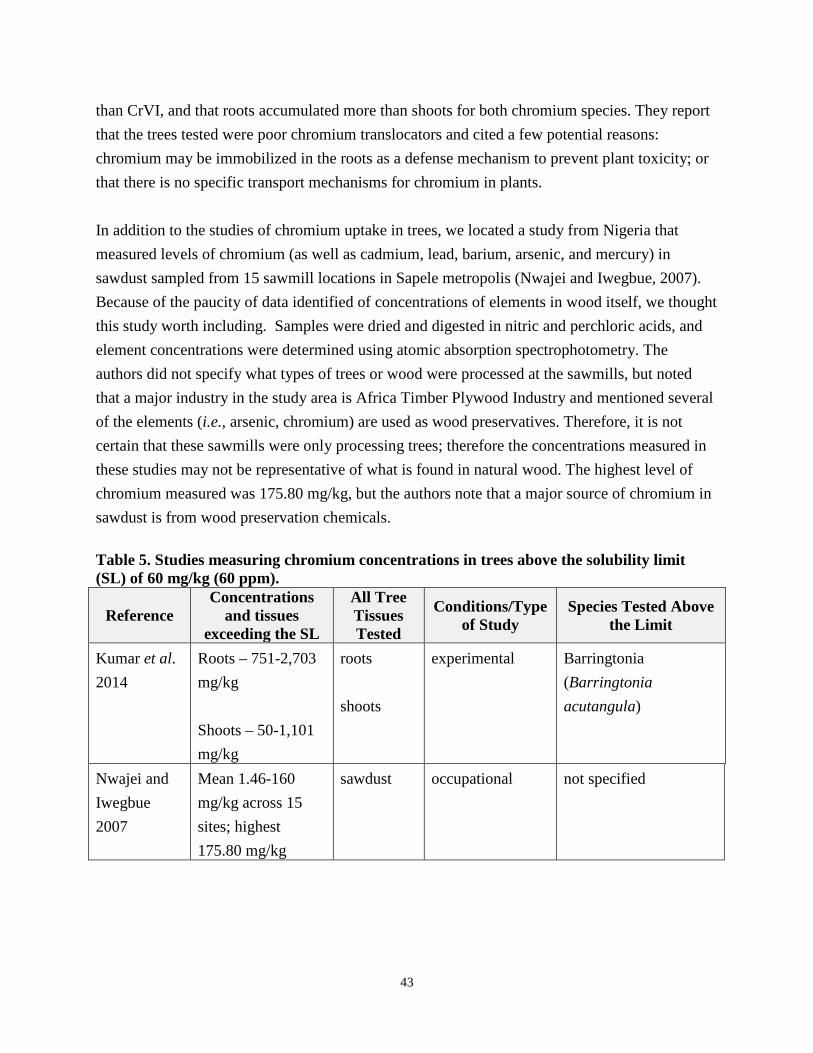
43
than CrVI, and that roots accumulated more than shoots for both chromium species. They report that the trees tested were poor chromium translocators and cited a few potential reasons: chromium may be immobilized in the roots as a defense mechanism to prevent plant toxicity; or that there is no specific transport mechanisms for chromium in plants. In addition to the studies of chromium uptake in trees, we located a study from Nigeria that measured levels of chromium (as well as cadmium, lead, barium, arsenic, and mercury) in sawdust sampled from 15 sawmill locations in Sapele metropolis (Nwajei and Iwegbue, 2007). Because of the paucity of data identified of concentrations of elements in wood itself, we thought this study worth including. Samples were dried and digested in nitric and perchloric acids, and element concentrations were determined using atomic absorption spectrophotometry. The authors did not specify what types of trees or wood were processed at the sawmills, but noted that a major industry in the study area is Africa Timber Plywood Industry and mentioned several of the elements (i.e., arsenic, chromium) are used as wood preservatives. Therefore, it is not certain that these sawmills were only processing trees; therefore the concentrations measured in these studies may not be representative of what is found in natural wood. The highest level of chromium measured was 175.80 mg/kg, but the authors note that a major source of chromium in sawdust is from wood preservation chemicals. Table 5. Studies measuring chromium concentrations in trees above the solubility limit (SL) of 60 mg/kg (60 ppm).
Reference Concentrations
and tissues exceeding the SL
All Tree Tissues Tested
Conditions/Type of Study
Species Tested Above the Limit
Kumar et al. 2014
Roots – 751-2,703 mg/kg Shoots – 50-1,101 mg/kg
roots shoots
experimental Barringtonia (Barringtonia acutangula)
Nwajei and Iwegbue 2007
Mean 1.46-160 mg/kg across 15 sites; highest 175.80 mg/kg
sawdust occupational not specified
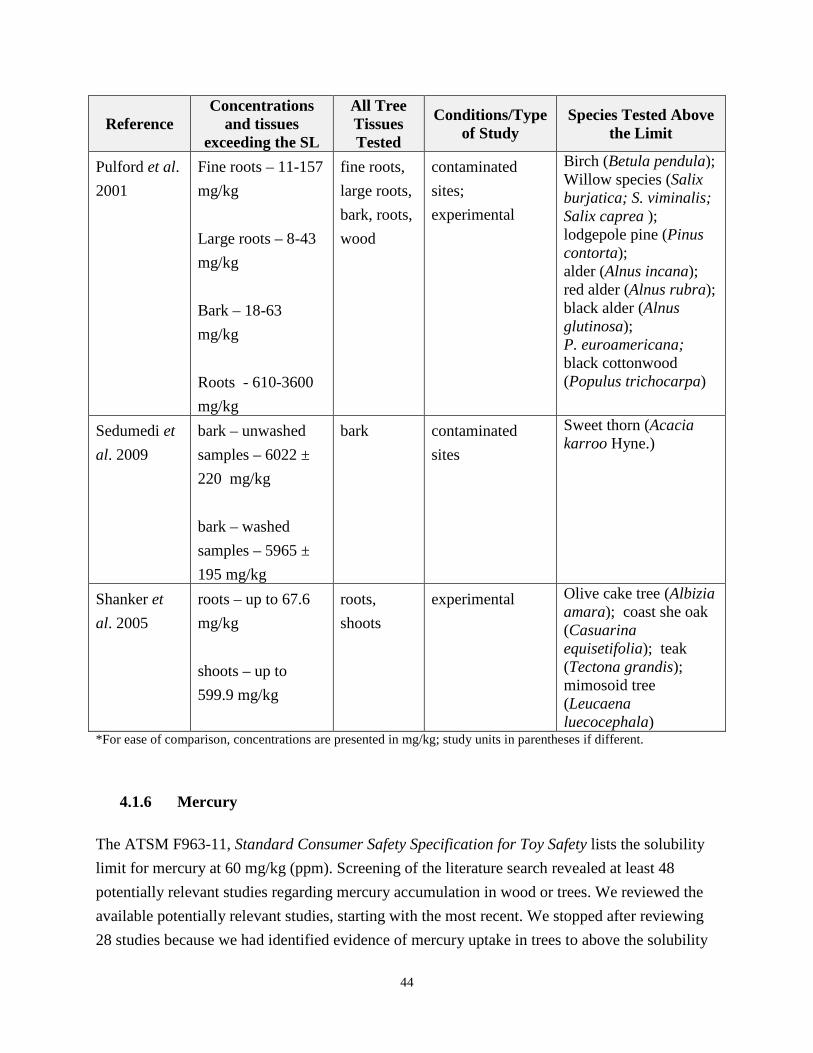
44
Reference Concentrations
and tissues exceeding the SL
All Tree Tissues Tested
Conditions/Type of Study
Species Tested Above the Limit
Pulford et al. 2001
Fine roots – 11-157 mg/kg Large roots – 8-43 mg/kg Bark – 18-63 mg/kg Roots - 610-3600 mg/kg
fine roots, large roots, bark, roots, wood
contaminated sites; experimental
Birch (Betula pendula); Willow species (Salix burjatica; S. viminalis; Salix caprea ); lodgepole pine (Pinus contorta); alder (Alnus incana); red alder (Alnus rubra); black alder (Alnus glutinosa); P. euroamericana; black cottonwood (Populus trichocarpa)
Sedumedi et al. 2009
bark – unwashed samples – 6022 ± 220 mg/kg bark – washed samples – 5965 ± 195 mg/kg
bark contaminated sites
Sweet thorn (Acacia karroo Hyne.)
Shanker et al. 2005
roots – up to 67.6 mg/kg shoots – up to 599.9 mg/kg
roots, shoots
experimental Olive cake tree (Albizia amara); coast she oak (Casuarina equisetifolia); teak (Tectona grandis); mimosoid tree (Leucaena luecocephala)
*For ease of comparison, concentrations are presented in mg/kg; study units in parentheses if different.
4.1.6 Mercury
The ATSM F963-11, Standard Consumer Safety Specification for Toy Safety lists the solubility limit for mercury at 60 mg/kg (ppm). Screening of the literature search revealed at least 48 potentially relevant studies regarding mercury accumulation in wood or trees. We reviewed the available potentially relevant studies, starting with the most recent. We stopped after reviewing 28 studies because we had identified evidence of mercury uptake in trees to above the solubility

45
limit. These studies are described below. Information from the studies we reviewed with concentrations below the solubility limit is included in Section 2.6 of Appendix I. We located and reviewed studies (both naturally occurring and experimental) characterizing mercury uptake in the roots, shoots, leaves, bark, trunks, limbs, fruits, branches, stems, and nuts of trees (see Table 6). Jean-Philippe et al. (2011a,b) investigated the effect and uptake of mercury in trees (these were two separate publications but they reported the same results). The authors tested American Sycamore (Platanus occidentalis) two month old seedlings in mercury contaminated soils at six seedlings per treatment and four replicates. Plants were treated with either mercuric nitrate (Hg(NO3)2), methyl mercury chloride (CH3HgCl), or both. Solutions were diluted to obtain final concentrations of 100 mg/kg. Roots and shoots were harvested after one month of exposure, rinsed in DI water, and frozen and ground in liquid nitrogen. Seedlings were harvested by cutting the base of the stem at the root/shoot interface. Final samples were analyzed for concentrations using cold vapor atomic absorption spectroscopy. Mercury was measured at concentrations above the solubility limit of 60 mg/kg in roots (638.5 - 3438 mg/kg) and in stem and leaf shoots (78.6 - 246 mg/kg) (Jean-Philippe et al. 2011a). It should be noted that while the study attempted to control for volatilization (using an air cooler), control plants also reported some mercury concentrations (from 1.0 - 17 mg/kg) which may have been due to deposition of volatilized mercury in the greenhouse setting. The authors suggest that translocation of mercury is minimal and that concentrations in the foliage are likely related to atmospheric deposition and/or soil volatilization of mercury (Jean-Philippe et al. 2011a). This same data are also reported in a subsequent publication by the same author group (Jean-Philippe et al. 2011b). In these studies, there was little evidence suggesting that mercury will be taken up in trees to levels above the solubility limits, even at contaminated sites. In the single experimental study we reviewed (Jean-Philippe et al., 2011a,b) it is possible that the chemical form or mode of dosing with elevated concentrations may have impacted uptake to allow for much higher levels.
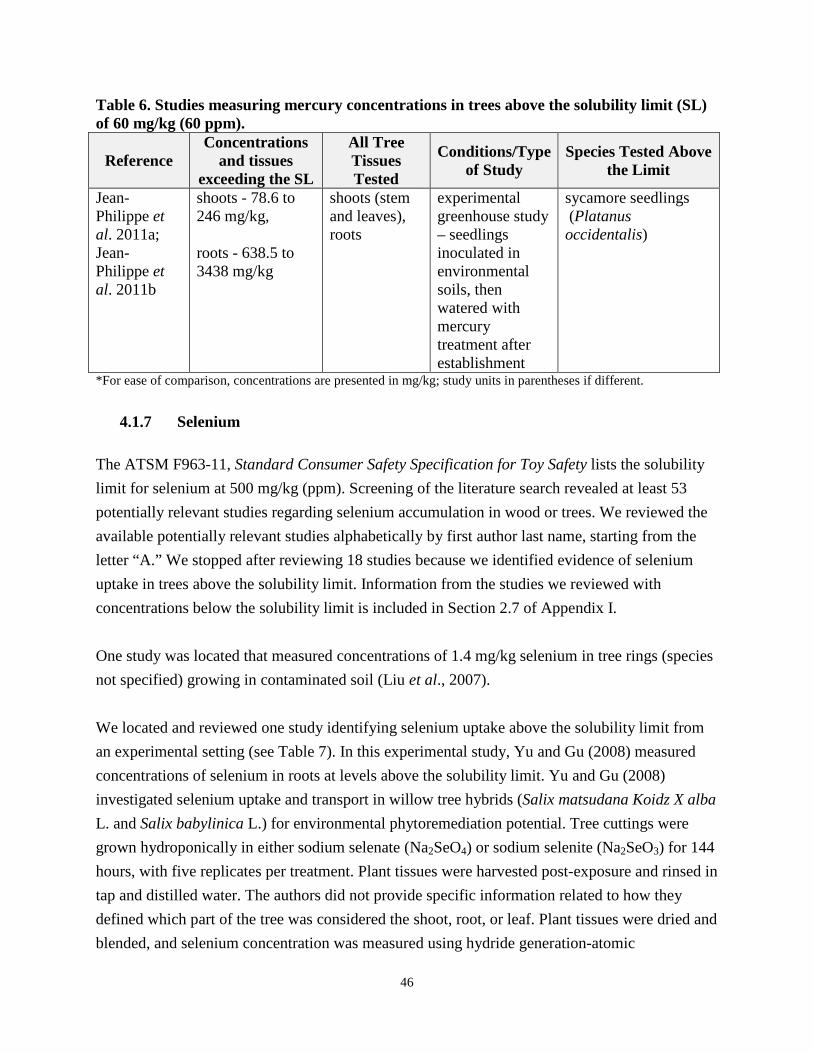
46
Table 6. Studies measuring mercury concentrations in trees above the solubility limit (SL) of 60 mg/kg (60 ppm).
Reference Concentrations
and tissues exceeding the SL
All Tree Tissues Tested
Conditions/Type of Study
Species Tested Above the Limit
Jean-Philippe et al. 2011a; Jean-Philippe et al. 2011b
shoots - 78.6 to 246 mg/kg, roots - 638.5 to 3438 mg/kg
shoots (stem and leaves), roots
experimental greenhouse study – seedlings inoculated in environmental soils, then watered with mercury treatment after establishment
sycamore seedlings (Platanus occidentalis)
*For ease of comparison, concentrations are presented in mg/kg; study units in parentheses if different.
4.1.7 Selenium
The ATSM F963-11, Standard Consumer Safety Specification for Toy Safety lists the solubility limit for selenium at 500 mg/kg (ppm). Screening of the literature search revealed at least 53 potentially relevant studies regarding selenium accumulation in wood or trees. We reviewed the available potentially relevant studies alphabetically by first author last name, starting from the letter “A.” We stopped after reviewing 18 studies because we identified evidence of selenium uptake in trees above the solubility limit. Information from the studies we reviewed with concentrations below the solubility limit is included in Section 2.7 of Appendix I. One study was located that measured concentrations of 1.4 mg/kg selenium in tree rings (species not specified) growing in contaminated soil (Liu et al., 2007). We located and reviewed one study identifying selenium uptake above the solubility limit from an experimental setting (see Table 7). In this experimental study, Yu and Gu (2008) measured concentrations of selenium in roots at levels above the solubility limit. Yu and Gu (2008) investigated selenium uptake and transport in willow tree hybrids (Salix matsudana Koidz X alba L. and Salix babylinica L.) for environmental phytoremediation potential. Tree cuttings were grown hydroponically in either sodium selenate (Na2SeO4) or sodium selenite (Na2SeO3) for 144 hours, with five replicates per treatment. Plant tissues were harvested post-exposure and rinsed in tap and distilled water. The authors did not provide specific information related to how they defined which part of the tree was considered the shoot, root, or leaf. Plant tissues were dried and blended, and selenium concentration was measured using hydride generation-atomic
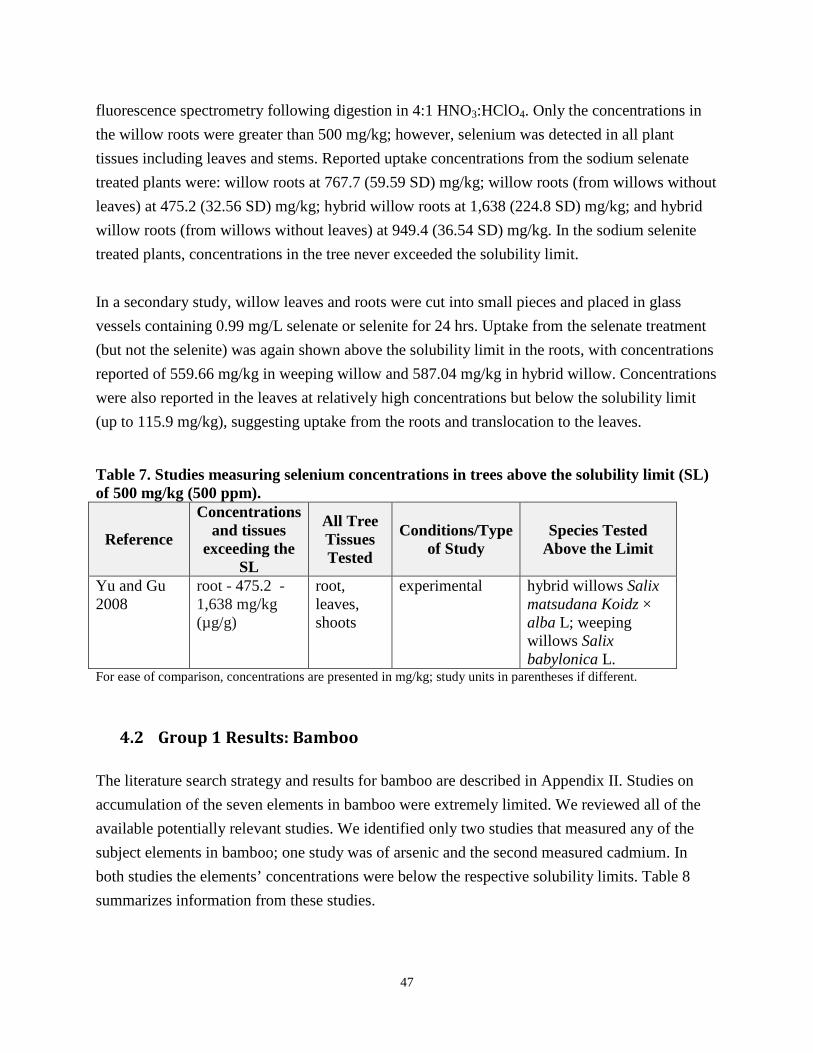
47
fluorescence spectrometry following digestion in 4:1 HNO3:HClO4. Only the concentrations in the willow roots were greater than 500 mg/kg; however, selenium was detected in all plant tissues including leaves and stems. Reported uptake concentrations from the sodium selenate treated plants were: willow roots at 767.7 (59.59 SD) mg/kg; willow roots (from willows without leaves) at 475.2 (32.56 SD) mg/kg; hybrid willow roots at 1,638 (224.8 SD) mg/kg; and hybrid willow roots (from willows without leaves) at 949.4 (36.54 SD) mg/kg. In the sodium selenite treated plants, concentrations in the tree never exceeded the solubility limit. In a secondary study, willow leaves and roots were cut into small pieces and placed in glass vessels containing 0.99 mg/L selenate or selenite for 24 hrs. Uptake from the selenate treatment (but not the selenite) was again shown above the solubility limit in the roots, with concentrations reported of 559.66 mg/kg in weeping willow and 587.04 mg/kg in hybrid willow. Concentrations were also reported in the leaves at relatively high concentrations but below the solubility limit (up to 115.9 mg/kg), suggesting uptake from the roots and translocation to the leaves.
Table 7. Studies measuring selenium concentrations in trees above the solubility limit (SL) of 500 mg/kg (500 ppm).
Reference
Concentrations and tissues
exceeding the SL
All Tree Tissues Tested
Conditions/Type of Study
Species Tested Above the Limit
Yu and Gu 2008
root - 475.2 - 1,638 mg/kg (µg/g)
root, leaves, shoots
experimental hybrid willows Salix matsudana Koidz × alba L; weeping willows Salix babylonica L.
For ease of comparison, concentrations are presented in mg/kg; study units in parentheses if different.
4.2 Group 1 Results: Bamboo
The literature search strategy and results for bamboo are described in Appendix II. Studies on accumulation of the seven elements in bamboo were extremely limited. We reviewed all of the available potentially relevant studies. We identified only two studies that measured any of the subject elements in bamboo; one study was of arsenic and the second measured cadmium. In both studies the elements’ concentrations were below the respective solubility limits. Table 8 summarizes information from these studies.
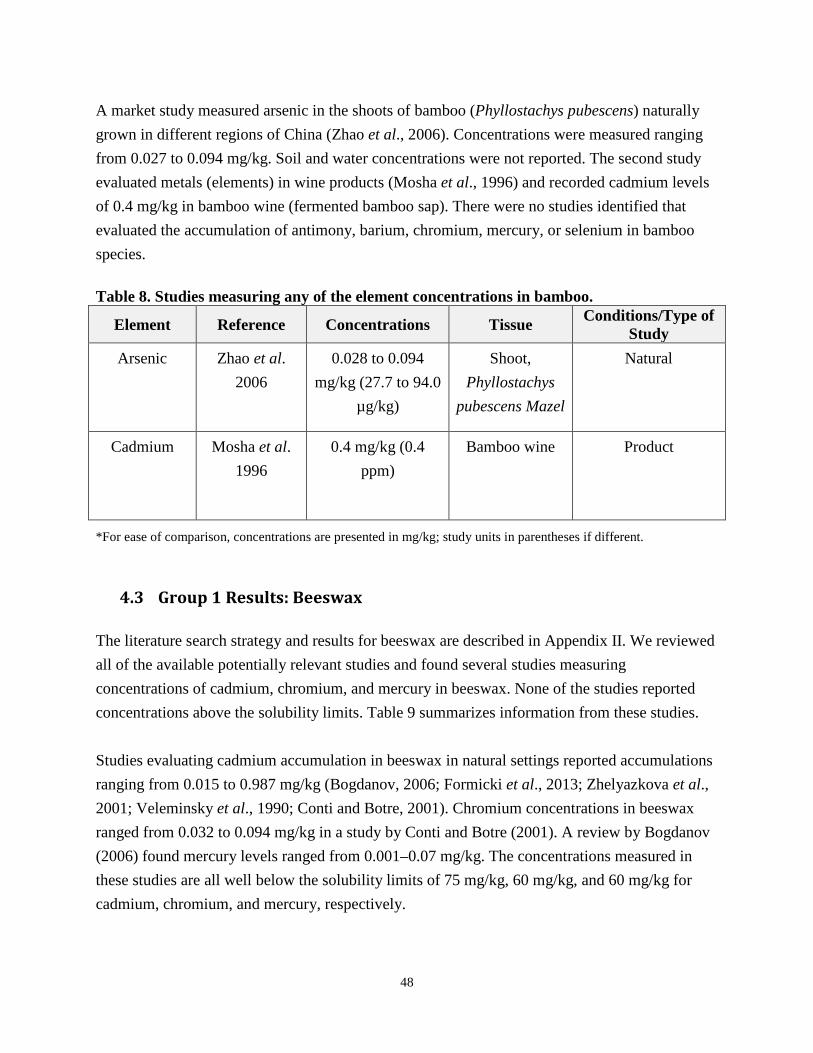
48
A market study measured arsenic in the shoots of bamboo (Phyllostachys pubescens) naturally grown in different regions of China (Zhao et al., 2006). Concentrations were measured ranging from 0.027 to 0.094 mg/kg. Soil and water concentrations were not reported. The second study evaluated metals (elements) in wine products (Mosha et al., 1996) and recorded cadmium levels of 0.4 mg/kg in bamboo wine (fermented bamboo sap). There were no studies identified that evaluated the accumulation of antimony, barium, chromium, mercury, or selenium in bamboo species. Table 8. Studies measuring any of the element concentrations in bamboo.
Element Reference Concentrations Tissue Conditions/Type of Study
Arsenic Zhao et al. 2006
0.028 to 0.094 mg/kg (27.7 to 94.0
µg/kg)
Shoot, Phyllostachys
pubescens Mazel
Natural
Cadmium Mosha et al. 1996
0.4 mg/kg (0.4 ppm)
Bamboo wine Product
*For ease of comparison, concentrations are presented in mg/kg; study units in parentheses if different.
4.3 Group 1 Results: Beeswax
The literature search strategy and results for beeswax are described in Appendix II. We reviewed all of the available potentially relevant studies and found several studies measuring concentrations of cadmium, chromium, and mercury in beeswax. None of the studies reported concentrations above the solubility limits. Table 9 summarizes information from these studies. Studies evaluating cadmium accumulation in beeswax in natural settings reported accumulations ranging from 0.015 to 0.987 mg/kg (Bogdanov, 2006; Formicki et al., 2013; Zhelyazkova et al., 2001; Veleminsky et al., 1990; Conti and Botre, 2001). Chromium concentrations in beeswax ranged from 0.032 to 0.094 mg/kg in a study by Conti and Botre (2001). A review by Bogdanov (2006) found mercury levels ranged from 0.001–0.07 mg/kg. The concentrations measured in these studies are all well below the solubility limits of 75 mg/kg, 60 mg/kg, and 60 mg/kg for cadmium, chromium, and mercury, respectively.
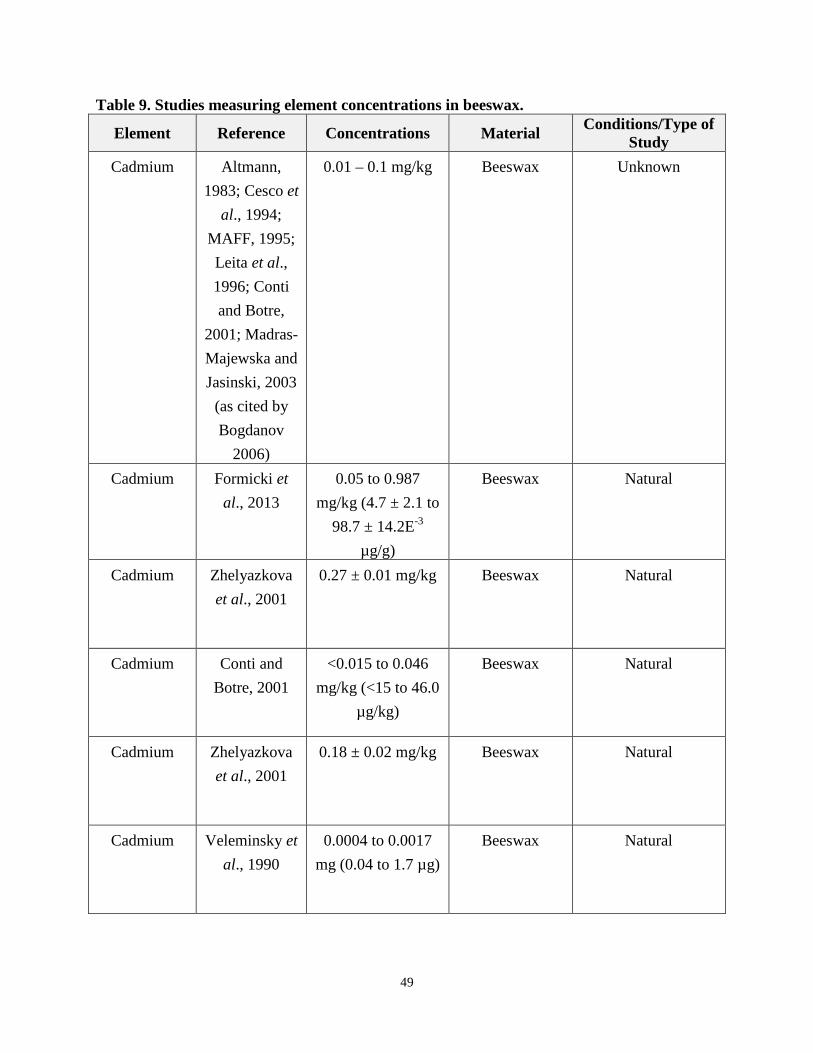
49
Table 9. Studies measuring element concentrations in beeswax.
Element Reference Concentrations Material Conditions/Type of Study
Cadmium Altmann, 1983; Cesco et
al., 1994; MAFF, 1995; Leita et al., 1996; Conti and Botre,
2001; Madras-Majewska and Jasinski, 2003
(as cited by Bogdanov
2006)
0.01 – 0.1 mg/kg Beeswax Unknown
Cadmium Formicki et al., 2013
0.05 to 0.987 mg/kg (4.7 ± 2.1 to
98.7 ± 14.2E-3 µg/g)
Beeswax Natural
Cadmium Zhelyazkova et al., 2001
0.27 ± 0.01 mg/kg Beeswax Natural
Cadmium Conti and Botre, 2001
<0.015 to 0.046 mg/kg (<15 to 46.0
µg/kg)
Beeswax Natural
Cadmium Zhelyazkova et al., 2001
0.18 ± 0.02 mg/kg Beeswax Natural
Cadmium Veleminsky et al., 1990
0.0004 to 0.0017 mg (0.04 to 1.7 µg)
Beeswax Natural
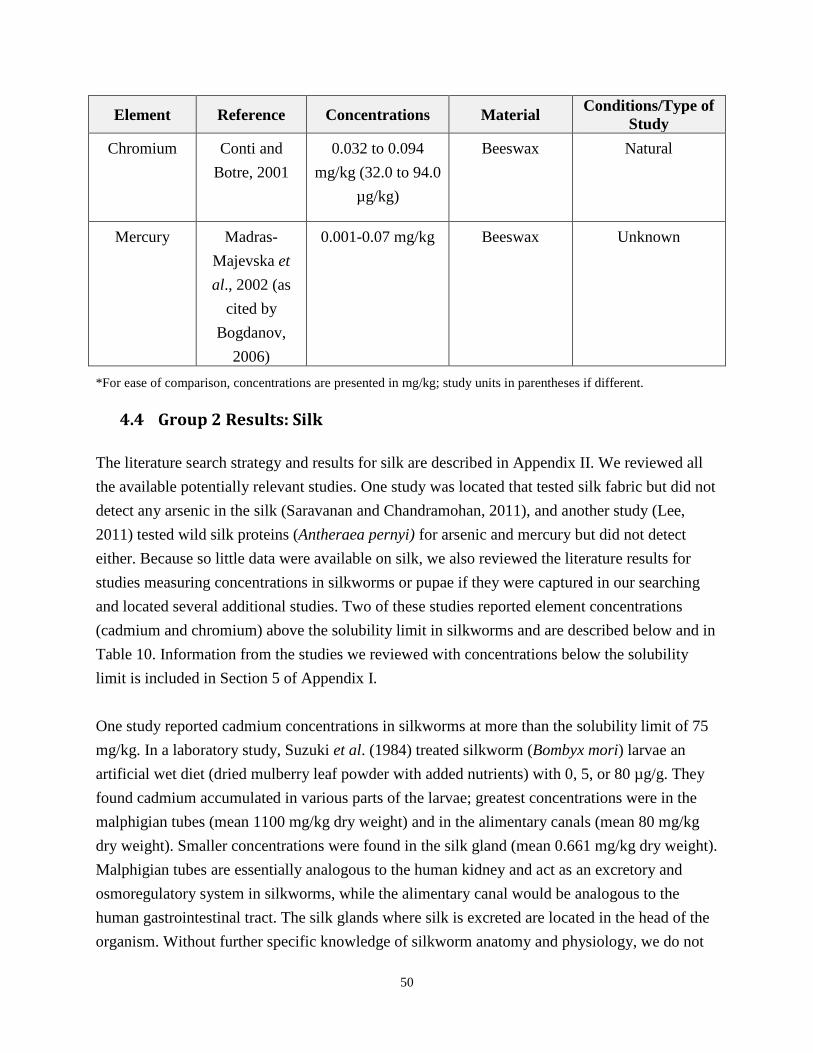
50
Element Reference Concentrations Material Conditions/Type of Study
Chromium Conti and Botre, 2001
0.032 to 0.094 mg/kg (32.0 to 94.0
µg/kg)
Beeswax Natural
Mercury Madras-Majevska et al., 2002 (as
cited by Bogdanov,
2006)
0.001-0.07 mg/kg Beeswax Unknown
*For ease of comparison, concentrations are presented in mg/kg; study units in parentheses if different.
4.4 Group 2 Results: Silk
The literature search strategy and results for silk are described in Appendix II. We reviewed all the available potentially relevant studies. One study was located that tested silk fabric but did not detect any arsenic in the silk (Saravanan and Chandramohan, 2011), and another study (Lee, 2011) tested wild silk proteins (Antheraea pernyi) for arsenic and mercury but did not detect either. Because so little data were available on silk, we also reviewed the literature results for studies measuring concentrations in silkworms or pupae if they were captured in our searching and located several additional studies. Two of these studies reported element concentrations (cadmium and chromium) above the solubility limit in silkworms and are described below and in Table 10. Information from the studies we reviewed with concentrations below the solubility limit is included in Section 5 of Appendix I. One study reported cadmium concentrations in silkworms at more than the solubility limit of 75 mg/kg. In a laboratory study, Suzuki et al. (1984) treated silkworm (Bombyx mori) larvae an artificial wet diet (dried mulberry leaf powder with added nutrients) with 0, 5, or 80 µg/g. They found cadmium accumulated in various parts of the larvae; greatest concentrations were in the malphigian tubes (mean 1100 mg/kg dry weight) and in the alimentary canals (mean 80 mg/kg dry weight). Smaller concentrations were found in the silk gland (mean 0.661 mg/kg dry weight). Malphigian tubes are essentially analogous to the human kidney and act as an excretory and osmoregulatory system in silkworms, while the alimentary canal would be analogous to the human gastrointestinal tract. The silk glands where silk is excreted are located in the head of the organism. Without further specific knowledge of silkworm anatomy and physiology, we do not
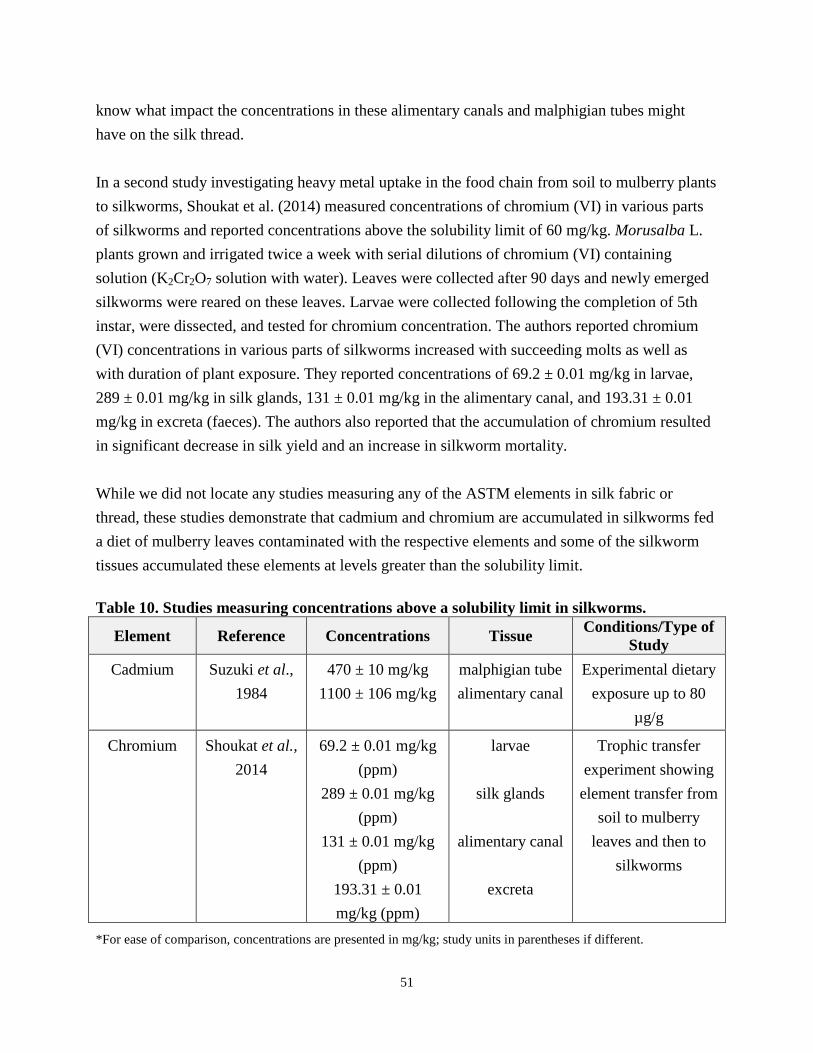
51
know what impact the concentrations in these alimentary canals and malphigian tubes might have on the silk thread. In a second study investigating heavy metal uptake in the food chain from soil to mulberry plants to silkworms, Shoukat et al. (2014) measured concentrations of chromium (VI) in various parts of silkworms and reported concentrations above the solubility limit of 60 mg/kg. Morusalba L. plants grown and irrigated twice a week with serial dilutions of chromium (VI) containing solution (K2Cr2O7 solution with water). Leaves were collected after 90 days and newly emerged silkworms were reared on these leaves. Larvae were collected following the completion of 5th instar, were dissected, and tested for chromium concentration. The authors reported chromium (VI) concentrations in various parts of silkworms increased with succeeding molts as well as with duration of plant exposure. They reported concentrations of 69.2 ± 0.01 mg/kg in larvae, 289 ± 0.01 mg/kg in silk glands, 131 ± 0.01 mg/kg in the alimentary canal, and 193.31 ± 0.01 mg/kg in excreta (faeces). The authors also reported that the accumulation of chromium resulted in significant decrease in silk yield and an increase in silkworm mortality. While we did not locate any studies measuring any of the ASTM elements in silk fabric or thread, these studies demonstrate that cadmium and chromium are accumulated in silkworms fed a diet of mulberry leaves contaminated with the respective elements and some of the silkworm tissues accumulated these elements at levels greater than the solubility limit. Table 10. Studies measuring concentrations above a solubility limit in silkworms.
Element Reference Concentrations Tissue Conditions/Type of Study
Cadmium Suzuki et al., 1984
470 ± 10 mg/kg 1100 ± 106 mg/kg
malphigian tube alimentary canal
Experimental dietary exposure up to 80
µg/g
Chromium Shoukat et al., 2014
69.2 ± 0.01 mg/kg (ppm)
289 ± 0.01 mg/kg (ppm)
131 ± 0.01 mg/kg (ppm)
193.31 ± 0.01 mg/kg (ppm)
larvae
silk glands
alimentary canal
excreta
Trophic transfer experiment showing
element transfer from soil to mulberry
leaves and then to silkworms
*For ease of comparison, concentrations are presented in mg/kg; study units in parentheses if different.
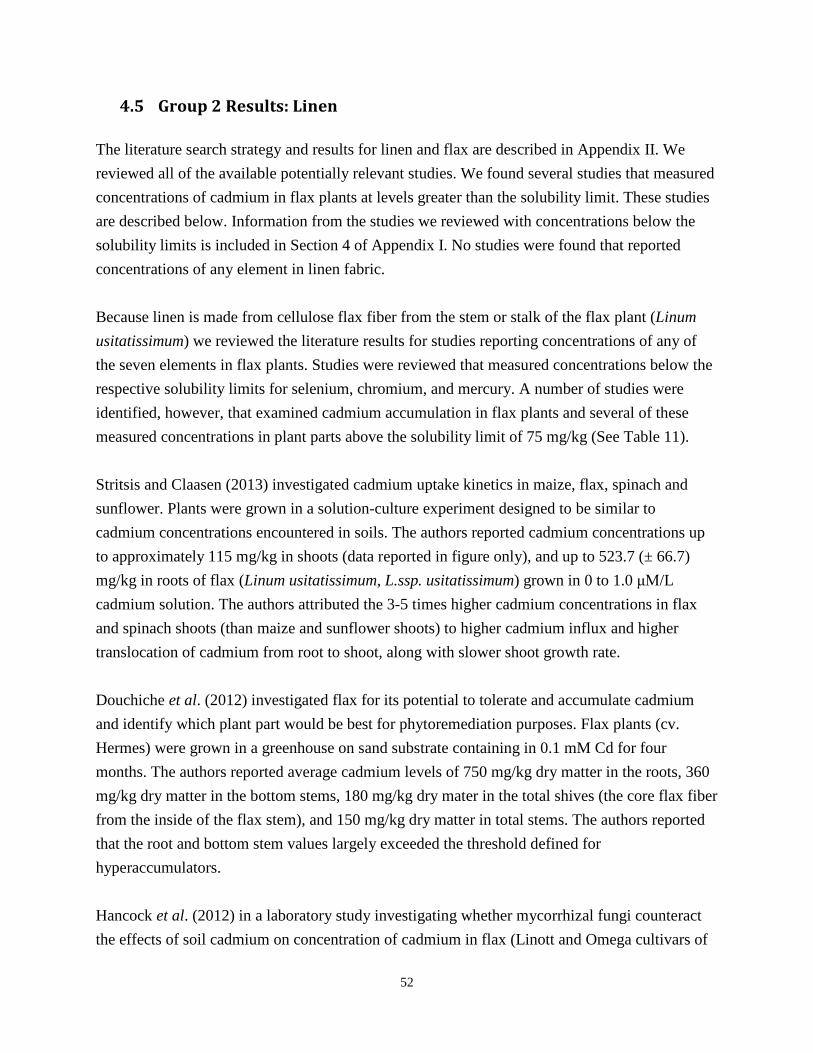
52
4.5 Group 2 Results: Linen
The literature search strategy and results for linen and flax are described in Appendix II. We reviewed all of the available potentially relevant studies. We found several studies that measured concentrations of cadmium in flax plants at levels greater than the solubility limit. These studies are described below. Information from the studies we reviewed with concentrations below the solubility limits is included in Section 4 of Appendix I. No studies were found that reported concentrations of any element in linen fabric. Because linen is made from cellulose flax fiber from the stem or stalk of the flax plant (Linum usitatissimum) we reviewed the literature results for studies reporting concentrations of any of the seven elements in flax plants. Studies were reviewed that measured concentrations below the respective solubility limits for selenium, chromium, and mercury. A number of studies were identified, however, that examined cadmium accumulation in flax plants and several of these measured concentrations in plant parts above the solubility limit of 75 mg/kg (See Table 11). Stritsis and Claasen (2013) investigated cadmium uptake kinetics in maize, flax, spinach and sunflower. Plants were grown in a solution-culture experiment designed to be similar to cadmium concentrations encountered in soils. The authors reported cadmium concentrations up to approximately 115 mg/kg in shoots (data reported in figure only), and up to 523.7 (± 66.7) mg/kg in roots of flax (Linum usitatissimum, L.ssp. usitatissimum) grown in 0 to 1.0 μM/L cadmium solution. The authors attributed the 3-5 times higher cadmium concentrations in flax and spinach shoots (than maize and sunflower shoots) to higher cadmium influx and higher translocation of cadmium from root to shoot, along with slower shoot growth rate. Douchiche et al. (2012) investigated flax for its potential to tolerate and accumulate cadmium and identify which plant part would be best for phytoremediation purposes. Flax plants (cv. Hermes) were grown in a greenhouse on sand substrate containing in 0.1 mM Cd for four months. The authors reported average cadmium levels of 750 mg/kg dry matter in the roots, 360 mg/kg dry matter in the bottom stems, 180 mg/kg dry mater in the total shives (the core flax fiber from the inside of the flax stem), and 150 mg/kg dry matter in total stems. The authors reported that the root and bottom stem values largely exceeded the threshold defined for hyperaccumulators. Hancock et al. (2012) in a laboratory study investigating whether mycorrhizal fungi counteract the effects of soil cadmium on concentration of cadmium in flax (Linott and Omega cultivars of
53
Linum usitatissimum) plant parts. Plants were exposed to 0, low (average 13.6 ppm) or high (average 58.4 ppm) cadmium levels, along with application of 60 ppm zinc. The authors reported that cadmium in the soil significantly contributed to accumulation of cadmium in roots, stems, leaves, capsules, and seeds. Higher soil concentrations resulted in more accumulation than low cadmium soils. Mean concentration of cadmium in stems was approximately 175 ppm (data reported in figure only) in stems and approximately 3,250 mg/kg (data reported in figure only) in the roots. These three experimental studies demonstrate the ability of cadmium to be taken up in flax plants and transported to the shoots, with concentrations in the shoots exceeding the 75 mg/kg solubility limit. Angelova et al. (2004) investigated hemp, cotton, and flax grown 0.5 or 15.0 km from a non-ferrous-metal works (NFMW) near Plovdiv, Bulgaria. Cadmium soil concentrations were approximately 12.2 mg/kg in the region of the NFMW and 2.1 mg/kg in the more distant region. Average concentrations of cadmium in the fiber of the flax plants were up to 3.34 mg/kg; the highest average cadmium concentration in stems was 7.27 mg/kg and in roots was 8.69 mg/kg. Angelova et al. (2004) concluded that of the three crops tested (flax, hemp, and cotton), flax most strongly extracts and accumulates heavy metals from soil. Table 11. Studies measuring concentrations above a solubility limit in flax plants.
Element Reference Concentrations Tissue Conditions/Type of Study
Cadmium Stritsis and Claassen,
2013
up to 115 mg/kg (from graph)
up to 523.7 ± 66.7 mg/kg
shoots
roots
Experimental exposure
Cadmium Douchiche et al., 2012
ranging from 5-750 mg/kg
roots, stem parts, seeds
Experimental exposure
Cadmium Hancock et al., 2012
ranging from 0-3,250 mg/kg (from graph – reported as
up to 1872.01 mg/kg in text)
roots, stems, leaves, capsules,
seeds
Experimental exposure
*For ease of comparison, concentrations are presented in mg/kg; study units in parentheses if different.
54
4.6 Group 2 Results: Cotton
The literature search strategy and results for cotton, cotton plants, and fibers/bolls are described in Appendix II. We reviewed all of the available potentially relevant studies. Several studies reported concentrations of arsenic or chromium in cotton or cotton plants above the solubility limits. These studies are described below. Information from the studies we reviewed with concentrations below the solubility limits is included in Section 3 of Appendix I. One study reported concentrations of arsenic in raw cotton stock, lint, and yarn at levels greater than 25 mg/kg (Perkins and Brushwood, 1991). Measurements of cadmium above the solubility limit were found in parts of the cotton plant in experimental studies and arsenic in cotton fiber and yarn. In addition, chromium concentrations were measured in cotton lint and spun yarns at greater than the solubility limit. See Table 12. Because cotton is made from cotton fibers that are from the bolls of cotton plants, we looked for studies that investigated concentrations of the elements in cotton plants and the fibers. Arsenic acid is sprayed on cotton to prepare plants for harvesting and arsenic remains on the plant through ginning and manufacturing of yarn (Perkins and Brushwood, 1991). Perkins and Brushwood (1991) measured arsenic concentrations in cotton from fields with application rates of 0 to 8 pints/acre and tested effectiveness of arsenic removal in the yarn. The average arsenic concentration was 99.7 mg/kg in raw stock (maximum 285.2 mg/kg), 90.4 mg/kg in clean lint (maximum 249.8 mg/kg) and 99.9 mg/kg in yarn (maximum 366.0 mg/kg). Raw stock samples were taken directly from cotton bales and cleaned lint was mechanically cleaned (Shirley Analyzer process). Yarn samples were taken from selected lots containing from about 2 to more than 300 mg/kg arsenic. Perkins and Brushwood (1991) demonstrated that arsenic is completely removed from the cotton yarn in the scouring process with wet treatment using water at 100˚C. Lower temperature water was less effective at removal. Other studies measured concentrations of arsenic in seed cotton, leaves, cuticle wax, and shoots. One experimental study by Wilkinson and Hardcastle (1969) measured concentrations of up to 41.1 mg/kg arsenic in cotton leaves (Gossypium hirsutum L.). Experiments evaluating cadmium in cotton plants were also identified and a number of these measured cadmium concentrations above the solubility limit of 75 mg/kg. In a series of studies, Daud et al. (2009a,b, 2015) measured levels of cadmium up to 2,300 mg/kg in the roots and up to 550 mg/kg in the leaves of upland cotton cultivar (ZMS-49) grown in a 500 µM cadmium solution, and up to 429 mg/kg in roots and 235 mg/kg in shoots of two transgenic cultivars
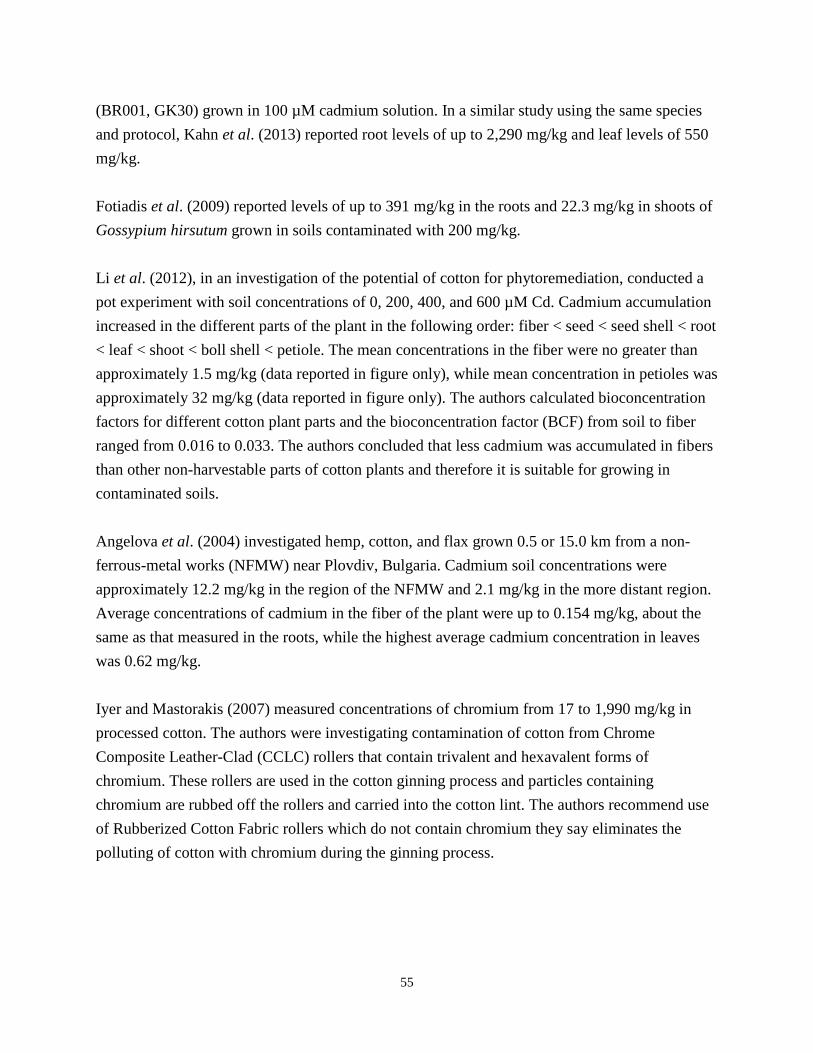
55
(BR001, GK30) grown in 100 µM cadmium solution. In a similar study using the same species and protocol, Kahn et al. (2013) reported root levels of up to 2,290 mg/kg and leaf levels of 550 mg/kg. Fotiadis et al. (2009) reported levels of up to 391 mg/kg in the roots and 22.3 mg/kg in shoots of Gossypium hirsutum grown in soils contaminated with 200 mg/kg. Li et al. (2012), in an investigation of the potential of cotton for phytoremediation, conducted a pot experiment with soil concentrations of 0, 200, 400, and 600 µM Cd. Cadmium accumulation increased in the different parts of the plant in the following order: fiber < seed < seed shell < root < leaf < shoot < boll shell < petiole. The mean concentrations in the fiber were no greater than approximately 1.5 mg/kg (data reported in figure only), while mean concentration in petioles was approximately 32 mg/kg (data reported in figure only). The authors calculated bioconcentration factors for different cotton plant parts and the bioconcentration factor (BCF) from soil to fiber ranged from 0.016 to 0.033. The authors concluded that less cadmium was accumulated in fibers than other non-harvestable parts of cotton plants and therefore it is suitable for growing in contaminated soils. Angelova et al. (2004) investigated hemp, cotton, and flax grown 0.5 or 15.0 km from a non-ferrous-metal works (NFMW) near Plovdiv, Bulgaria. Cadmium soil concentrations were approximately 12.2 mg/kg in the region of the NFMW and 2.1 mg/kg in the more distant region. Average concentrations of cadmium in the fiber of the plant were up to 0.154 mg/kg, about the same as that measured in the roots, while the highest average cadmium concentration in leaves was 0.62 mg/kg. Iyer and Mastorakis (2007) measured concentrations of chromium from 17 to 1,990 mg/kg in processed cotton. The authors were investigating contamination of cotton from Chrome Composite Leather-Clad (CCLC) rollers that contain trivalent and hexavalent forms of chromium. These rollers are used in the cotton ginning process and particles containing chromium are rubbed off the rollers and carried into the cotton lint. The authors recommend use of Rubberized Cotton Fabric rollers which do not contain chromium they say eliminates the polluting of cotton with chromium during the ginning process.
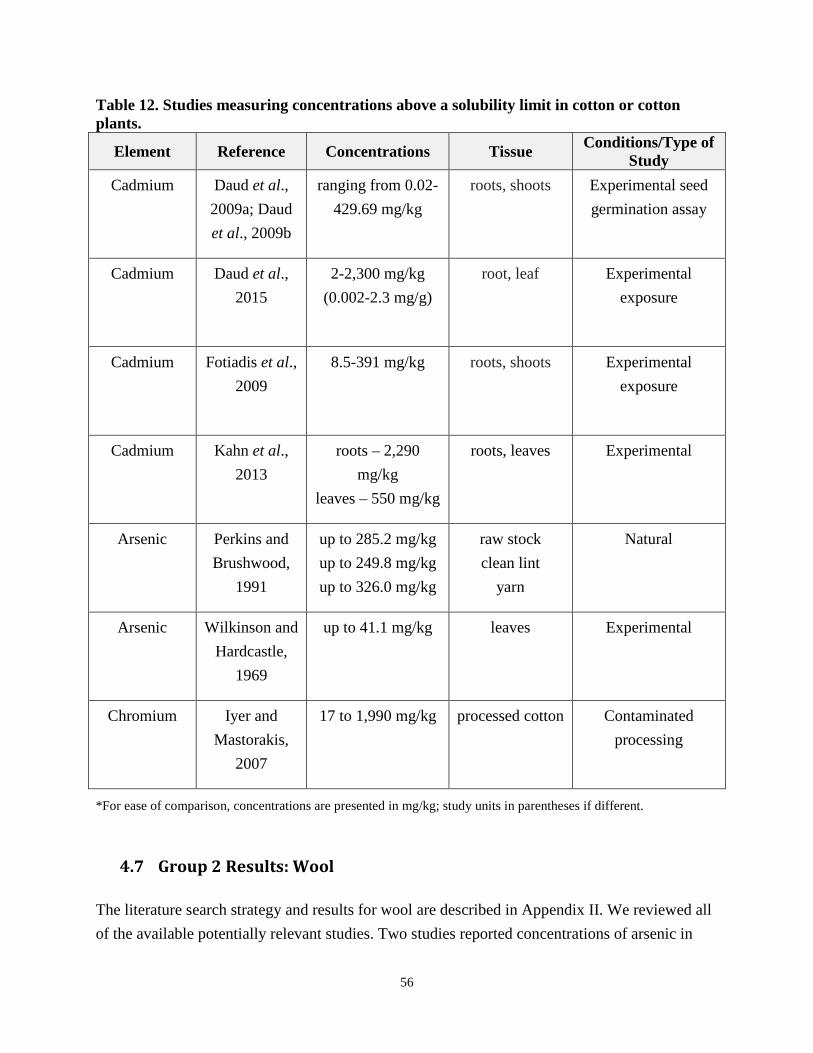
56
Table 12. Studies measuring concentrations above a solubility limit in cotton or cotton plants.
Element Reference Concentrations Tissue Conditions/Type of Study
Cadmium Daud et al., 2009a; Daud et al., 2009b
ranging from 0.02-429.69 mg/kg
roots, shoots Experimental seed germination assay
Cadmium Daud et al., 2015
2-2,300 mg/kg (0.002-2.3 mg/g)
root, leaf Experimental exposure
Cadmium Fotiadis et al., 2009
8.5-391 mg/kg roots, shoots Experimental exposure
Cadmium Kahn et al., 2013
roots – 2,290 mg/kg
leaves – 550 mg/kg
roots, leaves Experimental
Arsenic Perkins and Brushwood,
1991
up to 285.2 mg/kg up to 249.8 mg/kg up to 326.0 mg/kg
raw stock clean lint
yarn
Natural
Arsenic Wilkinson and Hardcastle,
1969
up to 41.1 mg/kg leaves Experimental
Chromium Iyer and Mastorakis,
2007
17 to 1,990 mg/kg processed cotton Contaminated processing
*For ease of comparison, concentrations are presented in mg/kg; study units in parentheses if different.
4.7 Group 2 Results: Wool
The literature search strategy and results for wool are described in Appendix II. We reviewed all of the available potentially relevant studies. Two studies reported concentrations of arsenic in
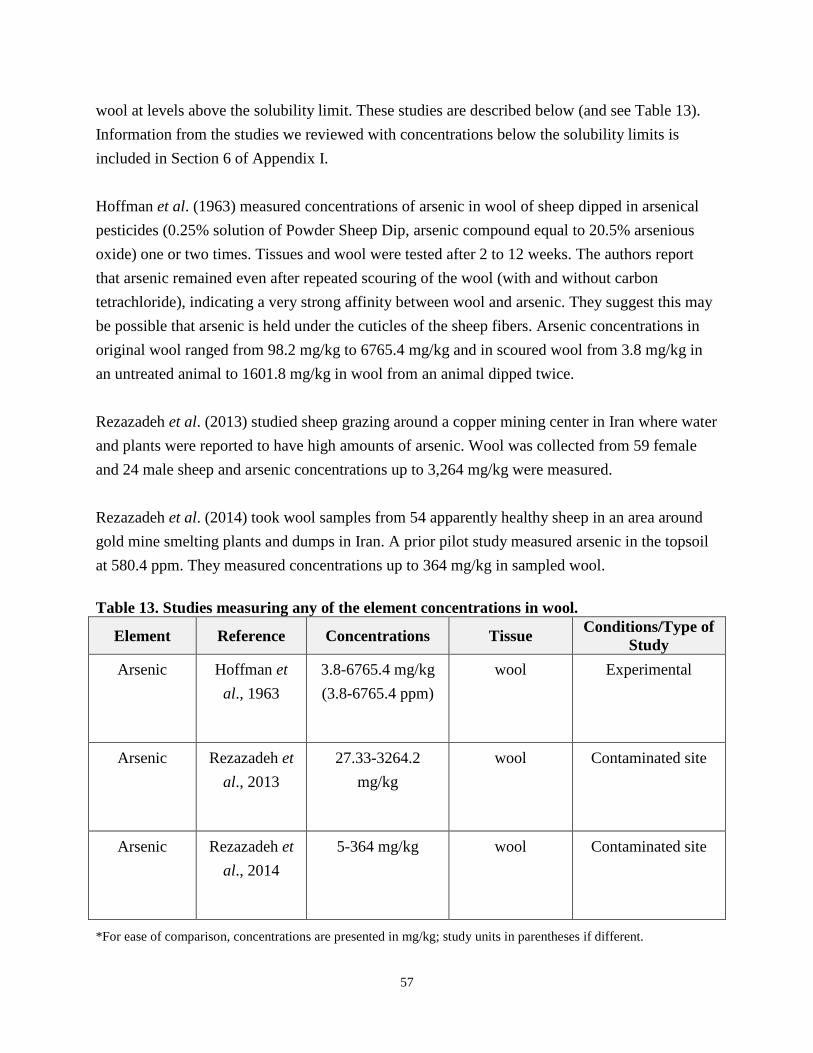
57
wool at levels above the solubility limit. These studies are described below (and see Table 13). Information from the studies we reviewed with concentrations below the solubility limits is included in Section 6 of Appendix I. Hoffman et al. (1963) measured concentrations of arsenic in wool of sheep dipped in arsenical pesticides (0.25% solution of Powder Sheep Dip, arsenic compound equal to 20.5% arsenious oxide) one or two times. Tissues and wool were tested after 2 to 12 weeks. The authors report that arsenic remained even after repeated scouring of the wool (with and without carbon tetrachloride), indicating a very strong affinity between wool and arsenic. They suggest this may be possible that arsenic is held under the cuticles of the sheep fibers. Arsenic concentrations in original wool ranged from 98.2 mg/kg to 6765.4 mg/kg and in scoured wool from 3.8 mg/kg in an untreated animal to 1601.8 mg/kg in wool from an animal dipped twice. Rezazadeh et al. (2013) studied sheep grazing around a copper mining center in Iran where water and plants were reported to have high amounts of arsenic. Wool was collected from 59 female and 24 male sheep and arsenic concentrations up to 3,264 mg/kg were measured. Rezazadeh et al. (2014) took wool samples from 54 apparently healthy sheep in an area around gold mine smelting plants and dumps in Iran. A prior pilot study measured arsenic in the topsoil at 580.4 ppm. They measured concentrations up to 364 mg/kg in sampled wool. Table 13. Studies measuring any of the element concentrations in wool.
Element Reference Concentrations Tissue Conditions/Type of Study
Arsenic Hoffman et al., 1963
3.8-6765.4 mg/kg (3.8-6765.4 ppm)
wool Experimental
Arsenic Rezazadeh et al., 2013
27.33-3264.2 mg/kg
wool Contaminated site
Arsenic Rezazadeh et al., 2014
5-364 mg/kg wool Contaminated site
*For ease of comparison, concentrations are presented in mg/kg; study units in parentheses if different.
58
5. Discussion
As described in Section 1, we searched for studies on concentrations of the seven elements in the three groups of materials to determine if any of the elements are present in the materials at levels above the element’s respective solubility limit. Because of the extensive nature of such a search and large number of studies, we set ‘stopping’ rules to put boundaries around our efforts. We identified about 6500 studies for Groups 1 and 2 through our literature searches and reviewed over 200 of these. Once we found evidence of contamination greater than the solubility limit, we stopped reviewing studies; therefore, additional studies may be available on concentrations of these elements in the materials. Table 13 summarizes our results.
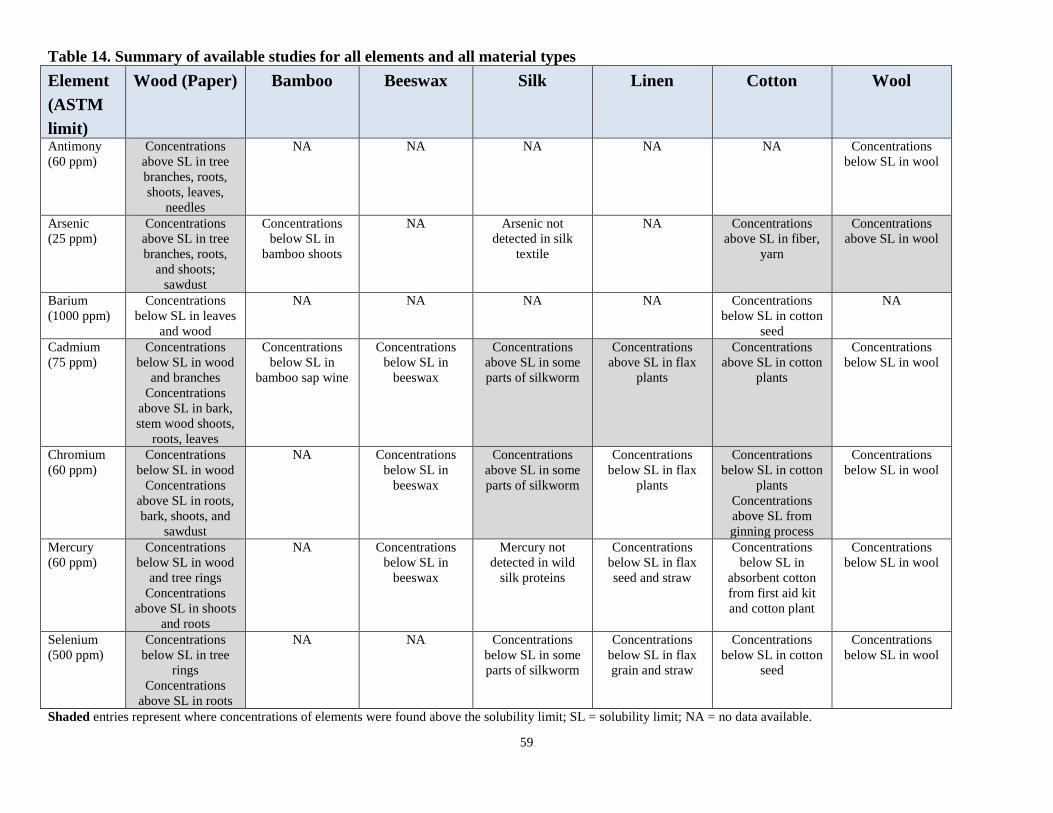
59
Table 14. Summary of available studies for all elements and all material types Element (ASTM limit)
Wood (Paper) Bamboo Beeswax Silk Linen Cotton Wool
Antimony (60 ppm)
Concentrations above SL in tree branches, roots, shoots, leaves,
needles
NA NA NA NA NA Concentrations below SL in wool
Arsenic (25 ppm)
Concentrations above SL in tree branches, roots,
and shoots; sawdust
Concentrations below SL in
bamboo shoots
NA Arsenic not detected in silk
textile
NA Concentrations above SL in fiber,
yarn
Concentrations above SL in wool
Barium (1000 ppm)
Concentrations below SL in leaves
and wood
NA NA NA NA Concentrations below SL in cotton
seed
NA
Cadmium (75 ppm)
Concentrations below SL in wood
and branches Concentrations
above SL in bark, stem wood shoots,
roots, leaves
Concentrations below SL in
bamboo sap wine
Concentrations below SL in
beeswax
Concentrations above SL in some parts of silkworm
Concentrations above SL in flax
plants
Concentrations above SL in cotton
plants
Concentrations below SL in wool
Chromium (60 ppm)
Concentrations below SL in wood
Concentrations above SL in roots, bark, shoots, and
sawdust
NA Concentrations below SL in
beeswax
Concentrations above SL in some parts of silkworm
Concentrations below SL in flax
plants
Concentrations below SL in cotton
plants Concentrations above SL from ginning process
Concentrations below SL in wool
Mercury (60 ppm)
Concentrations below SL in wood
and tree rings Concentrations
above SL in shoots and roots
NA Concentrations below SL in
beeswax
Mercury not detected in wild
silk proteins
Concentrations below SL in flax seed and straw
Concentrations below SL in
absorbent cotton from first aid kit and cotton plant
Concentrations below SL in wool
Selenium (500 ppm)
Concentrations below SL in tree
rings Concentrations
above SL in roots
NA NA Concentrations below SL in some parts of silkworm
Concentrations below SL in flax grain and straw
Concentrations below SL in cotton
seed
Concentrations below SL in wool
Shaded entries represent where concentrations of elements were found above the solubility limit; SL = solubility limit; NA = no data available.
60
5.1 Concentrations of ASTM Elements in Group 1 and 2 Materials
Our review found measurements of the ASTM elements in some of the base materials, including wood, beeswax, bamboo, and some textiles (wool and cotton fiber, lint, and yarn). These concentrations provide some indication of the levels of elements that may be found in the unfinished wood or textiles, the materials of interest, themselves. Wood Very few studies were found that measured concentrations of the ASTM elements in wood, tree trunks, or tree rings. None of the measurements were above the solubility limits. Bamboo Only two studies were found that measured concentrations of any element in bamboo. Both of these reported concentrations below the solubility limits. Beeswax Studies measuring concentrations of cadmium, chromium, and mercury in beeswax did not report values greater than the solubility limits. Silk Only one study was found that tested for any of the elements in silk textiles and in that study arsenic was not detected. Linen No studies were found that measured any elements in linen cloth. Wool In wool, arsenic has been measured at concentrations greater than the solubility limit of 25 mg/kg. Hoffman et al. (1963) measured concentrations up to 3765.4 mg/kg in wool of sheep dipped in arsenical pesticides. After scouring the wool (washing with solvent), concentrations remained as high as 1601.8 mg/kg. Rezazadeh et al., (2013) reported concentrations of arsenic in wool up to 3,264 mg/kg. Also Rezazadeh et al., (2014) measured concentrations of arsenic in wool up to 364 mg/kg.
61
Cotton In cotton, arsenic has been measured in concentrations above the solubility limit of 25 mg/kg in cotton fibers and yarn. Chromium concentrations have been measured in excess of the solubility limit of 60 mg/kg in cotton from contamination during the ginning process. Perkins and Brushwood (1991) studied arsenic concentrations in cotton from fields treated with arsenic acid for harvesting. They found the arsenic remains on the plant through the ginning and manufacturing of yarn, but demonstrated that the arsenic can be completely removed from the cotton yarn in the scouring process. Iyer and Mastorakis (2007) measured concentrations of chromium (up to 1,990 mg/kg) in processed cotton from use of rollers containing trivalent and hexavalent forms of chromium in the cotton ginning process.
5.2 Concentrations in Trees, Bamboo Plants, Silkworms, Flax Plants, and Cotton Plants
For wood, bamboo, beeswax, silk, linen cloth, and wool, we did not find concentrations of the ASTM elements in the material of interest above the solubility limits. For cotton and wool, contamination was due to agricultural chemical use or processing. However, we did find studies demonstrating uptake and accumulation of one or more elements in the base material (i.e., trees, bamboo plants, silkworms, flax plants, and cotton plants). Some of the studies measured concentrations above the solubility limit in some parts of the plant or organism. Note that we did not seek information on bees, or on sheep parts other than wool (such as blood concentrations) because we found studies on beeswax and wool, the materials of interest. Trees We found many studies identifying and measuring the ASTM elements in trees. All seven elements have been detected in one or more parts of trees. In the studies we reviewed, we found concentrations exceeded the solubility limits for all elements (except barium) for some part(s) of trees. Bamboo Plants For bamboo, we found few studies and these measured arsenic and cadmium in bamboo shoots and sap wine, respectively. Both arsenic and cadmium concentrations were below their solubility limits in the studies we reviewed.
62
Silkworms Concentrations of cadmium and chromium were measured in some parts of silkworms above the solubility limit (Suzuki et al., 1984, Shoukat et al., 2014); while mercury was not detected in wild silk protein and selenium concentrations were below the solubility limit in silkworms. Flax Plants Concentrations of cadmium were measured in some parts of flax plants above the solubility limit in several studies; while chromium, mercury, and selenium concentrations were below their solubility limits in flax plants in other studies Cotton Plants Cadmium concentrations above the solubility limit were measured in some parts of cotton plants, while barium, chromium, and selenium concentrations were below solubility limits in parts of cotton plants and seeds. Concentrations of mercury in absorbent cotton were also below the solubility limit.
5.3 Potential for Accumulation from the Environment or Agriculture
The results of our research indicate that there is potential for one or more of the seven ASTM elements to be taken up and be present in the plants or organisms from which the materials of interest are produced. A critical question is whether it is plausible that an element could accumulate to levels above the solubility limit. Various lines of evidence could be used to explore this question, including investigating uptake, accumulation, and translocation in the plant or uptake and distribution to animal tissues of interest. For example, insights into the possibility of an element in wood exceeding the solubility limit could be gained by evaluating data on translocation and accumulation in the parts of trees made into wood (e.g., tree trunks). As described in Section 3, elements can be accumulated in plants that are the source material for the natural products of interest, or a food source for the organism producing the material (e.g., mulberry leaves for silkworms, or forage/feed for wool producing sheep). Investigation of the toxicity of the elements to the host organism can aid in understanding the potential for accumulation above a solubility limit. Some of the seven elements are essential elements for plants; however, excessive uptake of elements could potentially interfere with plant
63
growth and at some concentration will result in plant death. Therefore, if one can determine the accumulation level at which an element would kill the plant, then one could assume that this is the upper limit for a concentration in the material. If this upper limit is below the solubility limit, then one could conclude that the material could never contain the element at levels of concern (based on transfer from the growing process). Can trees survive exposures to the concentrations necessary to uptake and sequester the element in the woody part of the tree at levels above the solubility limit? Information on the toxicity of the elements can help determine the plausibility of exceeding the solubility limit for the materials. For example, it is possible that toxicity of barium may play a role in the low bioaccumulation potential reported by ASTDR (2007) and CCME (2013). Toxicity studies in different plant types found median lethal concentrations (LC50s) ranging from 868-2944 mg/kg, meaning these plants may not be able to accumulate barium to the solubility limit of 1000 mg/kg before barium exerts negative effects on the plants themselves (CCME, 2013). Because the solubility limit for barium is high (1000 mg/kg), it is possible that concentrations may rarely be found that high in plants, due to toxicity. If it is possible for the base material to accumulate sufficient amounts of an ASTM element, then additional investigation could consider whether there are circumstances where the element can be available to the source plant or organism in sufficient quantities to reach the solubility limits in the end material through uptake into the host/base organisms from environmental media and/or growth cycle. In Section 3.2, we summarize information regarding environmental concentrations of the elements in various media. Numerous studies investigated trees and other relevant plants grown in contaminated soils or at contaminated sites. It may be reasonable to assume that wood may come from trees harvested from areas of contamination. Similarly, flax and cotton are grown in soils that may be contaminated. In the context of this investigation, unless there are data to have confidence that the source materials would not be grown in contaminated environments (either natural or anthropogenic), one may need to assume they can and are. In addition, fertilizers, pesticides, and other materials applied to soil, water, or the plants or animals themselves in the growing process may contain these elements (as we saw with arsenic dips for sheep). Residues from these applications may be taken up by the plant and transferred into the end material. Data on translocation factors might be useful to roughly estimate the concentration of elements that may be taken up from contaminated soils or water, or through application of chemicals in agriculture.
64
Material containing the elements might adhere to the plant parts of interest and be incorporated into the final product. For example, Perkins and Brushwood (1992) investigated the use of arsenic acid in harvesting of cotton and measured concentrations on the cotton fibers. In this case, they demonstrated that high temperature washing of the cotton fiber or yarn would remove the arsenic from the cotton completely. Whether such washing of cotton is always performed by all producers of cotton would need further investigation to determine if this is a pathway of contamination that might be a problem. Determination of what element-containing materials are used in growing, harvesting, and producing each material could be investigated and, if sufficient information is located, rough estimates of resulting concentrations may be possible to calculate.
5.4 Introduction of Elements through Processing or Packaging
With our limited resources and time we focused our research on measurements of the ASTM elements in the materials of interest and did limited research on Factors 4 and 5 (i.e., potential for contamination from packaging or processing or packaging). In Section 2, we discuss the wide variety of processing practices for these materials. In particular, textiles use a variety of processes that may include chemicals containing elements to turn the raw material into thread, yarn, or fabric. These chemicals may or may not be retained in the final textile product. Contamination of textiles from processing of the raw materials was demonstrated by Iyer and Mastorakis (2007) who measured high levels of chromium in processed cotton from use of rollers containing trivalent and hexavalent forms of chromium in the cotton ginning process. Paper processing includes many steps such as chemical pulping, finishing, and coating. To investigate processes and their likelihood of transferring elements into the material, one could consider the ability of the elements to be transferred. For example, special circumstances would be required to transfer elements from solid or micronized sources of elements or matrices to the natural products of interest. Consider that stainless steel tools used to machine wood can contain chromium (along with nickel and manganese). Simple calculation of saw blade (or other machining tool) initial weight versus amount of wood processed over the blade’s lifespan of use could provide the information to estimate chromium exposure potential from transfer to the wood during processing. Wood processing involves significant contact with elements as well, from tree felling (with a chainsaw or axe) and machining/sawmilling (which includes bucking, debarking, grinding, drying, ‘seasoning’, kilning, boring, high pressure water, cleaning, peeling, slicing, sawing, cutting, shaping, and pulping). Similar analyses could be done to estimate potential transfer of elements from blades and machines in contact with the wood.
65
The raw material for each of the natural materials undergoes some type of processing before being made into consumer products. Each of the processing steps would need to be investigated in order to determine if elements are present at any step during processing and the potential mechanisms for transfer of the element from the process to the material. For packaging, our initial thinking is that packaging (e.g., plastic wrap, rigid plastic, paper, cardboard) is not anticipated to be a significant source of element contamination for the natural products under consideration. Even if the element content of packaging were high, a mobile phase would be required within the packaging to potentially allow transport the elements to the natural products via the relatively slow process of passive diffusion. In a similar fashion if there is evidence that elements can come in contact with the products or base materials during processing or packaging, one could use information on physical-chemical properties of the materials and elements to determine whether it is possible for the elements from the packaging to be retained within the products.
66
6. References
Algreen, M., Rein, A., Legind, C. N., Amundsen, C. E., Karlson, U. G., Trapp, S. 2012. Test of tree core sampling for screening of toxic elements in soils from a Norwegian site. Int J Phytoremed. 14, 305–319.
Algreen, M., Trapp, S., Rein, A., 2014. Phytoscreening and phytoextraction of heavy metals at Danish polluted sites using willow and poplar trees. Environ Sci Pollut Res. 21, 8992–9001.
Al-Masri, M. S., Amin, Y., Al-Akel, B., Al-Naama, T. 2010. Biosorption of cadmium, lead, and uranium by powder of poplar leaves and branches. Appl Biochem Biotechnol. 160, 976-987.
Altmann, G.A. 1983. Untersuchung von Honig aus dem Raum Stolberg auf Schwermetalle, Diplomarbeit, Aachen Fachhochschule, Aachen.
Angelova, V., Ivanovab, R., Delibaltova, V., Ivanova, K. 2004. Bio-accumulation and distribution of heavy metals in fibre crops (flax, cotton and hemp). Industrial Crops and Products. 19, 197–205.
ATSDR (Agency for Toxic Substances and Disease Registry). 1992. Toxicological Profile for Antimony and Compounds. U.S. Public Health Service, Agency for Toxic Substances and Disease Registry.
ATSDR (Agency for Toxic Substances and Disease Registry). 1999. Toxicological Profile for Mercury. U.S. Department of Health and Human Services, Public Health Service, Agency for Toxic Substances and Disease Registry.
ATSDR (Agency for Toxic Substances and Disease Registry). 2003. Toxicological Profile for Selenium. U.S. Department of Health and Human Services, Public Health Service, Agency for Toxic Substances and Disease Registry.
ATSDR (Agency for Toxic Substances and Disease Registry). 2007a. Toxicological Profile for Arsenic. U.S. Department of Health and Human Services, Public Health Service, Agency for Toxic Substances and Disease Registry.
ATSDR (Agency for Toxic Substances and Disease Registry). 2007b. Toxicological Profile for Barium and Compounds. U.S. Department of Health and Human Services, Public Health Service, Agency for Toxic Substances and Disease Registry.
ATSDR (Agency for Toxic Substances and Disease Registry). 2012a. Toxicological Profile for Cadmium. U.S. Department of Health and Human Services, Public Health Service, Agency for
67
Toxic Substances and Disease Registry.
ATSDR (Agency for Toxic Substances and Disease Registry). 2012b. Toxicological Profile for Chromium. U.S. Department of Health and Human Services, Public Health Service, Agency for Toxic Substances and Disease Registry.
ATSDR (Agency for Toxic Substances and Disease Registry). 2013. Addendum to the Toxicological Profile for Mercury (Alkyl and Dialkyl Compounds). Division of Toxicology and Human Health Sciences, Agency for Toxic Substances and Disease Registry.
BCME (British Columbia Ministry of Environment). 2014. Ambient Water Quality Guidelines for Selenium Technical Report. Update. Water Protection and Sustainability Branch. British Columbia Ministry of Environment.
Bogdanov, S., 2006. Contaminants of bee products. Apidologie. 37, 1-18.
Castillo-Michel, H., Hernandez-Viezcas, J., Dokken, K. M., Marcus, M. A., Peralta-Videa, J. R., Gardea-Torresdey, J. L. 2011. Localization and speciation of Arsenic in soil and Desert Plant Parkinsonia florida using μXRF and μXANES. Environ Sci Technol. 45, 7848–7854.
CCME (Canadian Council of Ministers of the Environment). 1999. Canadian Soil Quality Guidelines for the Protection of Environmental and Human Health. Chromium. Canadian Environmental Quality Guidelines, Canadian Council of Ministers of the Environment.
CCME (Canadian Council of Ministers of the Environment). 2013. Canadian Soil Quality Guidelines for the Protection of Environmental and Human Health. Barium 2013. Canadian Environmental Quality Guidelines, Canadian Council of Ministers of the Environment.
Cesco, M.E., Barbattini, R., Agabiti, M.F. 1994. Honey bees and bee products as possible indicators of cadmium and lead environmental pollution: An experience of biological monitoring in Portogruaro city (Venice, Italy). Apicoltura. 9, 103-118.
Clemens, S. 2006. Toxic metal accumulation, responses to exposure and mechanisms of tolerance in plants. Biochimie. 88, 1707-1719.
Conti, M.E., Botre, F. 2001. Honeybees and their products as potential bioindicators of heavy metals contamination. Environ Monit Assess. 69, 267-282.
Daud, M. K., Suna, Y., Dawooda, M., Hayatb, Y., Variatha, M. T., Wu, Y., Raziuddina., Mishkatd, U., Salahuddine., Najeeba, U., Zhua, S. 2009a. Cadmium-induced functional and ultrastructural alterations in roots of two transgenic cotton cultivars. Journal of Hazardous Materials. 161, 463–473.
68
Daud, M. K., Variatha, M. T., Ali, S., Najeeba, U., Jamil, M., Hayat, Y., Dawooda, M., Khand, M. I., Zaffar, M., Cheemad, S. A., Tonga, X. H., Zhua, S. 2009b. Cadmium-induced ultramorphological and physiological changes in leaves of two transgenic cotton cultivars and their wild relative. Journal of Hazardous Materials. 168, 614–625.
Daud, M. K., Quiling, H., Lei, M., Ali, B., Zhu, S. J. 2015. Ultrastructural, metabolic and proteomic changes in leaves of upland cotton in response to cadmium stress. Chemosphere. 120, 309–320.
Douchiche, O., Chaïbib, W., Claudine, M. 2012. Cadmium tolerance and accumulation characteristics of mature flax, cv. Hermes: Contribution of the basal stem compared to the root. Journal of Hazardous Materials. 235, 101– 107.
Dykstra, D.P., Heinrich, R.1992. Sustaining tropical forests through environmentally sound harvesting practices. Unasylva. 169 – Sustainability; Vol. 43. Food and Agriculture Organization of the United States. Available at: http://www.fao.org/docrep/u6010e/u6010e04.htm#TopOfPage.
Ecology Communications Group. 2011. Paper Chase. Online article by Sam Martin, Available at: http://www.ecology.com/2011/09/10/paper-chase/
EPA (U.S. Environmental Protection Agency). 2003. Issue Paper on the Bioavailability and Bioaccumulation of Metals. Draft. Risk Assessment Forum. U.S. Environmental Protection Agency, Washington, D.C. Available at: http://epa.gov/raf/publications/pdfs/BIOAVAIL_BIOACCUM_AUG03.PDF
Evangelou, M.W.H., Deram, A., Gogos, A., Studer, B., Schulin, R. 2012. Assessment of suitability of tree species for the production of biomass on trace element contaminated soils. J Hazard Mater. 209-210, 233-239.
Evangelou, M. W. H., Robinson, B. H., Gunthardt-Goerg, M. S., Schulin, R. 2013 Metal uptake and allocation in trees grown on contaminated land: Implications for biomass production. Int J Phytoremed. 15, 77-90.
Formicki, G., Gren, A., Stawarz, R., Zysk, B., Gal, A. 2012. Metal content in honey, propolis, wax, and bee pollen and implications for metal pollution monitoring. Pol J Environ Stud. 22, 99-106.
Fotiadis, E.A., Pritsa, T.S., Vardavakis, E., Lolas, P.C. 2009. Growth of weed and crop plants under cadmium stress and their phytoremediation potential. Fresenius Environmental Bulletin. 18, 175-181.
69
FTC (Federal Trade Commission). 1939. The Wool Products Labeling Act of 1939. 15 U.S.C. § 68. Available at: http://www.ftc.gov/node/119457.
Hancock, L. M. S., Ernst, C.L., Charneskie, R., Raune, L.G. 2012. Effects of cadmium and Mycorrhizal fungi on growth, fitness, and cadmium accumulation in flax ( Linum usitassimum; Linaceae). Am J Botany. 99, 1445–1452.
Harada, E., Hokura, A., Takada, S., Baba, K., Terada, Y., Nakai, I., Yazaki, K. 2010. Characterization of cadmium accumulation in willow as a woody metal accumulator using synchrotron radiation-based x-ray microanalyses. Plant Cell Physiol. 51, 848-853.
Hoffman, I., Carson, R.B., Morris, R.F. 1963. The effect of arsenical dipping on the arsenic content of sheep tissues. Can. J. Anim. Sci. 43, 303-308.
Idaho Forest Product Commission. 2015. How paper is made. Available at: http://www.idahoforests.org/paprmake.htm
Iyer, G.V., Mastorakis N.E. 2007. Eco-Friendly Rubberized Cotton Fabric Roller for Ginning Machines. Proceedings of the 6th WSEAS Int. Conf. on Systems Theory & Scientific Computation, Elounda, Greece, August 21-23, 2006 (pp260-275).
Jana, U., Chassany, V., Bertrand, G., Castrec-Rouelle, M., Aubry, E., Boudsocq, S., Laffray, D., Repellin, A. 2012. Analysis of arsenic and antimony distribution within plants growing at an old mine site in Ouche (Cantal, France) and identification of species suitable for site revegetation. J Environ Manage. 110, 188-193.
Jean-Philippe, S. R., Franklin, J. A., Buckley, D. S., Hughes, K., 2011a. The effect of mercury on trees and their mycorrhizal fungi. Environ Pollut. 159, 2733-2739.
Jean-Philippe S R., Labbé N., Damay J., Franklin J A., Hughes K. 2011b. Effect of Mercuric Compounds on Pine and Sycamore Germination and Early Survival. Am J Plant Sci. 3, 150-158.
Jun, R., Ling, T. 2012. Increase of Cd accumulation in five poplar (Populus L.) with different supply levels of Cd. Int J Phytoremed. 14, 101-113.
Kirchner, P., Biondi, F., Edwards, R., McConnell, J. R. 2008. Variability of trace metal concentrations in Jeffrey pine (Pinus jeffreyi) tree rings from the Tahoe Basin, California, USA. J For Res. 13, 347–356.
Kumar, D., Tripathi, D. K., Chauhan, D. K. 2014. Phytoremediation potential and nutrient status of Barringtonia acutangula Gaerth. tree seedlings grown under different Chromium (CrVI) treatments. Biol Trace Elem Res. 157, 164–174.
70
Lee, K., Kweon, H., Yeo, J., Woo, S., Han, S., Kim, J. 2011. Characterization of tyrosine-rich Antheraea pernyi silk fibroin hydrolysate. Int J Biol Macromol. 48, 223-226.
Lehndorff, E., Schwark, L. 2010. Biomonitoring of air quality in the Cologne Conurbation using pine needles as a passive sampler - Part III: Major and trace elements. Atmospheric Environment. 44, 2822-2829.
Leita, L., Muhlbachova, G., Cesco, S., Barbattini, R., Mondini, C. 1996. Investigation of the use of honey bees and honey bees products to assess heavy metals contamination. Environ Monit Assess. 43, 1-9.
Li, L., Chen, J., He, Q., Daudi, M. K., Zhu, S. 2012. Characterization of physiological traits, yield and fiber quality in three upland cotton cultivars grown under cadmium stress. Austral J Crop Sci. 6, 1527-1533.
Liu, G., Zhang, Y., Qi, C., Zheng, L., Chen, Y., Peng, Z. 2007. Comparative on causes and accumulation of selenium in the tree-rings ambient high-selenium coal combustion area from Yutangba, Hubei, China. Environ Monit Assess. 133, 99-103.
López, M. L., Peralta-Videa, J. R., Parsons, A. J. G., Duarte-Gardea, M., Gardea-Torresdey, J. L. 2008. Concentration and biotransformation of arsenic by Prosopis sp. grown in soil treated with chelating agents and phytohormones. Environ Chem. 5, 320–331.
Madras-Majewska, B., Jasinski, Z., Zarski, T., Zarska, H. 2002. The content of mercury in honeybee body and bee products originating from different region of Poland. 5th Int. Conf. on the Black Bee, Apis mellifera mellifera, Wierzba, Poland. 2-6, 101-102.
Madras-Majewska, B., Jasinski, Z. 2003. Lead content of bees, brood and bee products from different regions of Poland. J Apic Sci. 47, 47-55.
Madras-Majewska, B., Jasinski, Z. 2005. The content of mercury in bee bread originating from different region of Poland. J Apicult Sci. 49, 69-72.
MAFF, 1995. Analysis of bee products for heavy metals, Food Surveillance Information Sheet Nr. 53.
Meharg, A.A., Hartley-Whitaker, J. 2002. Arsenic uptake and metabolism in arsenic resistant and nonresistant plant species. Tansley Review no. 133. New Phytologist. 154, 29-43.
Mosha, D., Wangabo, J., Mhinzi, G. 1996. African traditional brews: how safe are they? Food Chem. 57, 205-209.
71
Nwajei, G. E., Iwegbue, C. M. A. 2007. Trace elements in sawdust particles in the vicinity of sawmill in Sapele, Nigeria. Pakistan Journal of Biological Sciences. 10, 4311-4314.
Peralta-Videa, JR. 2014. Email communication with Dr. Peralta-Videa, DSc, PhD. Monday, September 29, 2014 11:54 AM.
Perkins, H. H., Brushwood, D. E., 1991. Effects of mechanical processing and wet treatments on arsenic acid desiccant residues in cotton. The Magazine of Wet Processing Industry. 23, 26-28.
Petras, R., Jamnicka, G., Mecko, J., Neuschlova, E. 2012. State of mineral nutrition and heavy metals distribution in aboveground biomass of Poplar Clones. Pol.J. Environ. Stud. 21, 447-453.
Pulford, I. D., Watson, C., McGregor, S. 2001. Uptake of Chromium by trees: Prospects for phytoremediation. Environmental Geochemistry and Health. 23, 307–311.
Rezazadeh, F., Sheikhzadeh, F., Rezaei, S. A., Heidari, A. A. 2013. Wool arsenic in grazing sheep of a copper mine (Songoun) in North-West of Iran. Res Opin Anim Vet Sci. 3, 435-437.
Rezazadeh, F., Jafari, R., Sheikhzadeh, F, Paktinat, S. 2014. A study on wool arsenic concentration and some blood parameters in sheep flocks grazing around tailing dams of gold mines in Takab, Iran. Research Opinions in Animal and Veterinary Sciences. 4(5), 233-236.
Saravanan, P., Chandramohan, G. 2011. Dyeing of silk with ecofriendly natural dye obtained from barks of Ficus religiosa L. Univ J Environ Res Technol. 1(3), 268-273.
Sardans, J., Penuelas, J. 2005. Trace element accumulation in the moss Hypnum cupressiforme Hedw. and the trees Quercus ilex L. and Pinus halepensis Mill. in Catalonia. Chemosphere. 60, 1293-1307.
Sardans, J., Penuelas, J. 2006. Introduction of the factor of partitioning in the lithogenic enrichment factors of trace element bioaccumulation in plant tissues. Environ Monit Assess. 115, 473-498.
Sedumedi, H. N., Mandiwana, K. L., Ngobeni, P., Panichev, N. 2009. Speciation of Cr(VI) in environmental samples in the vicinity of the ferrochrome smelter. Journal of Hazardous Materials. 172, 1686–1689.
Shanker, A. K., Ravichandran, V., Pathmanabhan, G. 2005. Phytoaccumulation of chromium by some multipurpose-tree seedlings. Agroforestry Systems. 64, 83–87.
Shaw, J. 1989. Heavy Metal Tolerance in Plants: Evolutionary Aspects. CRC Press, Taylor & Francis Group, Boca Raton, FL.
72
Shoukat, M., Ashraf, S., Ali, M., Iqbal, Z., Shahzad, M.I., Chaudary, H.R., Sial, N., Batool, Z. 2014. The effect of Cr (VI) on silk worm (Bombyx mori) fed on in vitro accumulated mulberry leaves. Asian J Agri Biol. 2(2), 119-128.
Stritsis, C., Claassen, N. 2013. Cadmium uptake kinetics and plants factors of shoot Cd concentration. Plant Soil. 367, 591–603.
Suter, G. W., 2007. Ecological Risk Assessment. Second Edition. CRC Press, Taylor & Francis Group, Boca Raton, FL.
Suzuki, K., Aoki, Y., Nishikawa, M., Masui, H., Matsubara, F. 1984. Effect of Cadmium-feeding on tissue concentrations of elements in germ-free silkworm (Bombyx mori) larvae and distribution of cadmium in the alimentary canal. Camp. Biochem. Physiol. 79C, 249-253.
Terry, N., Zayed, A.M., de Souza, M.P., Tarun, A.S. 2000. Selenium in higher plants. Annu Rev Plant Physiol Plant Mol Biol. 51, 401-432.
Tyler, G., Olsson, T. 2006. The importance of atmospheric deposition, charge and atomic mass to the dynamics of minor and rare elements in developing, ageing, and wilted leaves of beech (Fagus sylvatica L.). Chemosphere. 65, 250–260.
Umadevi, M., Avudainayagam, S. 2013. Effect of Cadmium and Chromium on fast growing pulp wood tree species. Int J Biosci. 3, 92-104.
Veleminksy, M., Laznicka, P., Stary, P. 1990. Honeybees (Apis mellifera) as environmental monitors of heavy metals in Czechoslovakia. Acta Entomol Bohemoslov. 87, 37-44.
Wanat, N., Joussein, E., Soubrand, M., Lenain, J.F. 2014. Arsenic (As), antimony (Sb), and lead (Pb) availability from Au-mine Technosols: a case study of transfer to natural vegetation cover in temperate climates. Environ Geochem Health. 36, 783-795.
Wang, K. R., Gong, H., Wang, Y., van der Zee, S. E. A. T. M. 2004. Toxic effects of cadmium on Morus alba L. and Bombyx moril L. Plant and Soil. 261, 171–180.
Wikipedia. 2015. Entry on paper. Available at: http://en.wikipedia.org/wiki/Paper.
Wilkinson, R. E., Hardcastle, W. S. 1969. Plant and soil arsenic analyses. Weed Science. 17, 536-537.
WSD (Washington State Department of Labor and Industries). 2001. Clothing Dermatitis and Clothing-Related Skin Conditions. Safety & Health Assessment & Research for Prevention. Available at: http://www.lni.wa.gov/safety/research/dermatitis/files/clothing.pdf
73
Yu, X.Z., Gu, J.D. 2008. Differences in uptake and translocation of selenate and selenite by the weeping willow and hybrid willow. Environ Sci Pollut Res Int. 15, 499-508.
Zhao, R., Zhao, M., Wang, H., Taneike, Y., Zhang, X. 2006. Arsenic speciation in moso bamboo shoot - A terrestrial plant that contains organoarsenic species. Sci Total Environ. 371, 293-303.
Zhelyazkova, I., Atanasova, S., Barakova, V., Mihaylova, G. 2010. Content of heavy metals and metalloids in bees and bee products from areas with different degree of anthropogenic impact. Agricult Sci Technol. 3, 136-142.
Concentrations of Selected
Elements in Unfinished Wood and Other Natural Materials
Task Order 9 Contract Number CPSC-D-12-0001
March 2, 2015
Appendix I – Data Tables for Concentrations Below Solubility
Limits
Prepared by: Toxicology Excellence for Risk Assessment
(TERA) Contact:
Jacqueline Patterson [email protected] Alison Willis [email protected]
I-2
Contents 1. Introduction ........................................................................................................................................................ I-4
2. Group 1 - Wood .................................................................................................................................................. I-5
2.1 Table 1. Antimony Concentrations in Trees.............................................................................................. I-5
2.2 Table 2. Arsenic Concentrations in Trees. ................................................................................................ I-5
2.3 Table 3. Barium Concentrations in Trees. ................................................................................................. I-6
2.4 Table 4. Cadmium Concentrations in Trees. ............................................................................................. I-7
2.5 Table 5. Chromium Concentrations in Trees. ........................................................................................... I-8
2.6 Table 6. Mercury Concentrations in Trees. .............................................................................................. I-9
2.7 Table 7. Selenium Concentrations in Trees. ............................................................................................ I-12
3. Group 2: Cotton ................................................................................................................................................ I-14
3.1 Table 1. Antimony Concentrations in Cotton.......................................................................................... I-14
3.2 Table 2. Arsenic Concentrations in Cotton. ............................................................................................ I-14
3.3 Table 3. Barium Concentrations in Cotton. ............................................................................................. I-15
3.4 Table 4. Cadmium Concentrations in Cotton. ......................................................................................... I-15
3.5 Table 5. Chromium Concentrations in Cotton. ....................................................................................... I-16
3.6 Table 6. Mercury Concentrations in Cotton. ........................................................................................... I-16
3.7 Table 7. Selenium Concentrations in Cotton. .......................................................................................... I-16
4. Group 2: Linen.................................................................................................................................................. I-17
4.1 Table 1. Antimony Concentrations in Linen. .......................................................................................... I-17
4.2 Table 2. Arsenic Concentrations in Linen. .............................................................................................. I-17
4.3 Table 3. Barium Concentrations in Linen. .............................................................................................. I-17
4.4 Table 4. Cadmium Concentrations in Linen. .......................................................................................... I-18
4.5 Table 5. Chromium Concentrations in Linen. ......................................................................................... I-18
4.6 Table 6. Mercury Concentrations in Linen.............................................................................................. I-19
4.7 Table 7. Selenium Concentrations in Linen. ........................................................................................... I-19
5. Group 2: Silk .................................................................................................................................................... I-19
I-3
5.1 Table 1. Antimony Concentrations in Silk. ............................................................................................. I-19
5.2 Table 2. Arsenic Concentrations in Silk. ................................................................................................. I-20
5.3 Table 3. Barium Concentrations in Silk. ................................................................................................. I-20
5.4 Table 4. Cadmium Concentrations in Silk. ............................................................................................. I-20
5.5 Table 5. Chromium Concentrations in Silk. ............................................................................................ I-21
5.6 Table 6. Mercury Concentrations in Silk. ............................................................................................... I-21
5.7 Table 7. Selenium Concentrations in Silk. .............................................................................................. I-21
6. Group 2: Wool .................................................................................................................................................. I-21
6.1 Table 1. Antimony Concentrations in Wool............................................................................................ I-21
6.2 Table 2. Arsenic Concentrations in Wool. .............................................................................................. I-22
6.3 Table 3. Barium Concentrations in Wool. ............................................................................................... I-22
6.4 Table 4. Cadmium Concentrations in Wool. ........................................................................................... I-23
6.5 Table 5. Chromium Concentrations in Wool. ......................................................................................... I-24
6.6 Table 6. Mercury Concentrations in Wool. ............................................................................................. I-24
6.7 Table 7. Selenium Concentrations in Wool. ............................................................................................ I-24
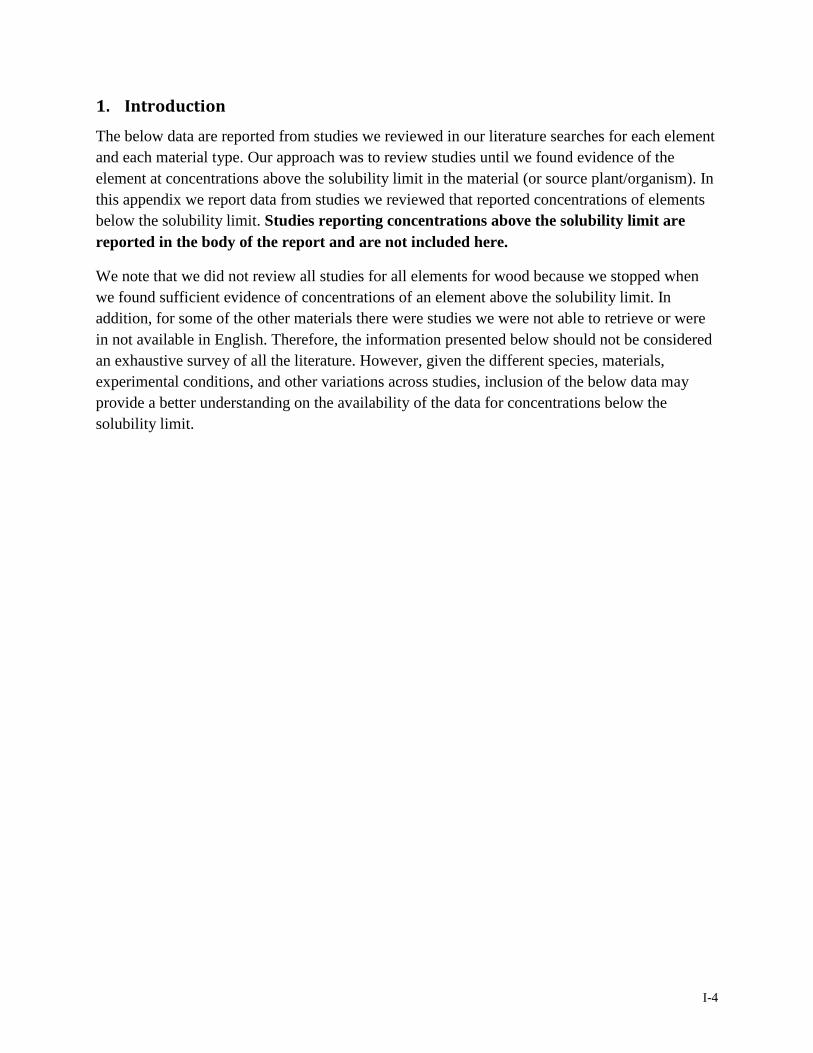
I-4
1. Introduction
The below data are reported from studies we reviewed in our literature searches for each element and each material type. Our approach was to review studies until we found evidence of the element at concentrations above the solubility limit in the material (or source plant/organism). In this appendix we report data from studies we reviewed that reported concentrations of elements below the solubility limit. Studies reporting concentrations above the solubility limit are reported in the body of the report and are not included here.
We note that we did not review all studies for all elements for wood because we stopped when we found sufficient evidence of concentrations of an element above the solubility limit. In addition, for some of the other materials there were studies we were not able to retrieve or were in not available in English. Therefore, the information presented below should not be considered an exhaustive survey of all the literature. However, given the different species, materials, experimental conditions, and other variations across studies, inclusion of the below data may provide a better understanding on the availability of the data for concentrations below the solubility limit.
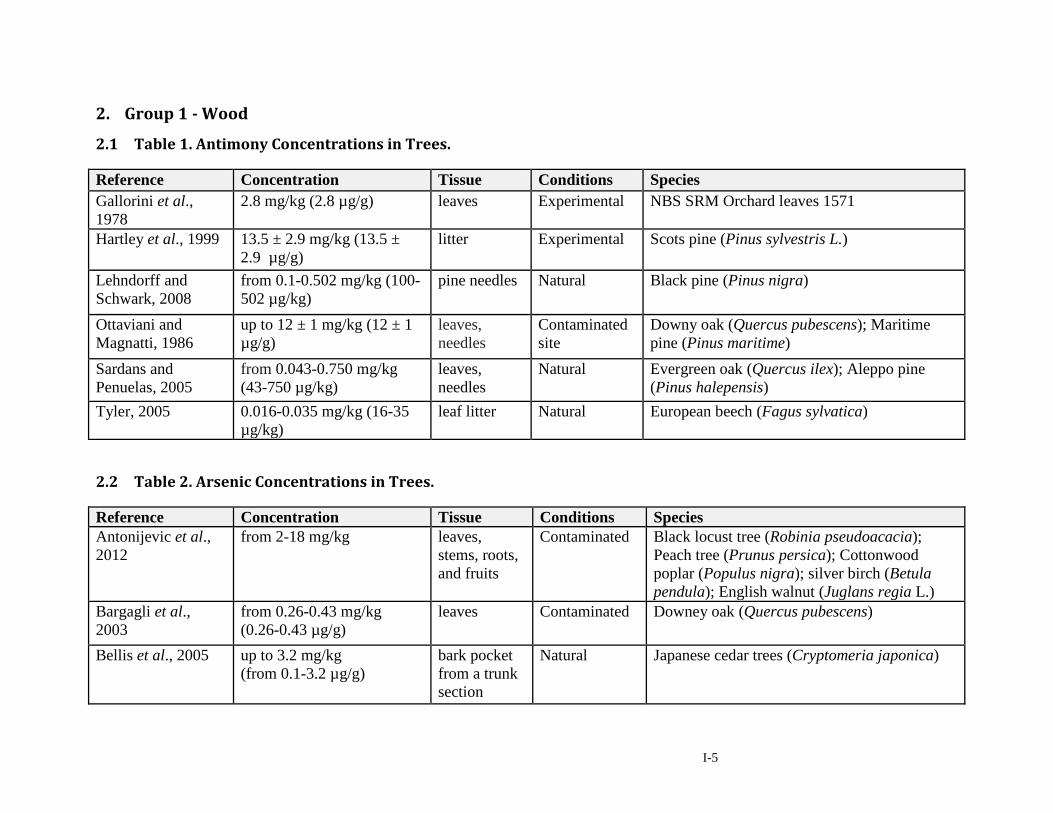
I-5
2. Group 1 - Wood
2.1 Table 1. Antimony Concentrations in Trees.
Reference Concentration Tissue Conditions Species Gallorini et al., 1978
2.8 mg/kg (2.8 µg/g) leaves Experimental NBS SRM Orchard leaves 1571
Hartley et al., 1999 13.5 ± 2.9 mg/kg (13.5 ± 2.9 µg/g)
litter Experimental Scots pine (Pinus sylvestris L.)
Lehndorff and Schwark, 2008
from 0.1-0.502 mg/kg (100-502 µg/kg)
pine needles Natural Black pine (Pinus nigra)
Ottaviani and Magnatti, 1986
up to 12 ± 1 mg/kg (12 ± 1 µg/g)
leaves, needles
Contaminated site
Downy oak (Quercus pubescens); Maritime pine (Pinus maritime)
Sardans and Penuelas, 2005
from 0.043-0.750 mg/kg (43-750 µg/kg)
leaves, needles
Natural Evergreen oak (Quercus ilex); Aleppo pine (Pinus halepensis)
Tyler, 2005 0.016-0.035 mg/kg (16-35 µg/kg)
leaf litter Natural European beech (Fagus sylvatica)
2.2 Table 2. Arsenic Concentrations in Trees.
Reference Concentration Tissue Conditions Species Antonijevic et al., 2012
from 2-18 mg/kg leaves, stems, roots, and fruits
Contaminated Black locust tree (Robinia pseudoacacia); Peach tree (Prunus persica); Cottonwood poplar (Populus nigra); silver birch (Betula pendula); English walnut (Juglans regia L.)
Bargagli et al., 2003
from 0.26-0.43 mg/kg (0.26-0.43 µg/g)
leaves Contaminated Downey oak (Quercus pubescens)
Bellis et al., 2005 up to 3.2 mg/kg (from 0.1-3.2 µg/g)
bark pocket from a trunk section
Natural Japanese cedar trees (Cryptomeria japonica)
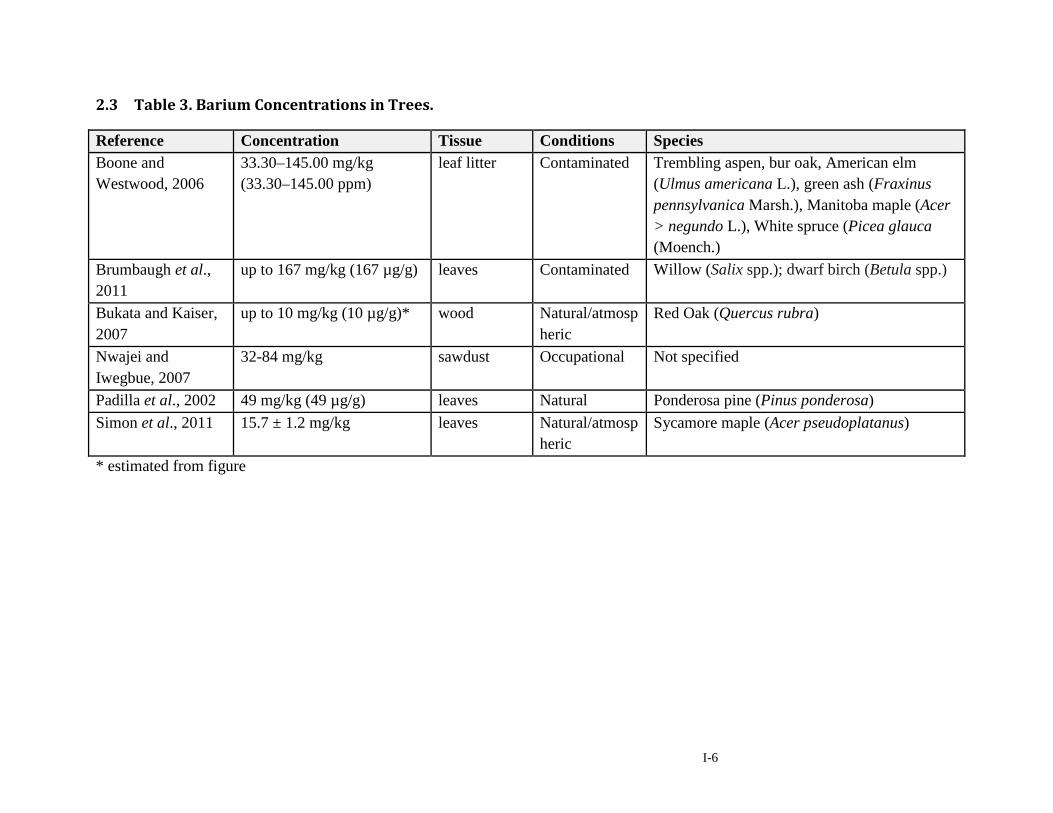
I-6
2.3 Table 3. Barium Concentrations in Trees.
Reference Concentration Tissue Conditions Species Boone and Westwood, 2006
33.30–145.00 mg/kg (33.30–145.00 ppm)
leaf litter Contaminated Trembling aspen, bur oak, American elm (Ulmus americana L.), green ash (Fraxinus pennsylvanica Marsh.), Manitoba maple (Acer > negundo L.), White spruce (Picea glauca (Moench.)
Brumbaugh et al., 2011
up to 167 mg/kg (167 µg/g) leaves Contaminated Willow (Salix spp.); dwarf birch (Betula spp.)
Bukata and Kaiser, 2007
up to 10 mg/kg (10 µg/g)* wood Natural/atmospheric
Red Oak (Quercus rubra)
Nwajei and Iwegbue, 2007
32-84 mg/kg sawdust Occupational Not specified
Padilla et al., 2002 49 mg/kg (49 µg/g) leaves Natural Ponderosa pine (Pinus ponderosa) Simon et al., 2011 15.7 ± 1.2 mg/kg leaves Natural/atmosp
heric Sycamore maple (Acer pseudoplatanus)
* estimated from figure
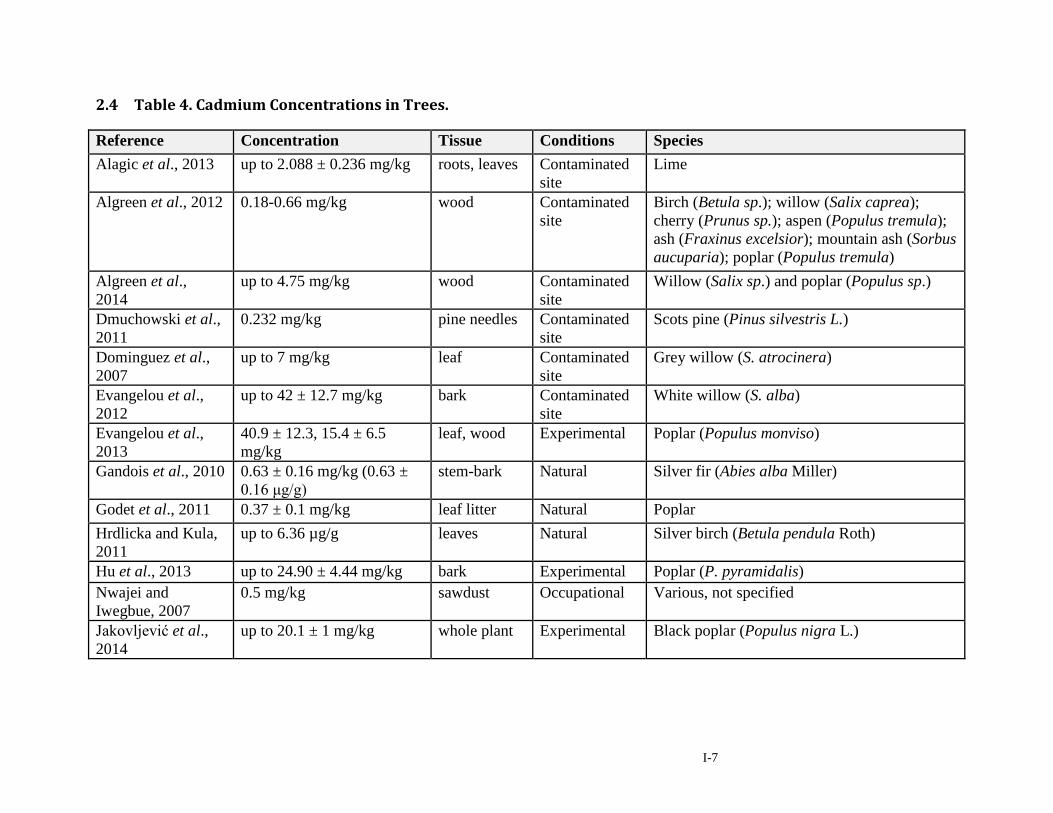
I-7
2.4 Table 4. Cadmium Concentrations in Trees.
Reference Concentration Tissue Conditions Species Alagic et al., 2013 up to 2.088 ± 0.236 mg/kg roots, leaves Contaminated
site Lime
Algreen et al., 2012 0.18-0.66 mg/kg wood Contaminated site
Birch (Betula sp.); willow (Salix caprea); cherry (Prunus sp.); aspen (Populus tremula); ash (Fraxinus excelsior); mountain ash (Sorbus aucuparia); poplar (Populus tremula)
Algreen et al., 2014
up to 4.75 mg/kg wood Contaminated site
Willow (Salix sp.) and poplar (Populus sp.)
Dmuchowski et al., 2011
0.232 mg/kg pine needles Contaminated site
Scots pine (Pinus silvestris L.)
Dominguez et al., 2007
up to 7 mg/kg leaf Contaminated site
Grey willow (S. atrocinera)
Evangelou et al., 2012
up to 42 ± 12.7 mg/kg bark Contaminated site
White willow (S. alba)
Evangelou et al., 2013
40.9 ± 12.3, 15.4 ± 6.5 mg/kg
leaf, wood Experimental Poplar (Populus monviso)
Gandois et al., 2010 0.63 ± 0.16 mg/kg (0.63 ± 0.16 μg/g)
stem-bark Natural Silver fir (Abies alba Miller)
Godet et al., 2011 0.37 ± 0.1 mg/kg leaf litter Natural Poplar Hrdlicka and Kula, 2011
up to 6.36 µg/g leaves Natural Silver birch (Betula pendula Roth)
Hu et al., 2013 up to 24.90 ± 4.44 mg/kg bark Experimental Poplar (P. pyramidalis) Nwajei and Iwegbue, 2007
0.5 mg/kg sawdust Occupational Various, not specified
Jakovljević et al., 2014
up to 20.1 ± 1 mg/kg whole plant Experimental Black poplar (Populus nigra L.)
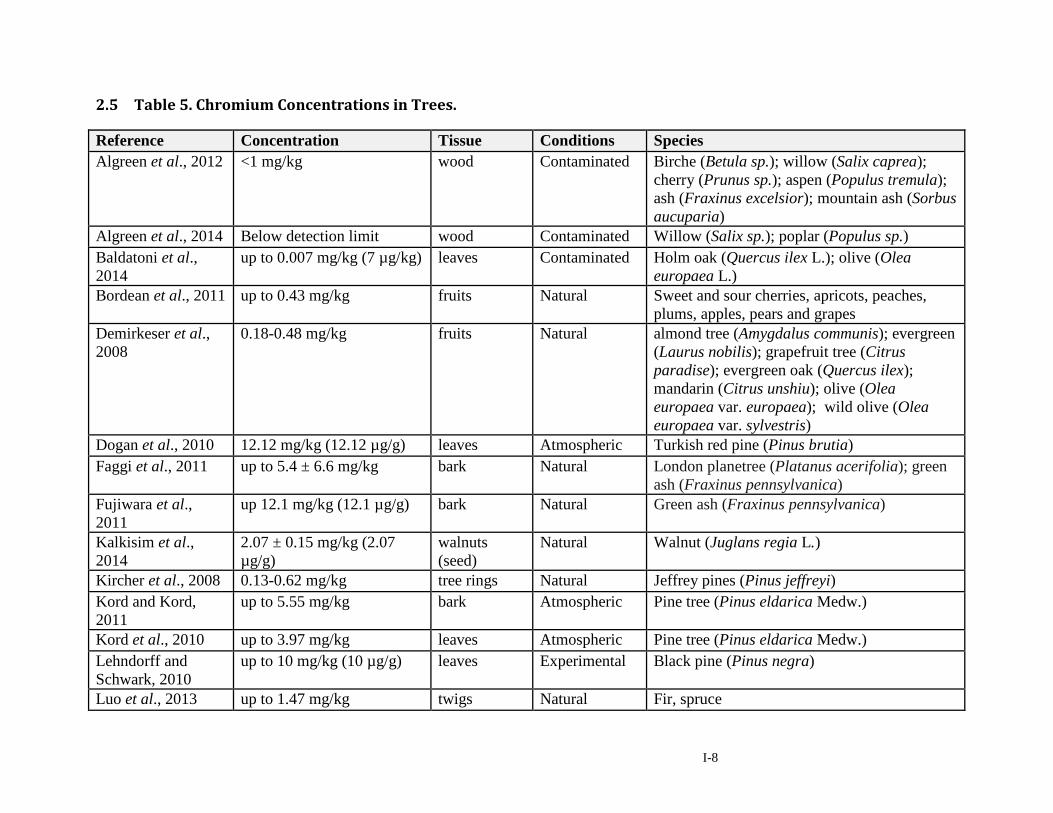
I-8
2.5 Table 5. Chromium Concentrations in Trees.
Reference Concentration Tissue Conditions Species Algreen et al., 2012 <1 mg/kg wood Contaminated Birche (Betula sp.); willow (Salix caprea);
cherry (Prunus sp.); aspen (Populus tremula); ash (Fraxinus excelsior); mountain ash (Sorbus aucuparia)
Algreen et al., 2014 Below detection limit wood Contaminated Willow (Salix sp.); poplar (Populus sp.) Baldatoni et al., 2014
up to 0.007 mg/kg (7 µg/kg) leaves Contaminated Holm oak (Quercus ilex L.); olive (Olea europaea L.)
Bordean et al., 2011 up to 0.43 mg/kg fruits Natural Sweet and sour cherries, apricots, peaches, plums, apples, pears and grapes
Demirkeser et al., 2008
0.18-0.48 mg/kg fruits Natural almond tree (Amygdalus communis); evergreen (Laurus nobilis); grapefruit tree (Citrus paradise); evergreen oak (Quercus ilex); mandarin (Citrus unshiu); olive (Olea europaea var. europaea); wild olive (Olea europaea var. sylvestris)
Dogan et al., 2010 12.12 mg/kg (12.12 µg/g) leaves Atmospheric Turkish red pine (Pinus brutia) Faggi et al., 2011 up to 5.4 ± 6.6 mg/kg bark Natural London planetree (Platanus acerifolia); green
ash (Fraxinus pennsylvanica) Fujiwara et al., 2011
up 12.1 mg/kg (12.1 µg/g) bark Natural Green ash (Fraxinus pennsylvanica)
Kalkisim et al., 2014
2.07 ± 0.15 mg/kg (2.07 µg/g)
walnuts (seed)
Natural Walnut (Juglans regia L.)
Kircher et al., 2008 0.13-0.62 mg/kg tree rings Natural Jeffrey pines (Pinus jeffreyi) Kord and Kord, 2011
up to 5.55 mg/kg bark Atmospheric Pine tree (Pinus eldarica Medw.)
Kord et al., 2010 up to 3.97 mg/kg leaves Atmospheric Pine tree (Pinus eldarica Medw.) Lehndorff and Schwark, 2010
up to 10 mg/kg (10 µg/g) leaves Experimental Black pine (Pinus negra)
Luo et al., 2013 up to 1.47 mg/kg twigs Natural Fir, spruce
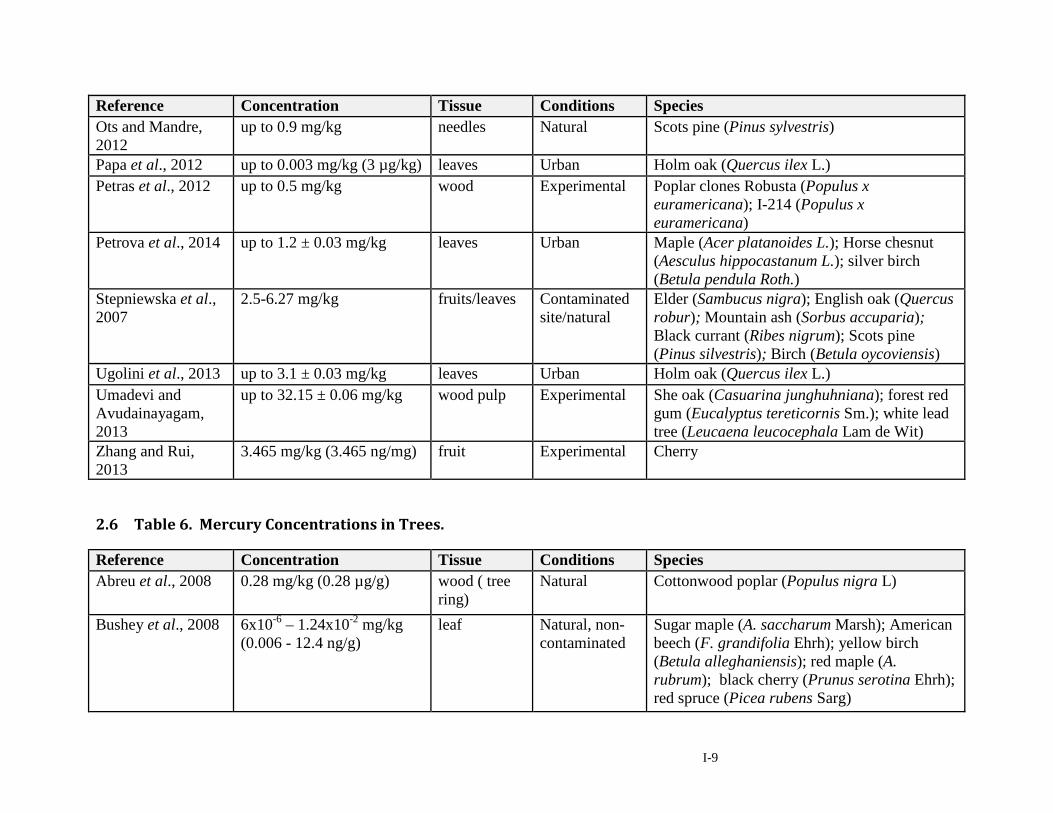
I-9
Reference Concentration Tissue Conditions Species Ots and Mandre, 2012
up to 0.9 mg/kg needles Natural Scots pine (Pinus sylvestris)
Papa et al., 2012 up to 0.003 mg/kg (3 µg/kg) leaves Urban Holm oak (Quercus ilex L.) Petras et al., 2012 up to 0.5 mg/kg wood Experimental Poplar clones Robusta (Populus x
euramericana); I-214 (Populus x euramericana)
Petrova et al., 2014 up to 1.2 ± 0.03 mg/kg leaves Urban Maple (Acer platanoides L.); Horse chesnut (Aesculus hippocastanum L.); silver birch (Betula pendula Roth.)
Stepniewska et al., 2007
2.5-6.27 mg/kg fruits/leaves Contaminated site/natural
Elder (Sambucus nigra); English oak (Quercus robur); Mountain ash (Sorbus accuparia); Black currant (Ribes nigrum); Scots pine (Pinus silvestris); Birch (Betula oycoviensis)
Ugolini et al., 2013 up to 3.1 ± 0.03 mg/kg leaves Urban Holm oak (Quercus ilex L.) Umadevi and Avudainayagam, 2013
up to 32.15 ± 0.06 mg/kg wood pulp Experimental She oak (Casuarina junghuhniana); forest red gum (Eucalyptus tereticornis Sm.); white lead tree (Leucaena leucocephala Lam de Wit)
Zhang and Rui, 2013
3.465 mg/kg (3.465 ng/mg) fruit Experimental Cherry
2.6 Table 6. Mercury Concentrations in Trees.
Reference Concentration Tissue Conditions Species Abreu et al., 2008 0.28 mg/kg (0.28 µg/g) wood ( tree
ring) Natural Cottonwood poplar (Populus nigra L)
Bushey et al., 2008 6x10⁻⁶ – 1.24x10⁻² mg/kg (0.006 - 12.4 ng/g)
leaf Natural, non-contaminated
Sugar maple (A. saccharum Marsh); American beech (F. grandifolia Ehrh); yellow birch (Betula alleghaniensis); red maple (A. rubrum); black cherry (Prunus serotina Ehrh); red spruce (Picea rubens Sarg)
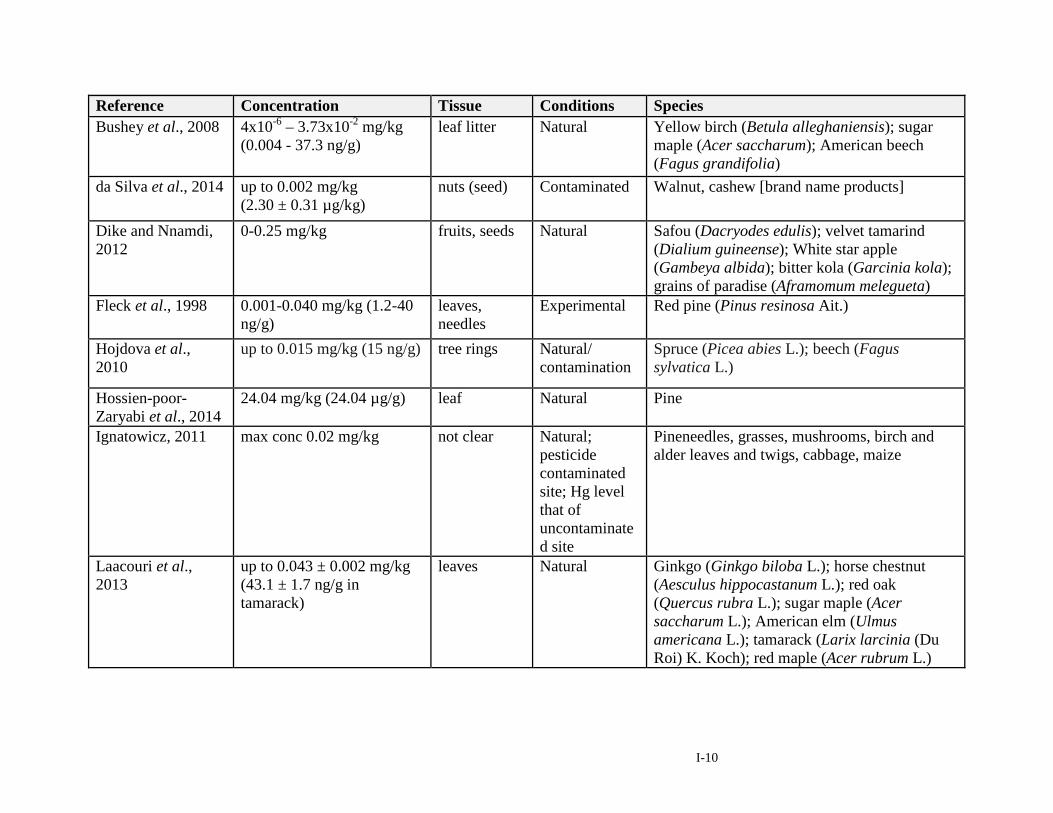
I-10
Reference Concentration Tissue Conditions Species Bushey et al., 2008 4x10⁻⁶ – 3.73x10⁻² mg/kg
(0.004 - 37.3 ng/g) leaf litter Natural Yellow birch (Betula alleghaniensis); sugar
maple (Acer saccharum); American beech (Fagus grandifolia)
da Silva et al., 2014 up to 0.002 mg/kg (2.30 ± 0.31 µg/kg)
nuts (seed) Contaminated Walnut, cashew [brand name products]
Dike and Nnamdi, 2012
0-0.25 mg/kg fruits, seeds Natural Safou (Dacryodes edulis); velvet tamarind (Dialium guineense); White star apple (Gambeya albida); bitter kola (Garcinia kola); grains of paradise (Aframomum melegueta)
Fleck et al., 1998 0.001-0.040 mg/kg (1.2-40 ng/g)
leaves, needles
Experimental Red pine (Pinus resinosa Ait.)
Hojdova et al., 2010
up to 0.015 mg/kg (15 ng/g) tree rings Natural/ contamination
Spruce (Picea abies L.); beech (Fagus sylvatica L.)
Hossien-poor-Zaryabi et al., 2014
24.04 mg/kg (24.04 µg/g) leaf Natural Pine
Ignatowicz, 2011 max conc 0.02 mg/kg not clear Natural; pesticide contaminated site; Hg level that of uncontaminated site
Pineneedles, grasses, mushrooms, birch and alder leaves and twigs, cabbage, maize
Laacouri et al., 2013
up to 0.043 ± 0.002 mg/kg (43.1 ± 1.7 ng/g in tamarack)
leaves Natural Ginkgo (Ginkgo biloba L.); horse chestnut (Aesculus hippocastanum L.); red oak (Quercus rubra L.); sugar maple (Acer saccharum L.); American elm (Ulmus americana L.); tamarack (Larix larcinia (Du Roi) K. Koch); red maple (Acer rubrum L.)
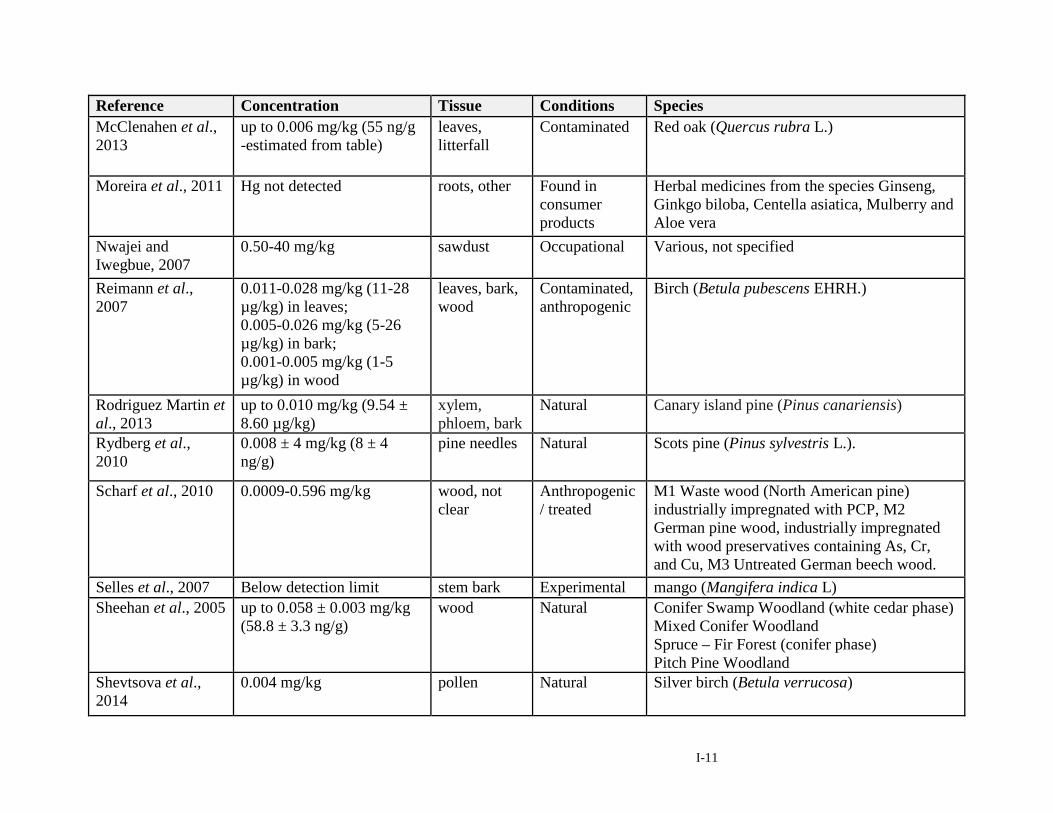
I-11
Reference Concentration Tissue Conditions Species McClenahen et al., 2013
up to 0.006 mg/kg (55 ng/g -estimated from table)
leaves, litterfall
Contaminated Red oak (Quercus rubra L.)
Moreira et al., 2011 Hg not detected roots, other Found in consumer products
Herbal medicines from the species Ginseng, Ginkgo biloba, Centella asiatica, Mulberry and Aloe vera
Nwajei and Iwegbue, 2007
0.50-40 mg/kg sawdust Occupational Various, not specified
Reimann et al., 2007
0.011-0.028 mg/kg (11-28 µg/kg) in leaves; 0.005-0.026 mg/kg (5-26 µg/kg) in bark; 0.001-0.005 mg/kg (1-5 µg/kg) in wood
leaves, bark, wood
Contaminated, anthropogenic
Birch (Betula pubescens EHRH.)
Rodriguez Martin et al., 2013
up to 0.010 mg/kg (9.54 ± 8.60 µg/kg)
xylem, phloem, bark
Natural Canary island pine (Pinus canariensis)
Rydberg et al., 2010
0.008 ± 4 mg/kg (8 ± 4 ng/g)
pine needles Natural Scots pine (Pinus sylvestris L.).
Scharf et al., 2010 0.0009-0.596 mg/kg wood, not clear
Anthropogenic/ treated
M1 Waste wood (North American pine) industrially impregnated with PCP, M2 German pine wood, industrially impregnated with wood preservatives containing As, Cr, and Cu, M3 Untreated German beech wood.
Selles et al., 2007 Below detection limit stem bark Experimental mango (Mangifera indica L) Sheehan et al., 2005 up to 0.058 ± 0.003 mg/kg
(58.8 ± 3.3 ng/g) wood Natural Conifer Swamp Woodland (white cedar phase)
Mixed Conifer Woodland Spruce – Fir Forest (conifer phase) Pitch Pine Woodland
Shevtsova et al., 2014
0.004 mg/kg pollen Natural Silver birch (Betula verrucosa)
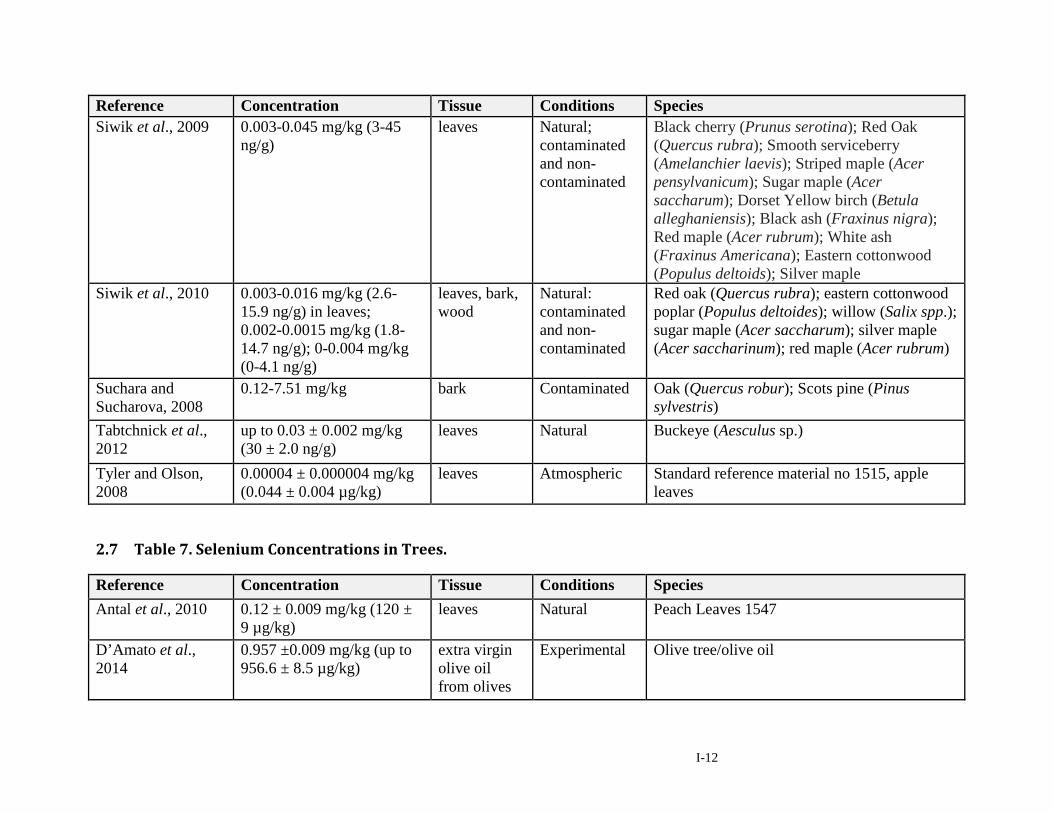
I-12
Reference Concentration Tissue Conditions Species Siwik et al., 2009 0.003-0.045 mg/kg (3-45
ng/g) leaves Natural;
contaminated and non-contaminated
Black cherry (Prunus serotina); Red Oak (Quercus rubra); Smooth serviceberry (Amelanchier laevis); Striped maple (Acer pensylvanicum); Sugar maple (Acer saccharum); Dorset Yellow birch (Betula alleghaniensis); Black ash (Fraxinus nigra); Red maple (Acer rubrum); White ash (Fraxinus Americana); Eastern cottonwood (Populus deltoids); Silver maple
Siwik et al., 2010 0.003-0.016 mg/kg (2.6-15.9 ng/g) in leaves; 0.002-0.0015 mg/kg (1.8-14.7 ng/g); 0-0.004 mg/kg (0-4.1 ng/g)
leaves, bark, wood
Natural: contaminated and non-contaminated
Red oak (Quercus rubra); eastern cottonwood poplar (Populus deltoides); willow (Salix spp.); sugar maple (Acer saccharum); silver maple (Acer saccharinum); red maple (Acer rubrum)
Suchara and Sucharova, 2008
0.12-7.51 mg/kg bark Contaminated Oak (Quercus robur); Scots pine (Pinus sylvestris)
Tabtchnick et al., 2012
up to 0.03 ± 0.002 mg/kg (30 ± 2.0 ng/g)
leaves Natural Buckeye (Aesculus sp.)
Tyler and Olson, 2008
0.00004 ± 0.000004 mg/kg (0.044 ± 0.004 µg/kg)
leaves Atmospheric Standard reference material no 1515, apple leaves
2.7 Table 7. Selenium Concentrations in Trees.
Reference Concentration Tissue Conditions Species Antal et al., 2010 0.12 ± 0.009 mg/kg (120 ±
9 µg/kg) leaves Natural Peach Leaves 1547
D’Amato et al., 2014
0.957 ±0.009 mg/kg (up to 956.6 ± 8.5 µg/kg)
extra virgin olive oil from olives
Experimental Olive tree/olive oil
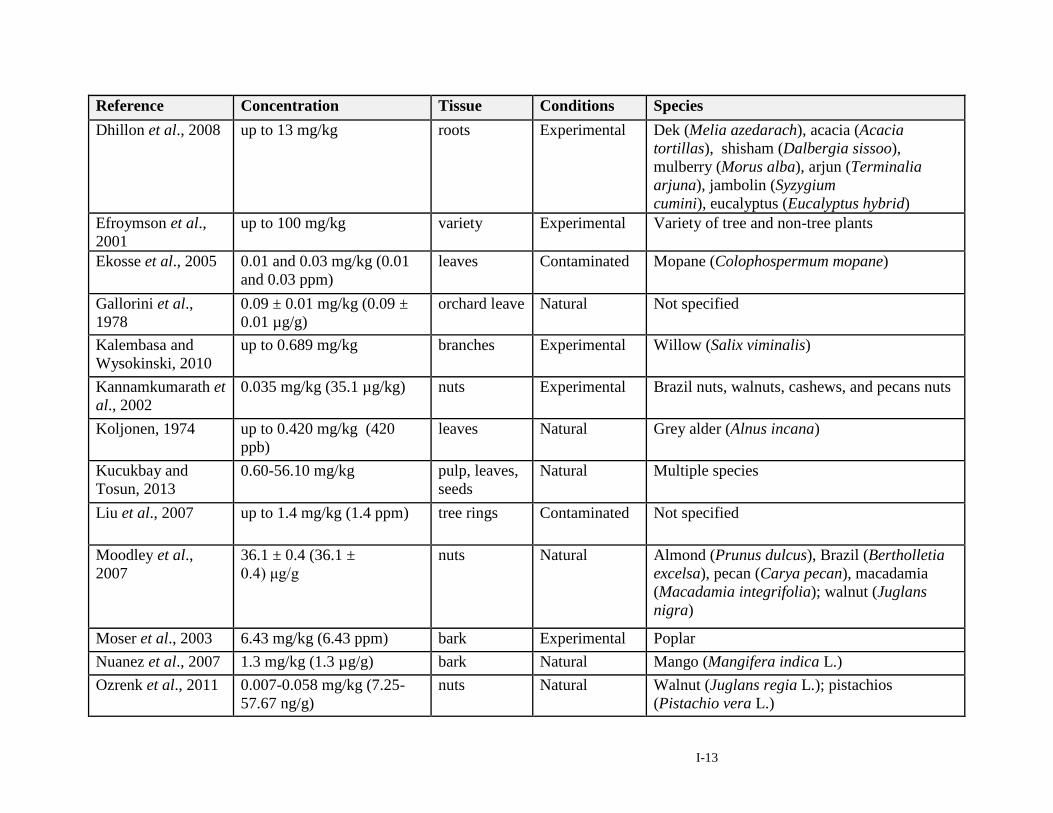
I-13
Reference Concentration Tissue Conditions Species Dhillon et al., 2008 up to 13 mg/kg roots Experimental Dek (Melia azedarach), acacia (Acacia
tortillas), shisham (Dalbergia sissoo), mulberry (Morus alba), arjun (Terminalia arjuna), jambolin (Syzygium cumini), eucalyptus (Eucalyptus hybrid)
Efroymson et al., 2001
up to 100 mg/kg variety Experimental Variety of tree and non-tree plants
Ekosse et al., 2005 0.01 and 0.03 mg/kg (0.01 and 0.03 ppm)
leaves Contaminated Mopane (Colophospermum mopane)
Gallorini et al., 1978
0.09 ± 0.01 mg/kg (0.09 ± 0.01 µg/g)
orchard leave Natural Not specified
Kalembasa and Wysokinski, 2010
up to 0.689 mg/kg branches Experimental Willow (Salix viminalis)
Kannamkumarath et al., 2002
0.035 mg/kg (35.1 µg/kg) nuts Experimental Brazil nuts, walnuts, cashews, and pecans nuts
Koljonen, 1974 up to 0.420 mg/kg (420 ppb)
leaves Natural Grey alder (Alnus incana)
Kucukbay and Tosun, 2013
0.60-56.10 mg/kg pulp, leaves, seeds
Natural Multiple species
Liu et al., 2007 up to 1.4 mg/kg (1.4 ppm) tree rings Contaminated Not specified
Moodley et al., 2007
36.1 ± 0.4 (36.1 ± 0.4) μg/g
nuts Natural Almond (Prunus dulcus), Brazil (Bertholletia excelsa), pecan (Carya pecan), macadamia (Macadamia integrifolia); walnut (Juglans nigra)
Moser et al., 2003 6.43 mg/kg (6.43 ppm) bark Experimental Poplar Nuanez et al., 2007 1.3 mg/kg (1.3 µg/g) bark Natural Mango (Mangifera indica L.) Ozrenk et al., 2011 0.007-0.058 mg/kg (7.25-
57.67 ng/g) nuts Natural Walnut (Juglans regia L.); pistachios
(Pistachio vera L.)
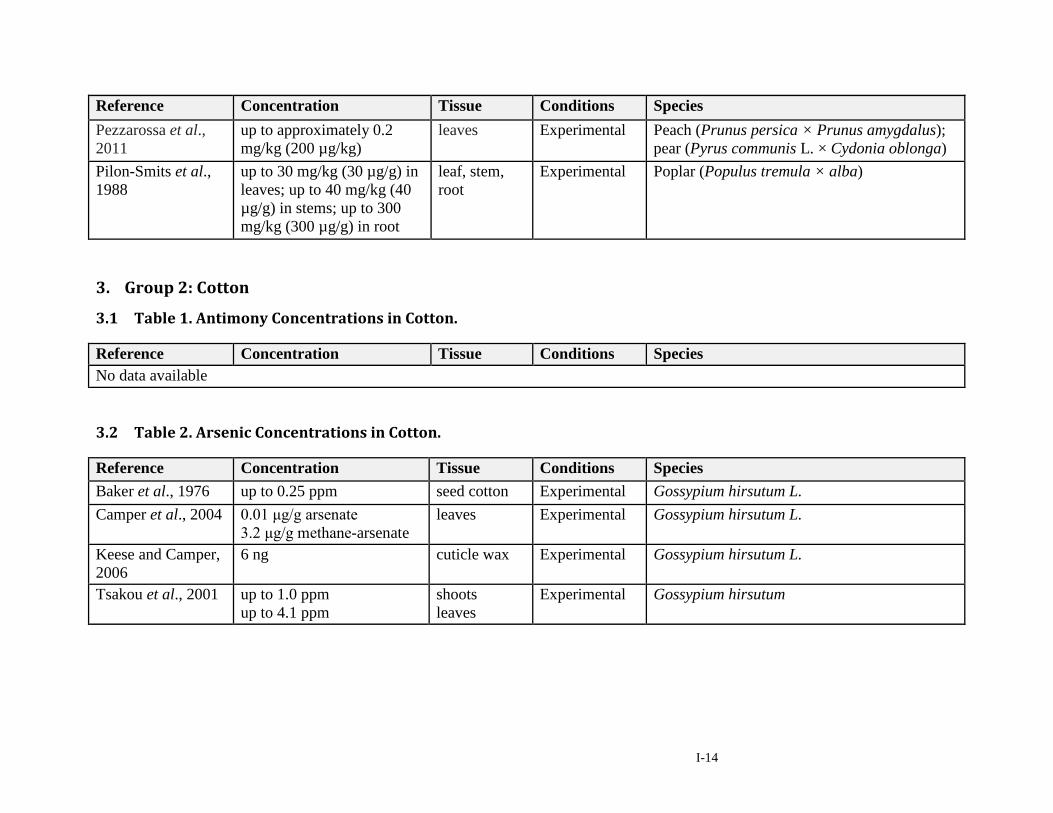
I-14
Reference Concentration Tissue Conditions Species Pezzarossa et al., 2011
up to approximately 0.2 mg/kg (200 µg/kg)
leaves Experimental Peach (Prunus persica × Prunus amygdalus); pear (Pyrus communis L. × Cydonia oblonga)
Pilon-Smits et al., 1988
up to 30 mg/kg (30 µg/g) in leaves; up to 40 mg/kg (40 µg/g) in stems; up to 300 mg/kg (300 µg/g) in root
leaf, stem, root
Experimental Poplar (Populus tremula × alba)
3. Group 2: Cotton
3.1 Table 1. Antimony Concentrations in Cotton.
Reference Concentration Tissue Conditions Species No data available
3.2 Table 2. Arsenic Concentrations in Cotton.
Reference Concentration Tissue Conditions Species Baker et al., 1976 up to 0.25 ppm seed cotton Experimental Gossypium hirsutum L. Camper et al., 2004 0.01 μg/g arsenate
3.2 μg/g methane-arsenate leaves Experimental Gossypium hirsutum L.
Keese and Camper, 2006
6 ng cuticle wax Experimental Gossypium hirsutum L.
Tsakou et al., 2001 up to 1.0 ppm up to 4.1 ppm
shoots leaves
Experimental Gossypium hirsutum
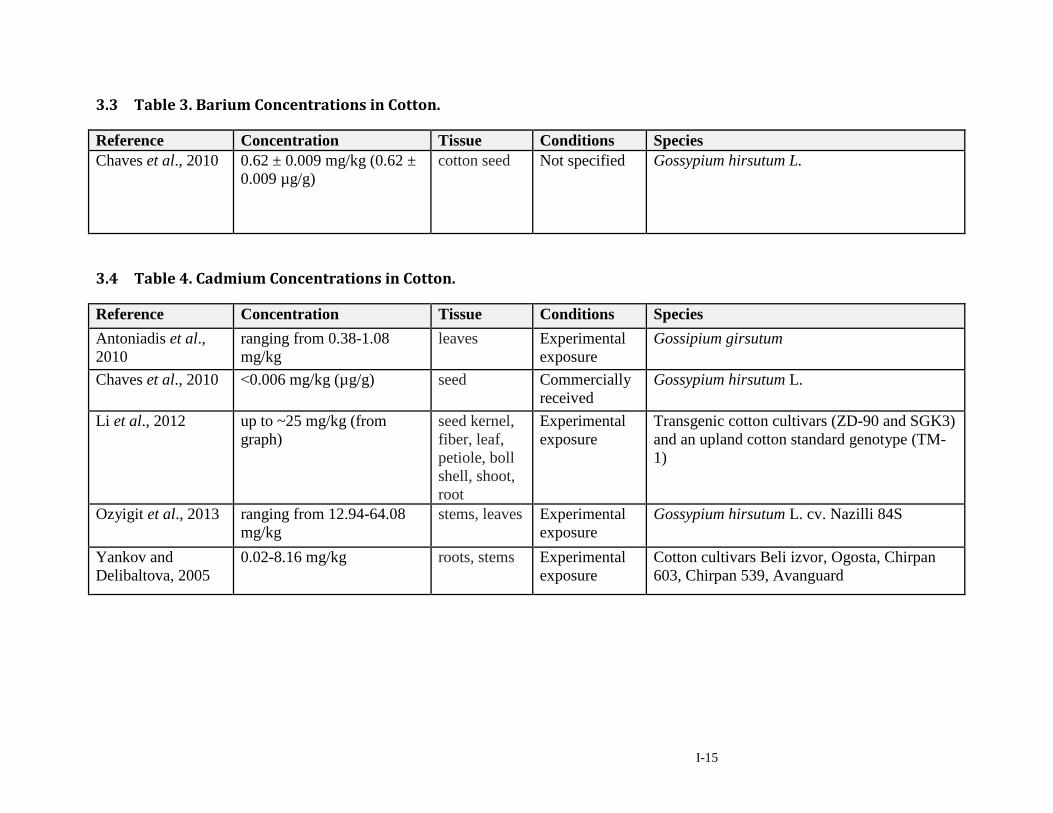
I-15
3.3 Table 3. Barium Concentrations in Cotton.
Reference Concentration Tissue Conditions Species Chaves et al., 2010 0.62 ± 0.009 mg/kg (0.62 ±
0.009 µg/g) cotton seed Not specified Gossypium hirsutum L.
3.4 Table 4. Cadmium Concentrations in Cotton.
Reference Concentration Tissue Conditions Species Antoniadis et al., 2010
ranging from 0.38-1.08 mg/kg
leaves Experimental exposure
Gossipium girsutum
Chaves et al., 2010 ˂0.006 mg/kg (µg/g) seed Commercially received
Gossypium hirsutum L.
Li et al., 2012 up to ~25 mg/kg (from graph)
seed kernel, fiber, leaf, petiole, boll shell, shoot, root
Experimental exposure
Transgenic cotton cultivars (ZD-90 and SGK3) and an upland cotton standard genotype (TM-1)
Ozyigit et al., 2013 ranging from 12.94-64.08 mg/kg
stems, leaves Experimental exposure
Gossypium hirsutum L. cv. Nazilli 84S
Yankov and Delibaltova, 2005
0.02-8.16 mg/kg roots, stems Experimental exposure
Cotton cultivars Beli izvor, Ogosta, Chirpan 603, Chirpan 539, Avanguard
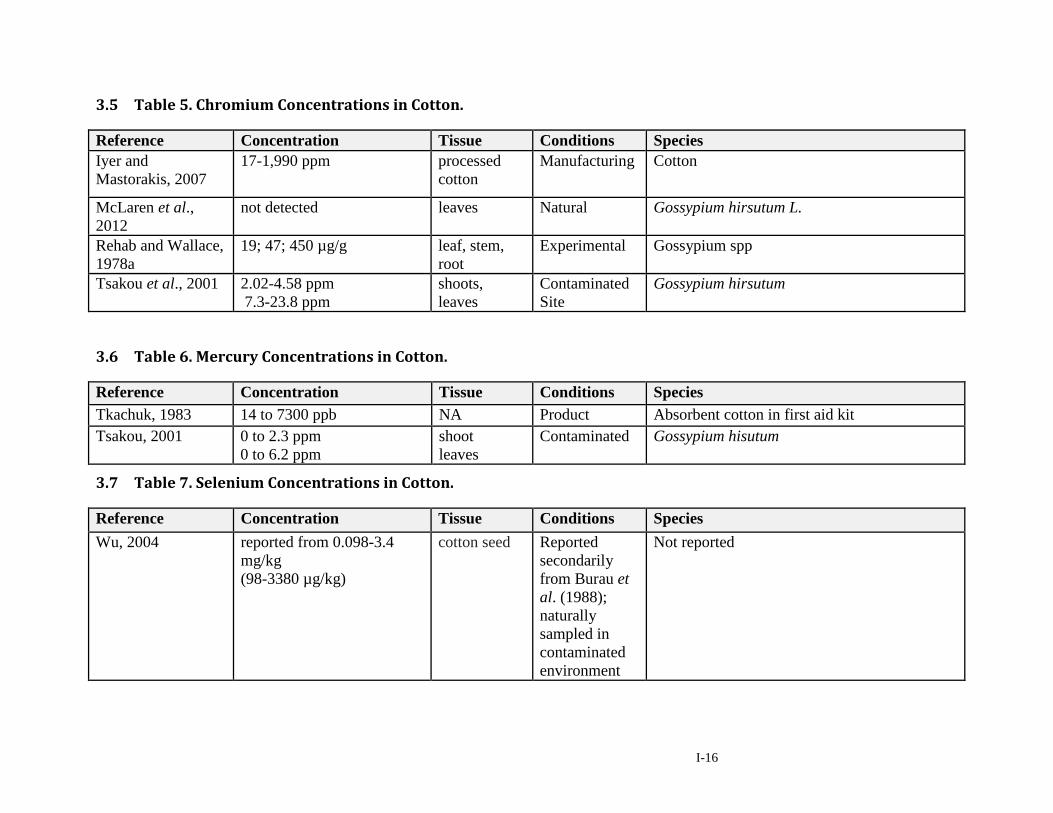
I-16
3.5 Table 5. Chromium Concentrations in Cotton.
Reference Concentration Tissue Conditions Species Iyer and Mastorakis, 2007
17-1,990 ppm processed cotton
Manufacturing Cotton
McLaren et al., 2012
not detected leaves Natural Gossypium hirsutum L.
Rehab and Wallace, 1978a
19; 47; 450 µg/g leaf, stem, root
Experimental Gossypium spp
Tsakou et al., 2001 2.02-4.58 ppm 7.3-23.8 ppm
shoots, leaves
Contaminated Site
Gossypium hirsutum
3.6 Table 6. Mercury Concentrations in Cotton.
Reference Concentration Tissue Conditions Species Tkachuk, 1983 14 to 7300 ppb NA Product Absorbent cotton in first aid kit Tsakou, 2001 0 to 2.3 ppm
0 to 6.2 ppm shoot leaves
Contaminated Gossypium hisutum
3.7 Table 7. Selenium Concentrations in Cotton.
Reference Concentration Tissue Conditions Species Wu, 2004 reported from 0.098-3.4
mg/kg (98-3380 µg/kg)
cotton seed Reported secondarily from Burau et al. (1988); naturally sampled in contaminated environment
Not reported
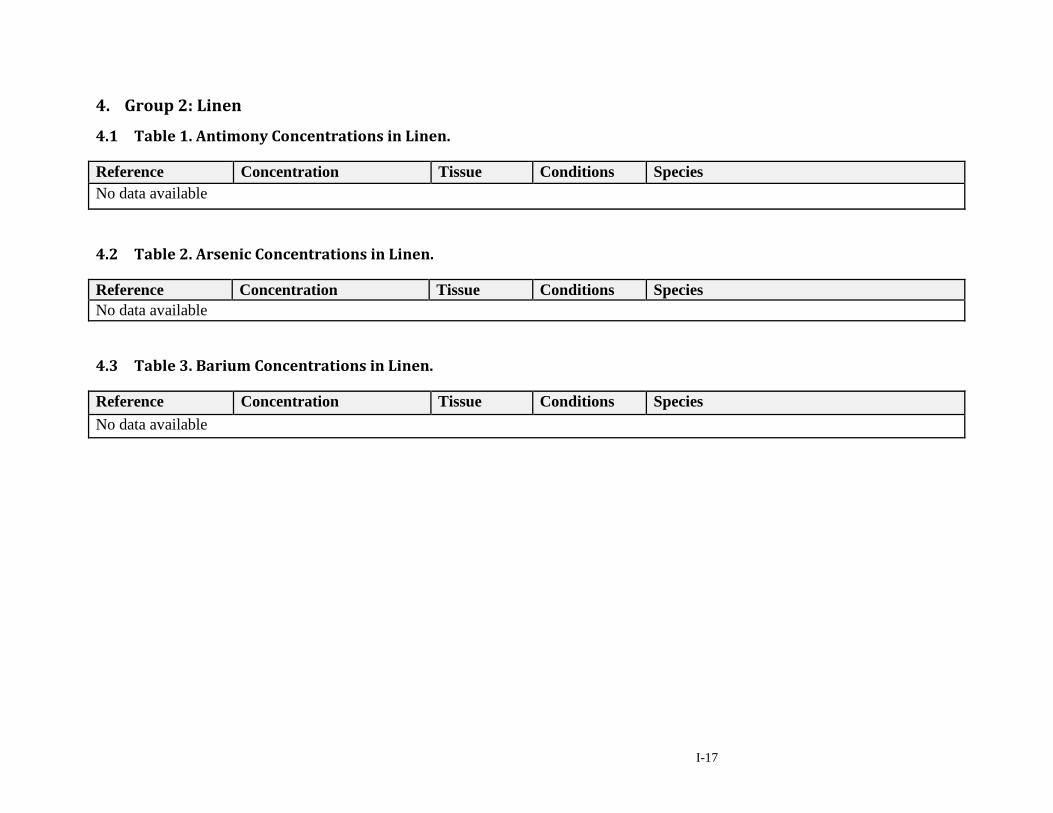
I-17
4. Group 2: Linen
4.1 Table 1. Antimony Concentrations in Linen.
Reference Concentration Tissue Conditions Species No data available
4.2 Table 2. Arsenic Concentrations in Linen.
Reference Concentration Tissue Conditions Species No data available
4.3 Table 3. Barium Concentrations in Linen.
Reference Concentration Tissue Conditions Species No data available
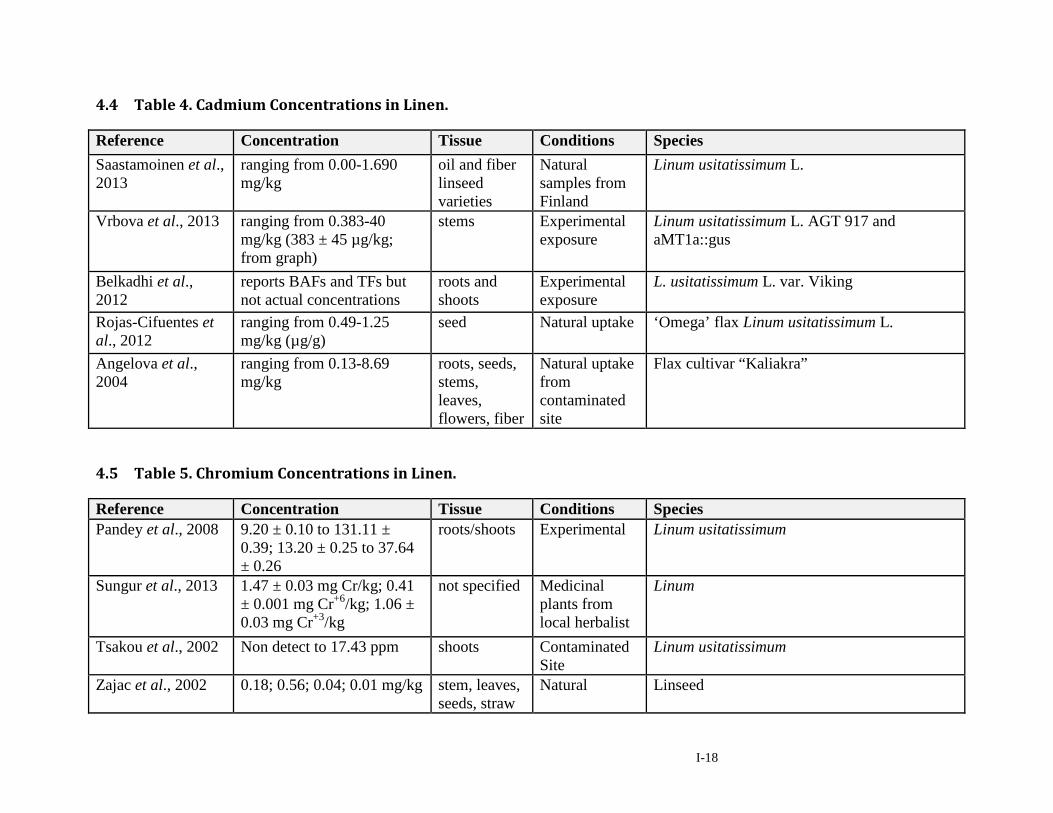
I-18
4.4 Table 4. Cadmium Concentrations in Linen.
Reference Concentration Tissue Conditions Species Saastamoinen et al., 2013
ranging from 0.00-1.690 mg/kg
oil and fiber linseed varieties
Natural samples from Finland
Linum usitatissimum L.
Vrbova et al., 2013 ranging from 0.383-40 mg/kg (383 ± 45 µg/kg; from graph)
stems Experimental exposure
Linum usitatissimum L. AGT 917 and aMT1a::gus
Belkadhi et al., 2012
reports BAFs and TFs but not actual concentrations
roots and shoots
Experimental exposure
L. usitatissimum L. var. Viking
Rojas-Cifuentes et al., 2012
ranging from 0.49-1.25 mg/kg (µg/g)
seed Natural uptake ‘Omega’ flax Linum usitatissimum L.
Angelova et al., 2004
ranging from 0.13-8.69 mg/kg
roots, seeds, stems, leaves, flowers, fiber
Natural uptake from contaminated site
Flax cultivar “Kaliakra”
4.5 Table 5. Chromium Concentrations in Linen.
Reference Concentration Tissue Conditions Species Pandey et al., 2008 9.20 ± 0.10 to 131.11 ±
0.39; 13.20 ± 0.25 to 37.64 ± 0.26
roots/shoots Experimental Linum usitatissimum
Sungur et al., 2013 1.47 ± 0.03 mg Cr/kg; 0.41 ± 0.001 mg Cr+6/kg; 1.06 ± 0.03 mg Cr+3/kg
not specified Medicinal plants from local herbalist
Linum
Tsakou et al., 2002 Non detect to 17.43 ppm shoots Contaminated Site
Linum usitatissimum
Zajac et al., 2002 0.18; 0.56; 0.04; 0.01 mg/kg stem, leaves, seeds, straw
Natural Linseed
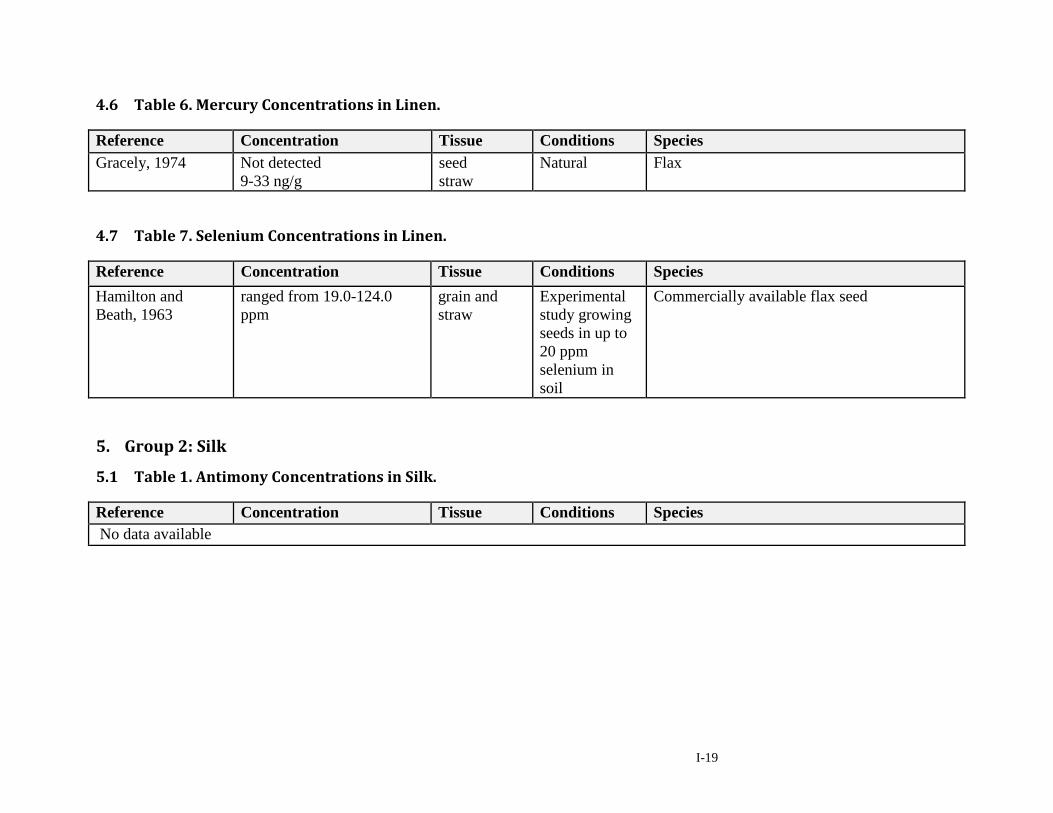
I-19
4.6 Table 6. Mercury Concentrations in Linen.
Reference Concentration Tissue Conditions Species Gracely, 1974 Not detected
9-33 ng/g seed straw
Natural Flax
4.7 Table 7. Selenium Concentrations in Linen.
Reference Concentration Tissue Conditions Species Hamilton and Beath, 1963
ranged from 19.0-124.0 ppm
grain and straw
Experimental study growing seeds in up to 20 ppm selenium in soil
Commercially available flax seed
5. Group 2: Silk
5.1 Table 1. Antimony Concentrations in Silk.
Reference Concentration Tissue Conditions Species No data available
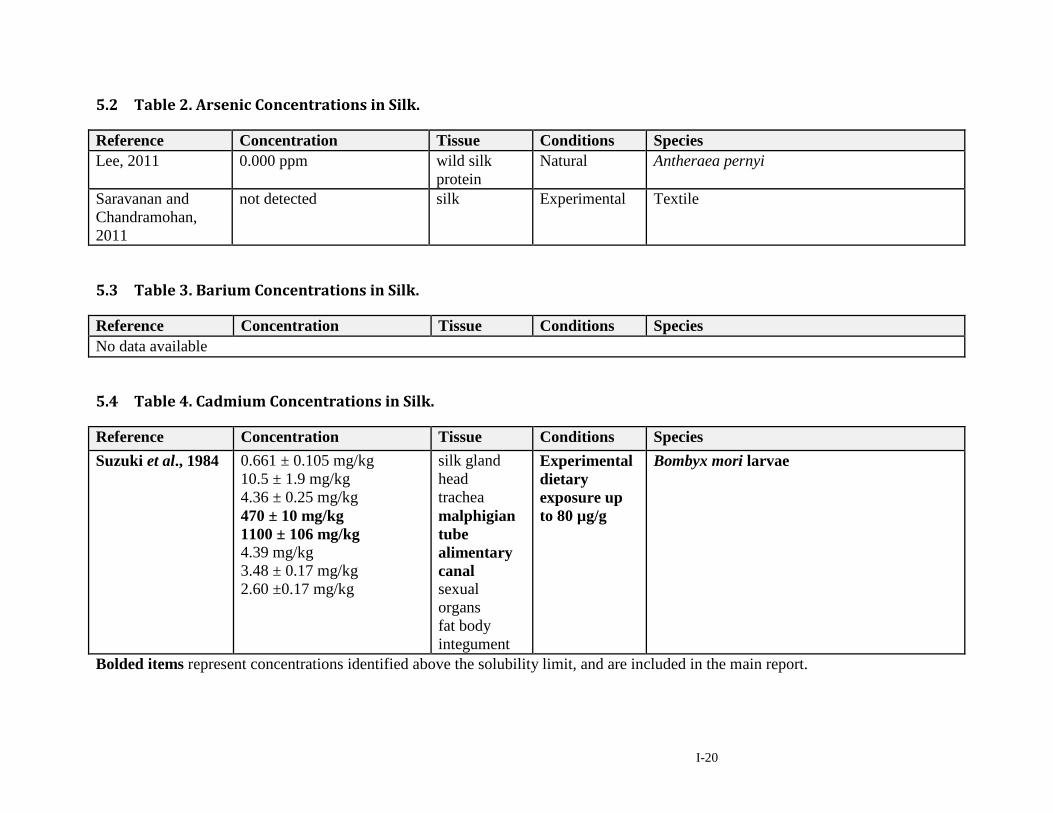
I-20
5.2 Table 2. Arsenic Concentrations in Silk.
Reference Concentration Tissue Conditions Species Lee, 2011 0.000 ppm wild silk
protein Natural Antheraea pernyi
Saravanan and Chandramohan, 2011
not detected silk Experimental Textile
5.3 Table 3. Barium Concentrations in Silk.
Reference Concentration Tissue Conditions Species No data available
5.4 Table 4. Cadmium Concentrations in Silk.
Reference Concentration Tissue Conditions Species Suzuki et al., 1984 0.661 ± 0.105 mg/kg
10.5 ± 1.9 mg/kg 4.36 ± 0.25 mg/kg 470 ± 10 mg/kg 1100 ± 106 mg/kg 4.39 mg/kg 3.48 ± 0.17 mg/kg 2.60 ±0.17 mg/kg
silk gland head trachea malphigian tube alimentary canal sexual organs fat body integument
Experimental dietary exposure up to 80 µg/g
Bombyx mori larvae
Bolded items represent concentrations identified above the solubility limit, and are included in the main report.
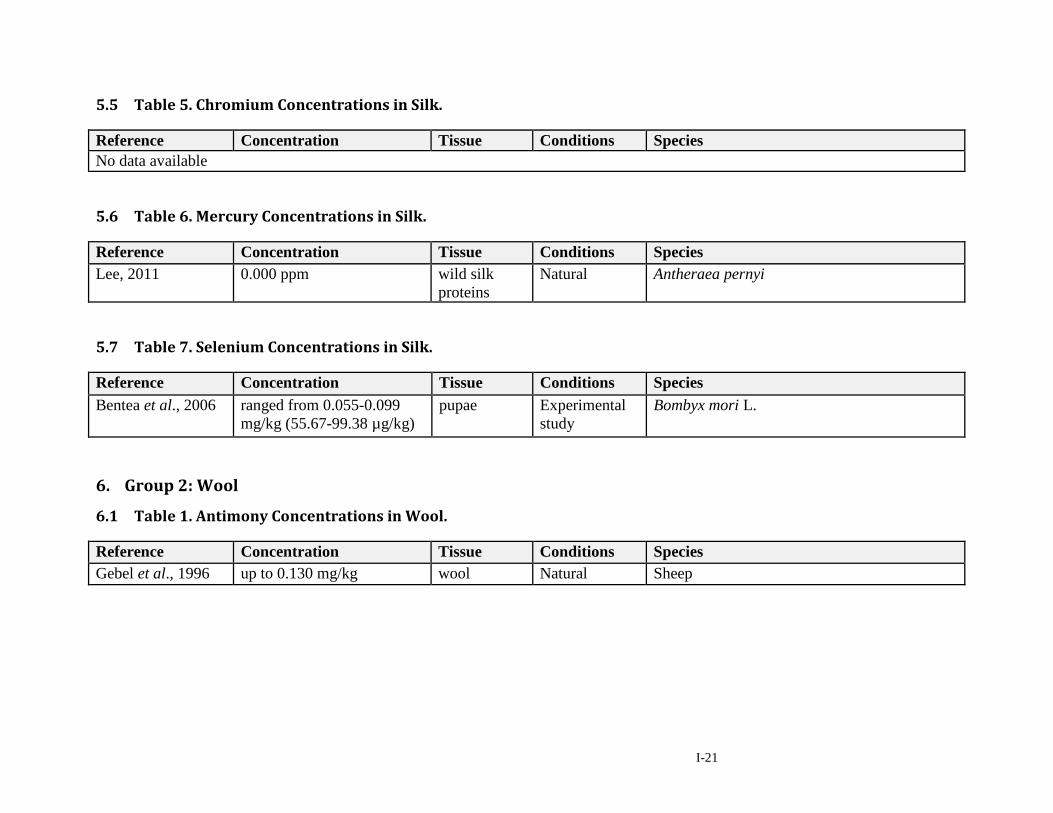
I-21
5.5 Table 5. Chromium Concentrations in Silk.
Reference Concentration Tissue Conditions Species No data available
5.6 Table 6. Mercury Concentrations in Silk.
Reference Concentration Tissue Conditions Species Lee, 2011 0.000 ppm wild silk
proteins Natural Antheraea pernyi
5.7 Table 7. Selenium Concentrations in Silk.
Reference Concentration Tissue Conditions Species Bentea et al., 2006 ranged from 0.055-0.099
mg/kg (55.67-99.38 µg/kg) pupae Experimental
study Bombyx mori L.
6. Group 2: Wool
6.1 Table 1. Antimony Concentrations in Wool.
Reference Concentration Tissue Conditions Species Gebel et al., 1996 up to 0.130 mg/kg wool Natural Sheep
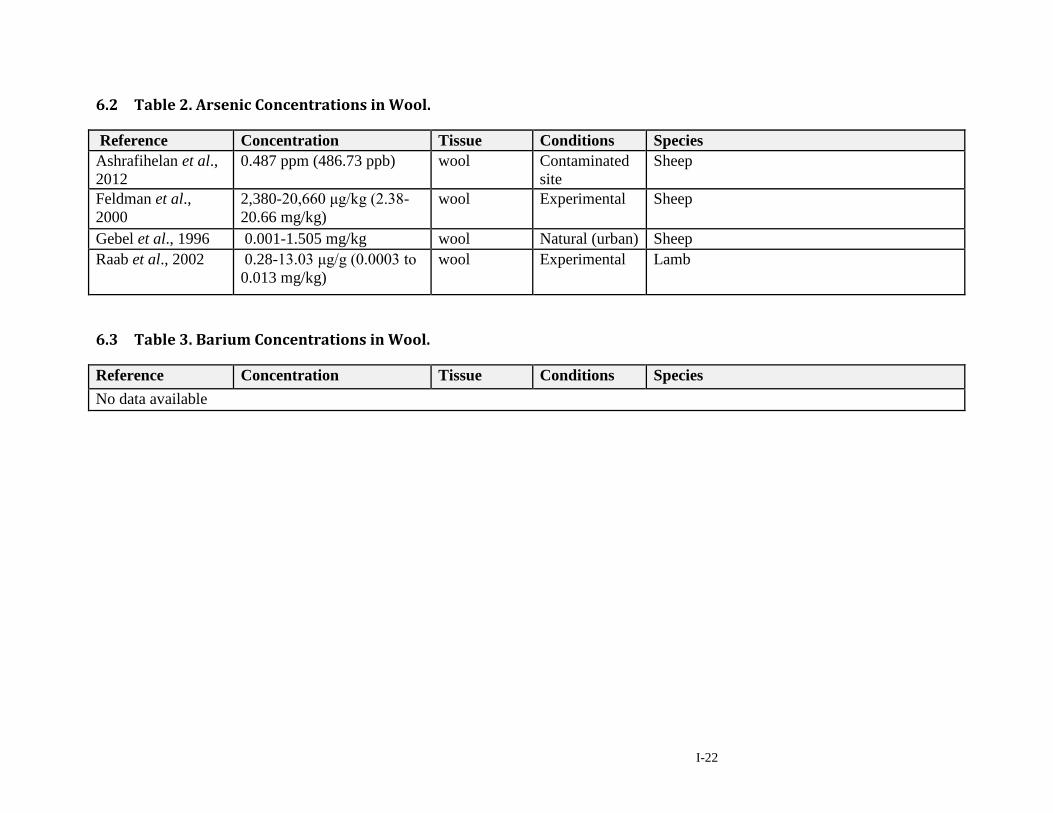
I-22
6.2 Table 2. Arsenic Concentrations in Wool.
Reference Concentration Tissue Conditions Species Ashrafihelan et al., 2012
0.487 ppm (486.73 ppb) wool Contaminated site
Sheep
Feldman et al., 2000
2,380-20,660 μg/kg (2.38-20.66 mg/kg)
wool Experimental Sheep
Gebel et al., 1996 0.001-1.505 mg/kg wool Natural (urban) Sheep Raab et al., 2002 0.28-13.03 μg/g (0.0003 to
0.013 mg/kg) wool Experimental Lamb
6.3 Table 3. Barium Concentrations in Wool.
Reference Concentration Tissue Conditions Species No data available
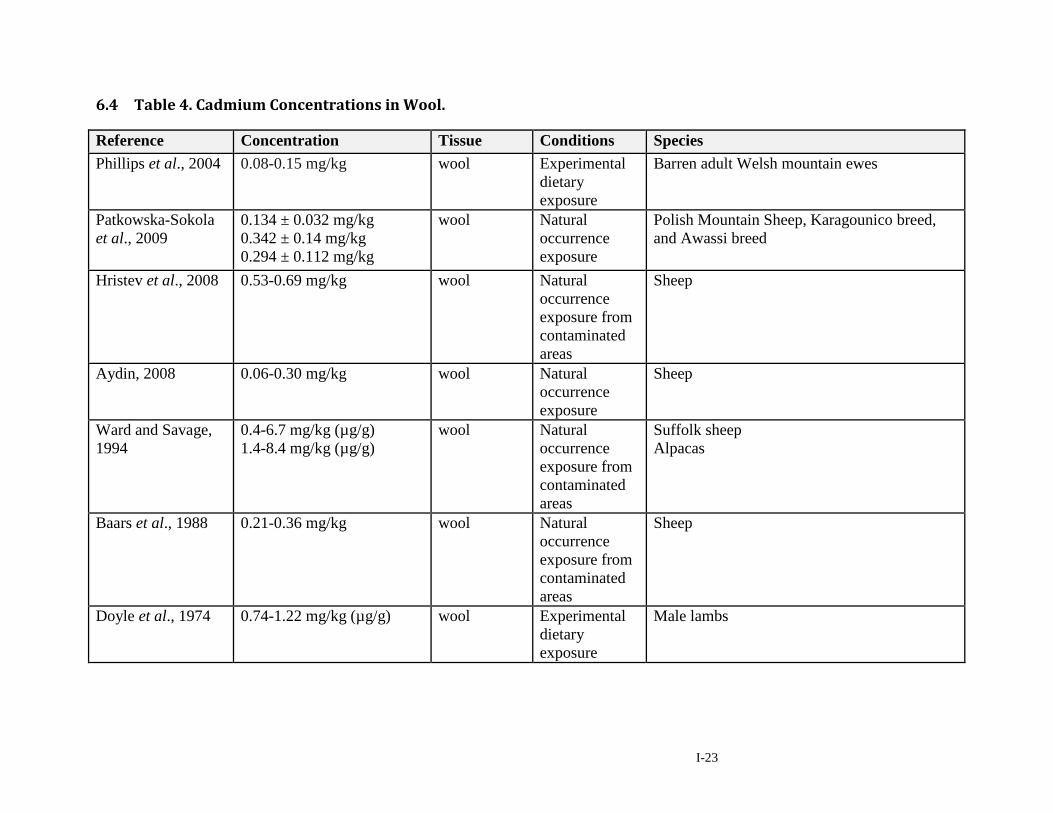
I-23
6.4 Table 4. Cadmium Concentrations in Wool.
Reference Concentration Tissue Conditions Species Phillips et al., 2004 0.08-0.15 mg/kg wool Experimental
dietary exposure
Barren adult Welsh mountain ewes
Patkowska-Sokola et al., 2009
0.134 ± 0.032 mg/kg 0.342 ± 0.14 mg/kg 0.294 ± 0.112 mg/kg
wool Natural occurrence exposure
Polish Mountain Sheep, Karagounico breed, and Awassi breed
Hristev et al., 2008 0.53-0.69 mg/kg wool Natural occurrence exposure from contaminated areas
Sheep
Aydin, 2008 0.06-0.30 mg/kg wool Natural occurrence exposure
Sheep
Ward and Savage, 1994
0.4-6.7 mg/kg (µg/g) 1.4-8.4 mg/kg (µg/g)
wool Natural occurrence exposure from contaminated areas
Suffolk sheep Alpacas
Baars et al., 1988 0.21-0.36 mg/kg wool Natural occurrence exposure from contaminated areas
Sheep
Doyle et al., 1974 0.74-1.22 mg/kg (µg/g) wool Experimental dietary exposure
Male lambs
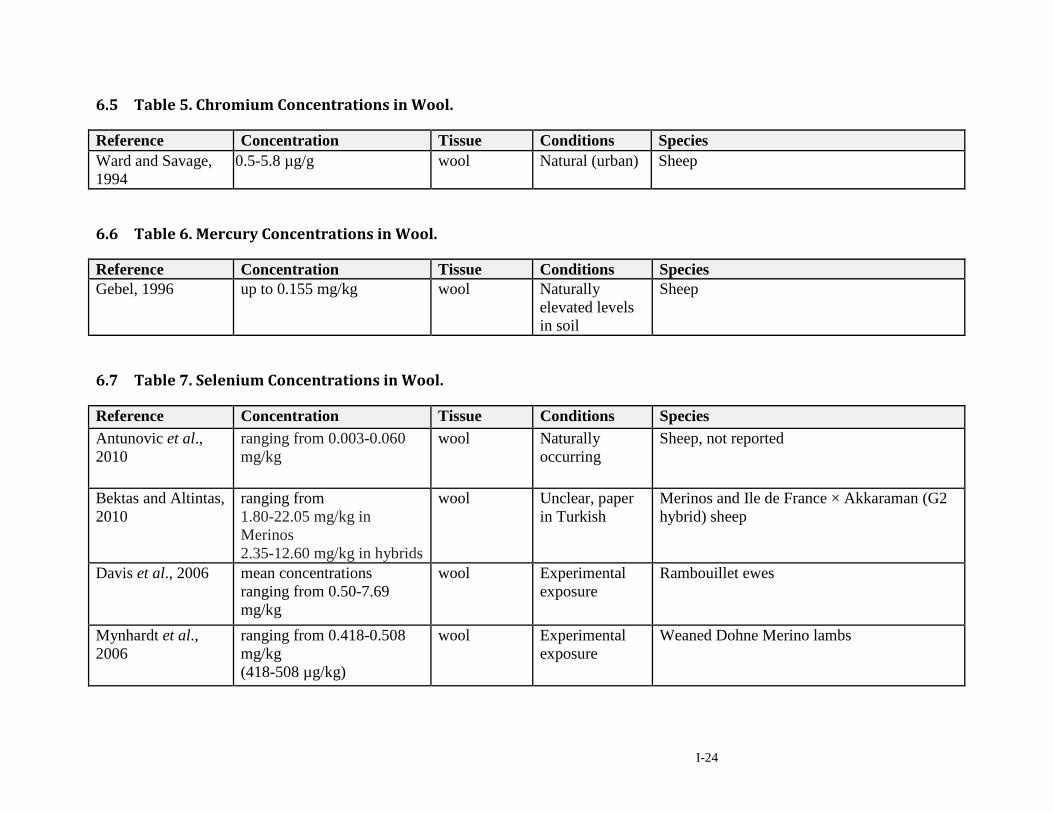
I-24
6.5 Table 5. Chromium Concentrations in Wool.
Reference Concentration Tissue Conditions Species Ward and Savage, 1994
0.5-5.8 µg/g wool Natural (urban) Sheep
6.6 Table 6. Mercury Concentrations in Wool.
Reference Concentration Tissue Conditions Species Gebel, 1996 up to 0.155 mg/kg wool Naturally
elevated levels in soil
Sheep
6.7 Table 7. Selenium Concentrations in Wool.
Reference Concentration Tissue Conditions Species Antunovic et al., 2010
ranging from 0.003-0.060 mg/kg
wool Naturally occurring
Sheep, not reported
Bektas and Altintas, 2010
ranging from 1.80-22.05 mg/kg in Merinos 2.35-12.60 mg/kg in hybrids
wool Unclear, paper in Turkish
Merinos and Ile de France × Akkaraman (G2 hybrid) sheep
Davis et al., 2006 mean concentrations ranging from 0.50-7.69 mg/kg
wool Experimental exposure
Rambouillet ewes
Mynhardt et al., 2006
ranging from 0.418-0.508 mg/kg (418-508 µg/kg)
wool Experimental exposure
Weaned Dohne Merino lambs
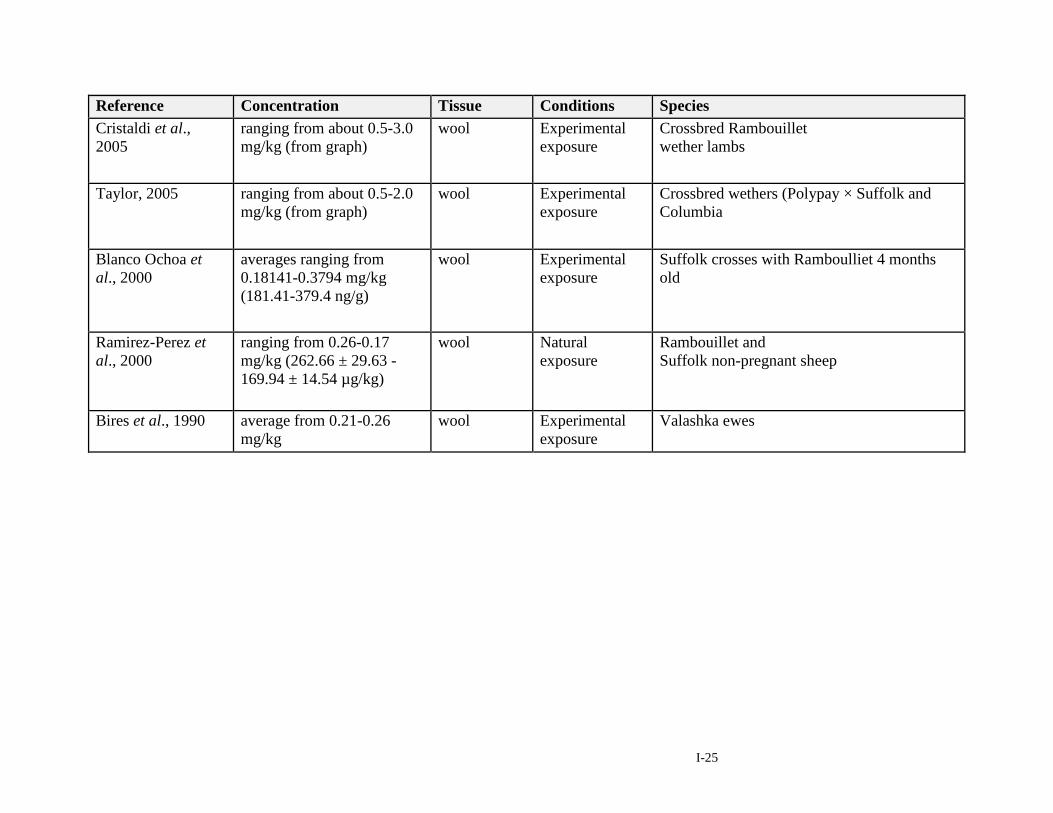
I-25
Reference Concentration Tissue Conditions Species Cristaldi et al., 2005
ranging from about 0.5-3.0 mg/kg (from graph)
wool Experimental exposure
Crossbred Rambouillet wether lambs
Taylor, 2005 ranging from about 0.5-2.0 mg/kg (from graph)
wool Experimental exposure
Crossbred wethers (Polypay × Suffolk and Columbia
Blanco Ochoa et al., 2000
averages ranging from 0.18141-0.3794 mg/kg (181.41-379.4 ng/g)
wool Experimental exposure
Suffolk crosses with Ramboulliet 4 months old
Ramirez-Perez et al., 2000
ranging from 0.26-0.17 mg/kg (262.66 ± 29.63 - 169.94 ± 14.54 µg/kg)
wool Natural exposure
Rambouillet and Suffolk non-pregnant sheep
Bires et al., 1990 average from 0.21-0.26 mg/kg
wool Experimental exposure
Valashka ewes
Concentrations of Selected Elements in Unfinished Wood and Other Natural Materials
Task Order 9 Contract Number CPSC-D-12-0001
March 2, 2015
Appendix II – Literature Search Strategy
Prepared by: Toxicology Excellence for Risk Assessment (TERA)
Contact: Jacqueline Patterson [email protected]
Alison Willis [email protected]
II-2
Contents
Introduction ............................................................................................................................................................... II-3
Antimony ................................................................................................................................................................... II-3
Arsenic ..................................................................................................................................................................... II-10
Barium ..................................................................................................................................................................... II-17
Cadmium ................................................................................................................................................................. II-23
Chromium ................................................................................................................................................................ II-29
Mercury ................................................................................................................................................................... II-36
Selenium .................................................................................................................................................................. II-43
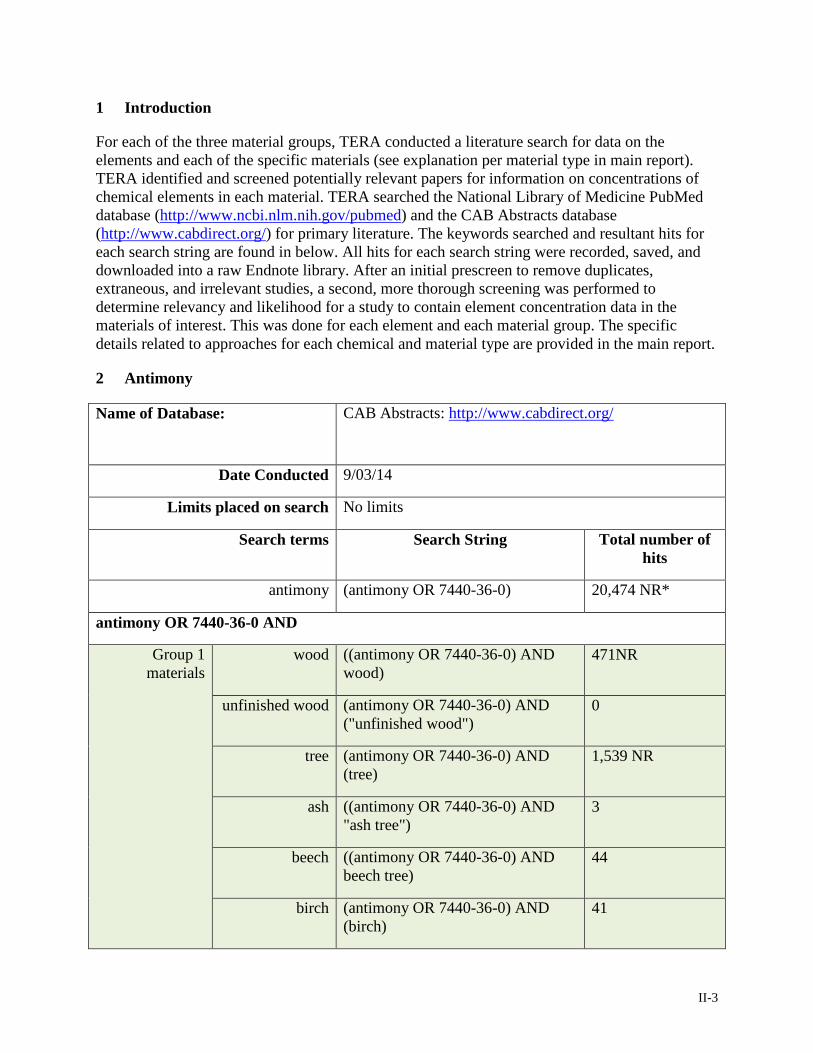
II-3
1 Introduction
For each of the three material groups, TERA conducted a literature search for data on the elements and each of the specific materials (see explanation per material type in main report). TERA identified and screened potentially relevant papers for information on concentrations of chemical elements in each material. TERA searched the National Library of Medicine PubMed database (http://www.ncbi.nlm.nih.gov/pubmed) and the CAB Abstracts database (http://www.cabdirect.org/) for primary literature. The keywords searched and resultant hits for each search string are found in below. All hits for each search string were recorded, saved, and downloaded into a raw Endnote library. After an initial prescreen to remove duplicates, extraneous, and irrelevant studies, a second, more thorough screening was performed to determine relevancy and likelihood for a study to contain element concentration data in the materials of interest. This was done for each element and each material group. The specific details related to approaches for each chemical and material type are provided in the main report.
2 Antimony
Name of Database: CAB Abstracts: http://www.cabdirect.org/
Date Conducted 9/03/14
Limits placed on search No limits
Search terms Search String Total number of hits
antimony (antimony OR 7440-36-0) 20,474 NR*
antimony OR 7440-36-0 AND
Group 1 materials
wood ((antimony OR 7440-36-0) AND wood)
471NR
unfinished wood (antimony OR 7440-36-0) AND ("unfinished wood")
0
tree (antimony OR 7440-36-0) AND (tree)
1,539 NR
ash ((antimony OR 7440-36-0) AND "ash tree")
3
beech ((antimony OR 7440-36-0) AND beech tree)
44
birch (antimony OR 7440-36-0) AND (birch)
41
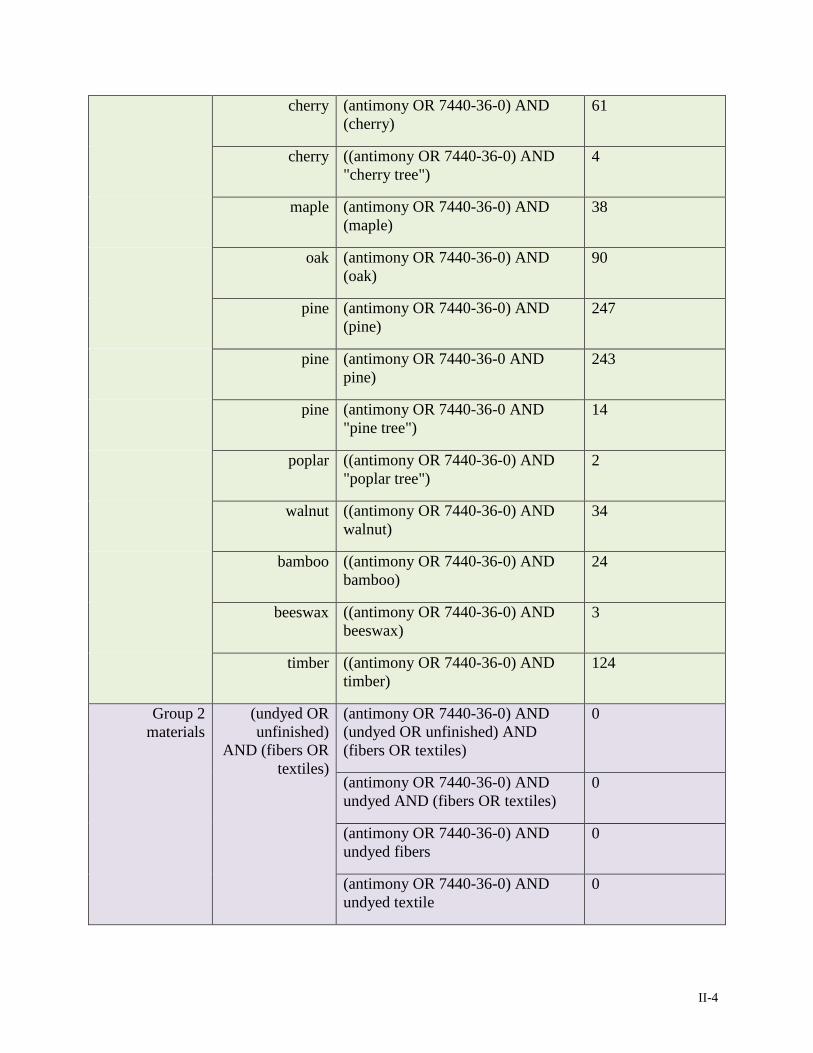
II-4
cherry (antimony OR 7440-36-0) AND (cherry)
61
cherry ((antimony OR 7440-36-0) AND "cherry tree")
4
maple (antimony OR 7440-36-0) AND (maple)
38
oak (antimony OR 7440-36-0) AND (oak)
90
pine (antimony OR 7440-36-0) AND (pine)
247
pine (antimony OR 7440-36-0 AND pine)
243
pine (antimony OR 7440-36-0 AND "pine tree")
14
poplar ((antimony OR 7440-36-0) AND "poplar tree")
2
walnut ((antimony OR 7440-36-0) AND walnut)
34
bamboo ((antimony OR 7440-36-0) AND bamboo)
24
beeswax ((antimony OR 7440-36-0) AND beeswax)
3
timber ((antimony OR 7440-36-0) AND timber)
124
Group 2 materials
(undyed OR unfinished)
AND (fibers OR textiles)
(antimony OR 7440-36-0) AND (undyed OR unfinished) AND (fibers OR textiles)
0
(antimony OR 7440-36-0) AND undyed AND (fibers OR textiles)
0
(antimony OR 7440-36-0) AND undyed fibers
0
(antimony OR 7440-36-0) AND undyed textile
0
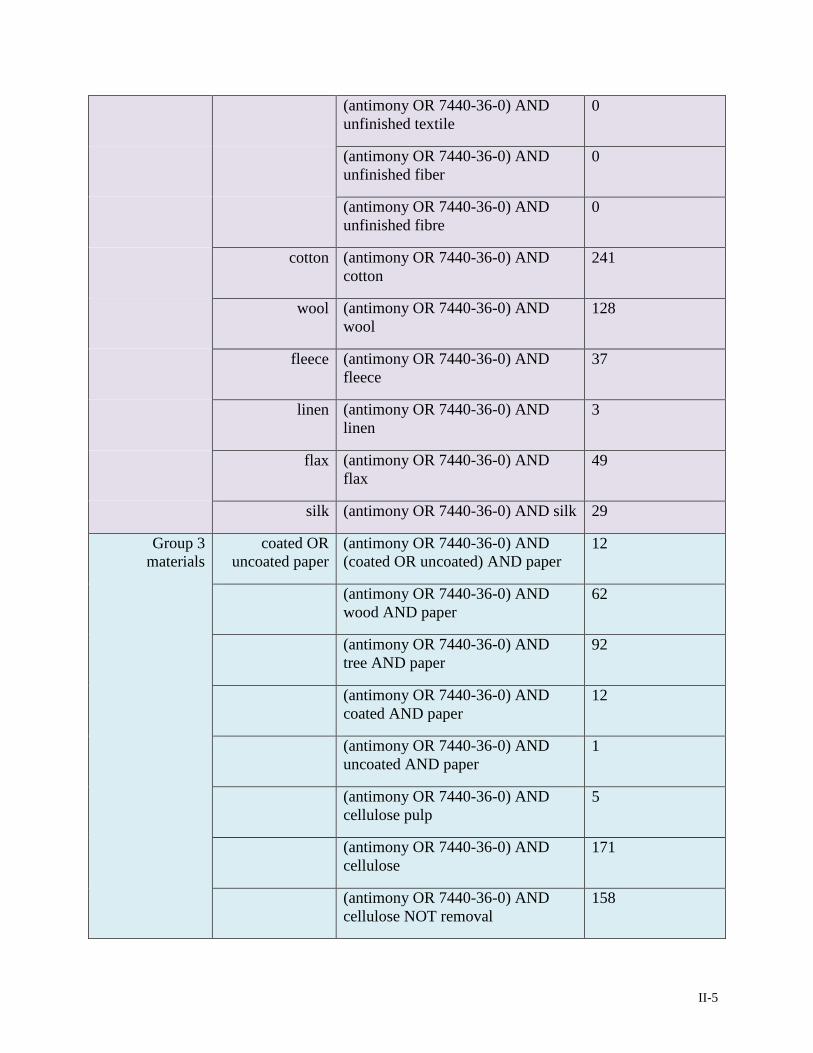
II-5
(antimony OR 7440-36-0) AND unfinished textile
0
(antimony OR 7440-36-0) AND unfinished fiber
0
(antimony OR 7440-36-0) AND unfinished fibre
0
cotton (antimony OR 7440-36-0) AND cotton
241
wool (antimony OR 7440-36-0) AND wool
128
fleece (antimony OR 7440-36-0) AND fleece
37
linen (antimony OR 7440-36-0) AND linen
3
flax (antimony OR 7440-36-0) AND flax
49
silk (antimony OR 7440-36-0) AND silk 29
Group 3 materials
coated OR uncoated paper
(antimony OR 7440-36-0) AND (coated OR uncoated) AND paper
12
(antimony OR 7440-36-0) AND wood AND paper
62
(antimony OR 7440-36-0) AND tree AND paper
92
(antimony OR 7440-36-0) AND coated AND paper
12
(antimony OR 7440-36-0) AND uncoated AND paper
1
(antimony OR 7440-36-0) AND cellulose pulp
5
(antimony OR 7440-36-0) AND cellulose
171
(antimony OR 7440-36-0) AND cellulose NOT removal
158
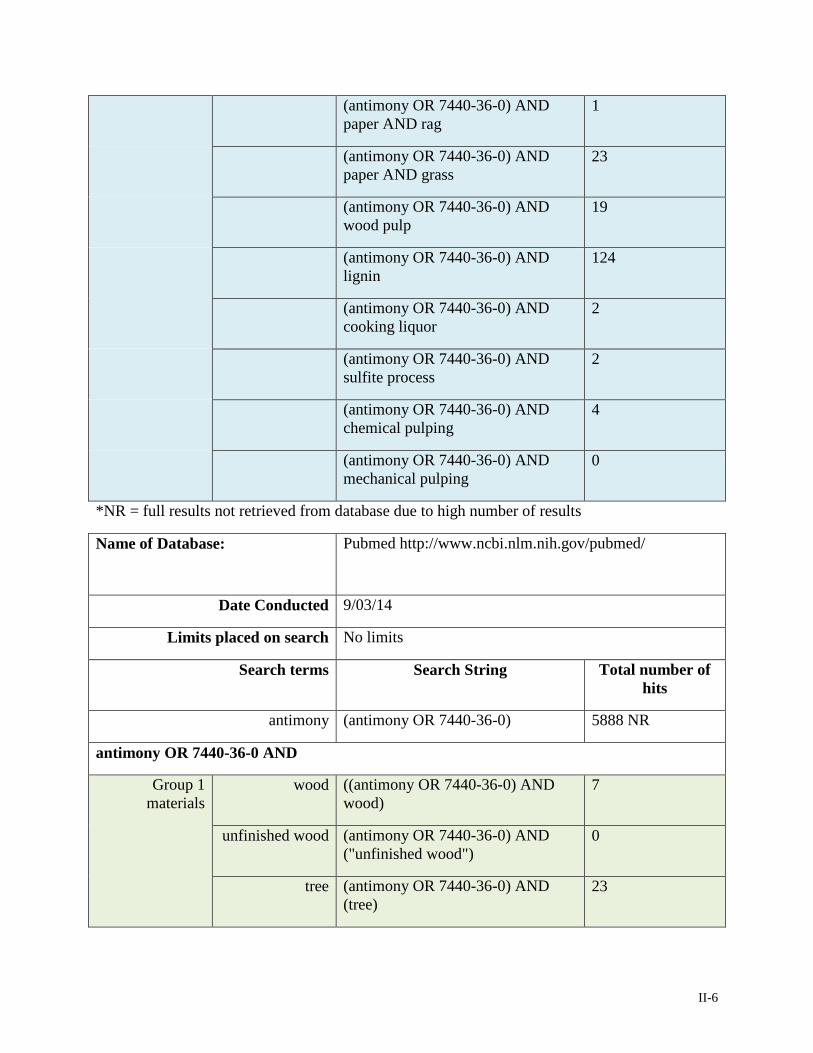
II-6
(antimony OR 7440-36-0) AND paper AND rag
1
(antimony OR 7440-36-0) AND paper AND grass
23
(antimony OR 7440-36-0) AND wood pulp
19
(antimony OR 7440-36-0) AND lignin
124
(antimony OR 7440-36-0) AND cooking liquor
2
(antimony OR 7440-36-0) AND sulfite process
2
(antimony OR 7440-36-0) AND chemical pulping
4
(antimony OR 7440-36-0) AND mechanical pulping
0
*NR = full results not retrieved from database due to high number of results
Name of Database: Pubmed http://www.ncbi.nlm.nih.gov/pubmed/
Date Conducted 9/03/14
Limits placed on search No limits
Search terms Search String Total number of hits
antimony (antimony OR 7440-36-0) 5888 NR
antimony OR 7440-36-0 AND
Group 1 materials
wood ((antimony OR 7440-36-0) AND wood)
7
unfinished wood (antimony OR 7440-36-0) AND ("unfinished wood")
0
tree (antimony OR 7440-36-0) AND (tree)
23
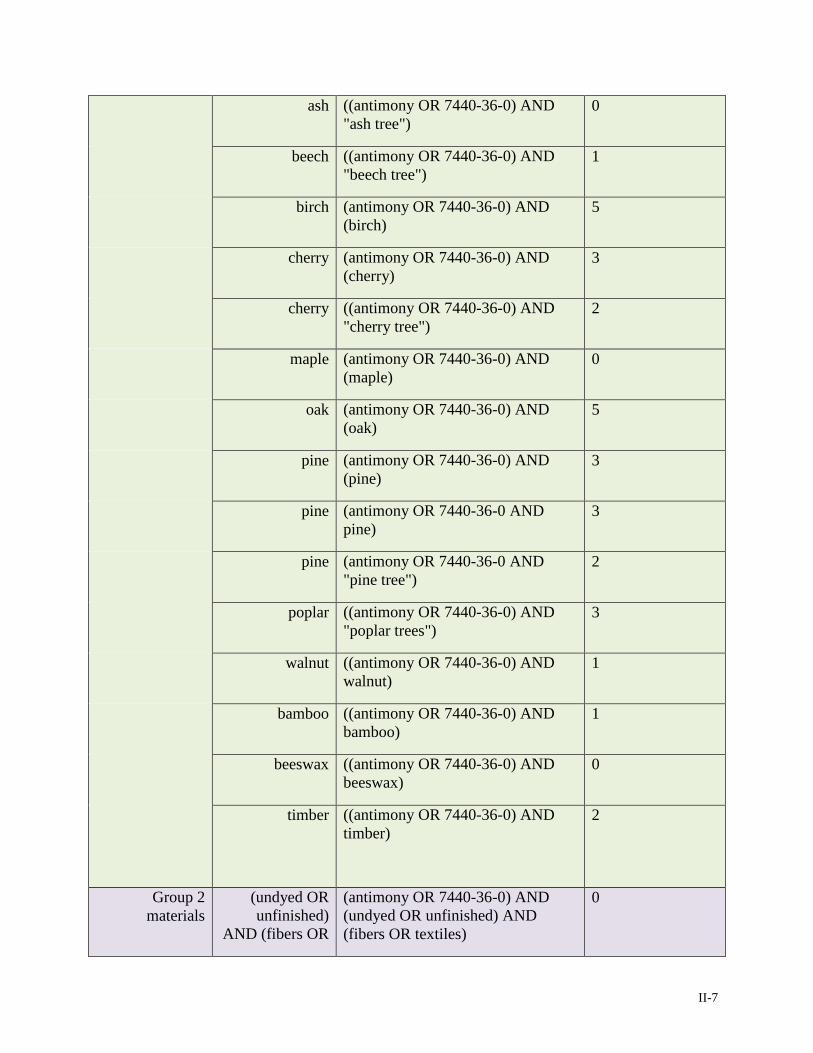
II-7
ash ((antimony OR 7440-36-0) AND "ash tree")
0
beech ((antimony OR 7440-36-0) AND "beech tree")
1
birch (antimony OR 7440-36-0) AND (birch)
5
cherry (antimony OR 7440-36-0) AND (cherry)
3
cherry ((antimony OR 7440-36-0) AND "cherry tree")
2
maple (antimony OR 7440-36-0) AND (maple)
0
oak (antimony OR 7440-36-0) AND (oak)
5
pine (antimony OR 7440-36-0) AND (pine)
3
pine (antimony OR 7440-36-0 AND pine)
3
pine (antimony OR 7440-36-0 AND "pine tree")
2
poplar ((antimony OR 7440-36-0) AND "poplar trees")
3
walnut ((antimony OR 7440-36-0) AND walnut)
1
bamboo ((antimony OR 7440-36-0) AND bamboo)
1
beeswax ((antimony OR 7440-36-0) AND beeswax)
0
timber ((antimony OR 7440-36-0) AND timber)
2
Group 2 materials
(undyed OR unfinished)
AND (fibers OR
(antimony OR 7440-36-0) AND (undyed OR unfinished) AND (fibers OR textiles)
0
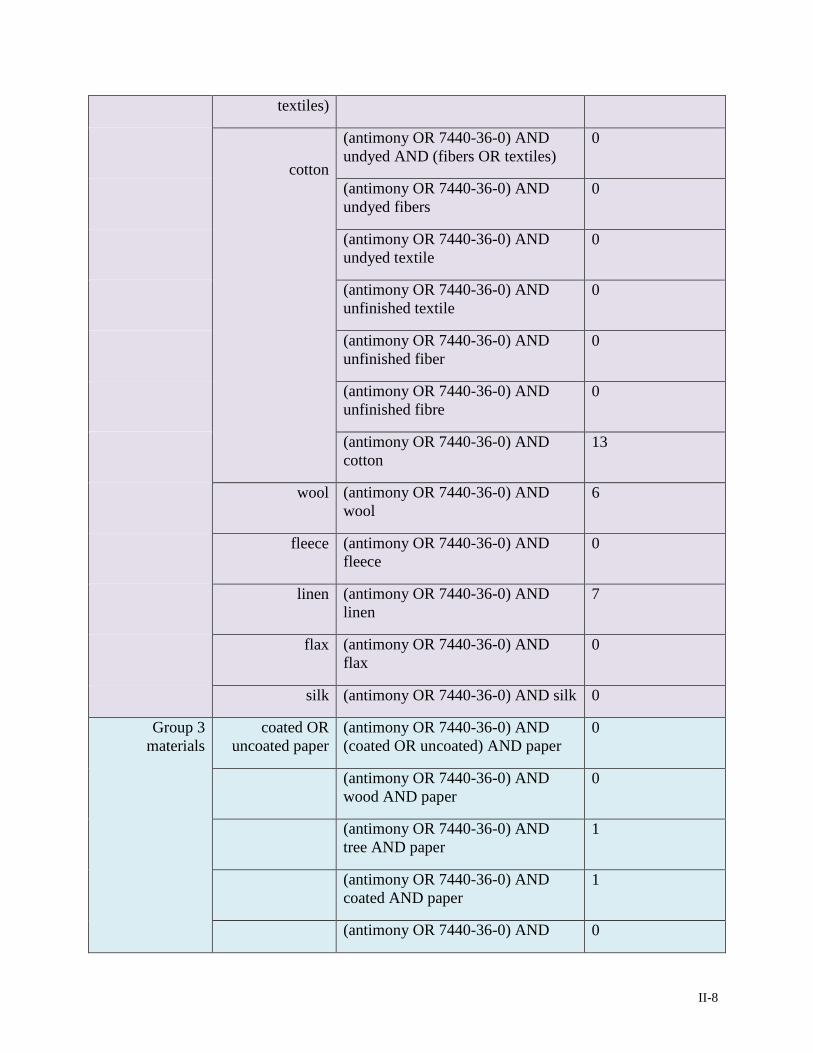
II-8
textiles)
cotton
(antimony OR 7440-36-0) AND undyed AND (fibers OR textiles)
0
(antimony OR 7440-36-0) AND undyed fibers
0
(antimony OR 7440-36-0) AND undyed textile
0
(antimony OR 7440-36-0) AND unfinished textile
0
(antimony OR 7440-36-0) AND unfinished fiber
0
(antimony OR 7440-36-0) AND unfinished fibre
0
(antimony OR 7440-36-0) AND cotton
13
wool (antimony OR 7440-36-0) AND wool
6
fleece (antimony OR 7440-36-0) AND fleece
0
linen (antimony OR 7440-36-0) AND linen
7
flax (antimony OR 7440-36-0) AND flax
0
silk (antimony OR 7440-36-0) AND silk 0
Group 3 materials
coated OR uncoated paper
(antimony OR 7440-36-0) AND (coated OR uncoated) AND paper
0
(antimony OR 7440-36-0) AND wood AND paper
0
(antimony OR 7440-36-0) AND tree AND paper
1
(antimony OR 7440-36-0) AND coated AND paper
1
(antimony OR 7440-36-0) AND 0
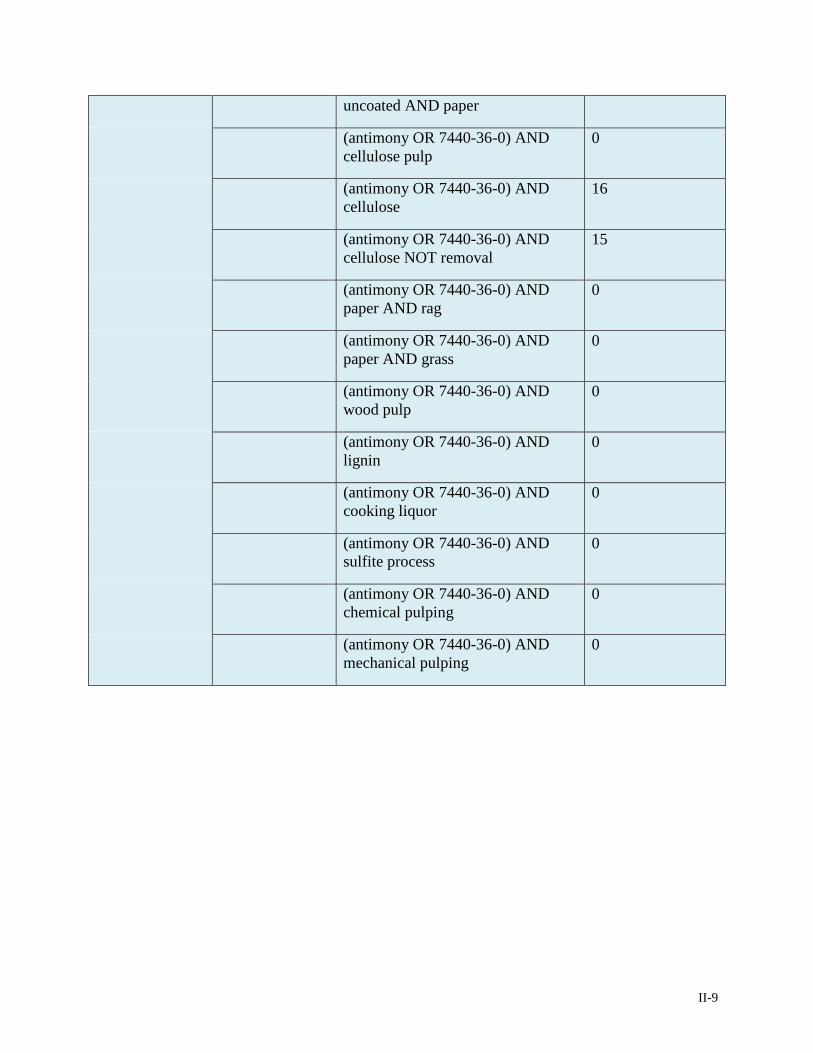
II-9
uncoated AND paper
(antimony OR 7440-36-0) AND cellulose pulp
0
(antimony OR 7440-36-0) AND cellulose
16
(antimony OR 7440-36-0) AND cellulose NOT removal
15
(antimony OR 7440-36-0) AND paper AND rag
0
(antimony OR 7440-36-0) AND paper AND grass
0
(antimony OR 7440-36-0) AND wood pulp
0
(antimony OR 7440-36-0) AND lignin
0
(antimony OR 7440-36-0) AND cooking liquor
0
(antimony OR 7440-36-0) AND sulfite process
0
(antimony OR 7440-36-0) AND chemical pulping
0
(antimony OR 7440-36-0) AND mechanical pulping
0
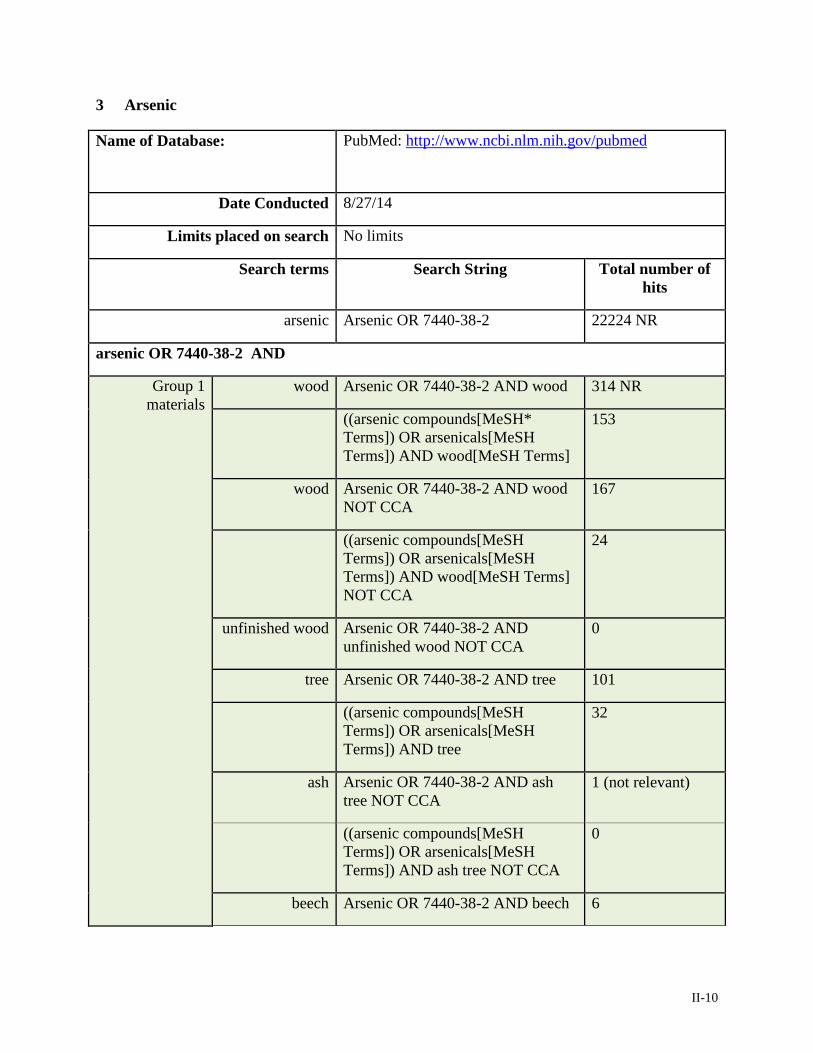
II-10
3 Arsenic
Name of Database: PubMed: http://www.ncbi.nlm.nih.gov/pubmed
Date Conducted 8/27/14
Limits placed on search No limits
Search terms Search String Total number of hits
arsenic Arsenic OR 7440-38-2 22224 NR
arsenic OR 7440-38-2 AND
Group 1 materials
wood Arsenic OR 7440-38-2 AND wood 314 NR
((arsenic compounds[MeSH* Terms]) OR arsenicals[MeSH Terms]) AND wood[MeSH Terms]
153
wood Arsenic OR 7440-38-2 AND wood NOT CCA
167
((arsenic compounds[MeSH Terms]) OR arsenicals[MeSH Terms]) AND wood[MeSH Terms] NOT CCA
24
unfinished wood Arsenic OR 7440-38-2 AND unfinished wood NOT CCA
0
tree Arsenic OR 7440-38-2 AND tree 101
((arsenic compounds[MeSH Terms]) OR arsenicals[MeSH Terms]) AND tree
32
ash Arsenic OR 7440-38-2 AND ash tree NOT CCA
1 (not relevant)
((arsenic compounds[MeSH Terms]) OR arsenicals[MeSH Terms]) AND ash tree NOT CCA
0
beech Arsenic OR 7440-38-2 AND beech 6
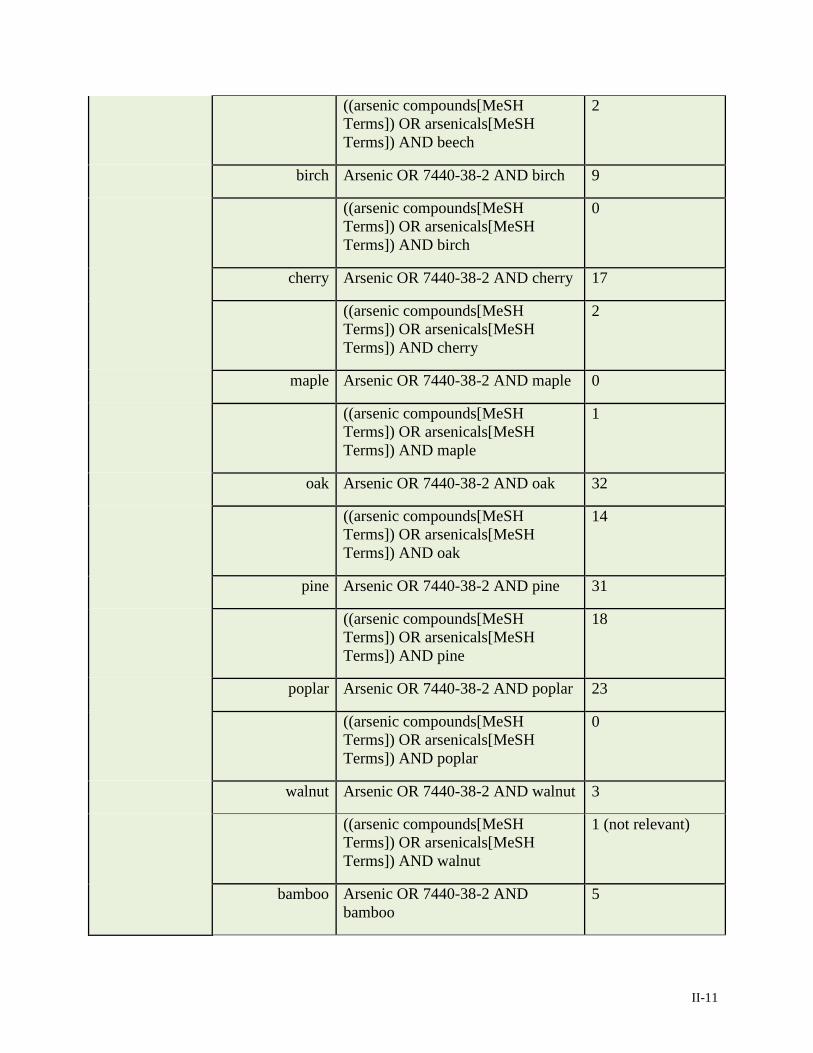
II-11
((arsenic compounds[MeSH Terms]) OR arsenicals[MeSH Terms]) AND beech
2
birch Arsenic OR 7440-38-2 AND birch 9
((arsenic compounds[MeSH Terms]) OR arsenicals[MeSH Terms]) AND birch
0
cherry Arsenic OR 7440-38-2 AND cherry 17
((arsenic compounds[MeSH Terms]) OR arsenicals[MeSH Terms]) AND cherry
2
maple Arsenic OR 7440-38-2 AND maple 0
((arsenic compounds[MeSH Terms]) OR arsenicals[MeSH Terms]) AND maple
1
oak Arsenic OR 7440-38-2 AND oak 32
((arsenic compounds[MeSH Terms]) OR arsenicals[MeSH Terms]) AND oak
14
pine Arsenic OR 7440-38-2 AND pine 31
((arsenic compounds[MeSH Terms]) OR arsenicals[MeSH Terms]) AND pine
18
poplar Arsenic OR 7440-38-2 AND poplar 23
((arsenic compounds[MeSH Terms]) OR arsenicals[MeSH Terms]) AND poplar
0
walnut Arsenic OR 7440-38-2 AND walnut 3
((arsenic compounds[MeSH Terms]) OR arsenicals[MeSH Terms]) AND walnut
1 (not relevant)
bamboo Arsenic OR 7440-38-2 AND bamboo
5
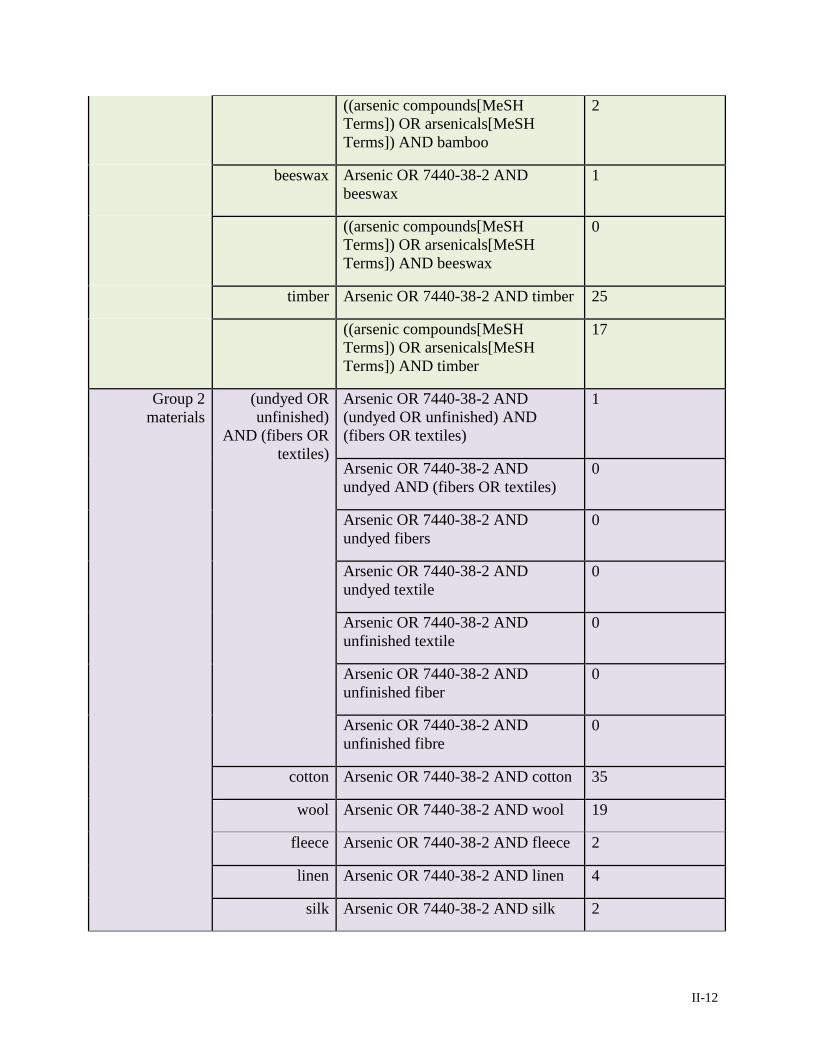
II-12
((arsenic compounds[MeSH Terms]) OR arsenicals[MeSH Terms]) AND bamboo
2
beeswax Arsenic OR 7440-38-2 AND beeswax
1
((arsenic compounds[MeSH Terms]) OR arsenicals[MeSH Terms]) AND beeswax
0
timber Arsenic OR 7440-38-2 AND timber 25
((arsenic compounds[MeSH Terms]) OR arsenicals[MeSH Terms]) AND timber
17
Group 2 materials
(undyed OR unfinished)
AND (fibers OR textiles)
Arsenic OR 7440-38-2 AND (undyed OR unfinished) AND (fibers OR textiles)
1
Arsenic OR 7440-38-2 AND undyed AND (fibers OR textiles)
0
Arsenic OR 7440-38-2 AND undyed fibers
0
Arsenic OR 7440-38-2 AND undyed textile
0
Arsenic OR 7440-38-2 AND unfinished textile
0
Arsenic OR 7440-38-2 AND unfinished fiber
0
Arsenic OR 7440-38-2 AND unfinished fibre
0
cotton Arsenic OR 7440-38-2 AND cotton 35
wool Arsenic OR 7440-38-2 AND wool 19
fleece Arsenic OR 7440-38-2 AND fleece 2
linen Arsenic OR 7440-38-2 AND linen 4
silk Arsenic OR 7440-38-2 AND silk 2
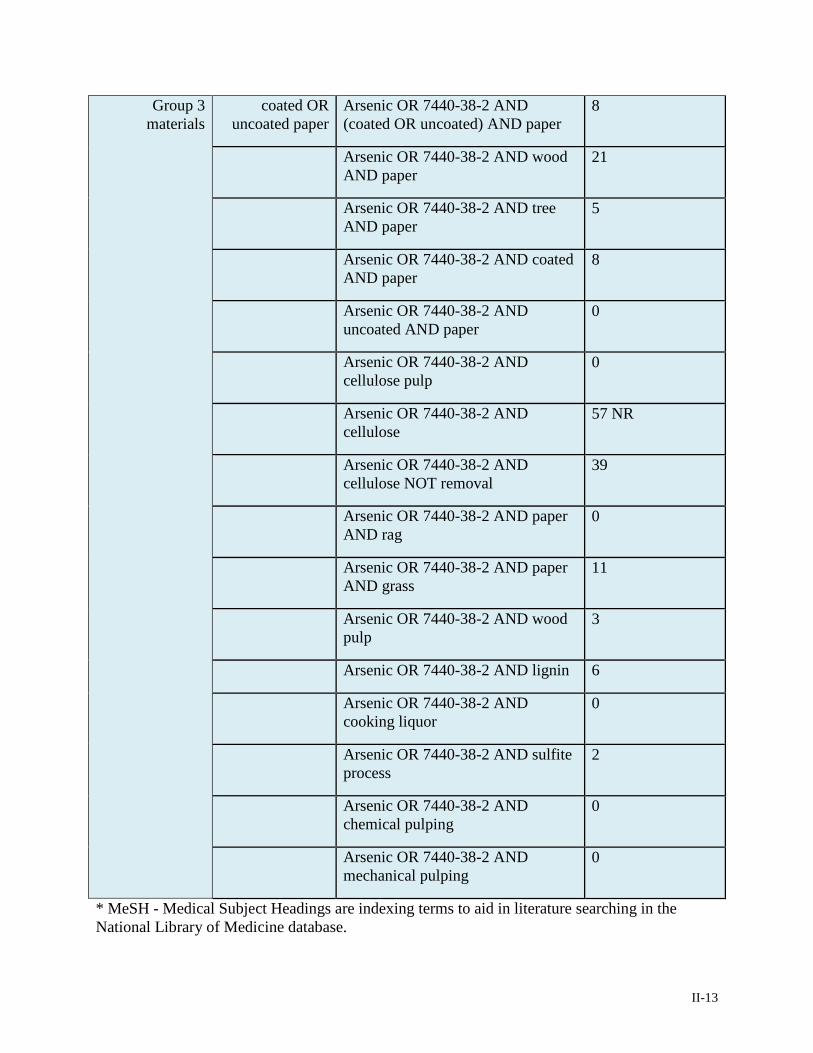
II-13
Group 3 materials
coated OR uncoated paper
Arsenic OR 7440-38-2 AND (coated OR uncoated) AND paper
8
Arsenic OR 7440-38-2 AND wood AND paper
21
Arsenic OR 7440-38-2 AND tree AND paper
5
Arsenic OR 7440-38-2 AND coated AND paper
8
Arsenic OR 7440-38-2 AND uncoated AND paper
0
Arsenic OR 7440-38-2 AND cellulose pulp
0
Arsenic OR 7440-38-2 AND cellulose
57 NR
Arsenic OR 7440-38-2 AND cellulose NOT removal
39
Arsenic OR 7440-38-2 AND paper AND rag
0
Arsenic OR 7440-38-2 AND paper AND grass
11
Arsenic OR 7440-38-2 AND wood pulp
3
Arsenic OR 7440-38-2 AND lignin 6
Arsenic OR 7440-38-2 AND cooking liquor
0
Arsenic OR 7440-38-2 AND sulfite process
2
Arsenic OR 7440-38-2 AND chemical pulping
0
Arsenic OR 7440-38-2 AND mechanical pulping
0
* MeSH - Medical Subject Headings are indexing terms to aid in literature searching in the National Library of Medicine database.
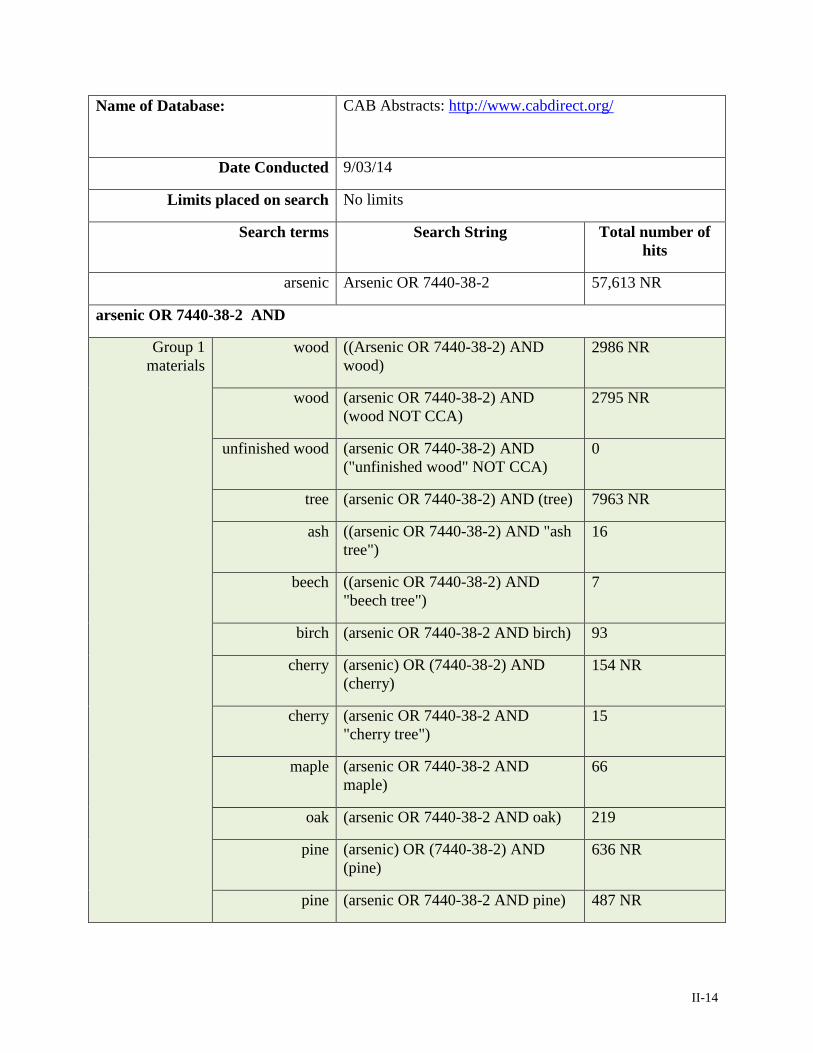
II-14
Name of Database: CAB Abstracts: http://www.cabdirect.org/
Date Conducted 9/03/14
Limits placed on search No limits
Search terms Search String Total number of hits
arsenic Arsenic OR 7440-38-2 57,613 NR
arsenic OR 7440-38-2 AND
Group 1 materials
wood ((Arsenic OR 7440-38-2) AND wood)
2986 NR
wood (arsenic OR 7440-38-2) AND (wood NOT CCA)
2795 NR
unfinished wood (arsenic OR 7440-38-2) AND ("unfinished wood" NOT CCA)
0
tree (arsenic OR 7440-38-2) AND (tree) 7963 NR
ash ((arsenic OR 7440-38-2) AND "ash tree")
16
beech ((arsenic OR 7440-38-2) AND "beech tree")
7
birch (arsenic OR 7440-38-2 AND birch) 93
cherry (arsenic) OR (7440-38-2) AND (cherry)
154 NR
cherry (arsenic OR 7440-38-2 AND "cherry tree")
15
maple (arsenic OR 7440-38-2 AND maple)
66
oak (arsenic OR 7440-38-2 AND oak) 219
pine (arsenic) OR (7440-38-2) AND (pine)
636 NR
pine (arsenic OR 7440-38-2 AND pine) 487 NR
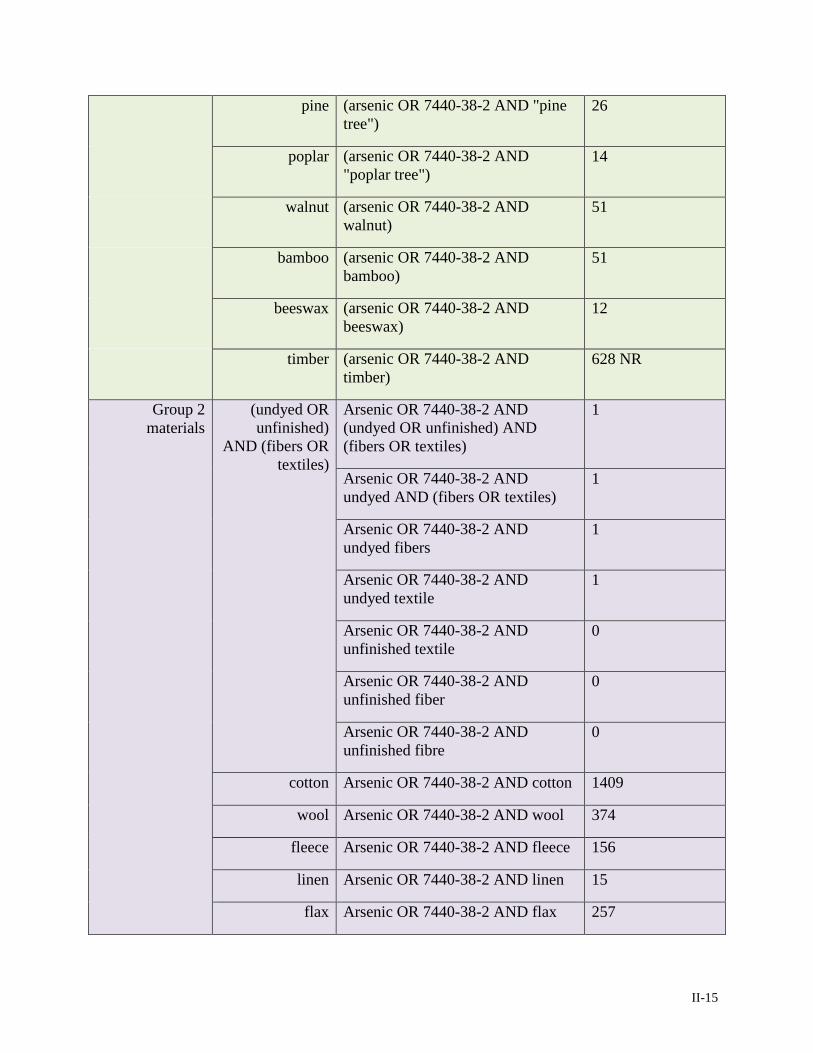
II-15
pine (arsenic OR 7440-38-2 AND "pine tree")
26
poplar (arsenic OR 7440-38-2 AND "poplar tree")
14
walnut (arsenic OR 7440-38-2 AND walnut)
51
bamboo (arsenic OR 7440-38-2 AND bamboo)
51
beeswax (arsenic OR 7440-38-2 AND beeswax)
12
timber (arsenic OR 7440-38-2 AND timber)
628 NR
Group 2 materials
(undyed OR unfinished)
AND (fibers OR textiles)
Arsenic OR 7440-38-2 AND (undyed OR unfinished) AND (fibers OR textiles)
1
Arsenic OR 7440-38-2 AND undyed AND (fibers OR textiles)
1
Arsenic OR 7440-38-2 AND undyed fibers
1
Arsenic OR 7440-38-2 AND undyed textile
1
Arsenic OR 7440-38-2 AND unfinished textile
0
Arsenic OR 7440-38-2 AND unfinished fiber
0
Arsenic OR 7440-38-2 AND unfinished fibre
0
cotton Arsenic OR 7440-38-2 AND cotton 1409
wool Arsenic OR 7440-38-2 AND wool 374
fleece Arsenic OR 7440-38-2 AND fleece 156
linen Arsenic OR 7440-38-2 AND linen 15
flax Arsenic OR 7440-38-2 AND flax 257
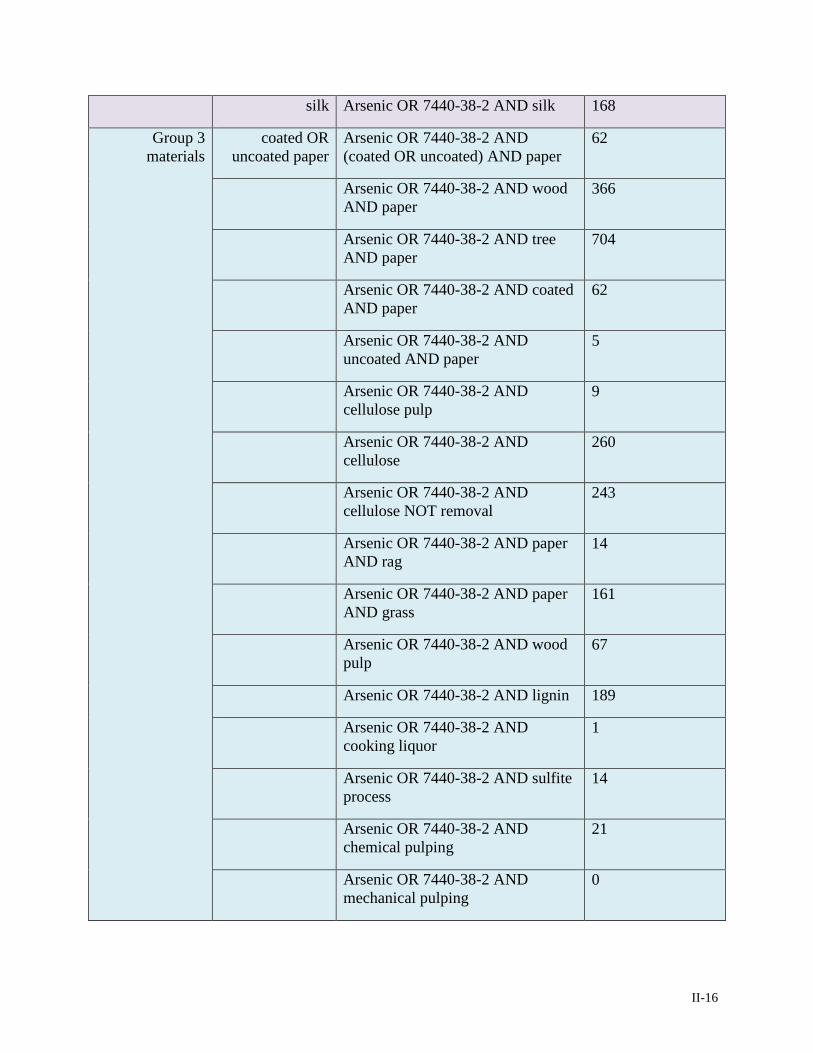
II-16
silk Arsenic OR 7440-38-2 AND silk 168
Group 3 materials
coated OR uncoated paper
Arsenic OR 7440-38-2 AND (coated OR uncoated) AND paper
62
Arsenic OR 7440-38-2 AND wood AND paper
366
Arsenic OR 7440-38-2 AND tree AND paper
704
Arsenic OR 7440-38-2 AND coated AND paper
62
Arsenic OR 7440-38-2 AND uncoated AND paper
5
Arsenic OR 7440-38-2 AND cellulose pulp
9
Arsenic OR 7440-38-2 AND cellulose
260
Arsenic OR 7440-38-2 AND cellulose NOT removal
243
Arsenic OR 7440-38-2 AND paper AND rag
14
Arsenic OR 7440-38-2 AND paper AND grass
161
Arsenic OR 7440-38-2 AND wood pulp
67
Arsenic OR 7440-38-2 AND lignin 189
Arsenic OR 7440-38-2 AND cooking liquor
1
Arsenic OR 7440-38-2 AND sulfite process
14
Arsenic OR 7440-38-2 AND chemical pulping
21
Arsenic OR 7440-38-2 AND mechanical pulping
0
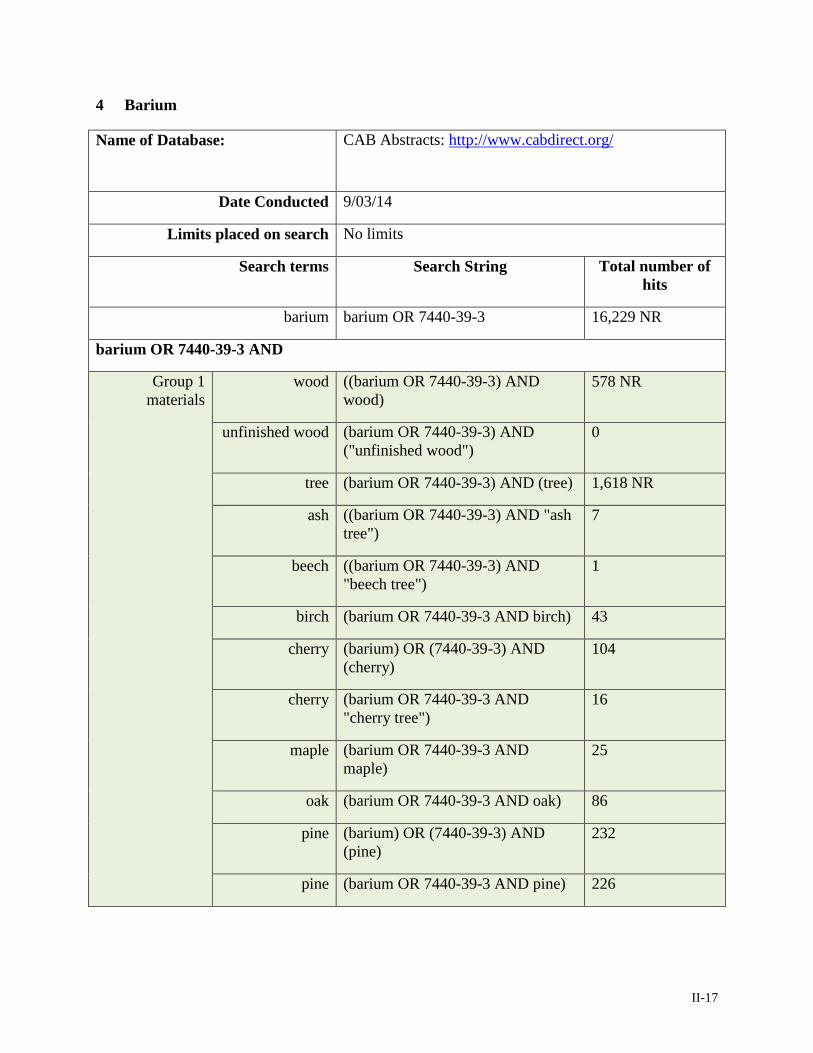
II-17
4 Barium
Name of Database: CAB Abstracts: http://www.cabdirect.org/
Date Conducted 9/03/14
Limits placed on search No limits
Search terms Search String Total number of hits
barium barium OR 7440-39-3 16,229 NR
barium OR 7440-39-3 AND
Group 1 materials
wood ((barium OR 7440-39-3) AND wood)
578 NR
unfinished wood (barium OR 7440-39-3) AND ("unfinished wood")
0
tree (barium OR 7440-39-3) AND (tree) 1,618 NR
ash ((barium OR 7440-39-3) AND "ash tree")
7
beech ((barium OR 7440-39-3) AND "beech tree")
1
birch (barium OR 7440-39-3 AND birch) 43
cherry (barium) OR (7440-39-3) AND (cherry)
104
cherry (barium OR 7440-39-3 AND "cherry tree")
16
maple (barium OR 7440-39-3 AND maple)
25
oak (barium OR 7440-39-3 AND oak) 86
pine (barium) OR (7440-39-3) AND (pine)
232
pine (barium OR 7440-39-3 AND pine) 226
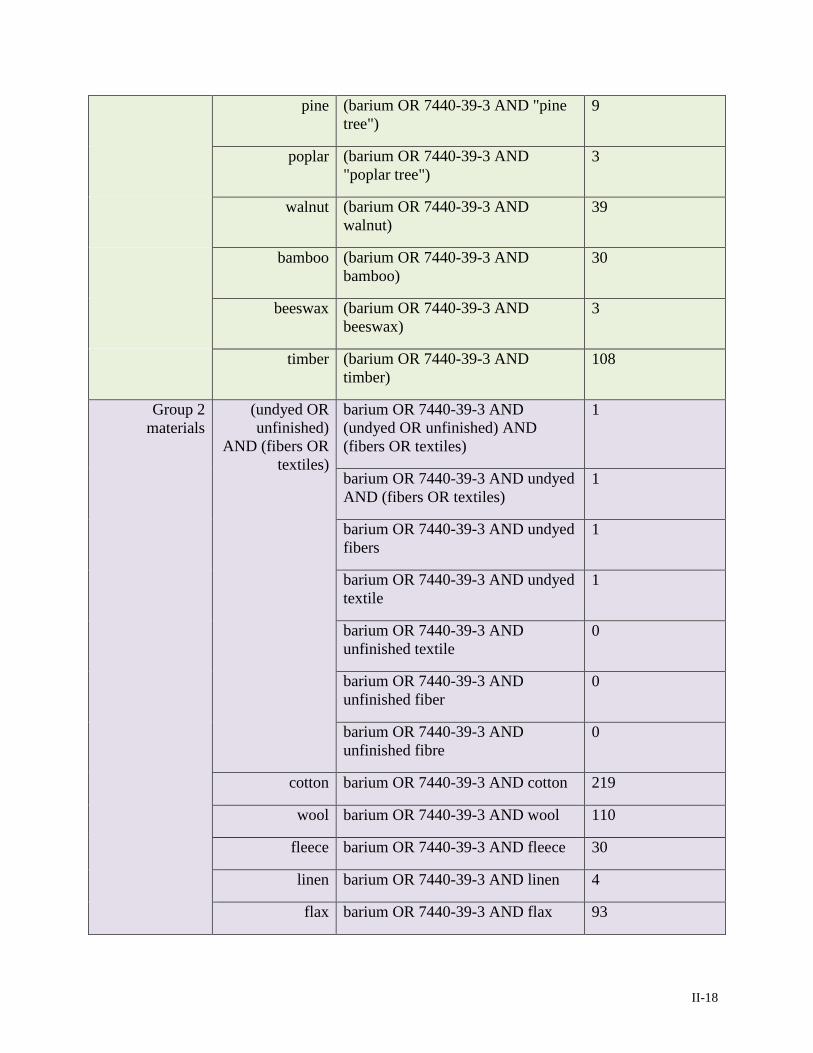
II-18
pine (barium OR 7440-39-3 AND "pine tree")
9
poplar (barium OR 7440-39-3 AND "poplar tree")
3
walnut (barium OR 7440-39-3 AND walnut)
39
bamboo (barium OR 7440-39-3 AND bamboo)
30
beeswax (barium OR 7440-39-3 AND beeswax)
3
timber (barium OR 7440-39-3 AND timber)
108
Group 2 materials
(undyed OR unfinished)
AND (fibers OR textiles)
barium OR 7440-39-3 AND (undyed OR unfinished) AND (fibers OR textiles)
1
barium OR 7440-39-3 AND undyed AND (fibers OR textiles)
1
barium OR 7440-39-3 AND undyed fibers
1
barium OR 7440-39-3 AND undyed textile
1
barium OR 7440-39-3 AND unfinished textile
0
barium OR 7440-39-3 AND unfinished fiber
0
barium OR 7440-39-3 AND unfinished fibre
0
cotton barium OR 7440-39-3 AND cotton 219
wool barium OR 7440-39-3 AND wool 110
fleece barium OR 7440-39-3 AND fleece 30
linen barium OR 7440-39-3 AND linen 4
flax barium OR 7440-39-3 AND flax 93
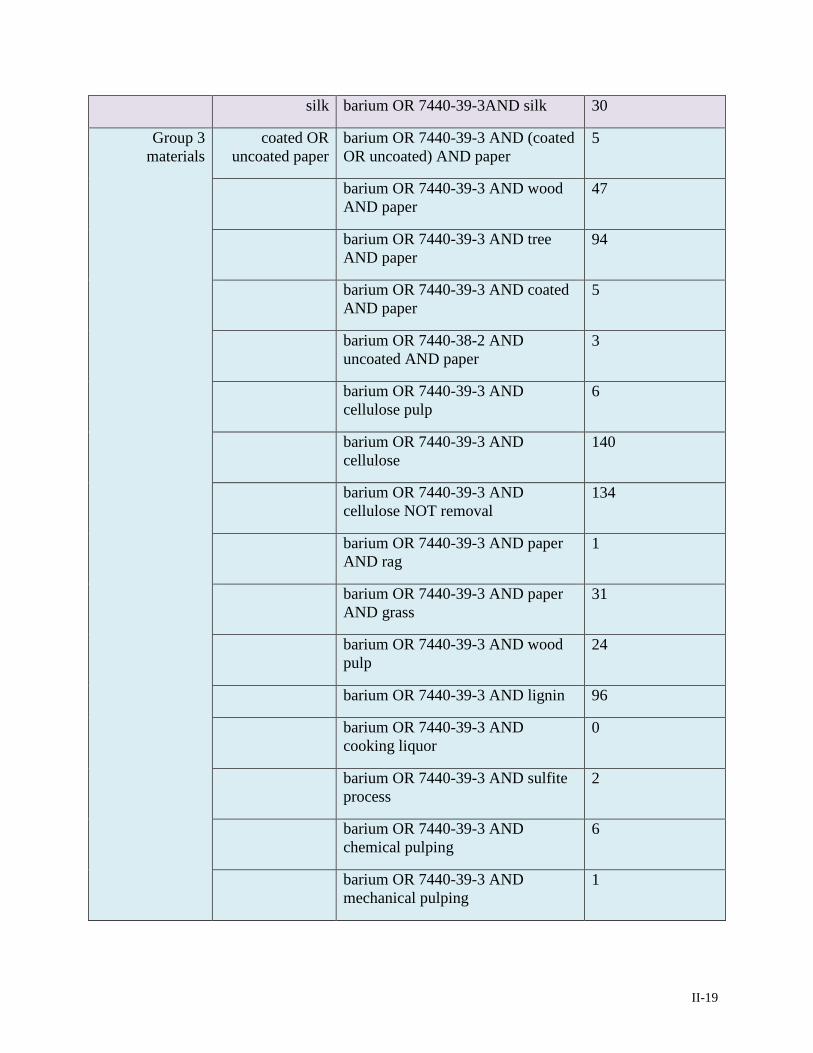
II-19
silk barium OR 7440-39-3AND silk 30
Group 3 materials
coated OR uncoated paper
barium OR 7440-39-3 AND (coated OR uncoated) AND paper
5
barium OR 7440-39-3 AND wood AND paper
47
barium OR 7440-39-3 AND tree AND paper
94
barium OR 7440-39-3 AND coated AND paper
5
barium OR 7440-38-2 AND uncoated AND paper
3
barium OR 7440-39-3 AND cellulose pulp
6
barium OR 7440-39-3 AND cellulose
140
barium OR 7440-39-3 AND cellulose NOT removal
134
barium OR 7440-39-3 AND paper AND rag
1
barium OR 7440-39-3 AND paper AND grass
31
barium OR 7440-39-3 AND wood pulp
24
barium OR 7440-39-3 AND lignin 96
barium OR 7440-39-3 AND cooking liquor
0
barium OR 7440-39-3 AND sulfite process
2
barium OR 7440-39-3 AND chemical pulping
6
barium OR 7440-39-3 AND mechanical pulping
1
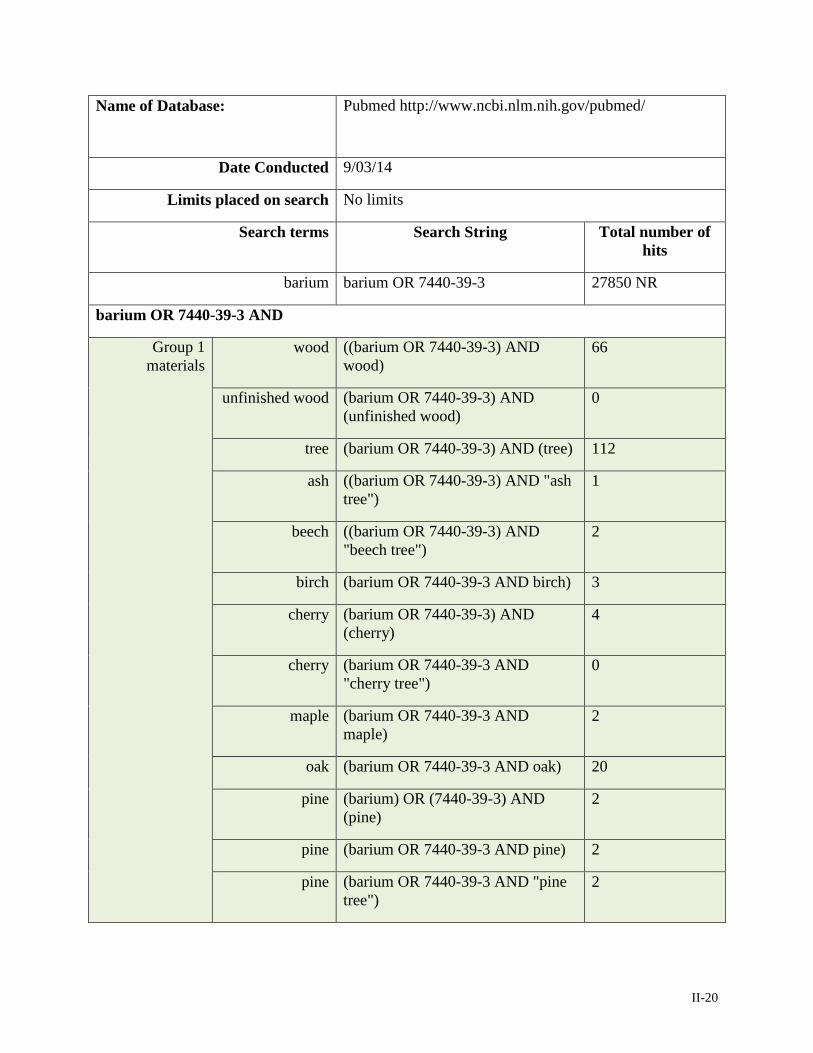
II-20
Name of Database: Pubmed http://www.ncbi.nlm.nih.gov/pubmed/
Date Conducted 9/03/14
Limits placed on search No limits
Search terms Search String Total number of hits
barium barium OR 7440-39-3 27850 NR
barium OR 7440-39-3 AND
Group 1 materials
wood ((barium OR 7440-39-3) AND wood)
66
unfinished wood (barium OR 7440-39-3) AND (unfinished wood)
0
tree (barium OR 7440-39-3) AND (tree) 112
ash ((barium OR 7440-39-3) AND "ash tree")
1
beech ((barium OR 7440-39-3) AND "beech tree")
2
birch (barium OR 7440-39-3 AND birch) 3
cherry (barium OR 7440-39-3) AND (cherry)
4
cherry (barium OR 7440-39-3 AND "cherry tree")
0
maple (barium OR 7440-39-3 AND maple)
2
oak (barium OR 7440-39-3 AND oak) 20
pine (barium) OR (7440-39-3) AND (pine)
2
pine (barium OR 7440-39-3 AND pine) 2
pine (barium OR 7440-39-3 AND "pine tree")
2
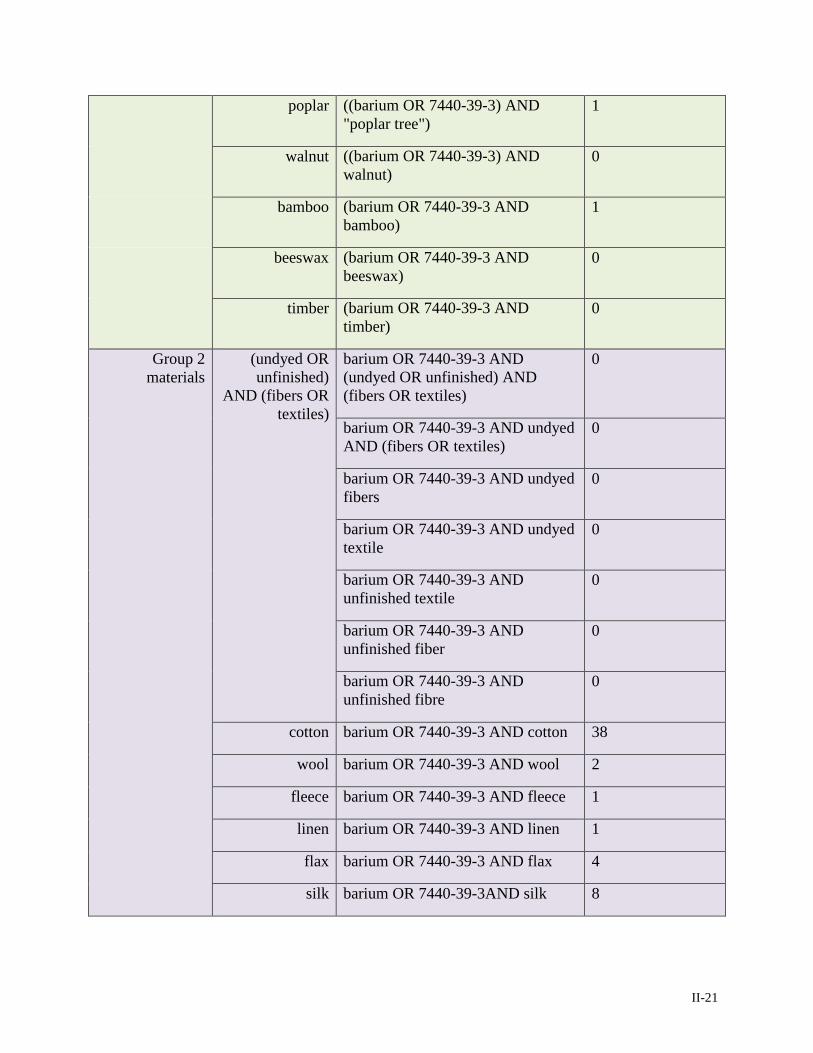
II-21
poplar ((barium OR 7440-39-3) AND "poplar tree")
1
walnut ((barium OR 7440-39-3) AND walnut)
0
bamboo (barium OR 7440-39-3 AND bamboo)
1
beeswax (barium OR 7440-39-3 AND beeswax)
0
timber (barium OR 7440-39-3 AND timber)
0
Group 2 materials
(undyed OR unfinished)
AND (fibers OR textiles)
barium OR 7440-39-3 AND (undyed OR unfinished) AND (fibers OR textiles)
0
barium OR 7440-39-3 AND undyed AND (fibers OR textiles)
0
barium OR 7440-39-3 AND undyed fibers
0
barium OR 7440-39-3 AND undyed textile
0
barium OR 7440-39-3 AND unfinished textile
0
barium OR 7440-39-3 AND unfinished fiber
0
barium OR 7440-39-3 AND unfinished fibre
0
cotton barium OR 7440-39-3 AND cotton 38
wool barium OR 7440-39-3 AND wool 2
fleece barium OR 7440-39-3 AND fleece 1
linen barium OR 7440-39-3 AND linen 1
flax barium OR 7440-39-3 AND flax 4
silk barium OR 7440-39-3AND silk 8
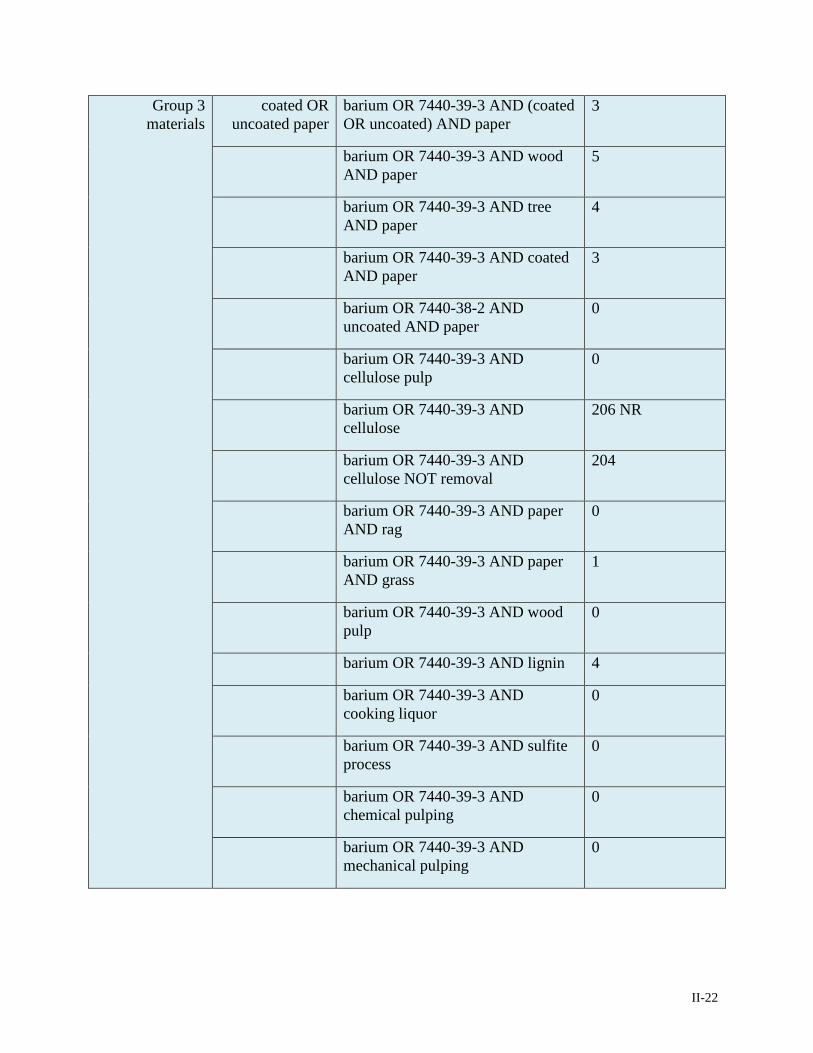
II-22
Group 3 materials
coated OR uncoated paper
barium OR 7440-39-3 AND (coated OR uncoated) AND paper
3
barium OR 7440-39-3 AND wood AND paper
5
barium OR 7440-39-3 AND tree AND paper
4
barium OR 7440-39-3 AND coated AND paper
3
barium OR 7440-38-2 AND uncoated AND paper
0
barium OR 7440-39-3 AND cellulose pulp
0
barium OR 7440-39-3 AND cellulose
206 NR
barium OR 7440-39-3 AND cellulose NOT removal
204
barium OR 7440-39-3 AND paper AND rag
0
barium OR 7440-39-3 AND paper AND grass
1
barium OR 7440-39-3 AND wood pulp
0
barium OR 7440-39-3 AND lignin 4
barium OR 7440-39-3 AND cooking liquor
0
barium OR 7440-39-3 AND sulfite process
0
barium OR 7440-39-3 AND chemical pulping
0
barium OR 7440-39-3 AND mechanical pulping
0
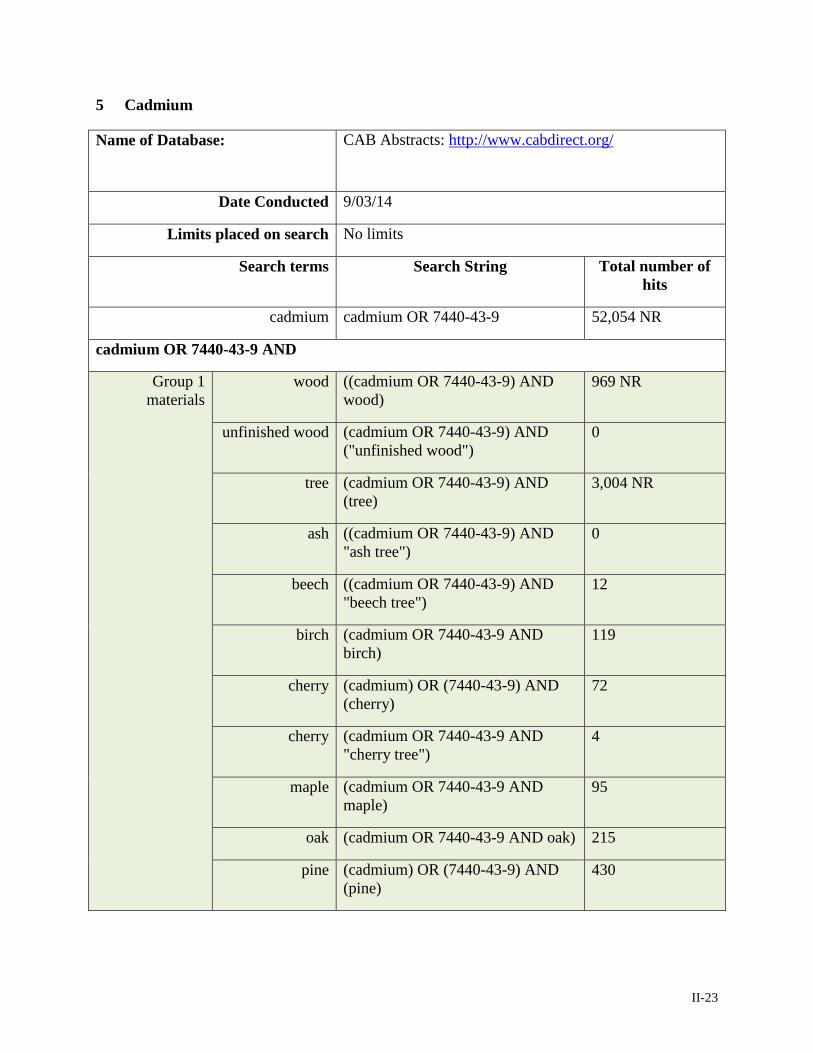
II-23
5 Cadmium
Name of Database: CAB Abstracts: http://www.cabdirect.org/
Date Conducted 9/03/14
Limits placed on search No limits
Search terms Search String Total number of hits
cadmium cadmium OR 7440-43-9 52,054 NR
cadmium OR 7440-43-9 AND
Group 1 materials
wood ((cadmium OR 7440-43-9) AND wood)
969 NR
unfinished wood (cadmium OR 7440-43-9) AND ("unfinished wood")
0
tree (cadmium OR 7440-43-9) AND (tree)
3,004 NR
ash ((cadmium OR 7440-43-9) AND "ash tree")
0
beech ((cadmium OR 7440-43-9) AND "beech tree")
12
birch (cadmium OR 7440-43-9 AND birch)
119
cherry (cadmium) OR (7440-43-9) AND (cherry)
72
cherry (cadmium OR 7440-43-9 AND "cherry tree")
4
maple (cadmium OR 7440-43-9 AND maple)
95
oak (cadmium OR 7440-43-9 AND oak) 215
pine (cadmium) OR (7440-43-9) AND (pine)
430
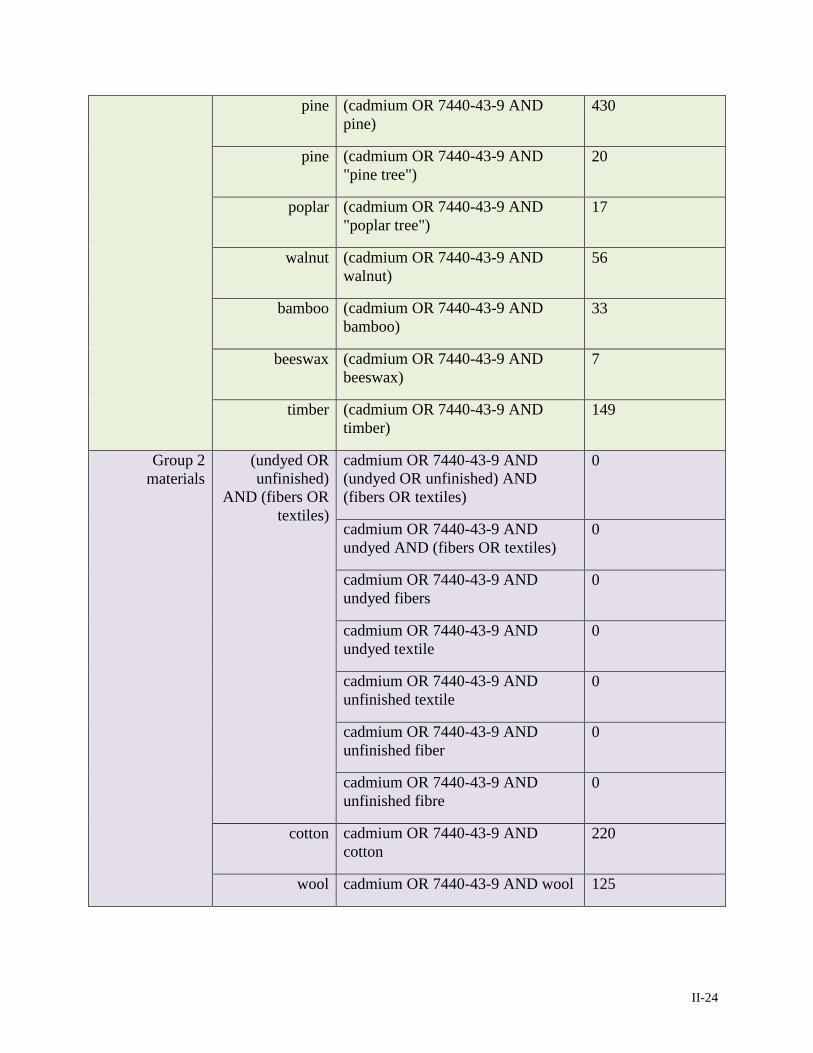
II-24
pine (cadmium OR 7440-43-9 AND pine)
430
pine (cadmium OR 7440-43-9 AND "pine tree")
20
poplar (cadmium OR 7440-43-9 AND "poplar tree")
17
walnut (cadmium OR 7440-43-9 AND walnut)
56
bamboo (cadmium OR 7440-43-9 AND bamboo)
33
beeswax (cadmium OR 7440-43-9 AND beeswax)
7
timber (cadmium OR 7440-43-9 AND timber)
149
Group 2 materials
(undyed OR unfinished)
AND (fibers OR textiles)
cadmium OR 7440-43-9 AND (undyed OR unfinished) AND (fibers OR textiles)
0
cadmium OR 7440-43-9 AND undyed AND (fibers OR textiles)
0
cadmium OR 7440-43-9 AND undyed fibers
0
cadmium OR 7440-43-9 AND undyed textile
0
cadmium OR 7440-43-9 AND unfinished textile
0
cadmium OR 7440-43-9 AND unfinished fiber
0
cadmium OR 7440-43-9 AND unfinished fibre
0
cotton cadmium OR 7440-43-9 AND cotton
220
wool cadmium OR 7440-43-9 AND wool 125
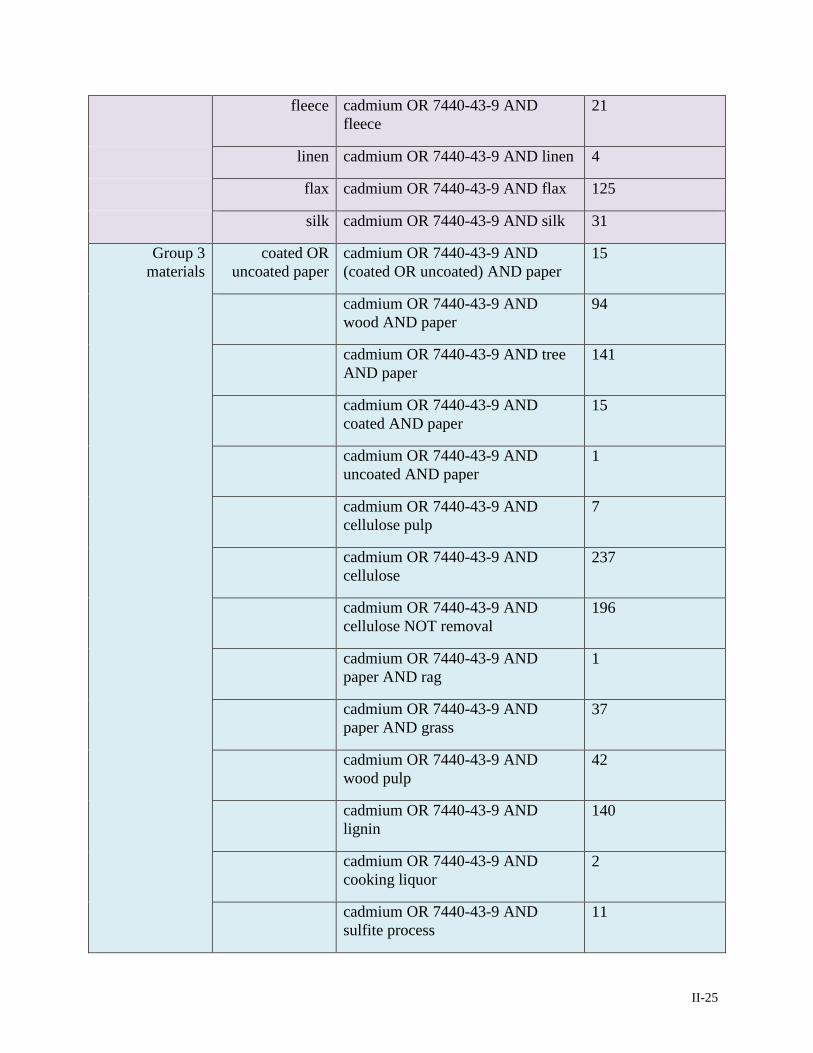
II-25
fleece cadmium OR 7440-43-9 AND fleece
21
linen cadmium OR 7440-43-9 AND linen 4
flax cadmium OR 7440-43-9 AND flax 125
silk cadmium OR 7440-43-9 AND silk 31
Group 3 materials
coated OR uncoated paper
cadmium OR 7440-43-9 AND (coated OR uncoated) AND paper
15
cadmium OR 7440-43-9 AND wood AND paper
94
cadmium OR 7440-43-9 AND tree AND paper
141
cadmium OR 7440-43-9 AND coated AND paper
15
cadmium OR 7440-43-9 AND uncoated AND paper
1
cadmium OR 7440-43-9 AND cellulose pulp
7
cadmium OR 7440-43-9 AND cellulose
237
cadmium OR 7440-43-9 AND cellulose NOT removal
196
cadmium OR 7440-43-9 AND paper AND rag
1
cadmium OR 7440-43-9 AND paper AND grass
37
cadmium OR 7440-43-9 AND wood pulp
42
cadmium OR 7440-43-9 AND lignin
140
cadmium OR 7440-43-9 AND cooking liquor
2
cadmium OR 7440-43-9 AND sulfite process
11
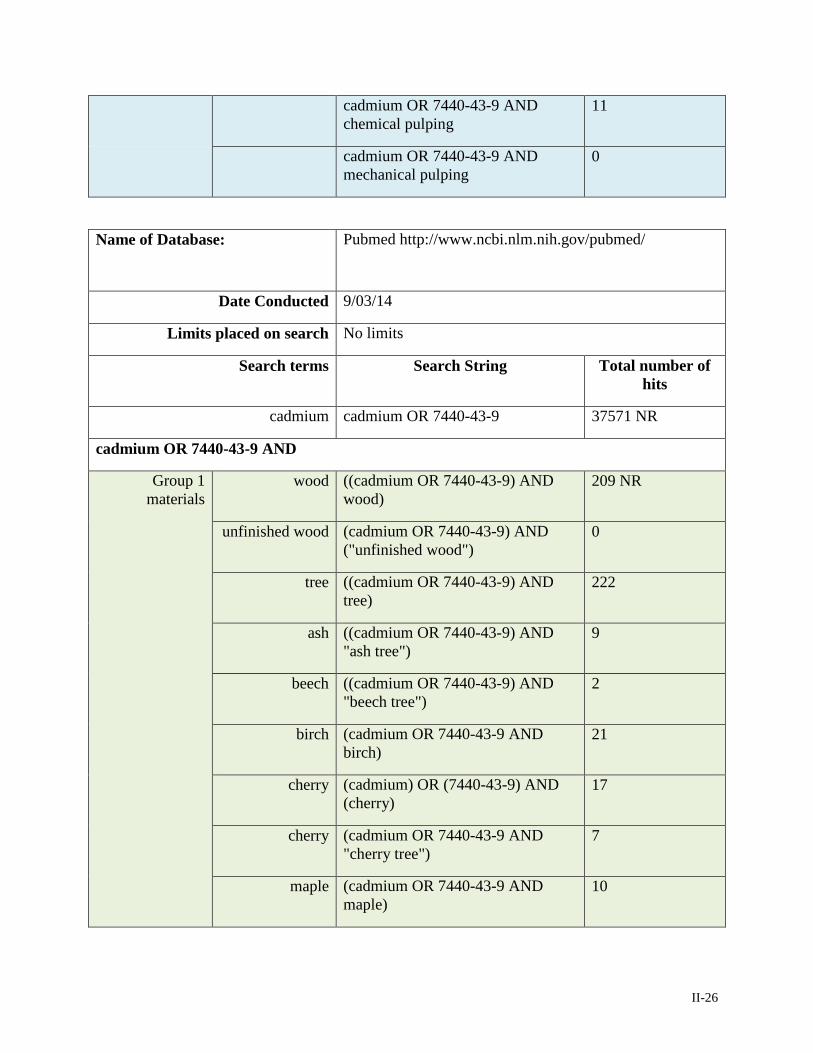
II-26
cadmium OR 7440-43-9 AND chemical pulping
11
cadmium OR 7440-43-9 AND mechanical pulping
0
Name of Database: Pubmed http://www.ncbi.nlm.nih.gov/pubmed/
Date Conducted 9/03/14
Limits placed on search No limits
Search terms Search String Total number of hits
cadmium cadmium OR 7440-43-9 37571 NR
cadmium OR 7440-43-9 AND
Group 1 materials
wood ((cadmium OR 7440-43-9) AND wood)
209 NR
unfinished wood (cadmium OR 7440-43-9) AND ("unfinished wood")
0
tree ((cadmium OR 7440-43-9) AND tree)
222
ash ((cadmium OR 7440-43-9) AND "ash tree")
9
beech ((cadmium OR 7440-43-9) AND "beech tree")
2
birch (cadmium OR 7440-43-9 AND birch)
21
cherry (cadmium) OR (7440-43-9) AND (cherry)
17
cherry (cadmium OR 7440-43-9 AND "cherry tree")
7
maple (cadmium OR 7440-43-9 AND maple)
10
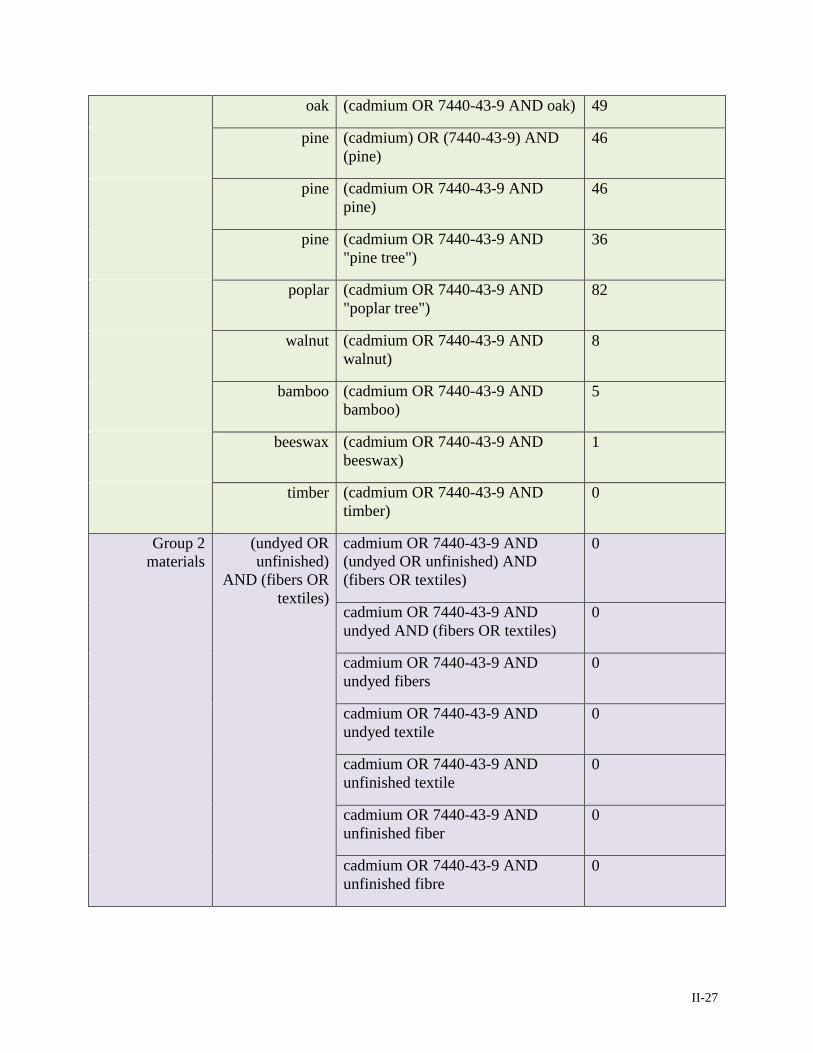
II-27
oak (cadmium OR 7440-43-9 AND oak) 49
pine (cadmium) OR (7440-43-9) AND (pine)
46
pine (cadmium OR 7440-43-9 AND pine)
46
pine (cadmium OR 7440-43-9 AND "pine tree")
36
poplar (cadmium OR 7440-43-9 AND "poplar tree")
82
walnut (cadmium OR 7440-43-9 AND walnut)
8
bamboo (cadmium OR 7440-43-9 AND bamboo)
5
beeswax (cadmium OR 7440-43-9 AND beeswax)
1
timber (cadmium OR 7440-43-9 AND timber)
0
Group 2 materials
(undyed OR unfinished)
AND (fibers OR textiles)
cadmium OR 7440-43-9 AND (undyed OR unfinished) AND (fibers OR textiles)
0
cadmium OR 7440-43-9 AND undyed AND (fibers OR textiles)
0
cadmium OR 7440-43-9 AND undyed fibers
0
cadmium OR 7440-43-9 AND undyed textile
0
cadmium OR 7440-43-9 AND unfinished textile
0
cadmium OR 7440-43-9 AND unfinished fiber
0
cadmium OR 7440-43-9 AND unfinished fibre
0
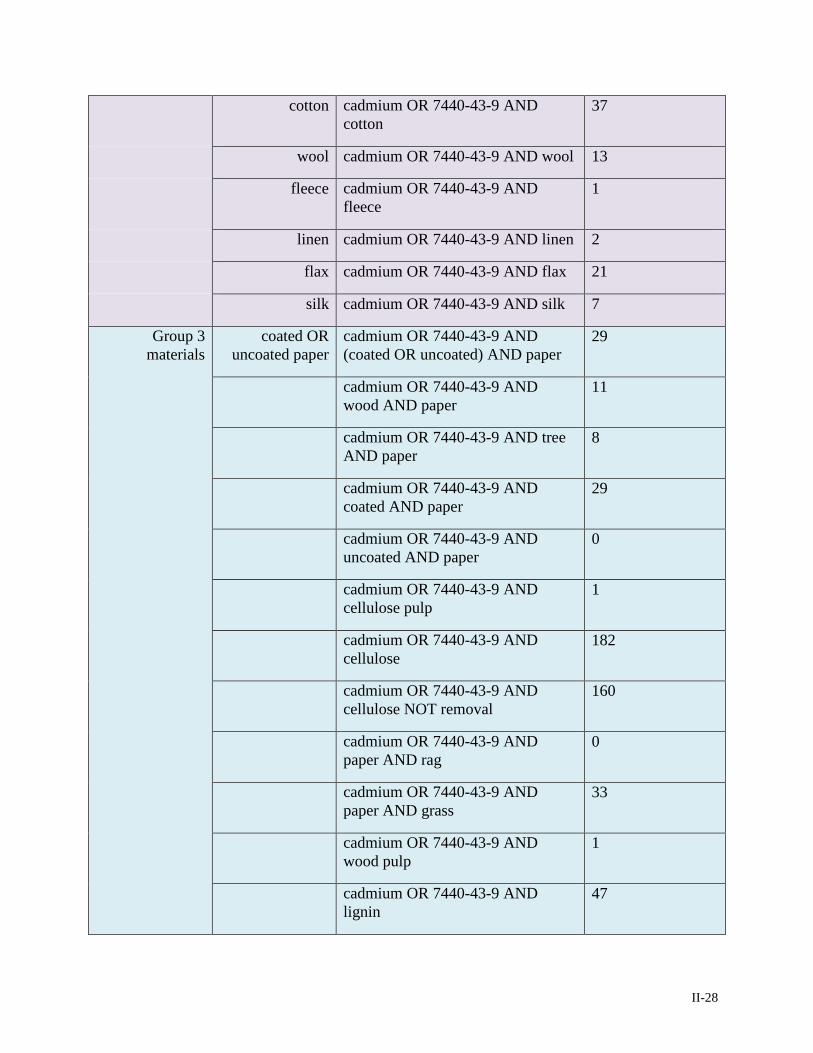
II-28
cotton cadmium OR 7440-43-9 AND cotton
37
wool cadmium OR 7440-43-9 AND wool 13
fleece cadmium OR 7440-43-9 AND fleece
1
linen cadmium OR 7440-43-9 AND linen 2
flax cadmium OR 7440-43-9 AND flax 21
silk cadmium OR 7440-43-9 AND silk 7
Group 3 materials
coated OR uncoated paper
cadmium OR 7440-43-9 AND (coated OR uncoated) AND paper
29
cadmium OR 7440-43-9 AND wood AND paper
11
cadmium OR 7440-43-9 AND tree AND paper
8
cadmium OR 7440-43-9 AND coated AND paper
29
cadmium OR 7440-43-9 AND uncoated AND paper
0
cadmium OR 7440-43-9 AND cellulose pulp
1
cadmium OR 7440-43-9 AND cellulose
182
cadmium OR 7440-43-9 AND cellulose NOT removal
160
cadmium OR 7440-43-9 AND paper AND rag
0
cadmium OR 7440-43-9 AND paper AND grass
33
cadmium OR 7440-43-9 AND wood pulp
1
cadmium OR 7440-43-9 AND lignin
47
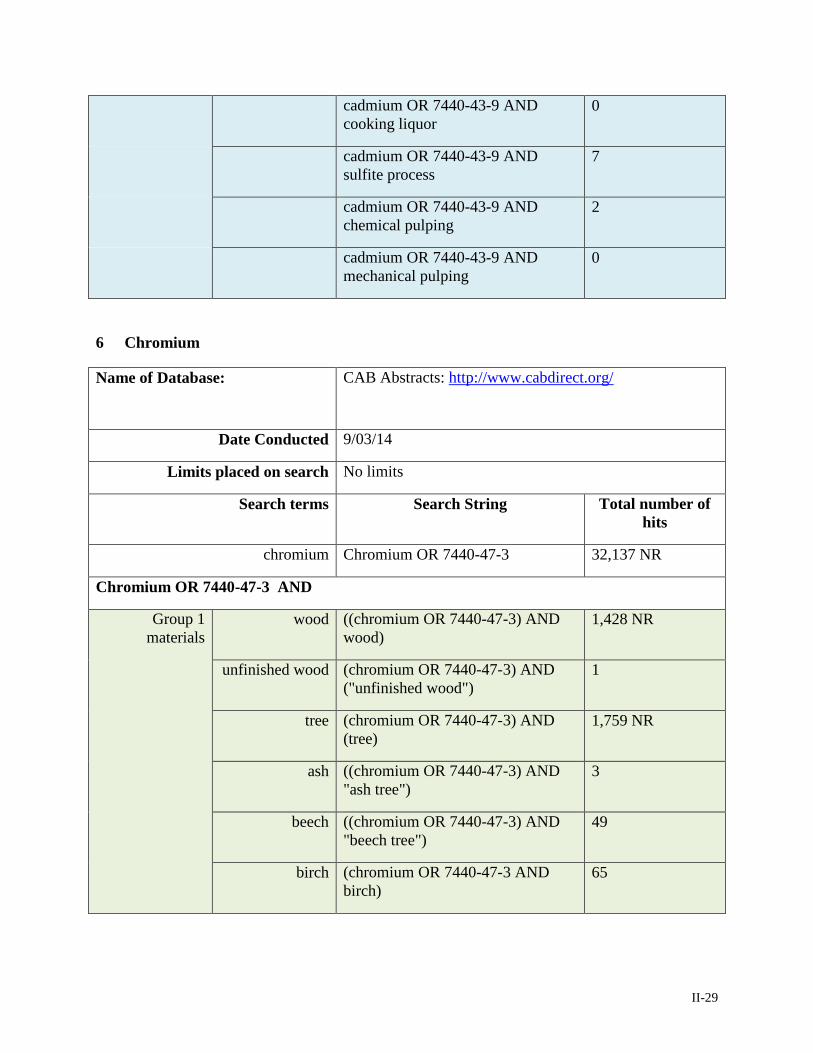
II-29
cadmium OR 7440-43-9 AND cooking liquor
0
cadmium OR 7440-43-9 AND sulfite process
7
cadmium OR 7440-43-9 AND chemical pulping
2
cadmium OR 7440-43-9 AND mechanical pulping
0
6 Chromium
Name of Database: CAB Abstracts: http://www.cabdirect.org/
Date Conducted 9/03/14
Limits placed on search No limits
Search terms Search String Total number of hits
chromium Chromium OR 7440-47-3 32,137 NR
Chromium OR 7440-47-3 AND
Group 1 materials
wood ((chromium OR 7440-47-3) AND wood)
1,428 NR
unfinished wood (chromium OR 7440-47-3) AND ("unfinished wood")
1
tree (chromium OR 7440-47-3) AND (tree)
1,759 NR
ash ((chromium OR 7440-47-3) AND "ash tree")
3
beech ((chromium OR 7440-47-3) AND "beech tree")
49
birch (chromium OR 7440-47-3 AND birch)
65
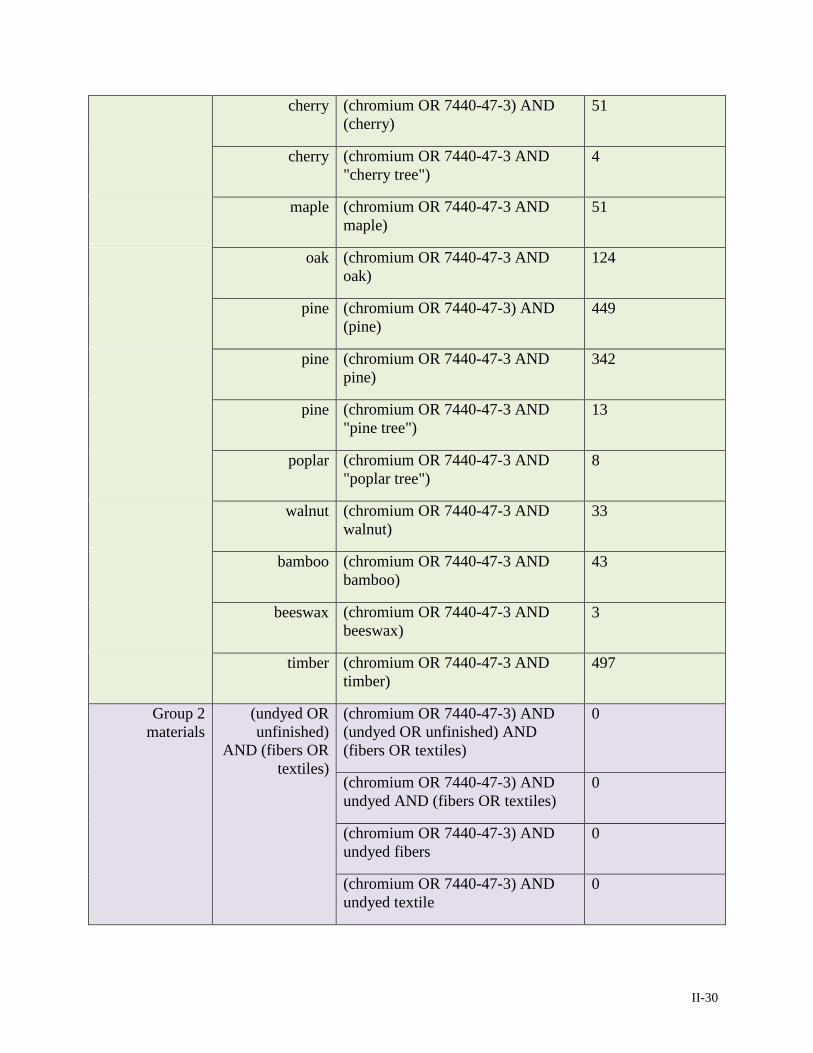
II-30
cherry (chromium OR 7440-47-3) AND (cherry)
51
cherry (chromium OR 7440-47-3 AND "cherry tree")
4
maple (chromium OR 7440-47-3 AND maple)
51
oak (chromium OR 7440-47-3 AND oak)
124
pine (chromium OR 7440-47-3) AND (pine)
449
pine (chromium OR 7440-47-3 AND pine)
342
pine (chromium OR 7440-47-3 AND "pine tree")
13
poplar (chromium OR 7440-47-3 AND "poplar tree")
8
walnut (chromium OR 7440-47-3 AND walnut)
33
bamboo (chromium OR 7440-47-3 AND bamboo)
43
beeswax (chromium OR 7440-47-3 AND beeswax)
3
timber (chromium OR 7440-47-3 AND timber)
497
Group 2 materials
(undyed OR unfinished)
AND (fibers OR textiles)
(chromium OR 7440-47-3) AND (undyed OR unfinished) AND (fibers OR textiles)
0
(chromium OR 7440-47-3) AND undyed AND (fibers OR textiles)
0
(chromium OR 7440-47-3) AND undyed fibers
0
(chromium OR 7440-47-3) AND undyed textile
0
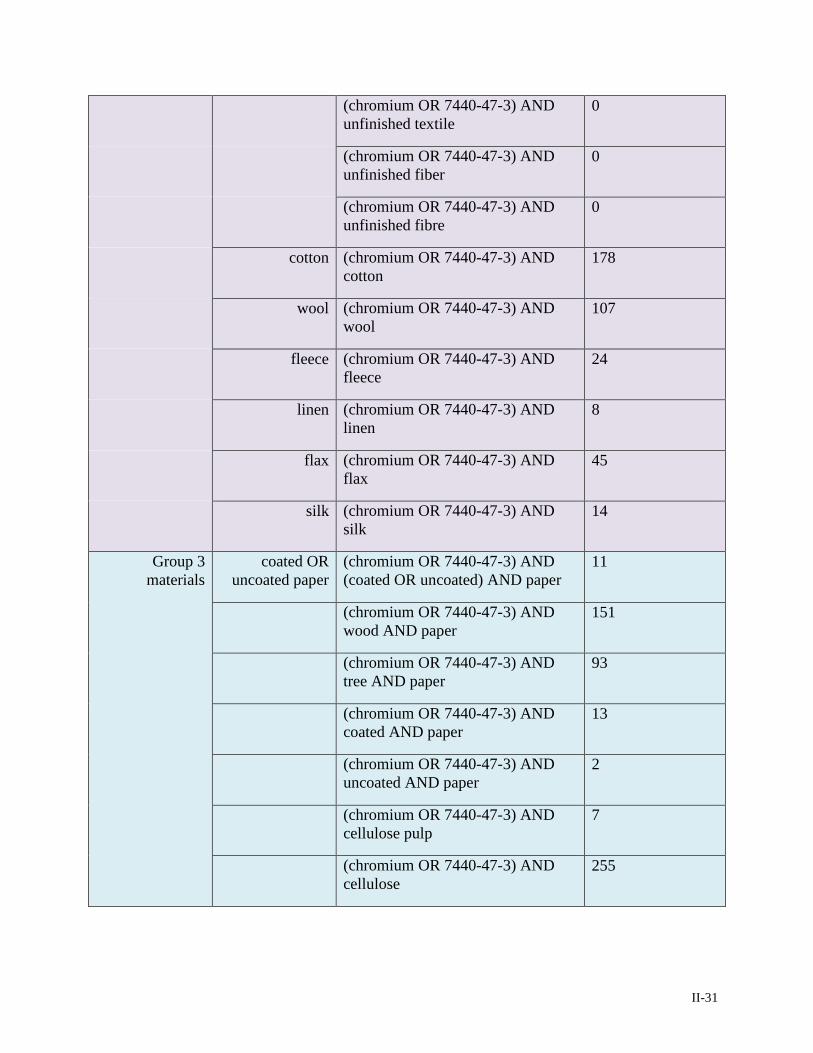
II-31
(chromium OR 7440-47-3) AND unfinished textile
0
(chromium OR 7440-47-3) AND unfinished fiber
0
(chromium OR 7440-47-3) AND unfinished fibre
0
cotton (chromium OR 7440-47-3) AND cotton
178
wool (chromium OR 7440-47-3) AND wool
107
fleece (chromium OR 7440-47-3) AND fleece
24
linen (chromium OR 7440-47-3) AND linen
8
flax (chromium OR 7440-47-3) AND flax
45
silk (chromium OR 7440-47-3) AND silk
14
Group 3 materials
coated OR uncoated paper
(chromium OR 7440-47-3) AND (coated OR uncoated) AND paper
11
(chromium OR 7440-47-3) AND wood AND paper
151
(chromium OR 7440-47-3) AND tree AND paper
93
(chromium OR 7440-47-3) AND coated AND paper
13
(chromium OR 7440-47-3) AND uncoated AND paper
2
(chromium OR 7440-47-3) AND cellulose pulp
7
(chromium OR 7440-47-3) AND cellulose
255
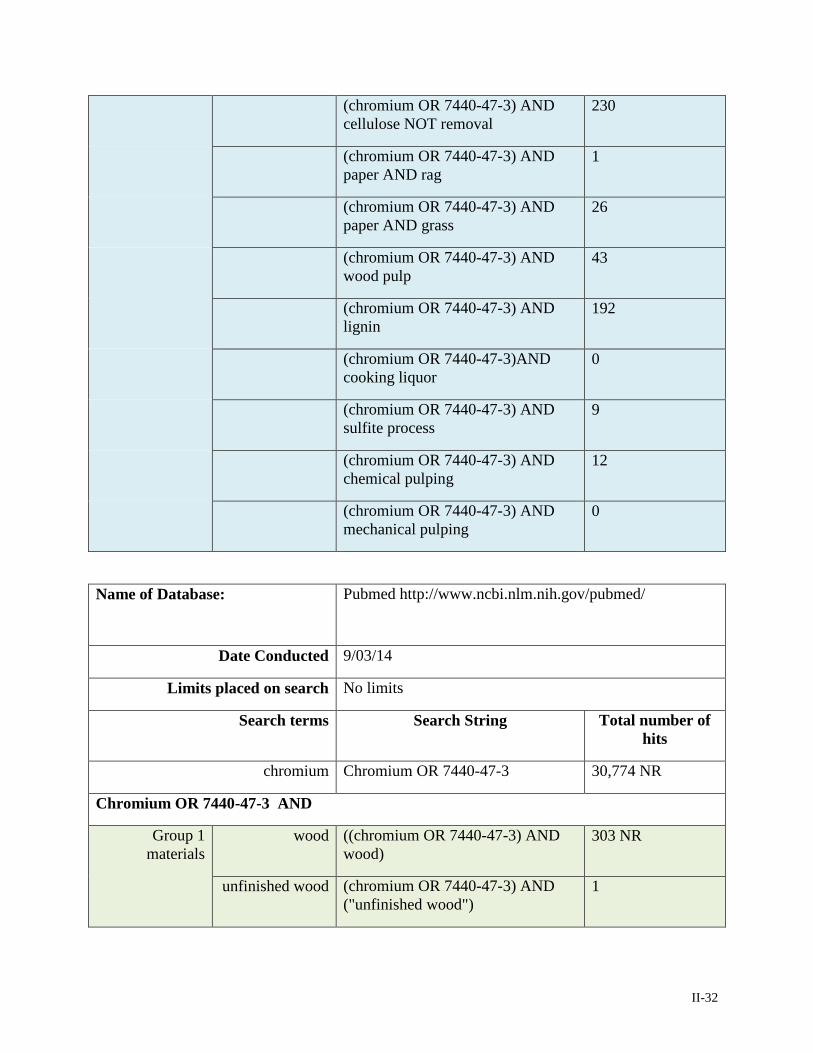
II-32
(chromium OR 7440-47-3) AND cellulose NOT removal
230
(chromium OR 7440-47-3) AND paper AND rag
1
(chromium OR 7440-47-3) AND paper AND grass
26
(chromium OR 7440-47-3) AND wood pulp
43
(chromium OR 7440-47-3) AND lignin
192
(chromium OR 7440-47-3)AND cooking liquor
0
(chromium OR 7440-47-3) AND sulfite process
9
(chromium OR 7440-47-3) AND chemical pulping
12
(chromium OR 7440-47-3) AND mechanical pulping
0
Name of Database: Pubmed http://www.ncbi.nlm.nih.gov/pubmed/
Date Conducted 9/03/14
Limits placed on search No limits
Search terms Search String Total number of hits
chromium Chromium OR 7440-47-3 30,774 NR
Chromium OR 7440-47-3 AND
Group 1 materials
wood ((chromium OR 7440-47-3) AND wood)
303 NR
unfinished wood (chromium OR 7440-47-3) AND ("unfinished wood")
1
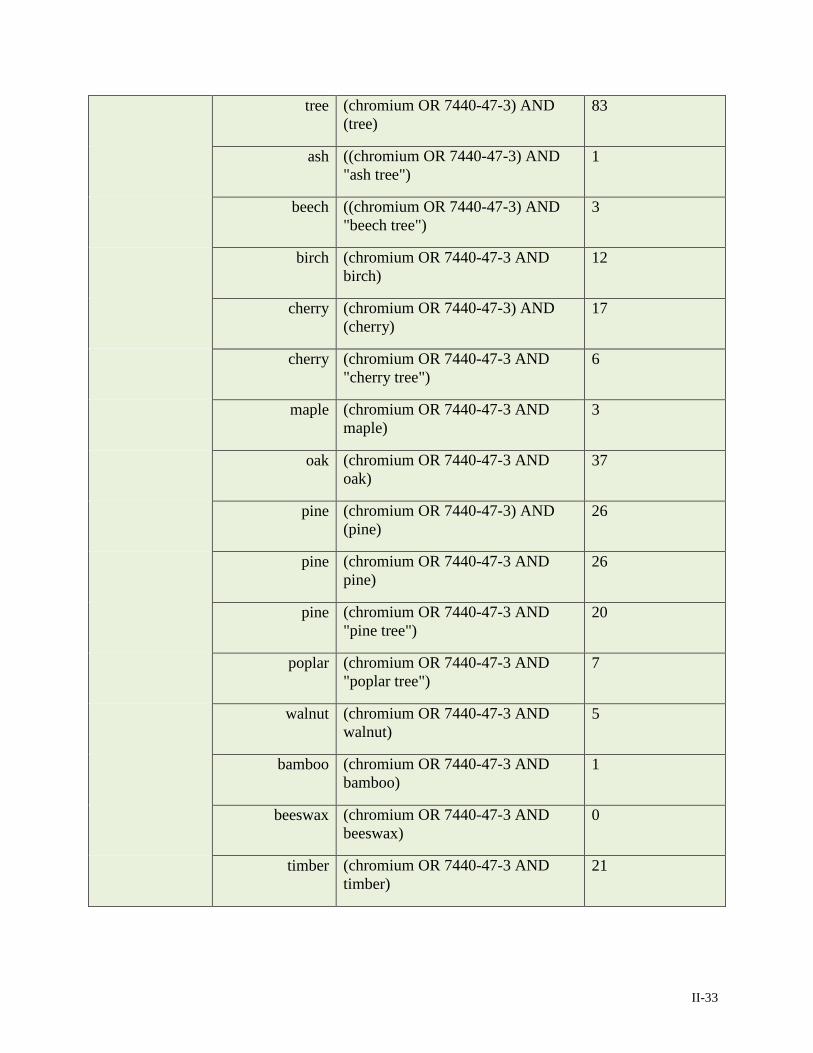
II-33
tree (chromium OR 7440-47-3) AND (tree)
83
ash ((chromium OR 7440-47-3) AND "ash tree")
1
beech ((chromium OR 7440-47-3) AND "beech tree")
3
birch (chromium OR 7440-47-3 AND birch)
12
cherry (chromium OR 7440-47-3) AND (cherry)
17
cherry (chromium OR 7440-47-3 AND "cherry tree")
6
maple (chromium OR 7440-47-3 AND maple)
3
oak (chromium OR 7440-47-3 AND oak)
37
pine (chromium OR 7440-47-3) AND (pine)
26
pine (chromium OR 7440-47-3 AND pine)
26
pine (chromium OR 7440-47-3 AND "pine tree")
20
poplar (chromium OR 7440-47-3 AND "poplar tree")
7
walnut (chromium OR 7440-47-3 AND walnut)
5
bamboo (chromium OR 7440-47-3 AND bamboo)
1
beeswax (chromium OR 7440-47-3 AND beeswax)
0
timber (chromium OR 7440-47-3 AND timber)
21
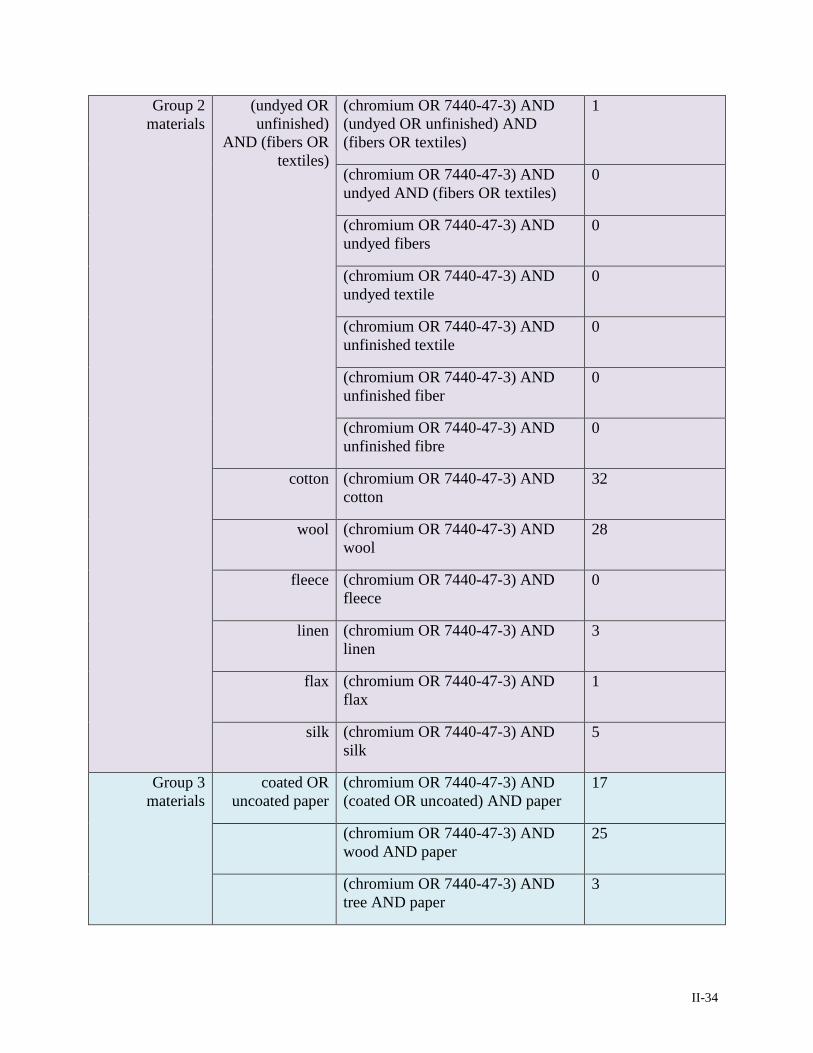
II-34
Group 2 materials
(undyed OR unfinished)
AND (fibers OR textiles)
(chromium OR 7440-47-3) AND (undyed OR unfinished) AND (fibers OR textiles)
1
(chromium OR 7440-47-3) AND undyed AND (fibers OR textiles)
0
(chromium OR 7440-47-3) AND undyed fibers
0
(chromium OR 7440-47-3) AND undyed textile
0
(chromium OR 7440-47-3) AND unfinished textile
0
(chromium OR 7440-47-3) AND unfinished fiber
0
(chromium OR 7440-47-3) AND unfinished fibre
0
cotton (chromium OR 7440-47-3) AND cotton
32
wool (chromium OR 7440-47-3) AND wool
28
fleece (chromium OR 7440-47-3) AND fleece
0
linen (chromium OR 7440-47-3) AND linen
3
flax (chromium OR 7440-47-3) AND flax
1
silk (chromium OR 7440-47-3) AND silk
5
Group 3 materials
coated OR uncoated paper
(chromium OR 7440-47-3) AND (coated OR uncoated) AND paper
17
(chromium OR 7440-47-3) AND wood AND paper
25
(chromium OR 7440-47-3) AND tree AND paper
3
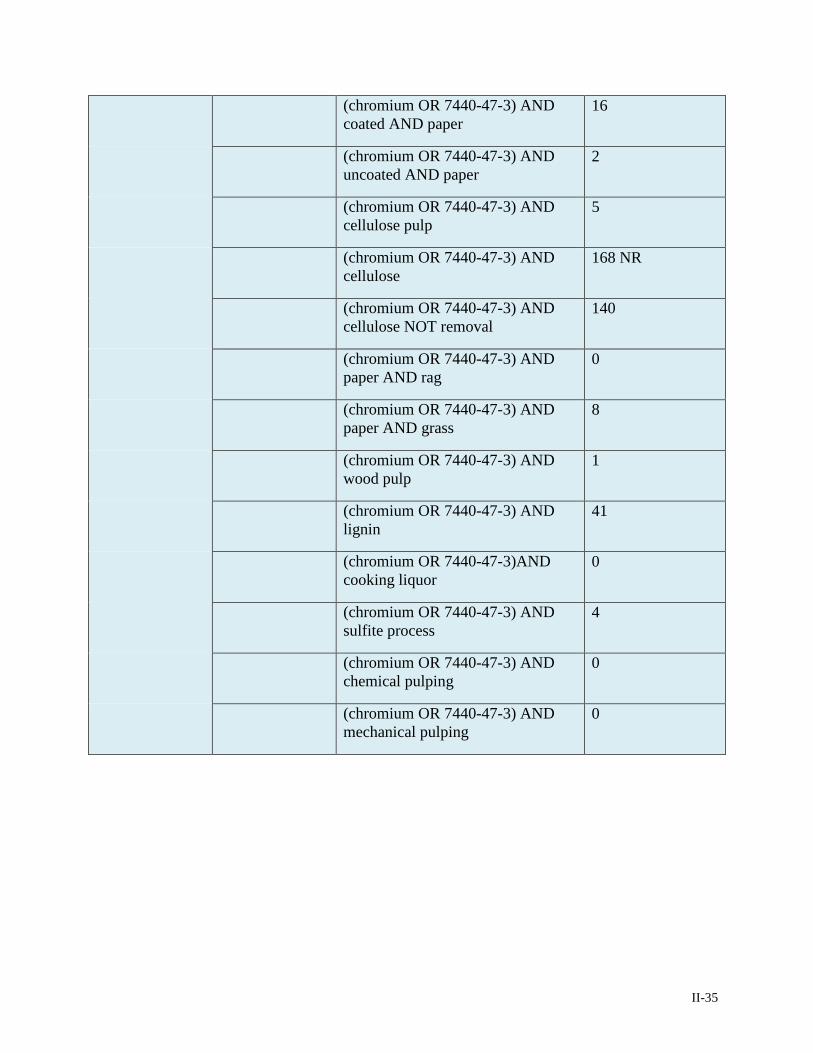
II-35
(chromium OR 7440-47-3) AND coated AND paper
16
(chromium OR 7440-47-3) AND uncoated AND paper
2
(chromium OR 7440-47-3) AND cellulose pulp
5
(chromium OR 7440-47-3) AND cellulose
168 NR
(chromium OR 7440-47-3) AND cellulose NOT removal
140
(chromium OR 7440-47-3) AND paper AND rag
0
(chromium OR 7440-47-3) AND paper AND grass
8
(chromium OR 7440-47-3) AND wood pulp
1
(chromium OR 7440-47-3) AND lignin
41
(chromium OR 7440-47-3)AND cooking liquor
0
(chromium OR 7440-47-3) AND sulfite process
4
(chromium OR 7440-47-3) AND chemical pulping
0
(chromium OR 7440-47-3) AND mechanical pulping
0
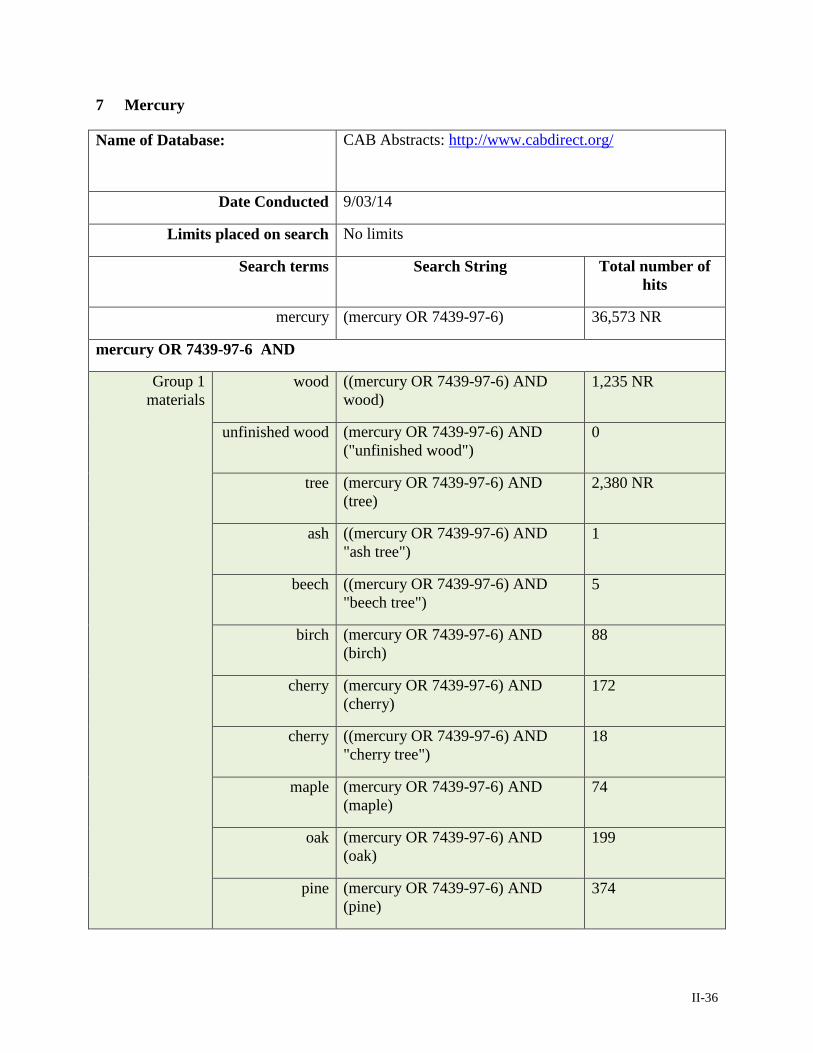
II-36
7 Mercury
Name of Database: CAB Abstracts: http://www.cabdirect.org/
Date Conducted 9/03/14
Limits placed on search No limits
Search terms Search String Total number of hits
mercury (mercury OR 7439-97-6) 36,573 NR
mercury OR 7439-97-6 AND
Group 1 materials
wood ((mercury OR 7439-97-6) AND wood)
1,235 NR
unfinished wood (mercury OR 7439-97-6) AND ("unfinished wood")
0
tree (mercury OR 7439-97-6) AND (tree)
2,380 NR
ash ((mercury OR 7439-97-6) AND "ash tree")
1
beech ((mercury OR 7439-97-6) AND "beech tree")
5
birch (mercury OR 7439-97-6) AND (birch)
88
cherry (mercury OR 7439-97-6) AND (cherry)
172
cherry ((mercury OR 7439-97-6) AND "cherry tree")
18
maple (mercury OR 7439-97-6) AND (maple)
74
oak (mercury OR 7439-97-6) AND (oak)
199
pine (mercury OR 7439-97-6) AND (pine)
374
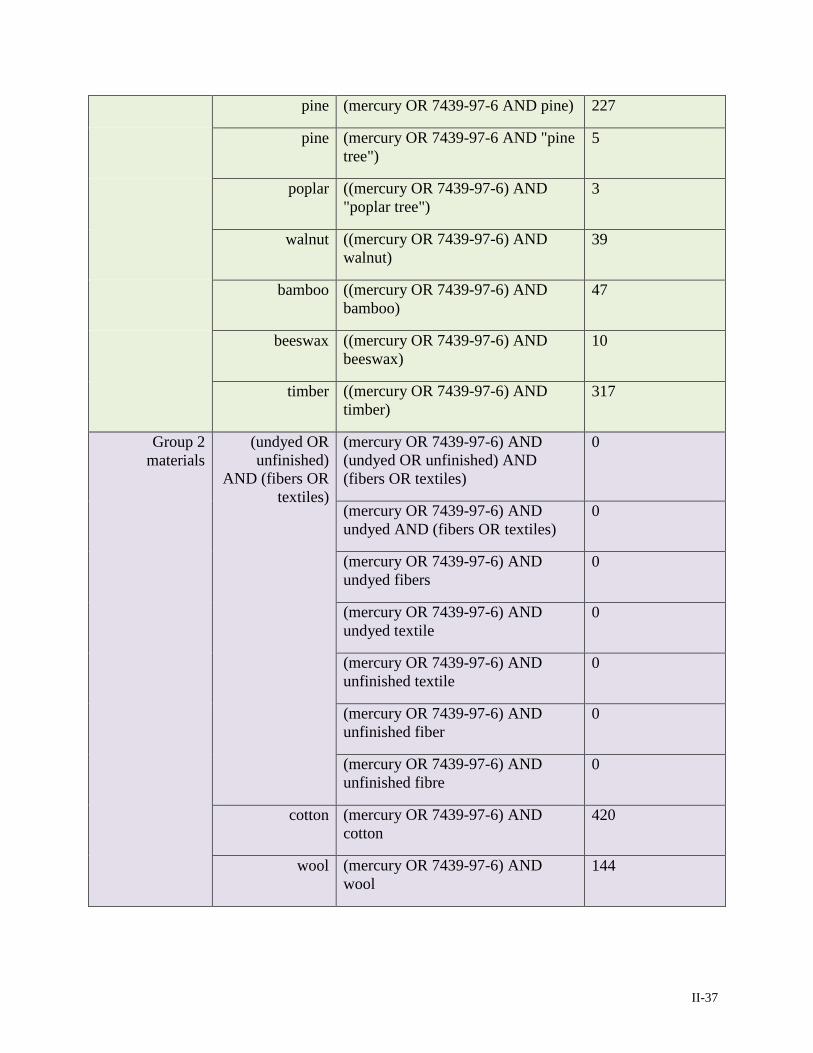
II-37
pine (mercury OR 7439-97-6 AND pine) 227
pine (mercury OR 7439-97-6 AND "pine tree")
5
poplar ((mercury OR 7439-97-6) AND "poplar tree")
3
walnut ((mercury OR 7439-97-6) AND walnut)
39
bamboo ((mercury OR 7439-97-6) AND bamboo)
47
beeswax ((mercury OR 7439-97-6) AND beeswax)
10
timber ((mercury OR 7439-97-6) AND timber)
317
Group 2 materials
(undyed OR unfinished)
AND (fibers OR textiles)
(mercury OR 7439-97-6) AND (undyed OR unfinished) AND (fibers OR textiles)
0
(mercury OR 7439-97-6) AND undyed AND (fibers OR textiles)
0
(mercury OR 7439-97-6) AND undyed fibers
0
(mercury OR 7439-97-6) AND undyed textile
0
(mercury OR 7439-97-6) AND unfinished textile
0
(mercury OR 7439-97-6) AND unfinished fiber
0
(mercury OR 7439-97-6) AND unfinished fibre
0
cotton (mercury OR 7439-97-6) AND cotton
420
wool (mercury OR 7439-97-6) AND wool
144

II-38
fleece (mercury OR 7439-97-6) AND fleece
18
linen (mercury OR 7439-97-6) AND linen
21
flax (mercury OR 7439-97-6) AND flax 190
silk (mercury OR 7439-97-6) AND silk 38
Group 3 materials
coated OR uncoated paper
(mercury OR 7439-97-6) AND (coated OR uncoated) AND paper
23
(mercury OR 7439-97-6) AND wood AND paper
183
(mercury OR 7439-97-6) AND tree AND paper
194
(mercury OR 7439-97-6) AND coated AND paper
23
(mercury OR 7439-97-6) AND uncoated AND paper
1
(mercury OR 7439-97-6) AND cellulose pulp
16
(mercury OR 7439-97-6) AND cellulose
190
(mercury OR 7439-97-6) AND cellulose NOT removal
178
(mercury OR 7439-97-6) AND paper AND rag
2
(mercury OR 7439-97-6) AND paper AND grass
39
(mercury OR 7439-97-6) AND wood pulp
74
(mercury OR 7439-97-6) AND lignin
64
(mercury OR 7439-97-6) AND cooking liquor
0
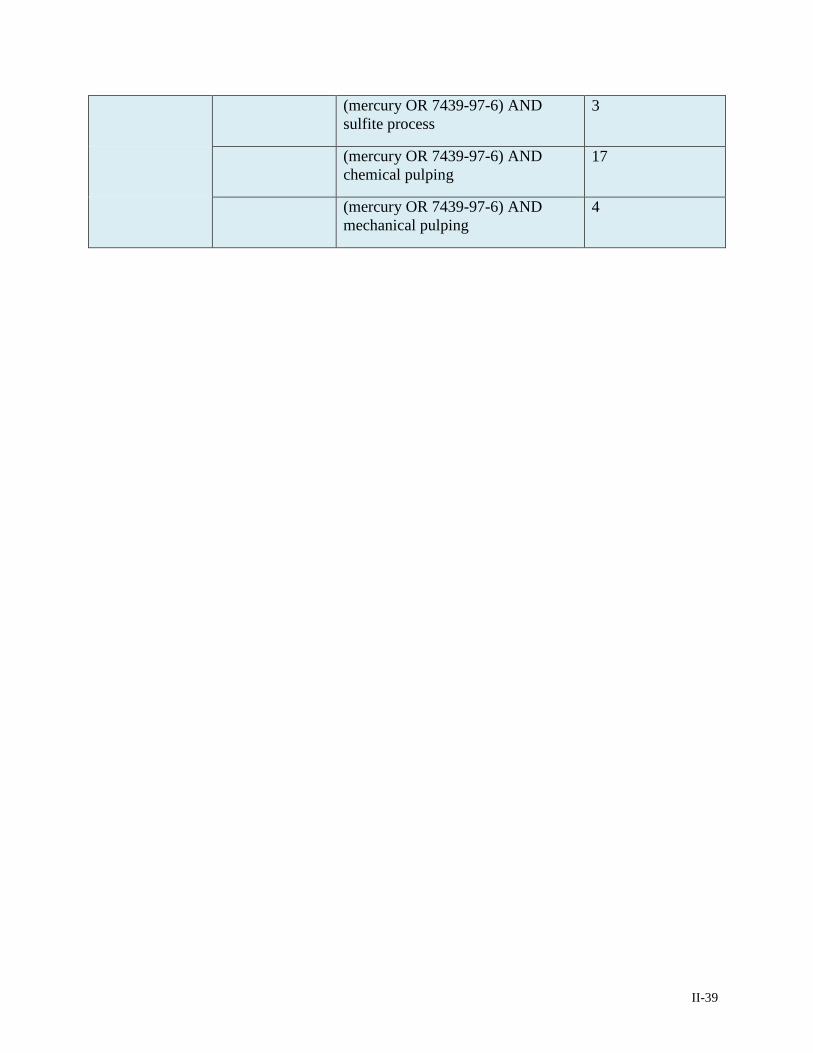
II-39
(mercury OR 7439-97-6) AND sulfite process
3
(mercury OR 7439-97-6) AND chemical pulping
17
(mercury OR 7439-97-6) AND mechanical pulping
4
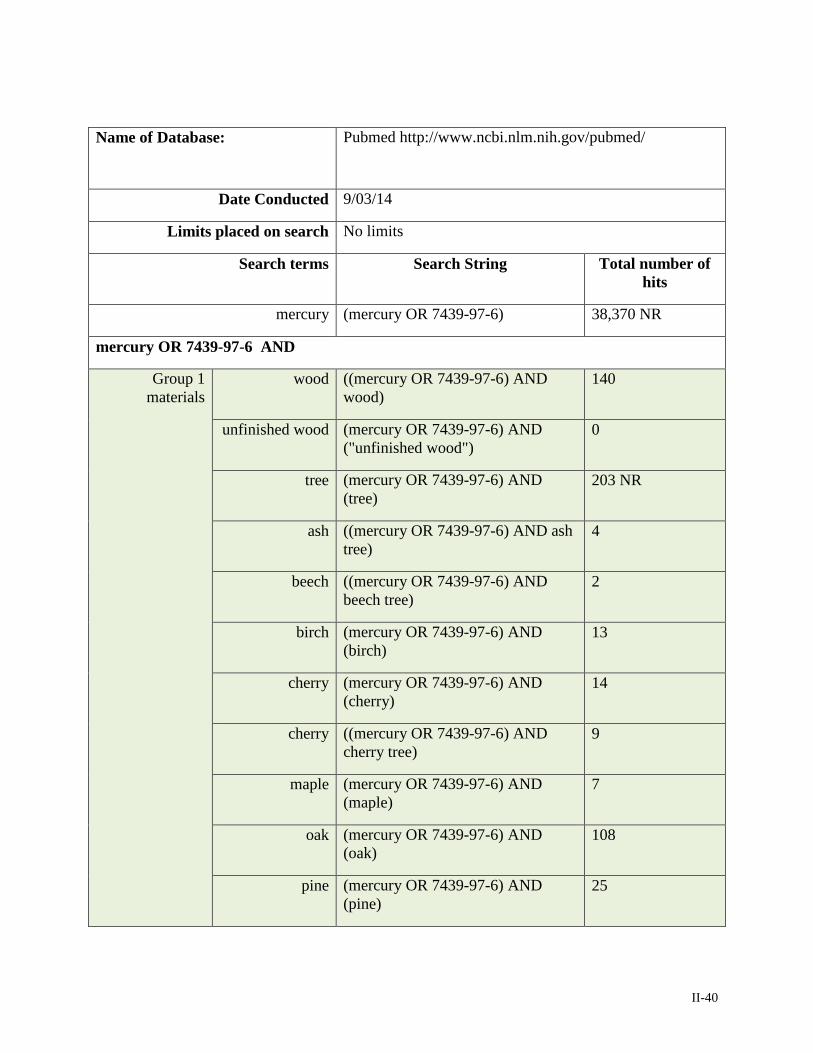
II-40
Name of Database: Pubmed http://www.ncbi.nlm.nih.gov/pubmed/
Date Conducted 9/03/14
Limits placed on search No limits
Search terms Search String Total number of hits
mercury (mercury OR 7439-97-6) 38,370 NR
mercury OR 7439-97-6 AND
Group 1 materials
wood ((mercury OR 7439-97-6) AND wood)
140
unfinished wood (mercury OR 7439-97-6) AND ("unfinished wood")
0
tree (mercury OR 7439-97-6) AND (tree)
203 NR
ash ((mercury OR 7439-97-6) AND ash tree)
4
beech ((mercury OR 7439-97-6) AND beech tree)
2
birch (mercury OR 7439-97-6) AND (birch)
13
cherry (mercury OR 7439-97-6) AND (cherry)
14
cherry ((mercury OR 7439-97-6) AND cherry tree)
9
maple (mercury OR 7439-97-6) AND (maple)
7
oak (mercury OR 7439-97-6) AND (oak)
108
pine (mercury OR 7439-97-6) AND (pine)
25
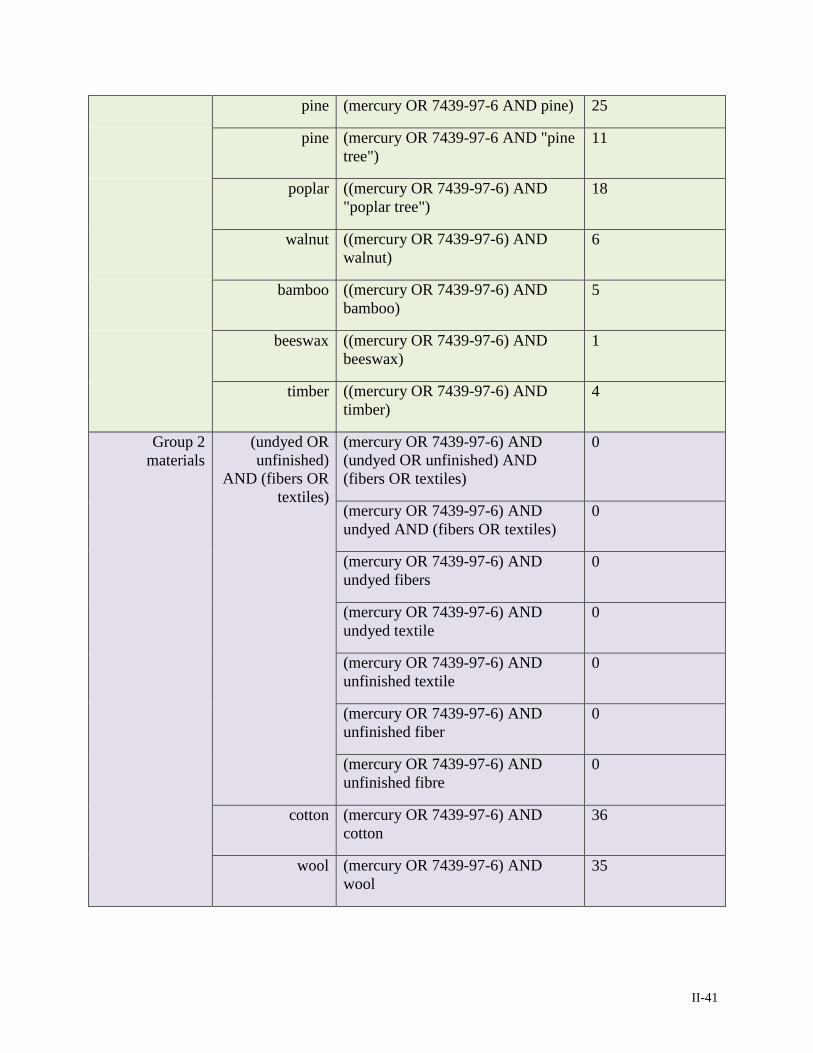
II-41
pine (mercury OR 7439-97-6 AND pine) 25
pine (mercury OR 7439-97-6 AND "pine tree")
11
poplar ((mercury OR 7439-97-6) AND "poplar tree")
18
walnut ((mercury OR 7439-97-6) AND walnut)
6
bamboo ((mercury OR 7439-97-6) AND bamboo)
5
beeswax ((mercury OR 7439-97-6) AND beeswax)
1
timber ((mercury OR 7439-97-6) AND timber)
4
Group 2 materials
(undyed OR unfinished)
AND (fibers OR textiles)
(mercury OR 7439-97-6) AND (undyed OR unfinished) AND (fibers OR textiles)
0
(mercury OR 7439-97-6) AND undyed AND (fibers OR textiles)
0
(mercury OR 7439-97-6) AND undyed fibers
0
(mercury OR 7439-97-6) AND undyed textile
0
(mercury OR 7439-97-6) AND unfinished textile
0
(mercury OR 7439-97-6) AND unfinished fiber
0
(mercury OR 7439-97-6) AND unfinished fibre
0
cotton (mercury OR 7439-97-6) AND cotton
36
wool (mercury OR 7439-97-6) AND wool
35
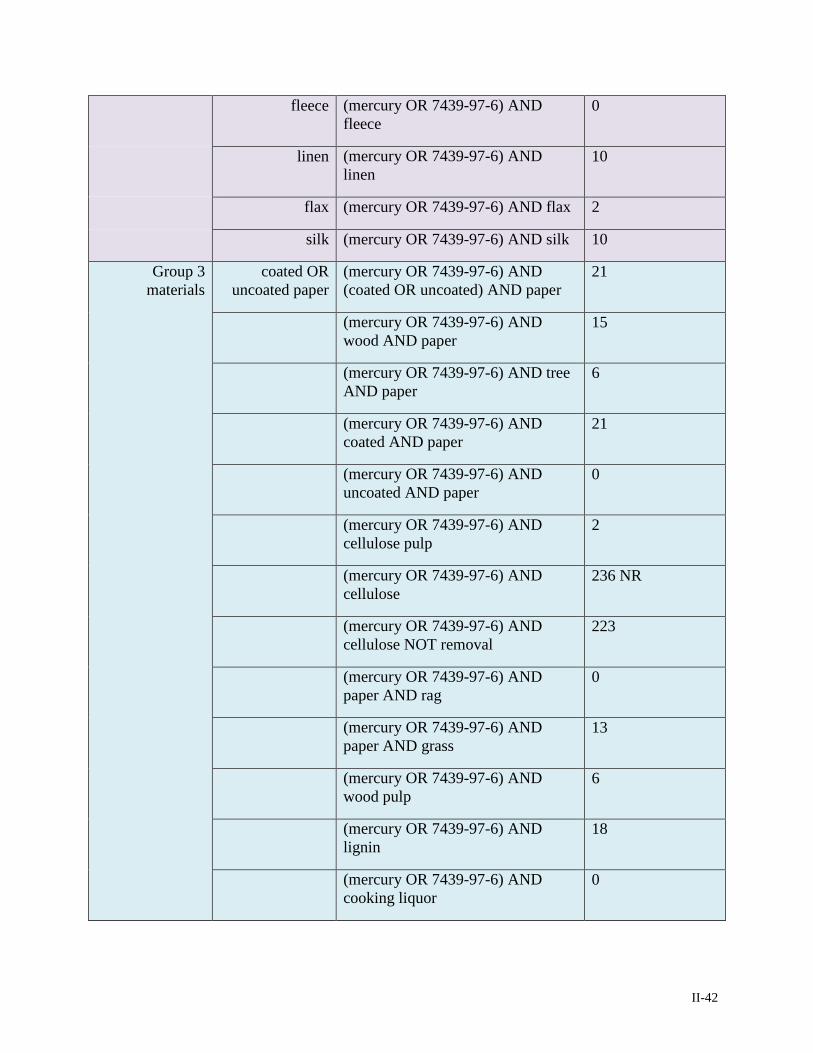
II-42
fleece (mercury OR 7439-97-6) AND fleece
0
linen (mercury OR 7439-97-6) AND linen
10
flax (mercury OR 7439-97-6) AND flax 2
silk (mercury OR 7439-97-6) AND silk 10
Group 3 materials
coated OR uncoated paper
(mercury OR 7439-97-6) AND (coated OR uncoated) AND paper
21
(mercury OR 7439-97-6) AND wood AND paper
15
(mercury OR 7439-97-6) AND tree AND paper
6
(mercury OR 7439-97-6) AND coated AND paper
21
(mercury OR 7439-97-6) AND uncoated AND paper
0
(mercury OR 7439-97-6) AND cellulose pulp
2
(mercury OR 7439-97-6) AND cellulose
236 NR
(mercury OR 7439-97-6) AND cellulose NOT removal
223
(mercury OR 7439-97-6) AND paper AND rag
0
(mercury OR 7439-97-6) AND paper AND grass
13
(mercury OR 7439-97-6) AND wood pulp
6
(mercury OR 7439-97-6) AND lignin
18
(mercury OR 7439-97-6) AND cooking liquor
0
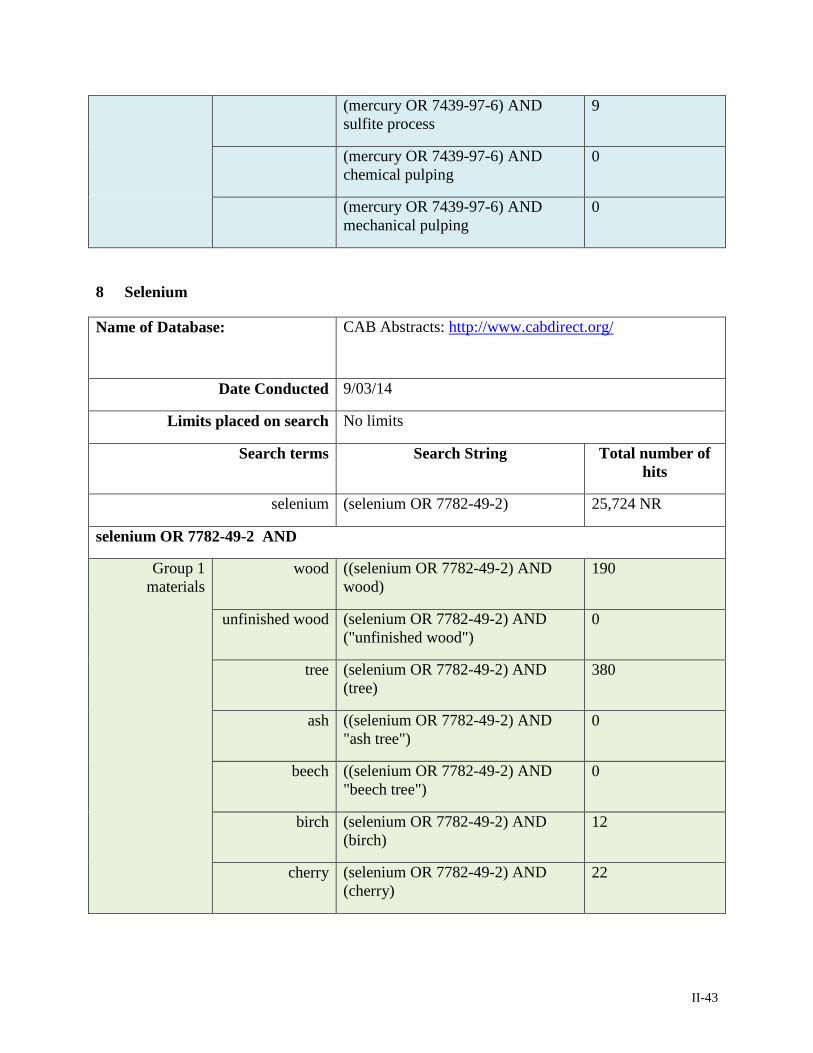
II-43
(mercury OR 7439-97-6) AND sulfite process
9
(mercury OR 7439-97-6) AND chemical pulping
0
(mercury OR 7439-97-6) AND mechanical pulping
0
8 Selenium
Name of Database: CAB Abstracts: http://www.cabdirect.org/
Date Conducted 9/03/14
Limits placed on search No limits
Search terms Search String Total number of hits
selenium (selenium OR 7782-49-2) 25,724 NR
selenium OR 7782-49-2 AND
Group 1 materials
wood ((selenium OR 7782-49-2) AND wood)
190
unfinished wood (selenium OR 7782-49-2) AND ("unfinished wood")
0
tree (selenium OR 7782-49-2) AND (tree)
380
ash ((selenium OR 7782-49-2) AND "ash tree")
0
beech ((selenium OR 7782-49-2) AND "beech tree")
0
birch (selenium OR 7782-49-2) AND (birch)
12
cherry (selenium OR 7782-49-2) AND (cherry)
22
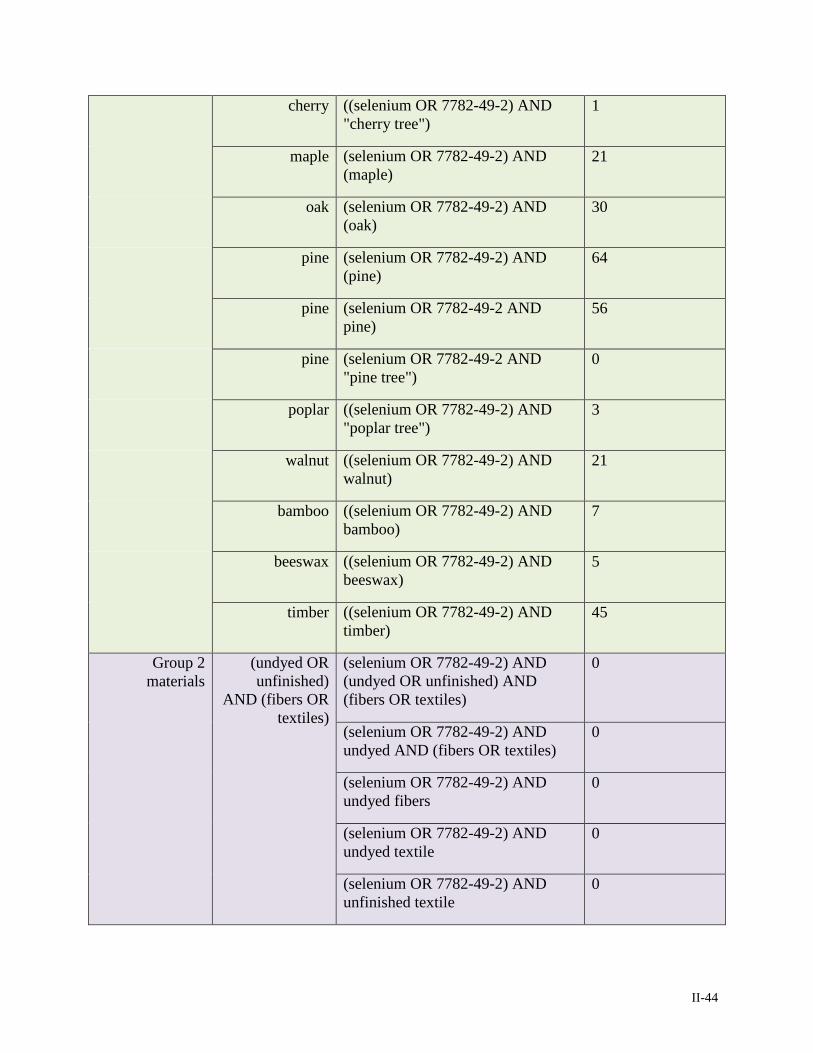
II-44
cherry ((selenium OR 7782-49-2) AND "cherry tree")
1
maple (selenium OR 7782-49-2) AND (maple)
21
oak (selenium OR 7782-49-2) AND (oak)
30
pine (selenium OR 7782-49-2) AND (pine)
64
pine (selenium OR 7782-49-2 AND pine)
56
pine (selenium OR 7782-49-2 AND "pine tree")
0
poplar ((selenium OR 7782-49-2) AND "poplar tree")
3
walnut ((selenium OR 7782-49-2) AND walnut)
21
bamboo ((selenium OR 7782-49-2) AND bamboo)
7
beeswax ((selenium OR 7782-49-2) AND beeswax)
5
timber ((selenium OR 7782-49-2) AND timber)
45
Group 2 materials
(undyed OR unfinished)
AND (fibers OR textiles)
(selenium OR 7782-49-2) AND (undyed OR unfinished) AND (fibers OR textiles)
0
(selenium OR 7782-49-2) AND undyed AND (fibers OR textiles)
0
(selenium OR 7782-49-2) AND undyed fibers
0
(selenium OR 7782-49-2) AND undyed textile
0
(selenium OR 7782-49-2) AND unfinished textile
0
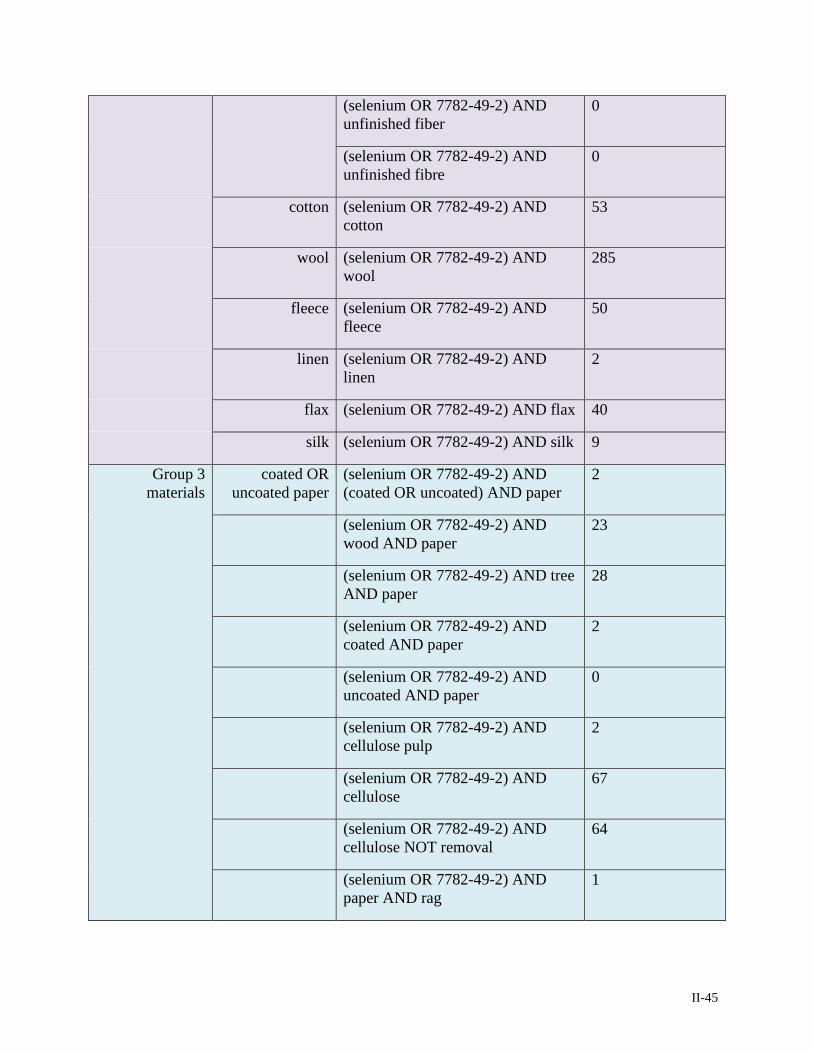
II-45
(selenium OR 7782-49-2) AND unfinished fiber
0
(selenium OR 7782-49-2) AND unfinished fibre
0
cotton (selenium OR 7782-49-2) AND cotton
53
wool (selenium OR 7782-49-2) AND wool
285
fleece (selenium OR 7782-49-2) AND fleece
50
linen (selenium OR 7782-49-2) AND linen
2
flax (selenium OR 7782-49-2) AND flax 40
silk (selenium OR 7782-49-2) AND silk 9
Group 3 materials
coated OR uncoated paper
(selenium OR 7782-49-2) AND (coated OR uncoated) AND paper
2
(selenium OR 7782-49-2) AND wood AND paper
23
(selenium OR 7782-49-2) AND tree AND paper
28
(selenium OR 7782-49-2) AND coated AND paper
2
(selenium OR 7782-49-2) AND uncoated AND paper
0
(selenium OR 7782-49-2) AND cellulose pulp
2
(selenium OR 7782-49-2) AND cellulose
67
(selenium OR 7782-49-2) AND cellulose NOT removal
64
(selenium OR 7782-49-2) AND paper AND rag
1

II-46
(selenium OR 7782-49-2) AND paper AND grass
20
(selenium OR 7782-49-2) AND wood pulp
5
(selenium OR 7782-49-2) AND lignin
25
(selenium OR 7782-49-2) AND cooking liquor
0
(selenium OR 7782-49-2) AND sulfite process
4
(selenium OR 7782-49-2) AND chemical pulping
3
(selenium OR 7782-49-2) AND mechanical pulping
0
Name of Database: Pubmed http://www.ncbi.nlm.nih.gov/pubmed/
Date Conducted 9/03/14
Limits placed on search No limits
Search terms Search String Total number of hits
selenium (selenium OR 7782-49-2) 26,948 NR
selenium OR 7782-49-2 AND
Group 1 materials
wood ((selenium OR 7782-49-2) AND wood)
61
unfinished wood (selenium OR 7782-49-2) AND ("unfinished wood")
0
tree (selenium OR 7782-49-2) AND (tree)
59
ash ((selenium OR 7782-49-2) AND "ash tree")
0
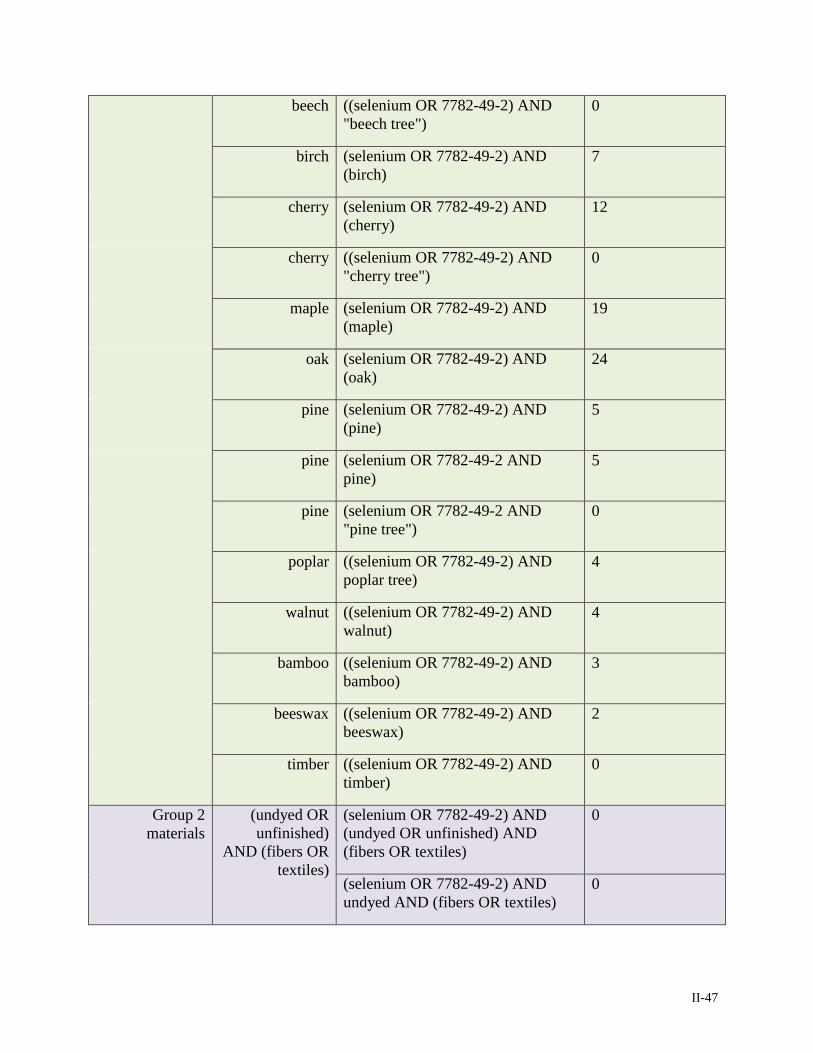
II-47
beech ((selenium OR 7782-49-2) AND "beech tree")
0
birch (selenium OR 7782-49-2) AND (birch)
7
cherry (selenium OR 7782-49-2) AND (cherry)
12
cherry ((selenium OR 7782-49-2) AND "cherry tree")
0
maple (selenium OR 7782-49-2) AND (maple)
19
oak (selenium OR 7782-49-2) AND (oak)
24
pine (selenium OR 7782-49-2) AND (pine)
5
pine (selenium OR 7782-49-2 AND pine)
5
pine (selenium OR 7782-49-2 AND "pine tree")
0
poplar ((selenium OR 7782-49-2) AND poplar tree)
4
walnut ((selenium OR 7782-49-2) AND walnut)
4
bamboo ((selenium OR 7782-49-2) AND bamboo)
3
beeswax ((selenium OR 7782-49-2) AND beeswax)
2
timber ((selenium OR 7782-49-2) AND timber)
0
Group 2 materials
(undyed OR unfinished)
AND (fibers OR textiles)
(selenium OR 7782-49-2) AND (undyed OR unfinished) AND (fibers OR textiles)
0
(selenium OR 7782-49-2) AND undyed AND (fibers OR textiles)
0
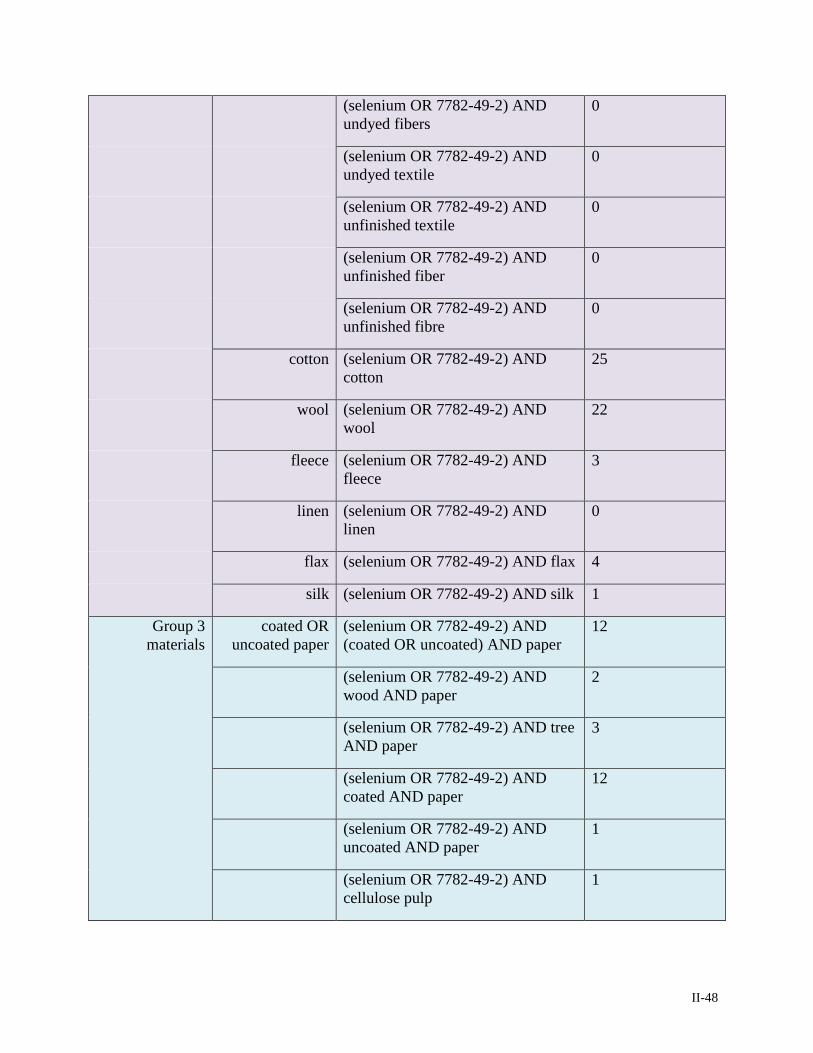
II-48
(selenium OR 7782-49-2) AND undyed fibers
0
(selenium OR 7782-49-2) AND undyed textile
0
(selenium OR 7782-49-2) AND unfinished textile
0
(selenium OR 7782-49-2) AND unfinished fiber
0
(selenium OR 7782-49-2) AND unfinished fibre
0
cotton (selenium OR 7782-49-2) AND cotton
25
wool (selenium OR 7782-49-2) AND wool
22
fleece (selenium OR 7782-49-2) AND fleece
3
linen (selenium OR 7782-49-2) AND linen
0
flax (selenium OR 7782-49-2) AND flax 4
silk (selenium OR 7782-49-2) AND silk 1
Group 3 materials
coated OR uncoated paper
(selenium OR 7782-49-2) AND (coated OR uncoated) AND paper
12
(selenium OR 7782-49-2) AND wood AND paper
2
(selenium OR 7782-49-2) AND tree AND paper
3
(selenium OR 7782-49-2) AND coated AND paper
12
(selenium OR 7782-49-2) AND uncoated AND paper
1
(selenium OR 7782-49-2) AND cellulose pulp
1
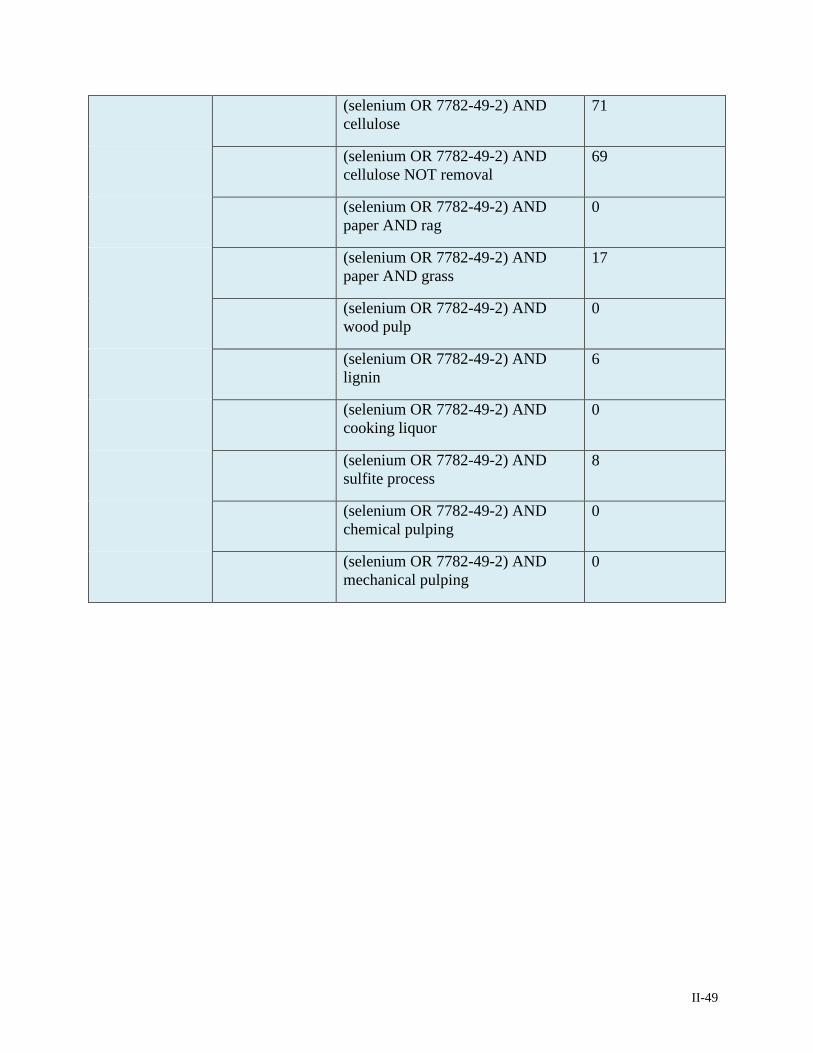
II-49
(selenium OR 7782-49-2) AND cellulose
71
(selenium OR 7782-49-2) AND cellulose NOT removal
69
(selenium OR 7782-49-2) AND paper AND rag
0
(selenium OR 7782-49-2) AND paper AND grass
17
(selenium OR 7782-49-2) AND wood pulp
0
(selenium OR 7782-49-2) AND lignin
6
(selenium OR 7782-49-2) AND cooking liquor
0
(selenium OR 7782-49-2) AND sulfite process
8
(selenium OR 7782-49-2) AND chemical pulping
0
(selenium OR 7782-49-2) AND mechanical pulping
0