Embed Size (px)
Citation preview

Standard Chartered PLC – Highlights For the six months ended 30 June 2011
1
Reported results1 Profit before taxation of $3,636 million, up 17 per cent from $3,116 million in H1 2010 (H2 2010:
$3,006 million) Profit attributable to ordinary shareholders2 of $2,516 million, up 20 per cent from $2,098 million in
H1 2010 (H2 2010: $2,133 million) Operating income of $8,764 million, up 11 per cent from $7,924 million in H1 2010 (H2 2010:
$8,138 million) Loans and advances to customers increased by 22 per cent to $268 billion from $219 billion in H1
2010 (H2 2010: $246 billion) Customer deposits grew by 19 per cent to $343 billion, up from $288 billion in H1 2010 (H2 2010:
$317 billion)
Performance metrics3 Normalised earnings per share up 4.1 per cent at 105.2 cents from 101.14 cents in H1 2010 (H2
2010: 96.0 cents) Normalised return on ordinary shareholders’ equity of 13.0 per cent (H1 2010: 14.7 per cent, H2
2010: 13.4 per cent) Interim dividend per share increased 10 percent to 24.75 cents per share
Capital and liquidity metrics Tangible net asset value per share increased 30 per cent to 1,354.6 cents (H1 2010: 1,041.9 cents,
H2 2010: 1,273.4 cents4) Core Tier 1 capital ratio at 11.9 per cent (H1 2010: 9.0 per cent, H2 2010: 11.8 per cent) Total capital ratio at 17.9 per cent (H1 2010: 15.5 per cent, H2 2010: 18.4 per cent) Advances-to-deposits ratio of 78.1 per cent (H1 2010: 76.2 per cent, H2 2010: 77.9 per cent) Liquid asset ratio of 26.5 per cent (H1 2010: 27.2 per cent, H2 2010: 26.6 per cent)
Significant highlights Record first half profit for the ninth successive year, with Consumer Banking crossing $1 billion of
profit in a six month period for the first time Delivered strong broad-based performance, with profit before taxation of $3,636 million, up strongly
by 17 per cent on H1 2010 and up 21 per cent on H2 2010 Continuing low levels of impairment, driven by a disciplined and proactive approach to risk A highly liquid and a well diversified balance sheet with limited exposure to problem asset classes
and continued momentum Capital ratios continue to position the Group well to meet evolving regulatory requirements whilst
leveraging the growth opportunities in our markets
Commenting on these results, the Chairman of Standard Chartered PLC, Sir John Peace, said:
“These are excellent results, our ninth successive first half of record profits. Our costs are tightly controlled and we have many diverse sources of good income growth. We have increased our support to our customers, with loans and deposits up, and our capital and liquidity remain strong. Standard Chartered is growing and winning market share in many product areas and markets.” 1 As explained in note 35 on page 99, the impact of the UK bank levy is excluded from these results. 2 Profit attributable to ordinary shareholders is after the deduction of dividends payable to the holders of those non-cumulative redeemable preference shares
classified as equity (see note 10 on page 71). 3 Results on a normalised basis reflect the results of Standard Chartered PLC and its subsidiaries (the ‘Group’) excluding items set out in note 11 on page 72. 4 Amounts have been restated as explained in note 32 on page 97.
Standard Chartered PLC – Stock Code: 02888

Standard Chartered PLC – Table of contents
2
Page
Summary of results 3
Chairman’s statement 4
Group Chief Executive’s review 5
Financial review 9
Group summary 9
Consumer Banking 11
Wholesale Banking 14
Balance sheet 18
Risk review 20
Capital 53
Financial statements
Condensed consolidated interim income statement 56
Condensed consolidated interim statement of comprehensive income 57
Condensed consolidated interim balance sheet 58
Condensed consolidated interim statement of changes in equity 59
Condensed consolidated interim cash flow statement 60
Notes 61
Statement of director’s responsibilities 100
Independent review report 101
Additional information 102
Glossary 122
Financial calendar 126
Index 127
Unless another currency is specified, the word ‘dollar’, symbol ‘$’ or reference to USD in this document means United States dollar and the word ‘cent’ or symbol ‘c’ means one-hundredth of one United States dollar.
Within this document, the Hong Kong Special Administrative Region of the People’s Republic of China is referred to as ‘Hong Kong’; The Republic of Korea is referred to as Korea or South Korea; Middle East and Other South Asia (MESA) includes: Pakistan, United Arab Emirates (UAE), Bahrain, Qatar, Jordan, Sri Lanka and Bangladesh; and ‘Other Asia Pacific’ includes: China, Malaysia, Indonesia, Mauritius, Brunei, Thailand, Taiwan, Vietnam and the Philippines.

Standard Chartered PLC – Summary of results For the six months ended 30 June 2011
3
6 months
ended6 months
ended 6 months
ended
30.06.11 30.06.10 31.12.10
$million $million $million
Results1
Operating income 8,764 7,924 8,138
Impairment losses on loans and advances and other credit risk provisions (412) (437) (446)
Other impairment (72) (50) (26)
Profit before taxation 3,636 3,116 3,006
Profit attributable to parent company shareholders 2,566 2,148 2,184
Profit attributable to ordinary shareholders2 2,516 2,098 2,133
Balance sheet
Total assets 567,706 480,827 516,560 6
Total equity 41,561 30,053 38,865
Total capital base 47,034 36,246 45,062 6
Information per ordinary share Cents Cents Cents
Earnings per share – normalised (post-rights)3 105.2 101.1 5 96.0
– basic (post-rights) 107.0 99.6 5 96.8
Dividend per share4 – pre-rights - 23.35 -
– post-rights 24.75 22.50 5 46.65
Net asset value per share 1,667.2 1,358.1 1,573.2
Tangible net asset value per share 1,354.6 1,041.9 1,273.4 6
Ratios
Return on ordinary shareholders’ equity – normalised basis3 13.0% 14.7% 13.4%
Cost to income ratio – normalised basis3 54.0% 54.3% 57.9%
Capital ratios
Core Tier 1 capital 11.9% 9.0% 11.8%
Tier 1 capital 13.9% 11.2% 14.0%
Total capital 17.9% 15.5% 18.4%
1 As explained in note 35 on page 99, the impact of the UK bank levy is excluded from these results. 2 Profit attributable to ordinary shareholders is after the deduction of dividends payable to the holders of those non-cumulative redeemable preference shares
classified as equity (see note 10 on page 71). 3 Results on a normalised basis reflect the results of Standard Chartered PLC and its subsidiaries (the ‘Group’) excluding items presented in note 11 on page
72. 4 Represents the interim dividend per share declared for the six months ended 30 June 2011 and 30 June 2010 and the recommended final dividend per share
for the six months ended 31 December 2010 (subsequently declared at the Annual General Meeting on 5 May 2011 and recognised in these financial statements).
5 Earnings per share and interim dividend per share declared and paid prior to the rights issue in October 2010 have been restated as explained in note 32 on page 97. Further details on the impact of the of the rights issue on prior period dividend per share amounts are set out in note 10 on page 71.
6 Amounts have been restated as explained in note 32 on page 97.

Standard Chartered PLC – Chairman’s statement
4
Standard Chartered has performed strongly during the first six months of 2011:
• Profit before taxation was up 17 per cent to $3.64 billion.
• Income increased 11 per cent to $8.76 billion.
• Normalised earnings per share were up 4.1 per cent to 105.2 cents.
The Board has declared an interim dividend of 24.75 cents per share, up 10 per cent.
These are excellent results, our ninth successive first half of record profits. Our continued growth results from diverse sources of income, from a wide range of geographies and products. We have been consistent in the execution of our strategy, which has delivered dependable and good returns to our shareholders.
Our focus on the basics of good banking means our balance sheet is in excellent shape and remains highly liquid and well capitalised. This strength enables us to pursue the attractive opportunities arising from our strong competitive positioning in our distinctive international franchise.
We are able to support the increasing number of people in Asia, Africa and the Middle East who are becoming economically active and entering the burgeoning middle classes. We can service businesses of all sizes as they start up, grow and trade internationally.
We have increased our total lending by $115 billion since the start of the crisis, supporting economic growth and job creation. Our total lending has increased by 22 per cent in total since this time last year and, within that, our lending to small and medium-sized enterprises (SMEs) by 38 per cent. Standard Chartered is growing and winning market share in many product areas and markets.
The Group’s strong performance in the first half of 2011 should be seen in the context of the ongoing economic uncertainties, particularly in the West, and the sustained global regulatory upheaval.
Standard Chartered is supportive of many of the regulatory changes being made. It is in our interest to work within a much better regulated industry and to have greater financial stability. But we need far more prioritisation, better international coordination and clearer thinking about the trade-off between a stronger financial system and economic growth.
Shareholders have an important role to play in this debate. Together we must ensure that banks can deliver good returns and attract the investment which enables them to play their pivotal role in supporting their customers and economic growth. A healthy and successful banking sector is good for the economy.
With our focus on Asia, Africa and the Middle East, it is clear that we have the right strategy, in the right markets, to be successful. Standard Chartered has had a strong start to 2011 and this momentum has continued into the second half. I would like to thank the Board, management and staff for another impressive performance.
Sir John Peace Chairman 3 August 2011

Standard Chartered PLC – Group Chief Executive’s review
5
Standard Chartered continues to deliver strong, broad-based results. Our businesses have great momentum and we continue to see significant opportunities for profitable organic growth across our franchise, in some of the most exciting economies in the world.
We have stuck to our familiar strategy, to focus on Asia, Africa and the Middle East, markets in which we have a long history and which we know intimately. A focus on building long-term, deep relationships with our customers and clients, rather than on transactions and products. A bias towards organic growth as the most sure way of creating shareholder value. A conservative balance sheet approach, emphasising liquidity, capital strength and a highly diversified asset portfolio; and an obsession with all the basic disciplines of good banking.
It is a strategy that delivered before the crisis, during the crisis and is delivering now. We see no reason to change it.
Diversity One consequence of our consistent pursuit of this strategy is that we have built a much broader-based, much stronger bank. Our breadth and diversity across geographies, products and client segments gives us extraordinary resilience. Areas of weaker performance are balanced by others doing well and we have multiple engines of growth.
Ten years ago Hong Kong, Singapore and Malaysia together accounted for nearly 50 per cent of the Group’s income. Today they contribute just over 30 per cent, even though they all had an outstanding first half.
We have also increased diversification through significant investment in new capabilities. Ten years ago, we had no Private Bank, no Corporate Finance expertise and very limited SME products and Commodities capabilities. Today, these are all very substantial growth businesses; together they account for almost a quarter of Group income.
This breadth and resilience is particularly important given the very real risks in the global economy.
Macro uncertainty The trials and tribulations of the Eurozone and US Federal borrowing are currently very familiar. We are not directly affected by either of these issues, but the ripple effects across the global economy and financial system are profound. Both reveal the depth and scale of the issues afflicting the West. Unwinding the legacy of far too much borrowing, for far too long, will take time, will be painful and will not be smooth.
Whilst our markets across Asia, Africa and the Middle East are in much better shape, they cannot entirely escape the effects. Monetary stimulus in the West exacerbates asset inflation in Asia and commodity prices worldwide. Weaker demand for Asian exports reinforces the imperative for a structural shift in Asian economies.
Growth of the middle class We are in a world economy where the patterns of growth are extraordinarily divergent and where the problems of the weak create challenges for the strong.
But we are also in a world of opportunity. Take China alone. I visited Chongqing in May and last month Shenzhen, Guangzhou and Beijing. There may be asset bubbles in China, but China itself is not a bubble. The drivers of growth – urbanisation, demographics, education and infrastructure – are incredibly strong.
Across Asia, more people are becoming middle-class consumers than at any time in history. There is a buzz of confidence in Africa, underpinned by commodity demand, improvements in governance and demographics.
We are in the right markets, with the right strategy; investing for growth, but alert to the risks; and capable of taking the bumps in our stride. Our markets will not develop smoothly, without turbulence or dislocations. Our progress as a business will not be linear, without slowdowns or setbacks.
Given the strength of these numbers and the opportunities we see ahead, it would be easy to just talk about our achievements but I want to focus initially on a couple of the markets which have proved more challenging.

Standard Chartered PLC – Group Chief Executive’s review continued
6
India After sustaining very strong growth over a number of years, it has been a challenging first six months for the team in India. We anticipated a slowdown but it has come faster and deeper than we thought and both businesses are down year on year.
There are four reasons for this marked slowdown:
First, the Reserve Bank of India has increased rates 11 times in the past 17 months in an assertive response to inflation concerns. This has slowed domestic demand and impacted equity market sentiment, affecting Wealth Management sales. It has also put pressure on asset margins and credit quality.
Second, we have seen some increase in competition, from both local and foreign banks. This has put further pressure on margins.
Third, the furore about governance in business and politics has also affected business sentiment, slowing the flow of deals and projects.
Finally, there have been a number of product-specific rule changes that have had a negative impact on both Wholesale and Consumer Banking, including greater restrictions on derivatives.
As a result of these factors, income in India has fallen by 12 per cent and profit by 39 per cent. The immediate outlook remains somewhat challenging and we maintain a rather cautious stance on risk. At this stage, given the headwinds and uncertainty, we are not counting on a strong rebound in the second half of the year.
Yet it is important to put this into perspective. Counterbalancing the reduction in Wholesale Banking’s onshore client income, offshore client income from the Indian franchise more than doubled to $185 million, largely driven by Commercial Banking, Financial Markets and Corporate Finance.
Looking further out, we remain very confident about the longer-term prospects for the business and we are not changing our strategy. We will continue to invest for growth. Indeed, the 13 per cent increase in costs over the last year reflects in part the investments we have been making, such as Express Banking centres and online
distribution in Consumer Banking and the build out of the equities platform in Wholesale Banking.
The balance sheet continues to show good momentum, with customer loans growing by 10 per cent and deposits by 9 per cent since the year end.
India will remain a key engine of income and earnings growth for the Group, given the strength of our competitive position and the fundamental dynamism of the market.
Korea Korea is another market in which we have faced challenges, with costs that are too high and an inefficiently structured balance sheet. Yet despite these facts, our Korean business had a good first half, with profits up 30 per cent.
Unfortunately, there has been a strike there in a dispute that focuses on our proposals to implement performance-related pay. The framework mirrors our practice in other markets and is consistent with practice in sectors other than banking in Korea.
India and Korea were two of our more challenging markets in the first six months of 2011. But one of the strengths of Standard Chartered is the fact that we have multiple growth engines. If one or two run slow, others will be running fast.
Hong Kong Hong Kong, for example, delivered a superb performance with both record income, up 29 per cent, and record profit, up 55 per cent. We have seen strong performances in both Consumer and Wholesale Banking.
Consumer Banking income grew 23 per cent, with particularly strong performance in the high value segments, where we have focused investment. SME income was up 27 per cent and in the Private Bank, income rose 63 per cent and revenue per client 29 per cent.
In Wholesale Banking, income was up 33 per cent, with client income up 39 per cent. Our focus on the rapidly expanding trade and investment links between Hong Kong and mainland China has been hugely successful. We are a leader in cross-border trade settlement in renminbi and issuance of ‘dim sum’ bonds.

Standard Chartered PLC – Group Chief Executive’s review continued
7
We have an exceptionally strong balance sheet in Hong Kong and continue to take market share in deposits, which were up 9 per cent since the year end. With an advances-to-deposits ratio of under 60 per cent we have benefited from the widening of net interest margins in the first half and are well-placed to benefit from further re-pricing.
China
In the mainland, we continue to invest in rapid expansion of the business. We have opened nine branches and sub-branches so far this year taking the total to 71. Our latest is in Xi’an, the city of terracotta warriors and, more to the point, a city of eight million people. We now have more than 5,500 staff in mainland China.
First-half income grew year on year by 16 per cent to $404 million. Including Bohai Bank, where we have a 20 per cent stake, profits in China are up 76 per cent to $137 million. However, this significantly understates the impact of China on the Group as a whole. Quite apart from Hong Kong, where the business is increasingly intertwined with the mainland, China generates income across our network.
Domestically, China has been taking action to moderate the pace of economic growth and squeeze inflation. This is having some effect on our growth momentum, but the impact is limited. The underlying drivers of growth are so strong, and our current market share so small, that we remain confident that we can continue to invest and grow rapidly.
China is far from our only growth story. One of the particularly pleasing features of this first half performance is the strength of growth in a number of our somewhat smaller markets.
Strong growth in smaller markets In Bangladesh, our first half income is up 22 per cent and has topped $100 million for the first time.
In Indonesia, income is up 20 per cent to $350 million. Income in Nigeria is up 13 per cent to more than $120 million. And Thailand has bounced back strongly from the political impasse, with income up 24 per cent to $177 million.
We have 15 markets which generated income over $100 million in a six month period, of which
10 contributed profits of over $100 million – a powerful demonstration of the diversity of the Group.
Costs
Ensuring we can continue to invest for growth in markets like China, whilst controlling cost growth for the Group as a whole is a key priority. In March we promised that excluding the impact of the UK bank levy, cost growth would be in line with income growth for 2011 as a whole.
In fact, we have more than achieved this in the first half through tight discipline, continued efficiency gains and careful pacing of investment. In the second half we anticipate stepping up the pace of investment somewhat, but will still expect to deliver our promise on cost growth for the year.
Investments
In Consumer Banking, we will continue to invest in driving the transformation of the business, increasing our distribution reach, enhancing customer service, launching new products and increasing our brand and marketing spend. We will be opening more branches, particularly in China, and we are rolling out innovative mobile and internet platforms.
In Wholesale Banking, we will continue to invest in hiring relationship managers and product specialists, building out our capabilities in areas like commodities and equities, strengthening our expertise in sectors such as mining and transportation.
Across the Group, we continue to invest in our underlying technology infrastructure. It may not be very visible, but we believe the fundamental data structure, messaging layer, technology security and systems resilience are absolutely key building blocks which we need to keep enhancing. There is also a never-ending need to invest to meet new regulatory demands, whether related, for example, to reporting, resolution and recovery or anti-money laundering.
As always, we will be flexing the pace of investment to reflect the business performance and our perception of the risks.
Risk Management
We enter the second half with our risk radar turned full on, alert to the issues facing the global

Standard Chartered PLC – Group Chief Executive’s review continued
8
economy. We continued to grow throughout the crisis, supporting our clients and customers. Loans to customers are now 75 per cent higher than they were in mid-2007.
We have managed to do that by taking a very holistic approach to risk, dynamically adjusting the shape of the balance sheet to anticipate and respond to events.
We think culture is the foundation of good risk management: an open questioning culture, which escalates issues, learns lessons and admits mistakes.
We are in a risk business, we are investing for growth, and the world is very uncertain. Perhaps the most difficult category of risks to manage is that emerging from the regulatory and political arena. We are deeply concerned about the unintended consequences of the avalanche of regulatory change engulfing the industry and the threat this poses to financial stability, economic recovery and job creation.
Conclusion
We remain committed to delivering against the financial metrics we have used for several years now. Over the medium term, we expect:
First, double-digit income growth. Given the markets we are in, and the momentum of our businesses, we expect to deliver double digit income growth in 2011 and beyond
Second, broadly flat jaws. We have achieved this over many years and will pace our investments to ensure costs grow broadly in line with income
Third, double-digit growth in earnings per share. The recent equity raisings have deflected us on this metric, as has the introduction of the UK bank levy, but the underlying dynamics of the business should get us back on track next year and beyond
Fourth, mid-teens return on equity (ROE). This is the metric we are most questioned on. And the reality is that it is impossible to be definitive about return expectations, when so much is in flux around capital and liquidity regulation, and when it is still unclear how much of these incremental costs will get passed on through pricing.
This year, ROE has undoubtedly been dampened by the equity we raised last year, the UK bank levy and by the continuing drag of a low interest rate environment on a deposit-rich bank. However, when we scrutinise the underlying dynamics of our business, mid teens ROE still looks achievable.
There are some critical trade-offs embedded in these metrics. Perhaps the most crucial is striking the right balance between ROE and growth. It is possible to get it wrong either way, by delivering growth at too low a return, or by squeezing growth to defend returns. The Board is acutely aware that getting this right drives shareholder value creation.
Outlook
We have started the second half of the year well; July has seen good income momentum in Consumer Banking and in Wholesale Banking client income remains strong. Costs remain tightly managed. Both businesses continue to benefit from ongoing increases in volumes off the back of strong economic activity.
For the Group as a whole, we expect to deliver double-digit income growth for the full year with flat jaws, excluding the impact of the UK bank levy. We are maintaining our tight grip on expenses in both businesses whilst beginning to accelerate investment to underpin growth in 2012. Overall credit indicators remain good. Our biggest risk by far remains regulatory risk.
We continue to benefit from the disciplined execution of our strategy. We remain committed to and focused on delivering our financial objectives and we remain well positioned in growth markets. Momentum is very good and we are continuing to take market share across a number of products and geographies.
It is a huge tribute to my colleagues that they have been able to deliver another record set of results. I would like to thank them for their commitment, professionalism and team work and also to thank our shareholders for their support. Peter Sands Group Chief Executive 3 August 2011

Standard Chartered PLC – Financial review
9
Group summary The Group has delivered another strong performance for the six months ended 30 June 2011 (H1 2011). Operating profit rose 17 per cent to $3,636 million.
Operating income increased by $840 million to $8,764 million or 11 per cent over the six months ended 30 June 2010 (H1 2010). Sources of income growth remain well diversified, both by product and by geography.
The normalised earnings per share grew 4.1 per cent to 105.2 cents and return on equity was 13.0 per cent on a higher equity base following the rights issue in October 2010. Further details of basic and diluted earnings per share are provided in note 11 on page 72.
The normalised cost to income ratio at 54.0 per cent was lower compared to 54.3 per cent in H1 2010. We have continued to manage expenses tightly. Over the previous 18 months, we deliberately accelerated investment to position the Group for future growth taking advantage of the capacity afforded by the low levels of loan impairment. In the current period, we have managed expense growth below the level of income growth.
The credit outlook has continued to remain relatively benign in both businesses and most geographies as evidenced by both loss rates and forward looking indicators, although we continue to monitor uncertain market conditions in India and MESA. This coupled with a disciplined and proactive approach to risk has
resulted in lower loan impairment provisions offset by an increase in other impairment relating to a bond exposure in India. The Group’s overall asset quality remains good. We have no material concentrations and limited exposure to problem asset classes, including no direct sovereign exposure to Portugal, Ireland, Italy, Greece and Spain and immaterial direct exposure to European Economic Area sovereign risk.
We continue to focus on the basics of banking and remain particularly vigilant on capital and liquidity ratios given the evolving regulatory environment. The Group remains strongly capitalised and supported its growth in the first half through organic equity generation. The Core Tier 1 ratio at 30 June 2011 was 11.9 per cent. We remain highly liquid, with a strong advances to deposits ratio of 78.1 per cent, slightly higher than the 2010 year end ratio of 77.9 per cent. We have continued to see good growth in both loans to customers and deposits, despite increased competition and some asset margin pressure. The Consumer Banking (CB) business has focused on growing both Term Deposits (TD) and Current and Savings Accounts (CASA). Wholesale Banking (WB) has continued to drive deposits growth through Transaction Banking. The asset profile remains conservative, high quality and short tenor in WB and with a continued bias to secured lending in CB. The Group remains a net lender into the interbank market and has very limited levels of refinancing required over the next few years.
Operating income and profit
6 months
ended6 months
ended6 months
ended H1 2011
vsH1 2011
vs
30.06.11 30.06.10 31.12.10 H1 2010 H2 2010
$million $million $million % %
Net interest income 4,941 4,155 4,315 19 15
Fees and commissions income, net 2,179 2,148 2,090 1 4 Net trading income 1,366 1,351 1,226 1 11 Other operating income 278 270 507 3 (45)
3,823 3,769 3,823 1 -
Operating income 8,764 7,924 8,138 11 8 Operating expenses (4,677) (4,344) (4,679) 8 -
Operating profit before impairment losses and taxation 4,087 3,580 3,459 14 18 Impairment losses on loans and advances and other credit risk provisions (412) (437) (446) (6) (8)Other impairment (72) (50) (26) 44 177 Profit from associates 33 23 19 43 74
Profit before taxation 3,636 3,116 3,006 17 21
Group performance Operating income grew to $8,764 million, up $840 million over H1 2010. CB income was 15 per cent higher driven by Wealth Management and Deposits. WB income was 8 per cent higher than H1 2010 with a 9 per cent growth in client income on the back of a strong performance in Transaction Banking and Financial Markets. Both businesses continued to be impacted by margin pressures on the asset side although a rise in interest rates in some of our key geographies has helped improve liability margins.
The Group’s geographic spread continues to be highly diversified with all geographic segments except India registering positive income growth.
Net interest income grew by $786 million or 19 per cent. In CB, higher volumes and improved liability margins more than compensated the fall in asset margins. Deposit margins improved, especially on CASA as interest rate increases in several of our markets took effect. WB interest income benefitted from higher volumes across both asset and liability
products and improved margins on Cash Management, which helped offset the margin compression on Trade and Lending. The Group net interest margin at 2.3 per cent was flat compared to H1 2010 but has moved up marginally compared to the six months to 31 December 2010 (H2 2010) reflecting the strong liquidity surplus of the Group.
Non-interest income was up marginally by $54 million or 1 per cent, to $3,823 million and comprises net fees and commissions, trading and other operating income. Net fees and commissions income increased by $31 million or 1 per cent to $2,179 million, from higher Wealth Management sales as market sentiment in general improved. Net trading income was marginally higher at $1,366 million with a strong first quarter but was impacted towards the end of the half year by the Eurozone sovereign concerns. Other operating income primarily comprises gains arising on sales from the investment securities portfolio, aircraft lease income and dividend income. It grew by $8 million, or 3 per cent, to $278 million.

Standard Chartered PLC – Financial review continued
10
Operating expenses increased $333 million, or 8 per cent, to $4,677 million driven by staff expenses, which increased by 15 per cent, or $416 million, new branches (including renovations and relocations) and distribution channels such as ATMs and technology systems, reflecting flow through investment from 2010 and inflation. This was partially offset by general administrative expenses which fell by $153 million compared to H1 2010 and $284 million compared to H2 2010. General administrative expenses in 2010 included a $95 million provision (of which $50 million was in the first half) for settlements in respect of structured notes. In contrast, H1 2011 benefitted by $86 million of recoveries on certain other structured note payouts made previously, although this was partially offset by some $30 million of incremental other one-off expenses. This, coupled with increased saves arising from hedging non-dollar costs in key geographies and the on-going discipline around discretionary spend has resulted in a fall in these expenses. Although the UK bank levy has not been accounted for in H1 2011 as the legislation was not substantively enacted, the jaws (rate of income growth less rate of expense growth) would have been positive even after including the impact of the bank levy.
Pre-provision profit improved $507 million, or 14 per cent, to $4,087 million.
Loan impairment was slightly lower by $25 million, or 6 per cent, at $412 million. The improved credit environment seen since early 2010 has continued through most part of the half year resulting in lower delinquency trends with consequent lower provisions, both at a specific and portfolio level. CB has witnessed continued improvement in flow rates which were at a historical low on the back of improved fundamentals and proactive credit actions in addition to benefitting from impairment reversals on loan sales. The WB impairment charge continues to be driven by a small number of specific provisions. Other impairment was up predominantly because of a charge against an India bond exposure.
Operating profit was up $520 million, or 17 per cent, to $3,636 million. CB operating profit registered a 58 per cent growth crossing the $1 billion mark for the half year, a first for the business. It now constitutes 28 percent of the Group’s first half operating profit, up from 21 per cent in the first half in 2010.
The Group’s effective tax rate (ETR) at 28.4 per cent is lower compared to H1 2010 largely as a result of the change in profit mix.
Acquisitions On 8 April 2011, the Group completed the purchase of GE Money Pte Limited (GE Money Singapore), a unit of General Electric Company’s GE Capital arm and a provider of auto and personal loans in Singapore.
The effect of the above acquisition was not material to the Group’s 2011 performance.

Standard Chartered PLC – Financial review continued
11
Consumer Banking
The following tables provide an analysis of operating profit by geography for Consumer Banking:
6 months ended 30.06.11
Asia Pacific
Hong Kong Singapore Korea
Other Asia
Pacific India
Middle East & Other
S Asia Africa
Americas UK &
Europe
Consumer Banking
Total
$million $million $million $million $million $million $million $million $million
Operating income 642 445 583 797 238 359 202 71 3,337 Operating expenses (341) (241) (422) (478) (174) (237) (131) (85) (2,109)Loan impairment (31) (14) (73) (13) (20) (50) (9) (1) (211)Other impairment - - - - - - (4) - (4)
Operating profit/(loss) 270 190 88 306 44 72 58 (15) 1,013
6 months ended 30.06.10
Asia Pacific
Hong Kong Singapore Korea
Other Asia
Pacific India
Middle East & Other
S Asia Africa
Americas UK &
Europe
Consumer Banking
Total
$million $million $million $million $million $million $million $million $million
Operating income 523 333 510 704 251 344 183 64 2,912 Operating expenses (351) (172) (389) (486) (157) (221) (121) (69) (1,966)Loan impairment (22) (15) (60) (59) (41) (87) (12) (3) (299)Other impairment - - - - - - (2) (2) (4)
Operating profit/(loss) 150 146 61 159 53 36 48 (10) 643
6 months ended 31.12.10
Asia Pacific
Hong Kong Singapore Korea
Other Asia
Pacific India
Middle East & Other
S Asia Africa
Americas UK &
Europe
Consumer Banking
Total
$million $million $million $million $million $million $million $million $million
Operating income 593 395 548 774 242 347 198 70 3,167 Operating expenses (370) (212) (408) (599) (179) (237) (133) (72) (2,210)Loan impairment (23) (18) (79) (63) (15) (72) (7) (2) (279)Other impairment - - (4) (1) - - (3) - (8)
Operating profit/(loss) 200 165 57 111 48 38 55 (4) 670
An analysis of Consumer Banking income by product is set out below:
6 months ended
30.06.11
6 months ended
30.06.10
6 months ended
31.12.10 Operating income by product $million $million $million
Cards, Personal Loans and Unsecured Lending 1,149 988 1,056 Wealth Management 657 535 603 Deposits 691 571 631 Mortgages and Auto Finance 751 733 780 Other 89 85 97
Total operating income 3,337 2,912 3,167

Standard Chartered PLC – Financial review continued
12
Consumer Banking continued CB has continued with its transformation towards a customer focused business model. Operating income was higher by $425 million, or 15 per cent at $3,337 million. On a constant currency basis, income was 11 per cent higher. Net interest income increased $252 million, or 13 per cent, to $2,248 million. Whilst asset and liability volumes increased, this was partially offset by lower asset margins which fell by 33 basis points (bps), particularly in the mortgage book, compared to the first half of 2010. Liability margins rose slightly by 6 bps with improved margins on CASA more than offsetting the fall in TD margins. Non-interest income at $1,095 million was 17 per cent higher compared to H1 2010, due to higher Wealth Management product sales. The business continued to focus on liquidity and growing its deposit base through product innovation. All geographic segments saw double-digit growth despite a challenging regulatory environment except India, where income fell, and MESA.
Expenses were up $143 million or 7 per cent at $2,109 million. On a constant currency basis, expenses were up 3 per cent. The growth in expenses, after factoring recoveries on structured notes, was driven primarily by the flow through of investment expenditure made in the latter half of 2010 in new branches and ATMs and the hiring of Relationship Managers (RMs) and front office staff.
Loan impairment was lower by $88 million, or 29 per cent, at $211 million. Macro-economic conditions have continued to improve in most of our markets and coupled with proactive credit actions has resulted in lower delinquencies and historically low loss rates. Additionally, CB benefitted $51 million from impairment reversal on loan sales.
Operating profit increased by $370 million, or 58 per cent, to $1,013 million. On a constant currency basis, the increase in operating profits was 53 per cent.
Product performance Income from Cards, Personal Loans and Unsecured Lending grew by $161 million, or 16 per cent, to $1,149 million driven by increased volumes that more than offset margin compression. We selectively increased risk appetite in certain markets on the back of an improved credit climate and historically low loss rates. These were supported through increased marketing and introduction of innovative product features. Volumes also benefitted from acquired assets in Singapore.
Wealth Management income grew 23 per cent to $657 million, particularly driven by the sale of structured notes, equities and insurance as investor appetite continued to improve for most part of the half year on the back of relatively better economic indicators and equity market performance. Deposits income was up 21 per cent, to $691 million as improvement in interest rates in some markets has helped deposit margins, especially CASA, which increased by 16 bps, and has offset the fall in time deposit margins.
Mortgages and Auto Finance has grown marginally with volume growth benefitting from the acquisition of GE Money Singapore but this was partially offset by a fall in margins as competition and interest rates increased in most of our markets. Income grew $18 million, or 2 per cent, to $751 million.
The “Others” classification primarily includes SME related trade and transactional income and has remained at similar levels compared to the previous halves.
Geographic performance Hong Kong Income was up $119 million, or 23 per cent, to $642 million. This was attributable to good volume growth across both asset and liability products with liability margins up year on year although asset margins were under pressure. Investor sentiment continued to improve with Wealth Management income up across a broad range of products and services such as unit trust sales, bancassurance and securities. We continued to gain market share in Credit Cards whilst also driving the SME trade book, where income grew 34 per cent. Liability growth has continued through successful deposit drives, innovative products and services such as the Dual Currency ATM Card and cross border account opening service. This has enabled us to offer a wider range of Renminbi (RMB) products and services. Expenses were $10 million or 3 per cent lower at $341 million. H1 2010 included provisions in respect of regulatory settlements related to Lehman’s structured notes. Excluding the impact of those provisions, expenses grew 13 per cent driven by flow through costs from investment in branches and front office staff in the latter part of 2010 as well as system enhancements. Loan impairment was higher by $9 million driven by the increase in the portfolio and also a relative shift towards unsecured lending since the latter part of 2010. Operating profit was up $120 million, or 80 per cent, to $270 million.
Singapore Income was up $112 million, or 34 per cent, to $445 million. On a constant currency basis income grew 24 per cent. Income from Cards rose strongly as we increased market share and grew balances. Wealth Management income grew 43 per cent reflecting in part our significant investment in headcount in 2010 and also fairly strong investor sentiment. Deposits benefitted from both volume growth and a slight improvement in margins. Operating expenses increased $69 million, or 40 per cent, to $241 million, driven by flow through costs from investment in marketing, new branches and front office staff in the latter part of 2010 in addition to higher staff costs. The increase in expenses on a constant currency basis was 27 per cent. Working profit was up $43 million, or 27 per cent, at $204 million. Loan impairment was marginally lower at $14 million as risk continued to be managed tightly. Operating profit was higher by $44 million or 30 per cent at $190 million. On a constant currency basis operating profit grew 24 per cent.
Korea Income was up $73 million, or 14 per cent, to $583 million. On a constant currency basis, growth was 9 per cent driven by volume growth in unsecured lending, higher Wealth Management income arising primarily from mutual fund sales and improved deposit margins. Operating expenses were up $33 million, or 8 per cent, to $422 million. On a constant currency basis, expenses were 4 per cent higher as a result of flow through expenditure arising from investments in refurbishing/renovating existing branches and opening of new branches in 2010. Working profit was up 33 per cent (27 per cent on a constant currency basis) at $161 million. Loan impairment was $13 million, or 22 per cent, higher at $73 million due to the increase in the portfolio and also a relative shift towards unsecured lending since the latter part of 2010. Operating profit was $88 million, up $27 million from $61 million in H1 2010.

Standard Chartered PLC – Financial review continued
13
Other Asia Pacific (Other APR) Income was up $93 million, or 13 per cent, at $797 million. Income in China was up 19 per cent to $117 million driven by strong volume growth in SME and improved liability margins. Wealth Management income was up with positive investor sentiment that enabled higher sales of mutual funds and longer tenor structured notes. Taiwan saw income fall 6 per cent to $211 million. Volume growth in mortgages and personal loans saw income growth that partially offset a fall in Wealth Management income as well as liability and asset margin compression. Income in Malaysia was up 38 per cent at $177 million and benefitted from growth in assets primarily SME and Personal Loans. Operating expenses in Other APR were lower by $8 million at $478 million, having benefitted from recoveries on payouts made in respect of structured notes in prior years. On an underlying basis, expenses grew due to investments in frontline staff and infrastructure. Expenses in China were up by 14 per cent at $141 million. Working profit for the region was up $101 million, at $319 million. Loan impairment was down $46 million, or 78 per cent, to $13 million. In addition to tight underwriting standards and enhanced collection efforts, asset sales in Malaysia and Taiwan also contributed to the reduction. Other APR delivered an operating profit of $306 million, up 92 per cent on H1 2010. The operating loss in China was $28 million (H1 2010 operating loss of $29 million) as we continued to invest.
India Income was down $13 million, or 5 per cent, at $238 million. On a constant currency basis, income was lower by 7 per cent. Income has been impacted by rising interest rates in response to high inflation, coupled with higher levels of competition and regulatory changes. This was partially offset by the growth in deposit volumes with a strong focus on payroll accounts supported by an upgrade of internet and mobile banking capabilities. Operating expenses were $17 million, or 11 per cent higher at $174 million. On a constant currency basis, expenses were higher by 8 per cent, driven by investments to support future growth and in franchise building through an increase in front office Relationship Managers, greater brand visibility and infrastructure expansion. Working profit was down $30 million, or 32 per cent, at $64 million. Loan impairment was down $21 million, or 51 per cent, to $20 million as a result of the strategic shift towards secured lending. Operating profit was lower by $9 million, or 17 per cent, at $44 million. On a constant currency basis, operating profit was 18 per cent lower.
MESA Income was $15 million higher at $359 million. Income in UAE was up 10 per cent at $167 million with higher Wealth Management fees from increased structured product sales. While asset and liability volumes grew, this was offset by margin compression. Income in Pakistan was up 5 per cent driven by strong deposit growth and a slight improvement in margins. Operating expenses in MESA were higher by $16 million, or 7 per cent, at $237 million. Expenses in UAE were up by $6 million, or 6 per cent, as the business continued to invest in frontline staff and realignment of distribution channels. Working profit was broadly flat at $122 million. Loan impairment was lower at $50 million, 43 per cent down from $87 million in the first half of 2010. The decrease was primarily in the UAE as we continued with our tighter underwriting criteria and proactive monitoring coupled with a bias to secured lending. Unsecured lending through Personal Loans is all linked to underlying salary accounts thereby offering significant risk mitigation. MESA operating profit of $72 million doubled compared to H1 2010.
Africa Income was up $19 million, or 10 per cent, at $202 million. On a constant currency basis, income grew 14 per cent with strong volume growth in Personal Loans and Mortgages and an improved Wealth Management performance helping offset margin pressure on liabilities. Kenya, Nigeria and Botswana continued to be the key contributors. Operating expenses were $10 million or 8 per cent higher at $131 million. On a constant currency basis, expenses were higher by 12 per cent as a result of investments to strengthen the distribution network. Working profit was $9 million higher at $71 million. Loan impairment was lower at $9 million. Operating profit was up $10 million, or 21 per cent, at $58 million. On a constant currency basis operating profit was up 26 per cent.
Americas, UK & Europe Income grew $7 million or 11 per cent from $64 million to $71 million. The business in this region is Private Banking in nature and has seen double-digit income growth driven by growth in balance sheet and recovery in margins. A gradual improvement in investor confidence has resulted in an increase in Assets Under Management with resultant income flow. Operating expenses increased $16 million or 23 per cent, primarily due to the increase in Relationship Managers. The operating loss was $15 million.
Standard Chartered PLC – Financial review continued
14
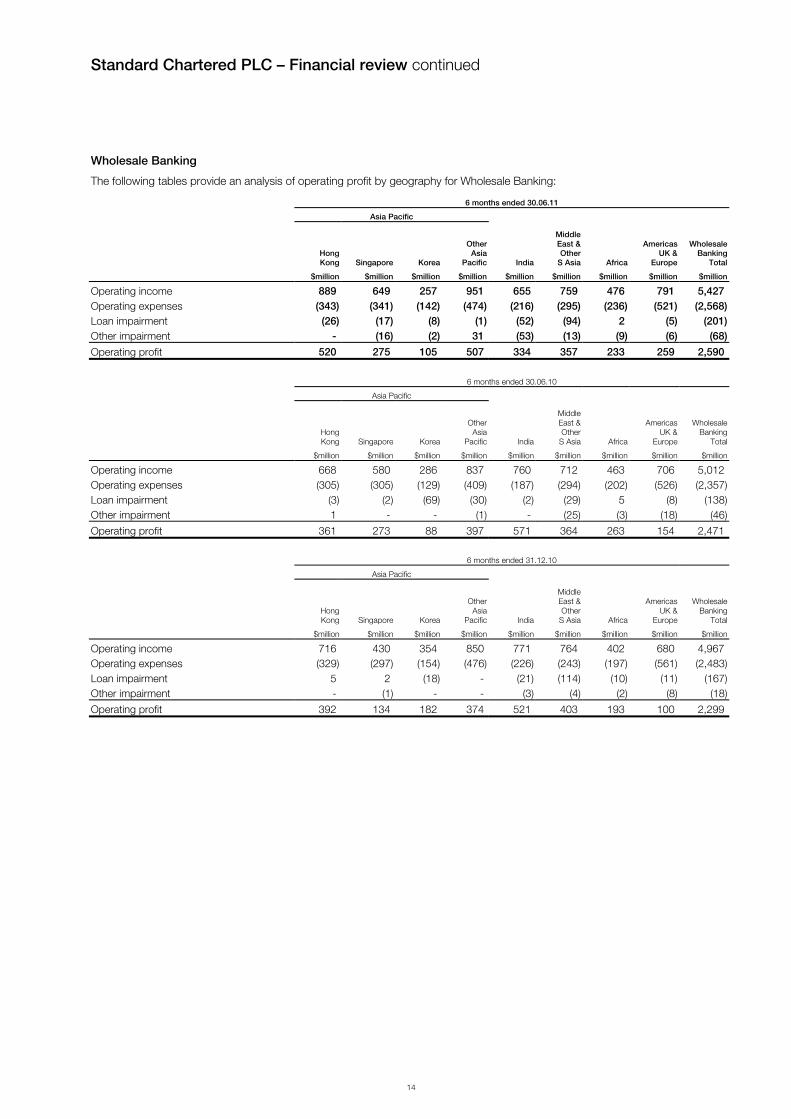
Wholesale Banking
The following tables provide an analysis of operating profit by geography for Wholesale Banking:
6 months ended 30.06.11
Asia Pacific
Hong Kong Singapore Korea
Other Asia
Pacific India
Middle East & Other
S Asia Africa
Americas UK &
Europe
Wholesale Banking
Total
$million $million $million $million $million $million $million $million $million
Operating income 889 649 257 951 655 759 476 791 5,427 Operating expenses (343) (341) (142) (474) (216) (295) (236) (521) (2,568)Loan impairment (26) (17) (8) (1) (52) (94) 2 (5) (201)Other impairment - (16) (2) 31 (53) (13) (9) (6) (68)
Operating profit 520 275 105 507 334 357 233 259 2,590 6 months ended 30.06.10
Asia Pacific
Hong Kong Singapore Korea
Other Asia
Pacific India
Middle East & Other
S Asia Africa
Americas UK &
Europe
Wholesale Banking
Total
$million $million $million $million $million $million $million $million $million
Operating income 668 580 286 837 760 712 463 706 5,012 Operating expenses (305) (305) (129) (409) (187) (294) (202) (526) (2,357)Loan impairment (3) (2) (69) (30) (2) (29) 5 (8) (138)Other impairment 1 - - (1) - (25) (3) (18) (46)
Operating profit 361 273 88 397 571 364 263 154 2,471 6 months ended 31.12.10
Asia Pacific
Hong Kong Singapore Korea
Other Asia
Pacific India
Middle East & Other
S Asia Africa
Americas UK &
Europe
Wholesale Banking
Total
$million $million $million $million $million $million $million $million $million
Operating income 716 430 354 850 771 764 402 680 4,967 Operating expenses (329) (297) (154) (476) (226) (243) (197) (561) (2,483)Loan impairment 5 2 (18) - (21) (114) (10) (11) (167)Other impairment - (1) - - (3) (4) (2) (8) (18)
Operating profit 392 134 182 374 521 403 193 100 2,299

Standard Chartered PLC – Financial review continued
15
Wholesale Banking continued
6 months
ended 6 months
ended6 months
ended
Operating income by product
30.06.11 30.06.10 31.12.10
$million $million $million
Lending and Portfolio Management 435 465 403 Transaction Banking Trade 767 691 776 Cash Management and Custody 785 591 712
1,552 1,282 1,488 Global Markets1
Financial Markets 1,951 1,711 1,592 Asset and Liability Management (‘ALM’) 431 488 424 Corporate Finance 912 932 778 Principal Finance 146 134 282
Total Global Markets 3,440 3,265 3,076
Total operating income 5,427 5,012 4,967
6 months
ended 6 months
ended6 months
ended
Financial Markets operating income by desk
30.06.11 30.06.10 31.12.10
$million $million $million
Foreign Exchange 769 646 554 Rates 450 512 325 Commodities and Equities 319 165 246 Capital Markets 271 233 308 Credit and Other 142 155 159
Total Financial Markets operating income 1,951 1,711 1,592
1 Global Markets comprises the following businesses: Financial Markets (foreign exchange, interest rate and other derivatives, commodities and equities, debt capital markets, syndications); ALM; Corporate Finance (corporate advisory, structured trade finance, structured finance and project and export finance); and Principal Finance (corporate private equity, real estate infrastructure and alternative investments).
Wholesale Banking has continued to sustain client income momentum with income up 9 per cent in a challenging economic and competitive environment. Client income constituted more than 80 per cent of WB income and showed a broad-based growth across product lines, client segments and geographies. Total WB income was higher by $415 million, or 8 per cent, at $5,427 million. Net interest income was up $534 million, or 25 per cent, to $2,693 million with increased asset and deposit balances helping offset lower margins in Trade and Lending. Cash Management margins increased year on year and also on H2 2010. Non-interest income however fell by $109 million, or 4 per cent, to $2,728 million.
Corporate Finance income, which has in the past few years seen significant growth, fell fractionally compared to H1 2010 despite an increase in the number of transactions closed. Financial Markets performance improved and delivered a 14 per cent growth in income with the Foreign Exchange business performing well. Volatility, especially in commodities and foreign exchange in the early part of H1 2011, presented structuring and hedging opportunities but the uncertainty in Europe in May and June resulted in reduced activity. ALM, which benefitted in early 2010 from higher yielding assets, saw a fall in income compared to H1 2010 although it was up 2 per cent compared to the second half of 2010.
Operating expenses were up $211 million, or 9 per cent, to $2,568 million. The increase was primarily driven by the flow through in staff costs arising from prior year initiatives on resourcing in specialist areas such as sales, trading and financial institutions teams. This has been partially offset by efficiency measures and tighter control on other costs.
Pre-provision profit was up $204 million, or 8 per cent, to $2,859 million.
Loan impairment was higher by $63 million at $201 million mainly from incremental provisions on existing problem accounts and a higher level of portfolio impairment provision in India reflecting uncertainty in the market. The portfolio remains well diversified and is increasingly well collateralised.
Other impairment at $68 million was up predominantly because of charges against an Indian bond exposure.
Operating profit increased $119 million, or 5 per cent, to $2,590 million and WB remains a significant contributor constituting over 70 per cent of the Group profits.
Product performance Lending and Portfolio Management income fell by $30 million, or 6 per cent, to $435 million as the increase in lending volumes were offset by margin pressures.
Transaction Banking income was up $270 million or 21 per cent at $1,552 million and was a key driver of the growth in client income. Income from Trade grew by 11 per cent with a 27 per cent growth in assets and contingents offsetting a 24 bps drop in margins. The Cash Management business also benefitted as rates began to rise, resulting in a 14 bps improvement in margins which, coupled with a 26 per cent growth in average balances, enabled a $194 million or 33 per cent increase in income to $785 million.
Global Markets income was up $175 million, or 5 per cent, at $3,440 million.

Standard Chartered PLC – Financial review continued
16
Within Global Markets, the Financial Markets (FM) business continued to be the largest contributor with income at $1,951 million, up $240 million or 14 per cent. The FM business primarily comprises sales and trading of exchange and interest rate products and continued to see diversification of income streams with increased contributions from commodity and equity derivatives and capital markets. Around 76 per cent of FM income continues to be client driven.
The Foreign Exchange business benefitted from strong trade volumes and the continued increase in demand for RMB products. Volumes in the RMB business grew over 70 percent from the year-end as we worked towards offering structured solutions to meet client needs whilst also benefitting from a move to a higher margin business. Interest rate derivative volumes were also up especially towards the end of the first quarter as volatility increased due to the earthquake in Japan. We have also had continued success in the commodities business with on-going growth in volumes, especially in Energy and Precious Metals, as we provided structured solutions for our clients to counter volatile market conditions.
ALM income was $57 million or 12 per cent lower at $431 million but up 2 per cent over the second half of 2010. This was due to maturities of high yielding positions put on in early 2010, most of which were replaced by lower yielding assets.
Corporate Finance income was marginally down $20 million to $912 million as some of the big ticket deals which we had in the previous year did not replicate to the same extent. We have however, continued to diversify this business from a geographic perspective with good deal flow across several of our markets.
Principal Finance income was up $12 million or 9 per cent at $146 million.
Geographic performance Hong Kong Income was up $221 million, or 33 per cent, to $889 million. This was driven by a broad-based growth across client segments as we continued to leverage on the opportunities arising from RMB internationalisation and widening of the interest differential between Hong Kong and China. Client income was up 39 per cent on the back of increased Lending and Transaction Banking volumes, benefitting also through business flows from China. In an improving economic climate, we proactively used our surplus liquidity to grow volumes that helped offset the margin compression in both Trade and Lending. Concurrently, liability margins also improved leading to significant growth in Cash Management income on higher volumes. Corporate Finance benefitted from cross border advisory and structured finance deals and Fixed Income and Commodities business also saw an increase in volumes leveraging on client demand for structured solutions arising from underlying USD/RMB flows. Operating expenses were higher by $38 million, or 12 per cent, at $343 million with the increase primarily in staff costs as we continued to enhance our Structuring and Research capabilities. Working profit was up $183 million, or 50 per cent, to $546 million. Loan impairment was higher by $23 million compared to the previous year driven by provisions related to certain Principal Finance investments. Operating profit was up $159 million, or 44 per cent, at $520 million.
Singapore Income grew $69 million or 12 per cent, to $649 million. On a constant currency basis, income was up 6 per cent. Client income was up 38 per cent and benefitted from higher volumes in Trade and Cash Management in addition to improved client flows and large ticket Corporate Finance deals. Own account income was impacted by decreased volatility and tighter margins
and lower income from Principal Finance. Operating expenses grew $36 million, or 12 per cent, to $341 million. On constant currency expenses grew 2 per cent due to infrastructural investments and staff costs arising from flow through of previous year investment in specialist teams in areas such as commodities, options and interest rate derivatives. Much of the increase in headcount continued to be on account of Singapore being a regional hub for the business. Working profit was up $33 million, or 12 per cent, to $308 million. Impairment was driven by downward marks on certain private equity investments. Operating profit was higher by $2 million, or 1 per cent, at $275 million.
Korea Income fell $29 million, or 10 per cent, to $257 million. On a constant currency basis, income was 14 per cent lower. Client income fell 5 per cent on a headline basis and 9 per cent on a constant currency basis due to margin contraction as competition continued to be strong. Own account continued to be impacted by reduced volatility driven by tightened regulatory intervention. Offshore income from Korean corporates expanding activities across our network was broadly flat. Operating expenses were higher by $13 million, or 10 per cent, at $142 million. On a constant currency basis, expenses were higher by 5 per cent. Working profit was lower by $42 million, or 27 per cent, at $115 million. On a constant currency basis, working profit fell 30 per cent. Loan impairment was significantly lower than H1 2010 at $8 million as the prior period charge was driven by provisions related to a small number of specific ship building exposures in addition to further provisions on certain problem accounts. Operating profit was consequently higher by $17 million, or 19 per cent, at $105 million. On a constant currency basis, operating profit rose 12 per cent.
Other Asia Pacific (Other APR) Income was up $114 million, or 14 per cent, at $951 million. Excluding Philippines, which benefitted in H1 2010 from a large ticket deal, and Malaysia, most major markets in this region saw income growth driven by strong FM flow business. China delivered income growth of 15 per cent to $287 million on the back of volume growth and wider Cash Management margins and an improved FX and Rates performance as a more volatile market presented structuring and hedging opportunities. Income in Taiwan was up 19 per cent to $70 million driven by Capital Market and Corporate Finance income in addition to higher trade volumes. Malaysia income was down 9 per cent to $128 million as margins continued to be impacted across Lending, Trade and Cash Management. The previous year had certain private equity gains, which did not replicate this half year. Operating expenses in Other APR were up $65 million, or 16 per cent, to $474 million due to staff and premises costs and flow through from prior year investments. China operating expenses were up 13 per cent to $169 million. Working profit across the region was up by 11 per cent and ended at $477 million. Loan impairment was down $29 million from $30 million in H1 2010. The previous period charge had been largely driven by disputes on certain foreign exchange related transactions. Operating profit was $110 million, or 28 per cent, higher at $507 million, of which $144 million was attributable to China.
India Income declined $105 million, or 14 per cent, to $655 million. On a constant currency basis income fell 15 per cent. Income was impacted by higher levels of competition, soft business sentiment given governance issues in the broader economy, higher interest rates as a response to inflationary concerns and regulatory changes. Capital Markets and Corporate Finance businesses in particular have been impacted by this as has the FM flow business. Cash and Custody business however, saw an

Standard Chartered PLC – Financial review continued
17
increase in volumes and an improvement in margins that helped partially offset the above fall. India continues to leverage on the Group’s network capabilities, referring business and deepening client relationships. Offshore client income from the Indian franchise more than doubled to $185 million in H1 2011, largely driven by Commercial Banking, Financial Markets and Corporate Finance. Operating expenses were up $29 million or 16 per cent driven primarily by flow through of prior year investments in the Equities business in addition to higher premises costs. Working profit was down $134 million, or 23 per cent, at $439 million. On a constant currency basis, working profit fell 25 per cent. Loan impairment was higher by $50 million as we have taken a higher portfolio provision given market uncertainty. Other impairment primarily relates to a bond exposure following credit concerns around the issuer. Operating profit was consequently down $237 million, or 42 per cent, to $334 million. On a constant currency basis, operating profit fell 43 per cent.
MESA Income was up $47 million, or 7 per cent, to $759 million with increases in own account offsetting the drop in client income. Client income saw growth in Lending and Trade volumes but was impacted by lower margins. Own account income was driven by strong growth in the commodities business as volatility, especially in the first quarter provided structuring opportunities. Islamic banking income continued to be a key focus area with revenues up 50 per cent compared to H1 2010. UAE income was up 15 per cent at $477 million with the growth in Commodities and Rates business helping offset a fall in client income, which was impacted by margin compression and a reduction of the loan book consequent to certain big ticket repayments. Bangladesh grew income by 40 per cent driven by a strong growth in FX and trade volumes in addition to a structured deal for power financing. Bahrain continued to see a drop in income as a weaker credit environment impacted risk appetite and business flow. Pakistan income was up on the back of higher trade volumes. Operating expenses were tightly controlled and remained flat at $295 million. Loan impairment was driven primarily by a few specific provisions and ended at $94 million. Operating profit declined 2 per cent at $357 million.
Africa Income was up $13 million, or 3 per cent, to $476 million. On a constant currency basis, income grew 5 per cent led by an improved Transaction Banking and Lending performance that helped offset the drop in Corporate Finance. Trade and Lending income increased on the back of growth in volumes and improved margins on Trade, which helped offset the margin compression in Cash and Lending. Corporate Finance which benefitted from landmark deals in prior periods saw a slowdown and coupled with increased competition resulted in a drop in income. Nigeria continues to be a key contributor with growth across most product lines. Botswana and Uganda were the other positive contributors with strong Lending and Trade growth and helped offset the fall in South Africa and Kenya. While South Africa benefitted in H1 2010 from certain landmark Corporate Finance deals which did not replicate in H1 2011, Kenya income in the current year was impacted by a fall in own account income. Operating expenses were up $34 million, or 17 per cent, to $236 million. On a constant currency basis expenses were 19 per cent higher reflecting investments in people and infrastructure as well as the integration costs associated with our acquisition of the Barclays custody business. Operating profit was down $30 million, or 11 per cent, to $233 million. On a constant currency basis, operating profit fell 8 per cent.
Americas, UK & Europe This region continued to support cross border business, both through referrals to the network which were up 13 per cent and servicing those originated in other geographies. Income was up by $85 million or 12 per cent and saw client income growth across Cash and Corporate Finance. Commodities saw good growth and benefitted from the volatility in prices. ALM income, whilst lower than H1 2010, benefitted from the reinvestment of certain matured positions at higher yields. Operating expenses were marginally lower by $5 million with staff expense increases being offset through other cost efficiencies. Working profit grew $90 million or 50 per cent. Impairment was negligible resulting in operating profit increasing by 68 per cent to $259 million.

Standard Chartered PLC – Financial review continued
18
Group summary consolidated balance sheet
H1 2011 vs H1 2011 vs H1 2011 vs H1 2011 vs
30.06.11 30.06.10 31.12.10 H1 2010 H2 2010 H1 2010 H2 2010
$million $million $million $million $million % %
Assets
Advances and investments Cash and balances at central banks 43,689 29,694 32,724 13,995 10,965 47 34 Loans and advances to banks 57,317 49,390 52,058 7,927 5,259 16 10 Loans and advances to customers 262,126 215,005 240,358 47,121 21,768 22 9 Investment securities held at amortised cost 4,934 6,006 4,829 (1,072) 105 (18) 2
368,066 300,095 329,969 67,971 38,097 23 12
Assets held at fair value
Investment securities held available-for-sale 76,410 70,781 70,967 5,629 5,443 8 8 Financial assets held at fair value through profit or loss 27,401 24,287 27,021 3,114 380 13 1 Derivative financial instruments 50,834 44,555 47,859 6,279 2,975 14 6
154,645 139,623 145,847 15,022 8,798 11 6 Other assets 44,995 41,109 40,744 3,886 4,251 9 10
Total assets 567,706 480,827 516,560 86,879 51,146 18 10
Liabilities
Deposits and debt securities in issue
Deposits by banks 36,334 31,903 28,551 4,431 7,783 14 27 Customer accounts 333,485 279,089 306,992 54,396 26,493 19 9 Debt securities in issue 38,640 33,364 31,381 5,276 7,259 16 23
408,459 344,356 366,924 64,103 41,535 19 11
Liabilities held at fair value
Financial liabilities held at fair value through profit or loss 20,326 18,380 20,288 1,946 38 11 - Derivative financial instruments 49,637 43,425 47,133 6,212 2,504 14 5
69,963 61,805 67,421 8,158 2,542 13 4 Subordinated liabilities and other borrowed funds 16,004 15,555 15,939 449 65 3 - Other liabilities 31,719 29,058 27,411 2,661 4,308 9 16
Total liabilities 526,145 450,774 477,695 75,371 48,450 17 10
Equity 41,561 30,053 38,865 11,508 2,696 38 7
Total liabilities and shareholders' funds 567,706 480,827 516,560 86,879 51,146 18 10

Standard Chartered PLC – Financial review continued
19
Balance sheet Unless otherwise stated, the variance and analysis explanations compare the position as at 30 June 2011 with the position as at 31 December 2010.
The Group has continued to build on the strength and liquidity of its balance sheet. Growth continued to be disciplined and diversified across both businesses with a good increase in both advances and deposits. We continue to remain highly liquid and a net lender into the interbank market, particularly in Hong Kong, Singapore and Americas, UK & Europe. Our advances to deposits ratio at 78.1 per cent, up marginally from the previous year-end position of 77.9 per cent, is reflective of our discipline in asset growth whilst also pursuing a more aggressive use of surplus liquidity in markets such as Hong Kong. The Group’s funding structure remains conservative, with limited levels of refinancing over the next few years. Senior debt funding during the period demonstrated a good appetite for its paper. The Group remains well capitalised with profit accretion, net of distributions during the period, further supporting our growth. This coupled with a proactive management of risk weighted assets by way of distribution and asset sell downs has contributed to a marginal increase in the Core Tier 1 ratio from December 2010 to 11.9 per cent.
Balance sheet footings grew by $51 billion, or 10 per cent during this period. On a constant currency basis the growth was 8 per cent as the appreciation of most Asian currencies against the US dollar seen in the latter half of 2010 continued during this period. Balance sheet growth was largely driven by an increase in customer lending on the back of significant growth in customer deposits, with surplus liquidity being held with central banks. Derivative mark to market increased as volumes grew significantly. The Group has low exposure to problem asset classes, no direct sovereign exposure to Portugal, Ireland, Italy, Greece and Spain and immaterial direct exposure to the 30 European Economic Area countries.
The balance sheet profile continues to be consistent with around 70 per cent of the financial assets being held and managed on an amortised cost basis and around 55 per cent of total assets having a residual contractual maturity of less than one year.
Cash and balances at central banks In addition to higher surplus liquidity, balances have grown primarily due to higher clearing balances.
Loans and advances to banks and customers Loans to banks and customers, including those held at fair value, grew by $26 billion, or 9 per cent, to $326 billion.
Consumer Banking portfolios grew by $9 billion to $126 billion, which represented 47 per cent of the Group’s customer advances at 30 June. The growth in Consumer Banking has also been strengthened by the acquisition of GE Money Singapore. Hong Kong, Singapore and Korea also benefitted from an increased demand for unsecured lending products such as credit cards, personal loans and business instalment loans. This was reflective of our selective approach to grow the unsecured lending portfolio given improving delinquency trends and historically low loss rates. We also leveraged on the gradual but general improvement seen in business sentiment in our footprint markets to increase our SME exposure with loans to this segment registering an 11 per cent increase to end at $19.6 billion. Mortgages growth however, was more muted compared to the last year due to a combination of regulatory restrictions in the face of growing macro-economic uncertainty, periodic rate hikes and intensified competition.
84 per cent of the Consumer Banking portfolio is in secured and partially secured products.
Wholesale Banking continued to strengthen its existing client relationships and deliver on the momentum built from year-end. Customer advances in Wholesale Banking grew $13 billion, or 10 per cent, to $143 billion. Lending increased across the financing, insurance and business services, manufacturing and government sectors in Hong Kong, Singapore and the Americas, UK & Europe. Growth in Hong Kong in particular was driven by the increasing demand across Mainland China, especially for trade and structured finance solutions post the internationalisation of RMB. Given our highly liquid balance sheet in Hong Kong, we were well positioned to leverage on this opportunity and move to higher yielding assets. Growth in Singapore and Americas, UK & Europe was driven by the continued ability of these geographies to support cross border business originating across the network.
Investment securities Investment securities, including those held at fair value, grew by $7 billion, due to increased trading positions as at the end of the period based on expected rate movements. Additionally, the introduction of new liquidity requirements has also necessitated higher holdings. The maturity profile of our investment book is largely consistent with around 55 per cent of the book having a residual maturity of less than twelve months
Derivatives Customer appetite for derivative transactions has continued to be strong resulting in a significant increase in notional values, which are up 54 per cent as a result of higher volumes and larger deal size. However, value at risk is lower than the previous period end and given the relatively low volatility, the corresponding increase in unrealised positive mark to market positions at the balance sheet date at $51 billion is only up 6 per cent. Our risk positions continue to be largely balanced, resulting in a corresponding increase in negative mark to market positions. Of the $51 billion mark to market positions, $21 billion is available for offset due to master netting agreements.
Deposits The Group has continued to see good deposit growth in both businesses. Deposits by banks and customers, including those held at fair value, increased by $34 billion, of which the increase in customer accounts was $26 billion. Customer deposit growth was seen across all markets, with growth in term deposits contributing $18 billion of the increase following a renewed focus as rates moved up in our core markets. However, CASA also continues to grow, constituting over 50 per cent of total customer and bank deposits.
Debt securities in issue, subordinated liabilities and other borrowed funds Subordinated debt remained flat with redemptions of $0.5 billion offset by exchange translation and new issuance.
Debt securities in issue grew by $9 billion or 25 per cent largely driven by the issue of non negotiable certificate of deposits to non bank customers.
Equity Total shareholders’ equity increased by $2.7 billion to $41.6 billion due to profit accretion in addition to a $0.6 billion translation benefit arising from the appreciation of Asian currencies. This was partially offset by dividends paid to shareholders of $0.5 billion.
Standard Chartered PLC – Risk review
20
The following parts of the Risk Review are reviewed by the auditors: from the start of the “Risk management” section on page 22 to the end of the “Operational risk” section on page 52, with the exception of the “Asset backed securities” section on page 41 and page 42.
Risk overview
Standard Chartered has a defined risk appetite, approved by the Board, which is an expression of the amount of risk we are prepared to take and plays a central role in the development of our strategic plans and policy. We also regularly conduct stress tests to ensure that we are operating within our approved risk appetite.
Our proactive approach to risk management enables us to reshape our portfolios and adjust underwriting standards according to the anticipated conditions in our markets. In the first half of 2011, we maintained our cautious stance overall but continued to selectively increase our exposures in certain markets to capitalise on improved market conditions. Our balance sheet and liquidity have remained strong and we are well positioned for the remainder of the year.
Our lending portfolio is diversified across a wide range of products, industries and customer segments, which serves to mitigate risk. We operate in 71 markets and there is no single market that accounts for more than 20 per cent of loans and advances to customers, or operating income. Our cross-border asset exposure is diversified and reflects our strategic focus on our core markets and customer segments. Approximately 50 per cent of our loans and advances to customers are of short maturity, and within Wholesale Banking more than 65 per cent of loans and advances have a tenor of one year or less. More than 75 per cent of Consumer Banking assets are secured.
We have low exposure to countries impacted by the upheaval in the Middle East and North Africa. Exposures in Bahrain, Syria, Egypt, Libya and Tunisia represent less than 0.5 per cent of our total assets.
We also have low exposure to asset classes and segments outside of our core markets and target customer base. We have no direct sovereign exposure to Portugal, Italy, Ireland, Greece or Spain. Our total gross exposure to all counterparties in these countries, more than half of which relates to currency and interest rate derivatives, is less than 0.5 per cent of total assets. Our direct sovereign exposure (as defined by the European Banking Authority) to the 30 European Economic Area countries is immaterial.
Our commercial real estate exposure accounts for less than two per cent of our total assets. Our exposure to leveraged loans and to asset backed securities (ABS) each account for less than 1 per cent and less than 0.4 per cent of our total assets, respectively.
Market risk is tightly monitored using Value at Risk (VaR) methodologies complemented by sensitivity measures, gross nominal limits and management action triggers at a detailed portfolio level. This is supplemented with extensive stress testing which takes account of more extreme price movements.
Our liquidity in the first half of 2011 benefited from continued good inflows of customer deposits, which helped us to maintain a strong advances-to-deposits ratio. Liquidity will continue to be deployed to support growth opportunities in our chosen markets. We manage liquidity in each of our geographical locations, ensuring that we can meet all short-term funding requirements and that our balance sheet remains structurally sound. Our customer deposit base is diversified by type and maturity and we are a net provider of liquidity to the interbank
money markets. We have a substantial portfolio of marketable securities which can be realised in the event of liquidity stress.
We have a well-established risk governance structure and an experienced senior team. Members of our Group Management Committee sit on our principal risk committees, which ensure that risk oversight is a critical focus for all our directors, while common membership between these committees helps us address the inter-relationships between risk types.
Risk performance review
Following the significant improvement seen in 2010, credit conditions in the first half of 2011 have remained stable despite an uncertain external environment, with further improvements seen in many of the Group’s markets and business segments. Impairment charges have decreased in Consumer Banking and remained at a low level in Wholesale Banking while portfolios have continued to grow.
In Consumer Banking the total loan impairment charge for the period was lower than both half year periods in 2010 and continues to run at historically low levels as a percentage of loans and advances. Improvement in individual impairment charges were seen across almost all regions in 2011 with particularly significant improvement in Middle East and Other South Asia (MESA). The improvement in impairment is supported by the improved credit conditions in our markets as well as our disciplined approach to risk management and proactive collections efforts to minimise account delinquency. There were also increased recoveries during this period due to higher loan sales.
Following the significant reductions in the level of impairment in Wholesale Banking seen in 2010 compared to 2008-2009, the low level of provisioning has continued into the first half of 2011. Portfolio indicators have remained stable throughout the period reflecting the improved credit environment in our footprint. The largest provisions taken in the period have been against already impaired accounts in the Middle East region. Portfolio impairment provisions have been reduced in most markets except India, where uncertainties in specific sectors of the economy have led to an increase in portfolio provision in the period.
Total average VaR and trading book average VaR in the first half of 2011 has been at similar levels to the first and second halves of 2010. Commodities average VaR in the first half of 2011 is 32 per cent higher than in the second half of 2010. This reflects increased volatility in the commodities markets in the first half of 2011.
Principal uncertainties
We are in the business of taking selected risks to generate shareholder value, and we seek to contain and mitigate these risks to ensure they remain within our risk appetite and are adequately compensated. However, risks are by their nature uncertain and the management of risk relies on judgements and predictions about the future.
The key uncertainties we face in the coming year are set out below. This should not be regarded as a complete and comprehensive statement of all potential risks and uncertainties that we may experience.
Deteriorating macroeconomic conditions in footprint countries Macroeconomic conditions have an impact on personal expenditure and consumption, demand for business products and services, the debt service burden of consumers and businesses, the general availability of credit for retail and corporate borrowers and the availability of capital and liquidity

Standard Chartered PLC – Risk review continued
21
funding for our business. All these factors may impact our performance.
The world economy continues to recover from the financial crisis of 2008-09 but the pace of global economic growth is moderating as the boost from policy stimulus fades. The pace of recovery has diverged significantly between East and West. Accelerated fiscal retrenchment in Europe, combined with the risk aversion created by recent volatility in the euro area is bearing down on sentiment, though core European countries continue to show strong growth.
We operate primarily in the countries that led the global recovery and our major markets in Asia, Africa and the Middle East appear well positioned to grow strongly, albeit at a slower pace than in 2010. Our exposure to leveraged loans and European sovereign debt is very low. However, we remain alert to the risk of secondary impacts from events in the West on financial institutions, other counterparties and global economic growth. Supply-chain disruption arising from the earthquake in Japan has dampened activity in many countries but we expect this to be temporary.
Commodity price-driven inflation is a growing concern in a number of our footprint markets, as are rising asset prices caused by rising capital inflows. Interest rates have continued to increase in some markets. We expect further monetary tightening and the use of other macro-prudential measures and selective capital controls, especially in Asia and Africa.
While we believe them to be less likely, other risks we are monitoring include a sharp economic slowdown, financial turmoil triggered by mismanagement of the Euro debt crisis and a surge in oil prices. Other policy mistakes such as premature tightening, regulatory over-reaction or trade protectionism are an additional concern.
We balance risk and return taking account of changing conditions through the economic cycle, and monitor economic trends in our markets very closely. We also continuously review the suitability of our risk policies and controls.
Regulatory changes and compliance Our business as an international bank is subject to a complex regulatory framework comprising legislation, regulation and codes of practice, in each of the countries in which we operate.
A key uncertainty relates to the way in which governments and regulators adjust laws and regulations and economic policies in response to macroeconomic and other systemic conditions. The financial crisis of 2008-09 has spurred unprecedented levels of proposals to change the regulations governing financial institutions and further changes to regulations remain under consideration in many jurisdictions.
The nature and impact of future changes in laws, regulations and economic policies are not predictable and could run counter to our strategic interests. We support changes to laws, regulations or codes of practice that will improve the overall stability of the financial system. However, we also have concerns that certain proposals may not achieve this desired objective and may have unintended consequences, either individually or in terms of aggregate impact. Proposed changes could affect the volatility and liquidity of the financial markets and, consequently, the way we conduct business and manage capital and liquidity. These effects may directly or indirectly impact our financial performance.
Both unilaterally and through our participation in industry forums, we respond to consultation papers and discussions initiated by regulators and governments. We also keep a close watch on key regulatory developments in order to anticipate
changes and their potential impact. A number of changes have been proposed under Basel III but significant uncertainty remains around the specific application and the combined impact of these proposals.
We have a commitment to maintaining strong relationships with governments and regulators in the countries in which we operate. At any time the Group may be in discussion with a range of authorities and regulatory bodies in different countries on matters that relate to its past or current business activities.
The UK government has established the Independent Commission on Banking to consider structural and non-structural reforms to the UK banking sector to promote financial stability and competition. The Commission is set to publish its final recommendations in September and the government will then respond. The Commission’s conclusions and the government response may have an impact on the Group.
As reported previously, the Group is conducting a review of its historical US sanctions compliance and is discussing that review with US enforcement agencies and regulators. The Group cannot predict when this review and these discussions will be completed or what the outcome will be.
On 29 February 2008, the Group completed the acquisition of American Express Bank (AEB). Prior to the acquisition, the subsidiary of AEB located in Miami had entered into a Cease and Desist Order with the Federal Reserve Bank of Atlanta to address deficiencies relating to compliance with applicable federal and state laws and regulations governing anti-money laundering.
Financial markets dislocation There is a risk that a sudden financial market dislocation, perhaps as a result of a sharp slowdown in economic activity or further deterioration of the sovereign debt crisis in the West, could significantly increase general financial market volatility which could affect our performance or the availability of capital or liquidity. These factors may have an impact on the mark-to-market valuations of assets in our available-for-sale and trading portfolios. The potential losses incurred by certain customers holding derivative contracts during periods of financial market volatility could also lead to an increase in customer disputes and corporate defaults. At the same time, financial market instability could cause some financial institution counterparties to experience tighter liquidity conditions or even fail. Government action since the global financial crisis of 2008-2009 has reduced the systemic risk, but the impact on the financial services industry of ongoing uncertainty in the broader economic environment means that the risk nonetheless remains.
We maintain robust appropriateness and suitability processes to mitigate the risk of customer disputes. We closely monitor the performance of our financial institution counterparties and adjust our exposure to these counterparties as necessary.
Geopolitical events We operate in a large number of markets around the world, and our performance is in part reliant on the openness of cross-border trade and capital flows. We face a risk that geopolitical tensions or conflict in our footprint could impact trade flows, our customers’ ability to pay, and our ability to manage capital or operations across borders.
We actively monitor the political situation in all our principal markets, such as the recent upheaval in the Middle East and North Africa. We conduct stress tests of the impact of extreme but plausible geopolitical events on our performance and the potential for such events to jeopardise our ability to operate within our stated risk appetite.

Standard Chartered PLC – Risk review continued
22
Fraud The banking industry has long been a target for third parties seeking to defraud, to disrupt legitimate economic activity, or to facilitate other illegal activities. The risk posed by such criminal activity is growing as criminals become more sophisticated and as they take advantage of the increasing use of technology.
We seek to be vigilant to the risk of internal and external crime in our management of people, processes, systems and in our dealings with customers and other stakeholders. We have a broad range of measures in place to monitor and mitigate this risk. Controls are embedded in our policies and procedures across a wide range of the Group’s activities, such as origination, recruitment, physical and information security.
Exchange rate movements Changes in exchange rates affect, among other things, the value of our assets and liabilities denominated in foreign currencies, as well as the earnings reported by our non-US dollar denominated branches and subsidiaries. Sharp currency movements can also impact trade flows and the wealth of clients both of which could have an impact on our performance.
We monitor exchange rate movements closely and adjust our exposures accordingly. Under certain circumstances, we may take the decision to hedge our foreign exchange exposures in order to protect our capital ratios from the effects of changes in exchange rates. The effect of exchange rate movements on the capital adequacy ratio is mitigated to the extent there are proportionate movements in risk weighted assets.
The table below sets out the period end and average currency exchange rates per US dollar for India, Korea and Singapore for the first half of 2011, and the half-year periods ending 30 June 2010 and 31 December 2010.
6 months
ended 30.06.11
6 monthsended
30.06.10
6 monthsended
31.12.10
Indian rupee Average 45.00 45.79 45.65 Period end 44.68 46.39 44.68 Korean won Average 1,102.22 1,155.30 1,157.36 Period end 1,067.30 1,222.16 1,134.61 Singapore dollar Average 1.26 1.40 1.32 Period end 1.23 1.40 1.28
As a result of our normal business operations, Standard Chartered is exposed to a broader range of risks than those principal uncertainties mentioned above and our approach to managing risk is detailed on the following pages.
Risk management
The management of risk lies at the heart of Standard Chartered’s business. One of the main risks we incur arises from extending credit to customers through our trading and lending operations. Beyond credit risk, we are also exposed to a range of other risk types such as country cross-border, market, liquidity, operational, pension, reputational and other risks that are inherent to our strategy, product range and geographical coverage.
Risk management framework Effective risk management is fundamental to being able to generate profits consistently and sustainably and is thus a central part of the financial and operational management of the Group.
Through our risk management framework we manage enterprise-wide risks, with the objective of maximising risk-adjusted returns while remaining within our risk appetite.
As part of this framework, we use a set of principles that describe the risk management culture we wish to sustain:
• Balancing risk and return: risk is taken in support of the requirements of our stakeholders, in line with our strategy and within our risk appetite
• Responsibility: it is the responsibility of all employees to ensure that risk-taking is disciplined and focused. We take account of our social responsibilities and our commitments to customers in taking risk to produce a return
• Accountability: risk is taken only within agreed authorities and where there is appropriate infrastructure and resource. All risk-taking must be transparent, controlled and reported
• Anticipation: We seek to anticipate future risks and ensure awareness of all known risks
• Competitive advantage: We seek to achieve competitive advantage through efficient and effective risk management and control.
Risk governance Ultimate responsibility for setting our risk appetite and for the effective management of risk rests with the Board.
Acting within an authority delegated by the Board, the Board Risk Committee (BRC), whose membership is comprised exclusively of non-executive directors of the Group, has responsibility for oversight and review of prudential risks including but not limited to credit, market, capital, liquidity, operational and reputational. It reviews the Group’s overall risk appetite and makes recommendations thereon to the Board. Its responsibilities also include reviewing the appropriateness and effectiveness of the Group’s risk management systems and controls, considering the implications of material regulatory change proposals, ensuring effective due diligence on material acquisitions and disposals, and monitoring the activities of the Group Risk Committee (GRC) and Group Asset and Liability Committee (GALCO).
The BRC receives regular reports on risk management, including our portfolio trends, policies and standards, stress testing, liquidity and capital adequacy, and is authorised to investigate or seek any information relating to an activity within its terms of reference.
The Brand and Values Committee (BVC) oversees the brand, values and good reputation of the Group. It ensures that the management of reputational risk is consistent with the risk appetite approved by the Board and with the creation of long term shareholder value.
Overall accountability for risk management is held by the Standard Chartered Bank Court (the Court) which comprises the group executive directors and other senior executives of Standard Chartered Bank.
The Court delegates authority for the management of risk to several committees.
The GRC is responsible for the management of all risks other than those delegated by the Court to the GALCO and the Group Pensions Executive Committee (PEC). The GRC is responsible for the establishment of, and compliance with, policies relating to credit risk, country cross-border risk, market risk, operational risk, and reputational risk. The GRC also defines our overall risk management framework.

Standard Chartered PLC – Risk review continued
23
The GALCO is responsible for the management of capital and the establishment of, and compliance with, policies relating to balance sheet management, including management of our liquidity, capital adequacy and structural foreign exchange and interest rate risk.
The PEC is responsible for the management of pension risk.
Members of the Court are also members of both the GRC and GALCO. The GRC is chaired by the GCRO. The GALCO is chaired by the Group Finance Director.
Risk limits and risk exposure approval authority frameworks are set by the GRC in respect of credit risk, country cross-border risk, market risk and operational risk. The GALCO sets the approval authority framework in respect of liquidity risk. Risk approval authorities may be exercised by risk committees or authorised individuals.
The committee governance structure ensures that risk-taking authority and risk management policies are cascaded down from the Board through to the appropriate functional, divisional and country-level committees. Information regarding material risk issues and compliance with policies and standards is communicated to the country, business, functional committees and Group-level committees.
Roles and responsibilities for risk management are defined under a Three Lines of Defence model. Each line of defence describes a specific set of responsibilities for risk management and control.
The first line of defence is that all employees are required to ensure the effective management of risks within the scope of their direct organisational responsibilities. Business, function and geographic governance heads are accountable for risk management in their respective businesses and functions, and for countries where they have governance responsibilities.
The second line of defence comprises the Risk Control Owners, supported by their respective control functions. Risk Control Owners are responsible for ensuring that the risks within the scope of their responsibilities remain within appetite. The scope of a Risk Control Owner’s responsibilities is defined by a given Risk Type and the risk management processes that relate to that Risk Type. These responsibilities cut across the Group and are not constrained by functional, business and geographic boundaries. The major risk types are described individually in following sections.
The third line of defence is the independent assurance provided by the Group Internal Audit (GIA) function. Its role is defined and overseen by the Audit Committee.
The findings from GIA’s audits are reported to all relevant management and governance bodies – accountable line managers, relevant oversight function or committee and committees of the Board.
GIA provides independent assurance of the effectiveness of management’s control of its own business activities (the first line) and of the processes maintained by the Risk Control Functions (the second line). As a result, GIA provides assurance that the overall system of control effectiveness is working as required within the Risk Management Framework.
The Risk function The GCRO directly manages a Risk function that is separate from the origination, trading and sales functions of the businesses. The GCRO also chairs the GRC and is a member of the Group Management Committee.
The role of the Risk function is:
• To maintain the Risk Management Framework, ensuring it remains appropriate to the Group’s activities, is effectively communicated and implemented across the Group and for administering related governance and reporting processes
• To uphold the overall integrity of the Group’s risk/return decisions, and in particular for ensuring that risks are properly assessed, that risk/return decisions are made transparently on the basis of this proper assessment, and are controlled in accordance with the Group’s standards
• To exercise direct Risk Control Ownership for Credit, Market, Country Cross-Border, Short-term Liquidity and Operational risk types.
The Group appoints Chief Risk Officers (CROs) for its two business divisions and principal countries and regions. CROs at all levels of the organisation fulfil the same role as the GCRO, in respect of the business, geography or legal entity for which they are responsible. The roles of CROs are aligned at each level.
The Risk function is independent of the origination, trading and sales functions to ensure that the necessary balance in risk/return decisions is not compromised by short-term pressures to generate revenues. This is particularly important given that revenues are recognised from the point of sale while losses arising from risk positions typically manifest themselves over time.
In addition, the Risk function is a centre of excellence that provides specialist capabilities of relevance to risk management processes in the wider organisation.
Risk appetite We manage our risks to build a sustainable franchise in the interests of all our stakeholders.
Risk appetite is an expression of the amount of risk we are willing to take in pursuit of our strategic objectives, reflecting our capacity to sustain losses and continue to meet our obligations arising from a range of different stress trading conditions.
We define our risk appetite in terms of both volatility of earnings and the maintenance of minimum regulatory capital requirements under stress scenarios. We also define a risk appetite with respect to liquidity risk and reputational risk.
Our quantitative risk profile is assessed through a bottom-up analytical approach covering all of our major businesses, countries and products.
The Group’s risk appetite statement is approved by the Board and forms the basis for establishing the risk parameters within which the businesses must operate, including policies, concentration limits and business mix.
The GRC and GALCO are responsible for ensuring that our risk profile is managed in compliance with the risk appetite set by the Board.

Standard Chartered PLC – Risk review continued
24
Stress testing Stress testing and scenario analysis are used to assess the financial and management capability of Standard Chartered to continue operating effectively under extreme but plausible trading conditions. Such conditions may arise from economic, legal, political, environmental and social factors.
Our stress testing framework is designed to:
• Contribute to the setting and monitoring of risk appetite
• Identify key risks to our strategy, financial position, and reputation
• Examine the nature and dynamics of the risk profile and assess the impact of stresses on our profitability and business plans
• Ensure effective governance, processes and systems are in place to co-ordinate and integrate stress testing
• Inform senior management
• Ensure adherence to regulatory requirements.
Our stress testing activity focuses on the potential impact of macroeconomics, geopolitical and physical events on relevant geographies, customer segments and asset classes.
A Stress Testing Committee, led by the Risk function with participation from the businesses, Group Finance, Global Research and Group Treasury, aims to ensure that the earnings and capital implications of specific stress scenarios are fully understood. The Stress Testing Committee generates and considers pertinent and plausible scenarios that have the potential to adversely affect our business and considers impact across different risk types and countries.
Stress tests are also performed at country and business level.
Credit risk
Credit risk is the potential for loss due to the failure of a counterparty to meet its obligations to pay the Group in accordance with agreed terms. Credit exposures may arise from both the banking and trading books.
Credit risk is managed through a framework that sets out policies and procedures covering the measurement and management of credit risk. There is a clear segregation of duties between transaction originators in the businesses and approvers in the Risk function. All credit exposure limits are approved within a defined credit approval authority framework.
Credit policies Group-wide credit policies and standards are considered and approved by the GRC, which also oversees the delegation of credit approval and loan impairment provisioning authorities.
Policies and procedures specific to each business are established by authorised risk committees within Wholesale and Consumer Banking. These are consistent with our Group-wide credit policies, but are more detailed and adapted to reflect the different risk environments and portfolio characteristics.
Credit rating and measurement Risk measurement plays a central role, along with judgment and experience, in informing risk taking and portfolio management decisions. It is a primary area for sustained investment and senior management attention.
Since 1 January 2008, Standard Chartered has used the advanced Internal Ratings Based (IRB) approach under the Basel II regulatory framework to calculate credit risk capital.
For IRB portfolios, a standard alphanumeric credit risk grade (CG) system is used in both Wholesale and Consumer Banking. The grading is based on our internal estimate of probability of default over a one year horizon, with customers or portfolios assessed against a range of quantitative and qualitative factors. The numeric grades run from 1 to 14 and some of the grades are further sub-classified A, B or C. Lower credit grades are indicative of a lower likelihood of default. Credit grades 1A to 12C are assigned to performing customers or accounts, while credit grades 13 and 14 are assigned to non-performing or defaulted customers.
Our credit grades in Wholesale Banking are not intended to replicate external credit grades, and ratings assigned by external ratings agencies are not used in determining our internal credit grades. Nonetheless, as the factors used to grade a borrower may be similar, a borrower rated poorly by an external rating agency is typically assigned a worse internal credit grade.
Advanced IRB models cover a substantial majority of our exposures and are used extensively in assessing risks at a customer and portfolio level, setting strategy and optimising our risk-return decisions.
IRB risk measurement models are approved by the responsible risk committee, on the recommendation of the Group Model Assessment Committee (MAC). The MAC supports risk committees in ensuring risk identification and measurement capabilities are objective and consistent, so that risk control and risk origination decisions are properly informed. Prior to review by the MAC, all IRB models are validated in detail by a model validation team, which is separate from the teams that develop and maintain the models. Models undergo a detailed annual review. Reviews are also triggered if the performance of a model deteriorates materially against predetermined thresholds during the ongoing model performance monitoring process.
Credit approval Major credit exposures to individual counterparties, groups of connected counterparties and portfolios of retail exposures are reviewed and approved by the Group Credit Committee (GCC). The GCC derives its authority from the GRC.
All other credit approval authorities are delegated by the GRC to individuals based both on their judgment and experience and a risk-adjusted scale that takes account of the estimated maximum potential loss from a given customer or portfolio. Credit origination and approval roles are segregated in all but a very few authorised cases. In those very few exceptions where they are not, originators can only approve limited exposures within defined risk parameters.
Concentration risk Credit concentration risk is managed within concentration caps set by counterparty or groups of connected counterparties, by country and industry in Wholesale Banking; and tracked by product and country in Consumer Banking. Additional targets are set and monitored for concentrations by credit rating.
Credit concentrations are monitored by the responsible risk committees in each of the businesses and concentration limits that are material to the Group are reviewed and approved at least annually by the GCC.

Standard Chartered PLC – Risk review continued
25
Credit monitoring We regularly monitor credit exposures, portfolio performance, and external trends that may impact risk management outcomes.
Internal risk management reports are presented to risk committees, containing information on key environmental, political and economic trends across major portfolios and countries; portfolio delinquency and loan impairment performance; and IRB portfolio metrics including credit grade migration.
The Wholesale Banking Credit Issues Forum (WBCIF) is a sub-committee of the Wholesale Banking Risk Committee, which in turn is a sub-committee of and derives its authority from the GRC. The WBCIF meets regularly to assess the impact of external events and trends on the Wholesale Banking credit risk portfolio and to define and implement our response in terms of appropriate changes to portfolio shape, portfolio and underwriting standards, risk policy and procedures.
Corporate accounts or portfolios are placed on early alert when they display signs of weakness or financial deterioration, for example, where there is a decline in the customer’s position within the industry, a breach of covenants, non-performance of an obligation, or there are issues relating to ownership or management.
Such accounts and portfolios are subjected to a dedicated process overseen by Early Alert Committees in each country. Account plans are re-evaluated and remedial actions are agreed and monitored. Remedial actions include, but are not limited to, exposure reduction, security enhancement, exiting the account or immediate movement of the account into the control of Group Special Assets Management (GSAM), our specialist recovery unit.
In Consumer Banking, portfolio delinquency trends are monitored continuously at a detailed level. Individual customer behaviour is also tracked and is considered for lending decisions. Accounts that are past due are subject to a collections process, managed independently by the Risk function. Charged-off accounts are managed by specialist recovery teams. In some countries, aspects of collections and recovery functions are outsourced.
The small and medium-sized enterprise (SME) business is managed within Consumer Banking in two distinct customer sub-segments: small businesses and medium enterprises, differentiated by the annual turnover of the counterparty. The credit processes are further refined based on exposure at risk. Larger exposures are managed through the Discretionary Lending approach, in line with Wholesale Banking procedures, and smaller exposures are managed through Programmed Lending, in line with Consumer Banking procedures. Discretionary Lending and private banking past due accounts are managed by GSAM.
Credit mitigation Potential credit losses from any given account, customer or portfolio are mitigated using a range of tools such as collateral, netting agreements, credit insurance, credit derivatives and other guarantees. The reliance that can be placed on these mitigants is carefully assessed in light of issues such as legal certainty and enforceability, market valuation correlation and counterparty risk of the guarantor.
Risk mitigation policies determine the eligibility of collateral types. Collateral types that are eligible for risk mitigation include: cash; residential, commercial and industrial property; fixed assets such as motor vehicles, aircraft, plant and machinery; marketable securities; commodities; bank guarantees; and letters of credit. Standard Chartered also enters into collateralised reverse repurchase agreements.
Collateral is valued in accordance with our risk mitigation policy, which prescribes the frequency of valuation for different collateral types, based on the level of price volatility of each type of collateral and the nature of the underlying product or risk exposure. Collateral held against impaired loans is maintained at fair value.
Where appropriate, credit derivatives are used to reduce credit risks in the portfolio. Due to their potential impact on income volatility, such derivatives are used in a controlled manner with reference to their expected volatility.
Traded products Credit risk from traded products is managed within the overall credit risk appetite for corporates and financial institutions.
The credit risk exposure from traded products is derived from the positive mark-to-market value of the underlying instruments, and an additional component to cater for potential market movements.
For derivative contracts, we limit our exposure to credit losses in the event of default by entering into master netting agreements with certain counterparties. As required by IAS 32, exposures are not presented net in the financial statements.
In addition, we enter into Credit Support Annexes (CSAs) with counterparties where collateral is deemed a necessary or desirable mitigant to the exposure. Under a variation margin process, additional collateral is called from the counterparty if total uncollateralised mark-to-market exposure exceeds the threshold and minimum transfer amount specified in the CSA. With certain counterparties, the CSA is reciprocal and requires us to post collateral if the overall mark-to-market value of positions is in the counterparty’s favour and exceeds an agreed threshold.
Securities Within Wholesale Banking, the Underwriting Committee approves the portfolio limits and parameters by business unit for the underwriting and purchase of all pre-defined securities assets to be held for sale. The Underwriting Committee is established under the authority of the GRC. Wholesale Banking operates within set limits, which include country, single issuer, holding period and credit grade limits.
Day to day credit risk management activities for traded securities are carried out by Traded Credit Risk Management whose activities include oversight and approval within the levels delegated by the Underwriting Committee. Issuer credit risk, including settlement and pre-settlement risk, is controlled by Wholesale Banking Risk, while price risk is controlled by Group Market Risk.
The Underwriting Committee approves individual proposals to underwrite new corporate security issues. Where an underwritten security is held for a period longer than the target sell-down period, the final decision on whether to sell the position rests with the Risk function.

Standard Chartered PLC – Risk review continued
26
Maximum exposure to credit risk The table below presents the Group’s maximum exposure to credit risk of its on-balance sheet and off-balance sheet financial instruments at 30 June 2011, before taking into account any collateral held or other credit enhancements. For on-balance sheet instruments, the maximum exposure to credit risk is the carrying amount reported on the balance sheet. For off-balance sheet instruments, the maximum exposure to credit risk represents the contractual nominal amounts.
The Group’s exposure to credit risk is spread across our markets. The Group is affected by the general economic conditions in the territories in which it operates. The Group sets limits on the exposure to any counterparty and credit risk is spread over a variety of different personal and commercial customers.
Collateral is held to mitigate credit risk exposures primarily in respect of loans and advances, and consists of residential, commercial and industrial properties, securities and other assets such as plant and machinery.
The Group has transferred to third parties by way of securitisation the rights to any collections of principal and interest on customer loan assets with a face value of $2,922 million (30 June 2010: $3,122 million, 31 December 2010: $3,072 million). The Group continues to be exposed to related credit and foreign exchange risk on these assets. The Group continues to recognise these assets in addition to the proceeds and related liability of $2,288 million (30 June 2010: $2,691 million, 31 December 2010: $2,385 million) arising from the securitisations.
The Group has entered into synthetic credit default swaps for portfolio management purposes, referencing loan assets with a notional value of $14.4 billion (30 June 2010: $18.3 billion, 31December 2010: $18.7 billion). The Group continues to hold the underlying assets referenced in the synthetic credit default swaps.
In respect of derivative financial instruments, $20,708 million (30 June 2010: $19,578 million, 31 December 2010: $26,789 million) is available for offset as a result of master netting agreements which do not, however, meet the criteria under IAS 32 to enable these balances to be presented on a net basis in the financial statements as in the ordinary course of business they are not intended to be settled net.
The Group’s maximum exposure to credit risk has increased by $76.4 billion compared to 30 June 2010 and by $41.5 billion when compared to 31 December 2010. Exposure to loans and advances to banks and customers has increased by $55.0 billion since 30 June 2010 and by $27.0 billion since 31 December 2010 due to growth in the mortgage portfolio and broad based growth across several industry sectors in Wholesale banking. Further details of the loan portfolio are set out on page 27. Improving customer appetite for derivatives has increased the Group’s exposure by $6.3 billion when compared to 30 June 2010 and by $3.0 billion when compared to 31 December 2010.
30.06.11 30.06.10 31.12.10
$million $million $million
Financial assets held at fair value through profit or loss1 25,340 22,907 25,267 Derivative financial instruments 50,834 44,555 47,859 Loans and advances to banks and customers 319,443 264,395 292,416 Investment securities1 78,640 74,913 73,279 Contingent liabilities 41,790 39,450 41,804 Undrawn irrevocable standby facilities, credit lines and other commitments to lend 51,672 45,137 45,624
567,719 491,357 526,249
1 Excludes equity shares.

Standard Chartered PLC – Risk review continued
27
Loan portfolio Loans and advances to customers have grown by $48.4 billion since 30 June 2010 and $21.4 billion since 31 December 2010 to $267.8 billion.
Consumer banking Compared to 30 June 2010, the Consumer Banking portfolio in 2011 has grown by $22.9 billion, or 22 per cent, and by $8.7 billion or 7 per cent since 31 December 2010.
The proportion of mortgages in the Consumer Banking portfolio is maintained at 58 per cent. Mortgage growth has slowed since the second half of 2010 in most markets due to intensified competition, rising interest rates and regulatory restrictions.
Other loans to individuals has grown particularly significantly in the first half of the year due to the acquisition of the GE Money consumer finance portfolio in Singapore and strong growth in Private Banking.
SME lending has grown by $5.3 billion or 38 per cent compared to 30 June 2010 and by $2.0 billion or 11 per cent since 31 December 2010. There was particularly strong growth in the first half of this year in Hong Kong, Korea and China mainly in trade finance and working capital products.
Wholesale banking The Wholesale Banking portfolio has continued to grow at a consistent rate, by $25.5 billion, or 22 per cent since 30 June 2010 and by $12.7 billion or 10 per cent compared to 31 December 2010.
Growth in the first half of 2011 has been spread across all regions and most customer segments, with most of our key regions showing double digit growth in percentage terms. Two thirds of the growth has a tenor of less than one year and is due to trade financing, corporate finance and commercial lending activity as Wholesale Banking deepens relationships with clients in core markets.
Exposure to bank counterparties at $57.8 billion increased by $7.4 billion compared to 30 June 2010 and $4.5 billion compared to 31 December 2010. We remain highly liquid and a net lender to the interbank money market.
The Wholesale Banking portfolio remains diversified across both geography and industry. There are no significant concentrations within the broad industry classifications of Manufacturing; Financing, insurance and business services; Commerce; or Transport, storage and communication.
Single borrower concentration risk has been mitigated by active distribution of assets to banks and institutional investors, some of which is achieved through credit-default swaps and synthetic risk transfer structures.
30.06.11
Asia Pacific
Hong Kong Singapore Korea
Other Asia
Pacific India
Middle East & Other
S Asia Africa
Americas UK &
Europe Total
$million $million $million $million $million $million $million $million $million
Loans to individuals Mortgages 18,312 11,386 23,445 15,551 2,096 1,434 206 505 72,935 Other 4,895 8,892 6,184 6,491 714 2,468 857 2,825 33,326 Small and medium enterprises 2,601 3,258 5,241 5,379 2,270 649 157 2 19,557
Consumer Banking 25,808 23,536 34,870 27,421 5,080 4,551 1,220 3,332 125,818
Agriculture, forestry and fishing 356 589 34 650 10 204 910 1,246 3,999 Construction 138 160 801 374 478 946 127 217 3,241 Commerce 4,789 6,236 774 4,068 615 4,019 643 5,477 26,621 Electricity, gas and water 329 288 - 803 3 356 251 1,525 3,555 Financing, insurance and business services 4,149 4,793 347 4,109 811 3,444 363 9,717 27,733 Governments - 2,379 401 2,162 2 109 17 1,765 6,835 Mining and quarrying 978 718 - 597 208 172 254 6,378 9,305 Manufacturing 5,828 1,699 4,318 9,307 2,717 2,920 1,272 7,478 35,539 Commercial real estate 2,706 1,917 1,081 1,110 1,301 858 1 547 9,521 Transport, storage and communication 1,823 2,727 363 1,159 1,237 896 388 6,256 14,849 Other 222 498 199 159 8 230 97 110 1,523
Wholesale Banking 21,318 22,004 8,318 24,498 7,390 14,154 4,323 40,716 142,721
Portfolio impairment provision (66) (38) (123) (188) (88) (154) (41) (50) (748)
Total loans and advances to customers 47,060 45,502 43,065 51,731 12,382 18,551 5,502 43,998 267,791
Total loans and advances to banks 12,883 7,432 4,272 9,225 482 2,382 245 20,830 57,751
Total loans and advances to customers include $5,665 million held at fair value through profit or loss. Total loans and advances to banks include $434 million held at fair value through profit or loss.

Standard Chartered PLC – Risk review continued
28
Loan portfolio continued 30.06.10
Asia Pacific
Hong Kong Singapore Korea
Other Asia
Pacific India
Middle East & Other
S Asia Africa
Americas UK &
Europe Total
$million $million $million $million $million $million $million $million $million
Loans to individuals Mortgages 16,831 9,111 18,855 12,731 1,925 1,241 188 213 61,095 Other 3,377 5,417 6,487 5,314 1,045 2,384 664 2,898 27,586 Small and medium enterprises 1,863 2,325 4,085 3,871 1,351 600 116 2 14,213
Consumer Banking 22,071 16,853 29,427 21,916 4,321 4,225 968 3,113 102,894
Agriculture, forestry and fishing 74 110 37 647 109 76 748 555 2,356 Construction 194 60 221 440 432 694 47 229 2,317 Commerce 3,524 5,455 723 4,002 415 4,822 654 4,029 23,624 Electricity, gas and water 562 335 88 685 - 276 149 1,406 3,501 Financing, insurance and business services 2,894 3,749 585 3,991 812 3,478 183 6,248 21,940 Governments - 1,243 - 60 2 287 9 776 2,377 Mining and quarrying 60 569 - 392 76 285 204 6,104 7,690 Manufacturing 4,046 1,698 3,581 9,134 2,656 2,378 769 7,727 31,989 Commercial real estate 2,064 2,524 1,023 845 513 847 5 454 8,275 Transport, storage and communication 739 2,127 344 878 891 1,177 218 5,093 11,467 Other 121 338 224 345 5 138 62 473 1,706
Wholesale Banking 14,278 18,208 6,826 21,419 5,911 14,458 3,048 33,094 117,242
Portfolio impairment provision (55) (45) (106) (191) (61) (245) (36) (42) (781)
Total loans and advances to customers 36,294 35,016 36,147 43,144 10,171 18,438 3,980 36,165 219,355
Total loans and advances to banks 12,838 8,554 2,675 8,573 590 1,763 467 14,941 50,401
Total loans and advances to customers include $4,350 million held at fair value through profit or loss. Total loans and advances to banks include $1,011 million held at fair value through profit or loss.
31.12.10
Asia Pacific
Hong Kong Singapore Korea
Other Asia
Pacific India
Middle East & Other
S Asia Africa
Americas UK &
Europe Total
$million $million $million $million $million $million $million $million $million
Loans to individuals Mortgages 18,245 10,689 23,061 14,679 2,124 1,331 194 339 70,662 Other 4,237 6,306 5,549 6,034 721 2,593 774 2,699 28,913 Small and medium enterprises 2,314 2,944 4,568 4,938 2,102 575 132 2 17,575
Consumer Banking 24,796 19,939 33,178 25,651 4,947 4,499 1,100 3,040 117,150
Agriculture, forestry and fishing 320 360 36 708 186 110 879 1,278 3,877 Construction 193 119 356 389 387 764 67 179 2,454 Commerce 3,975 5,852 780 4,382 570 4,186 575 6,227 26,547 Electricity, gas and water 406 347 119 949 5 279 177 1,378 3,660 Financing, insurance and business services 4,359 3,363 385 3,611 984 3,135 174 7,479 23,490 Governments - 1,542 3 572 2 293 70 1,971 4,453 Mining and quarrying 554 884 - 571 225 197 266 6,390 9,087 Manufacturing 4,965 1,468 3,426 8,975 2,598 2,858 1,128 6,895 32,313 Commercial real estate 2,365 2,775 1,314 967 675 819 1 472 9,388 Transport, storage and communication 1,462 2,362 409 1,063 762 763 391 5,944 13,156 Other 182 369 179 328 6 253 87 185 1,589
Wholesale Banking 18,781 19,441 7,007 22,515 6,400 13,657 3,815 38,398 130,014
Portfolio impairment provision (61) (41) (114) (199) (54) (207) (39) (45) (760)
Total loans and advances to customers 43,516 39,339 40,071 47,967 11,293 17,949 4,876 41,393 246,404
Total loans and advances to banks 14,591 7,215 3,193 8,648 523 1,478 420 17,196 53,264
Total loans and advances to customers include $6,046 million held at fair value through profit or loss. Total loans and advances to banks include $1,206 million held at fair value through profit or loss.

Standard Chartered PLC – Risk review continued
29
Maturity analysis Approximately half of our loans and advances to customers are short-term having a contractual maturity of one year or less. The Wholesale Banking portfolio remains predominantly short-term, with 67 per cent (30 June 2010: 65 per cent, 31 December 2010: 67 per cent) of loans and advances having a contractual maturity of one year or less. In Consumer Banking, 58 per cent (30 June 2010: 59 per cent, 31 December 2010:
60 per cent) of the portfolio is in the mortgage book, which is traditionally longer term in nature and well secured. Whilst the Other and SME loans in Consumer Banking have short contractual maturities, typically they may be renewed and repaid over longer terms in the normal course of business.
The following tables show the contractual maturity of loans and advances to customers by each principal category of borrowers’ business or industry.
30.06.11
One year or less
One to five years
Over five years Total
$million $million $million $million
Loans to individuals Mortgages 3,078 8,870 60,987 72,935 Other 20,126 10,300 2,900 33,326 Small and medium enterprises 10,622 3,667 5,268 19,557
Consumer Banking 33,826 22,837 69,155 125,818
Agriculture, forestry and fishing 3,063 713 223 3,999 Construction 2,085 1,041 115 3,241 Commerce 22,467 3,940 214 26,621 Electricity, gas and water 1,343 857 1,355 3,555 Financing, insurance and business services 18,974 7,921 838 27,733 Governments 5,707 1,128 - 6,835 Mining and quarrying 4,426 3,201 1,678 9,305 Manufacturing 25,347 8,523 1,669 35,539 Commercial real estate 4,531 4,721 269 9,521 Transport, storage and communication 7,037 5,479 2,333 14,849 Other 945 555 23 1,523
Wholesale Banking 95,925 38,079 8,717 142,721
Portfolio impairment provision (748)
Total loans and advances to customers 267,791
30.06.10
One year or less
One to five years
Over five years Total
$million $million $million $million
Loans to individuals Mortgages 2,587 8,287 50,221 61,095 Other 14,550 9,095 3,941 27,586 Small and medium enterprises 7,264 3,272 3,677 14,213
Consumer Banking 24,401 20,654 57,839 102,894
Agriculture, forestry and fishing 1,900 298 158 2,356 Construction 1,665 590 62 2,317 Commerce 20,182 2,590 852 23,624 Electricity, gas and water 1,079 987 1,435 3,501 Financing, insurance and business services 14,272 7,570 98 21,940 Governments 2,070 236 71 2,377 Mining and quarrying 3,008 2,739 1,943 7,690 Manufacturing 22,244 8,192 1,553 31,989 Commercial real estate 3,515 4,504 256 8,275 Transport, storage and communication 4,714 4,981 1,772 11,467 Other 1,227 341 138 1,706
Wholesale Banking 75,876 33,028 8,338 117,242
Portfolio impairment provision (781)
Total loans and advances to customers 219,355
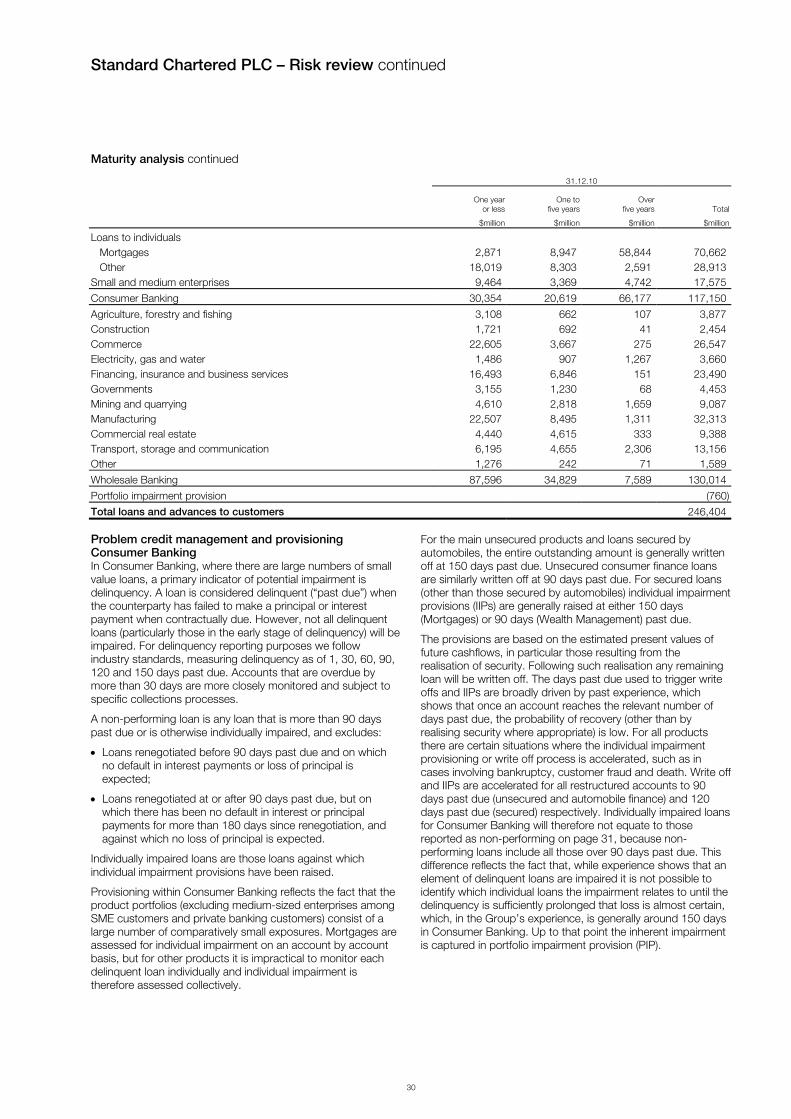
Standard Chartered PLC – Risk review continued
30
Maturity analysis continued
31.12.10
One year or less
One to five years
Over five years Total
$million $million $million $million
Loans to individuals Mortgages 2,871 8,947 58,844 70,662 Other 18,019 8,303 2,591 28,913 Small and medium enterprises 9,464 3,369 4,742 17,575
Consumer Banking 30,354 20,619 66,177 117,150
Agriculture, forestry and fishing 3,108 662 107 3,877 Construction 1,721 692 41 2,454 Commerce 22,605 3,667 275 26,547 Electricity, gas and water 1,486 907 1,267 3,660 Financing, insurance and business services 16,493 6,846 151 23,490 Governments 3,155 1,230 68 4,453 Mining and quarrying 4,610 2,818 1,659 9,087 Manufacturing 22,507 8,495 1,311 32,313 Commercial real estate 4,440 4,615 333 9,388 Transport, storage and communication 6,195 4,655 2,306 13,156 Other 1,276 242 71 1,589
Wholesale Banking 87,596 34,829 7,589 130,014
Portfolio impairment provision (760)
Total loans and advances to customers 246,404 Problem credit management and provisioning Consumer Banking In Consumer Banking, where there are large numbers of small value loans, a primary indicator of potential impairment is delinquency. A loan is considered delinquent (“past due”) when the counterparty has failed to make a principal or interest payment when contractually due. However, not all delinquent loans (particularly those in the early stage of delinquency) will be impaired. For delinquency reporting purposes we follow industry standards, measuring delinquency as of 1, 30, 60, 90, 120 and 150 days past due. Accounts that are overdue by more than 30 days are more closely monitored and subject to specific collections processes.
A non-performing loan is any loan that is more than 90 days past due or is otherwise individually impaired, and excludes:
Loans renegotiated before 90 days past due and on which no default in interest payments or loss of principal is expected;
Loans renegotiated at or after 90 days past due, but on which there has been no default in interest or principal payments for more than 180 days since renegotiation, and against which no loss of principal is expected.
Individually impaired loans are those loans against which individual impairment provisions have been raised.
Provisioning within Consumer Banking reflects the fact that the product portfolios (excluding medium-sized enterprises among SME customers and private banking customers) consist of a large number of comparatively small exposures. Mortgages are assessed for individual impairment on an account by account basis, but for other products it is impractical to monitor each delinquent loan individually and individual impairment is therefore assessed collectively.
For the main unsecured products and loans secured by automobiles, the entire outstanding amount is generally written off at 150 days past due. Unsecured consumer finance loans are similarly written off at 90 days past due. For secured loans (other than those secured by automobiles) individual impairment provisions (IIPs) are generally raised at either 150 days (Mortgages) or 90 days (Wealth Management) past due.
The provisions are based on the estimated present values of future cashflows, in particular those resulting from the realisation of security. Following such realisation any remaining loan will be written off. The days past due used to trigger write offs and IIPs are broadly driven by past experience, which shows that once an account reaches the relevant number of days past due, the probability of recovery (other than by realising security where appropriate) is low. For all products there are certain situations where the individual impairment provisioning or write off process is accelerated, such as in cases involving bankruptcy, customer fraud and death. Write off and IIPs are accelerated for all restructured accounts to 90 days past due (unsecured and automobile finance) and 120 days past due (secured) respectively. Individually impaired loans for Consumer Banking will therefore not equate to those reported as non-performing on page 31, because non-performing loans include all those over 90 days past due. This difference reflects the fact that, while experience shows that an element of delinquent loans are impaired it is not possible to identify which individual loans the impairment relates to until the delinquency is sufficiently prolonged that loss is almost certain, which, in the Group’s experience, is generally around 150 days in Consumer Banking. Up to that point the inherent impairment is captured in portfolio impairment provision (PIP).
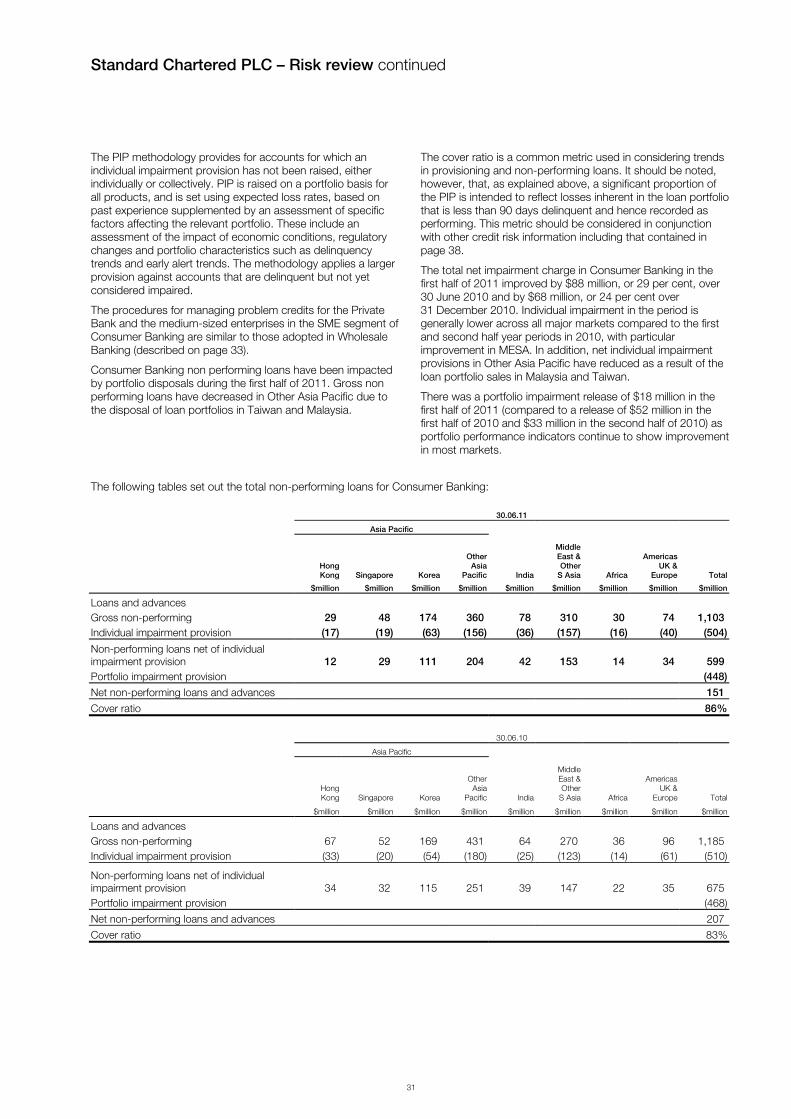
Standard Chartered PLC – Risk review continued
31
The PIP methodology provides for accounts for which an individual impairment provision has not been raised, either individually or collectively. PIP is raised on a portfolio basis for all products, and is set using expected loss rates, based on past experience supplemented by an assessment of specific factors affecting the relevant portfolio. These include an assessment of the impact of economic conditions, regulatory changes and portfolio characteristics such as delinquency trends and early alert trends. The methodology applies a larger provision against accounts that are delinquent but not yet considered impaired.
The procedures for managing problem credits for the Private Bank and the medium-sized enterprises in the SME segment of Consumer Banking are similar to those adopted in Wholesale Banking (described on page 33).
Consumer Banking non performing loans have been impacted by portfolio disposals during the first half of 2011. Gross non performing loans have decreased in Other Asia Pacific due to the disposal of loan portfolios in Taiwan and Malaysia.
The cover ratio is a common metric used in considering trends in provisioning and non-performing loans. It should be noted, however, that, as explained above, a significant proportion of the PIP is intended to reflect losses inherent in the loan portfolio that is less than 90 days delinquent and hence recorded as performing. This metric should be considered in conjunction with other credit risk information including that contained in page 38.
The total net impairment charge in Consumer Banking in the first half of 2011 improved by $88 million, or 29 per cent, over 30 June 2010 and by $68 million, or 24 per cent over 31 December 2010. Individual impairment in the period is generally lower across all major markets compared to the first and second half year periods in 2010, with particular improvement in MESA. In addition, net individual impairment provisions in Other Asia Pacific have reduced as a result of the loan portfolio sales in Malaysia and Taiwan.
There was a portfolio impairment release of $18 million in the first half of 2011 (compared to a release of $52 million in the first half of 2010 and $33 million in the second half of 2010) as portfolio performance indicators continue to show improvement in most markets.
The following tables set out the total non-performing loans for Consumer Banking:
30.06.11
Asia Pacific
Hong Kong Singapore Korea
Other Asia
Pacific India
Middle East & Other
S Asia Africa
Americas UK &
Europe Total
$million $million $million $million $million $million $million $million $million
Loans and advances Gross non-performing 29 48 174 360 78 310 30 74 1,103 Individual impairment provision (17) (19) (63) (156) (36) (157) (16) (40) (504)
Non-performing loans net of individual impairment provision 12 29 111 204 42 153 14 34 599 Portfolio impairment provision (448)
Net non-performing loans and advances 151
Cover ratio 86%
30.06.10
Asia Pacific
Hong Kong Singapore Korea
Other Asia
Pacific India
Middle East & Other
S Asia Africa
Americas UK &
Europe Total
$million $million $million $million $million $million $million $million $million
Loans and advances Gross non-performing 67 52 169 431 64 270 36 96 1,185 Individual impairment provision (33) (20) (54) (180) (25) (123) (14) (61) (510)
Non-performing loans net of individual impairment provision 34 32 115 251 39 147 22 35 675 Portfolio impairment provision (468)
Net non-performing loans and advances 207
Cover ratio 83%

Standard Chartered PLC – Risk review continued
32
Consumer Banking continued
31.12.10
Asia Pacific
Hong Kong Singapore Korea
Other Asia
Pacific India
Middle East & Other
S Asia Africa
Americas UK &
Europe Total
$million $million $million $million $million $million $million $million $million
Loans and advances Gross non-performing 50 47 145 395 76 342 29 89 1,173 Individual impairment provision (20) (20) (57) (160) (32) (141) (16) (60) (506)
Non-performing loans net of individual impairment provision 30 27 88 235 44 201 13 29 667 Portfolio impairment provision (451)
Net non-performing loans and advances 216
Cover ratio 82%
The tables below set out the net impairment charge by geography:
6 months ended 30.06.11
Asia Pacific
Hong Kong Singapore Korea
Other Asia
Pacific India
Middle East & Other
S Asia Africa
Americas UK &
Europe Total
$million $million $million $million $million $million $million $million $million
Gross impairment charge 41 25 81 142 35 82 13 4 423 Recoveries/provisions no longer required (13) (10) (12) (112) (13) (25) (6) (3) (194)
Net individual impairment charge 28 15 69 30 22 57 7 1 229 Portfolio impairment provision release (18)
Net impairment charge 211
6 months ended 30.06.10
Asia Pacific
Hong Kong Singapore Korea
Other Asia
Pacific India
Middle East & Other
S Asia Africa
Americas UK &
Europe Total
$million $million $million $million $million $million $million $million $million
Gross impairment charge 40 28 85 148 71 120 16 6 514 Recoveries/provisions no longer required (14) (9) (18) (75) (21) (19) (5) (2) (163)
Net individual impairment charge 26 19 67 73 50 101 11 4 351 Portfolio impairment provision release (52)
Net impairment charge 299
6 months ended 31.12.10
Asia Pacific
Hong Kong Singapore Korea
Other Asia
Pacific India
Middle East & Other
S Asia Africa
Americas UK &
Europe Total
$million $million $million $million $million $million $million $million $million
Gross impairment charge 36 29 86 151 48 117 15 5 487 Recoveries/provisions no longer required (15) (10) (11) (91) (12) (26) (7) (3) (175)
Net individual impairment charge 21 19 75 60 36 91 8 2 312 Portfolio impairment provision release (33)
Net impairment charge 279

Standard Chartered PLC – Risk review continued
33
Wholesale Banking Loans are classified as impaired and considered non-performing where analysis and review indicates that full payment of either interest or principal is questionable, or as soon as payment of interest or principal is 90 days overdue. Impaired accounts are managed by our specialist recovery unit, GSAM, which is separate from our main businesses. Where any amount is considered irrecoverable, an individual impairment provision is raised. This provision is the difference between the loan carrying amount and the present value of estimated future cash flows.
The individual circumstances of each customer are taken into account when GSAM estimates future cash flow. All available sources, such as cash flow arising from operations, selling assets or subsidiaries, realising collateral or payments under guarantees, are considered. In any decision relating to the raising of provisions, we attempt to balance economic conditions, local knowledge and experience, and the results of independent asset reviews.
Where it is considered that there is no realistic prospect of recovering a portion of an exposure against which an impairment provision has been raised, that amount will be written off.
As with Consumer Banking, a PIP is held to cover the inherent risk of losses which, although not identified, are known through experience to be present in any loan portfolio. In Wholesale Banking, this is set with reference to historic loss rates and subjective factors such as the economic environment and the trends in key portfolio indicators. The PIP methodology provides for accounts for which an individual impairment provision has not been raised.
Gross non-performing loans in Wholesale Banking have increased by $287 million, or 9 per cent, since 30 June 2010 and decreased by $60 million or 2 per cent since 31 December 2010. The increase since 30 June 2010 is largely due to the downgrade of three significant accounts which are under restructuring within the MESA region. Excluding the MESA region gross non-performing loans have reduced by 9 per cent since 30 June 2010 and by 7 per cent since 31 December 2010. The cover ratio reflects the extent to which gross non-performing loans are covered by individual and portfolio impairment provisions. The cover ratio as at 30 June 2011 was 53 per cent which is 3 per cent higher than at 31 December 2010 but has decreased from 56 per cent as at 30 June 2010 largely as a result of the downgrade of the three accounts referred to above. The balance uncovered by individual impairment provisions represents the value of collateral held and the Group’s estimate of the net outcome of any work-out strategy.
The total net individual impairment charge of $209 million in the first half of 2011 was $35 million higher than the first half of 2010 and $33 million higher than the second half of 2010 as credit conditions remained stable.
Portfolio provisions were reduced in most markets in the first half of 2011 to reflect the continued good performance in the portfolio. The exception to this was India where uncertainties in specific sectors of the economy have led to an increase in portfolio provision in the period. The net portfolio impairment release for the first half of 2011 was $8 million compared to releases of $36 million and $9 million for the first and second halves of 2010 respectively.
The following tables set out the total non-performing loans for Wholesale Banking:
30.06.11
Asia Pacific
Hong Kong Singapore Korea
Other Asia
Pacific India
Middle East & Other
S Asia Africa
Americas UK &
Europe Total
$million $million $million $million $million $million $million $million $million
Loans and advances Gross non-performing 91 10 259 754 255 1,775 113 141 3,398 Individual impairment provision (60) (5) (99) (347) (81) (776) (48) (74) (1,490)
Non-performing loans net of individual impairment provision 31 5 160 407 174 999 65 67 1,908 Portfolio impairment provision (302)
Net non-performing loans and advances 1,606
Cover ratio 53%
30.06.10
Asia Pacific
Hong Kong Singapore Korea
Other Asia
Pacific India
Middle East & Other
S Asia Africa
Americas UK &
Europe Total
$million $million $million $million $million $million $million $million $million
Loans and advances Gross non-performing 152 28 345 662 184 1,336 104 300 3,111 Individual impairment provision (120) (5) (182) (380) (69) (510) (53) (115) (1,434)
Non-performing loans net of individual impairment provision 32 23 163 282 115 826 51 185 1,677 Portfolio impairment provision (315)
Net non-performing loans and advances 1,362
Cover ratio 56%

Standard Chartered PLC – Risk review continued
34
Wholesale Banking continued
31.12.10
Asia Pacific
Hong Kong Singapore Korea
Other Asia
Pacific India
Middle East & Other
S Asia Africa
Americas UK &
Europe Total
$million $million $million $million $million $million $million $million $million
Loans and advances Gross non-performing 111 21 305 817 272 1,707 103 122 3,458 Individual impairment provision (82) (5) (136) (347) (80) (641) (44) (76) (1,411)
Non-performing loans net of individual impairment provision 29 16 169 470 192 1,066 59 46 2,047 Portfolio impairment provision (311)
Net non-performing loans and advances 1,736
Cover ratio 50%
The tables below set out the net impairment charge on loans and advances and other credit risk provisions by geography:
6 months ended 30.06.11
Asia Pacific
Hong Kong Singapore Korea
Other Asia
Pacific India
Middle East & Other
S Asia Africa
Americas UK &
Europe Total
$million $million $million $million $million $million $million $million $million
Gross impairment charge 27 17 12 4 21 144 6 4 235 Recoveries/provisions no longer required (6) - (2) (2) (5) (3) (7) (1) (26)
Net individual impairment charge 21 17 10 2 16 141 (1) 3 209 Portfolio impairment provision release (8)
Net impairment charge 201
6 months ended 30.06.10
Asia Pacific
Hong Kong Singapore Korea
OtherAsia
Pacific India
Middle East & Other
S Asia Africa
Americas UK &
Europe Total
$million $million $million $million $million $million $million $million $million
Gross impairment charge 9 - 62 38 12 61 6 16 204 Recoveries/provisions no longer required (2) - - (9) (3) (3) (2) (11) (30)
Net individual impairment charge 7 - 62 29 9 58 4 5 174 Portfolio impairment provision release (36)
Net impairment charge 138
6 months ended 31.12.10
Asia Pacific
Hong Kong Singapore Korea
Other Asia
Pacific India
Middle East & Other
S Asia Africa
Americas UK &
Europe Total
$million $million $million $million $million $million $million $million $million
Gross impairment charge 3 - 30 17 14 138 8 14 224 Recoveries/provisions no longer required (12) - (7) (14) (5) (4) (2) (4) (48)
Net individual impairment charge (9) - 23 3 9 134 6 10 176 Portfolio impairment provision release (9)
Net impairment charge 167

Standard Chartered PLC – Risk review continued
35
Impairment provisions on loans and advances The following table sets out the impairment provision on loans and advances by each principal category of borrowers business or industry
30.06.11 30.06.10 31.12.10
$million $million $million
Loans to individuals Mortgages 136 115 128 Other 159 186 180 Small and medium enterprises 209 209 198
Consumer Banking 504 510 506
Agriculture, forestry and fishing 46 44 42 Construction 65 48 57 Commerce 526 459 467 Electricity, gas and water 7 6 7 Financing, insurance and business services 139 108 120 Mining and quarrying - 14 1 Manufacturing 549 563 558 Commercial real estate 21 11 23 Transport, storage and communication 22 25 23 Other 21 22 20
Wholesale Banking 1,396 1,300 1,318
Individual impairment provision against loans and advances to customers (note 16) 1,900 1,810 1,824 Individual impairment provision against loans and advances to banks (note 15) 94 134 93 Portfolio impairment provision (note 15, 16) 750 783 762
Total impairment provisions on loans and advances 2,744 2,727 2,679
The following table set out the movements in individual and portfolio impairment provisions:
30.06.11 30.06.10
Individual Impairment Provisions
Portfolio Impairment Provisions Total
Individual Impairment Provisions
Portfolio Impairment Provisions Total
$million $million $million $million $million $million
Provisions held at the beginning of the period 1,917 762 2,679 1,985 876 2,861 Exchange translation differences 28 14 42 (12) (2) (14)Amounts written off (473) - (473) (611) - (611)Recoveries of acquisition fair values (5) - (5) (14) - (14)Recoveries of amounts previously written off 151 - 151 104 - 104 Discount unwind (34) - (34) (30) - (30)Other 1 - 1 (1) (3) (4)
New provisions 629 24 653 716 31 747 Recoveries/provisions no longer required (220) (50) (270) (193) (119) (312)
Net charge/(release) against profit 409 (26) 383 523 (88) 435
Provisions held at the end of the period 1,994 750 2,744 1,944 783 2,727

Standard Chartered PLC – Risk review continued
36
The following table set out the movements in individual and portfolio impairment provisions:
31.12.10
Individual Impairment Provisions
Portfolio Impairment Provisions Total
$million $million $million
At 1 July 2010 1,944 783 2,727 Exchange translation differences 48 18 66 Amounts written off (641) - (641)Recoveries of acquisition fair values (13) - (13)Recoveries of amounts previously written off 132 - 132 Discount unwind (32) - (32)Other - 3 3
New provisions 702 79 781 Recoveries/provisions no longer required (223) (121) (344)
Net charge/(release) against profit 479 (42) 437
Provisions held at 31 December 2010 1,917 762 2,679
Movement in individual impairment provision by geography
The following tables set out the movements in our total individual impairment provision against loans and advances by geography:
30.06.11
Asia Pacific
Hong Kong Singapore Korea
Other Asia
Pacific India
Middle East & Other
S Asia Africa
Americas UK &
Europe Total
$million $million $million $million $million $million $million $million $million
Provisions held at 1 January 2011 102 25 193 507 112 782 60 136 1,917 Exchange translation differences - 2 10 13 - - - 3 28 Amounts written off (64) (42) (120) (131) (32) (48) (11) (25) (473)Recoveries of acquisition fair values - - - (4) - (1) - - (5)Recoveries of amounts previously written off 13 8 6 94 7 14 9 - 151 Discount unwind (2) (1) (6) (8) (5) (12) - - (34)Other - - - - 1 - - - 1
New provisions 47 42 93 146 52 226 19 4 629 Recoveries/provisions no longer required (19) (10) (14) (114) (18) (28) (13) (4) (220)
Net charge against profit 28 32 79 32 34 198 6 - 409
Provisions held at 30 June 2011 77 24 162 503 117 933 64 114 1,994
30.06.10
Asia Pacific
Hong Kong Singapore Korea
Other Asia
Pacific India
Middle East & Other
S Asia Africa
Americas UK &
Europe Total
$million $million $million $million $million $million $million $million $million
Provisions held at 1 January 2010 181 27 267 620 91 560 63 176 1,985 Exchange translation differences (1) - (12) 12 - (6) (4) (1) (12)Amounts written off (70) (27) (145) (202) (65) (83) (8) (11) (611)Recoveries of acquisition fair values - - - (12) - (2) - - (14)Recoveries of amounts previously written off 12 6 6 55 12 10 1 2 104 Discount unwind (2) - (7) (10) (3) (6) - (2) (30)Other - - (2) (5) - 1 - 5 (1)
New provisions 49 28 147 186 83 181 22 20 716 Recoveries/provisions no longer required (16) (9) (18) (84) (24) (22) (7) (13) (193)
Net charge against profit 33 19 129 102 59 159 15 7 523
Provisions held at 30 June 2010 153 25 236 560 94 633 67 176 1,944

Standard Chartered PLC – Risk review continued
37
31.12.10
Asia Pacific
Hong Kong Singapore Korea
Other Asia
Pacific India
Middle East & Other
S Asia Africa
Americas UK &
Europe Total
$million $million $million $million $million $million $million $million $million
Provisions held at 1 July 2010 153 25 236 560 94 633 67 176 1,944 Exchange translation differences 1 2 17 16 3 2 2 5 48 Amounts written off (81) (28) (152) (189) (34) (82) (19) (56) (641)Recoveries of acquisition fair values - - (8) (4) - (1) - - (13)Recoveries of amounts previously written off 18 7 10 73 7 16 (1) 2 132 Discount unwind (1) - (6) (8) (4) (11) (1) (1) (32)Other - - 2 - (1) - - (1) -
New provisions 39 29 112 164 64 255 21 18 702 Recoveries/provisions no longer required (27) (10) (18) (105) (17) (30) (9) (7) (223)
Net charge against profit 12 19 94 59 47 225 12 11 479
Provisions held at 31 December 2010 102 25 193 507 112 782 60 136 1,917 Analysis of the loan portfolio The table on page 38 sets out an analysis of the loan portfolio between those loans that are neither past due nor impaired, those that are past due but not individually impaired and those that are individually impaired.
Collateral held against past due and impaired loans in Consumer Banking largely comprises residential and commercial property and in Wholesale Banking largely comprises property and securities. Where the fair value of collateral held exceeds the outstanding loan, any excess is paid back to customers in the event of its realisation and is not available for offset against other loans.
Renegotiated loans that would otherwise be past due or impaired if their terms had not been renegotiated were $1,432 million (30 June 2010: $2,157 million, 31 December 2010: $1,750 million), $583 million (30 June 2010: $643 million, 31 December 2010: $587 million) of which related to Consumer Banking loans to customers and $849 million (30 June 2010: $1,514 million, 31 December 2010: $1,163 million) of which related to Wholesale Banking loans to customers. Loans whose terms have been renegotiated to include concessions that the Group would not ordinarily make will usually be classified as impaired.
Loans that were more than 90 days past due, and consequently reported as non-performing before renegotiation, continue to be reported as non-performing until a minimum number of payments have been received under the new terms. Where loans that are past due have been renegotiated, such loans are no longer considered to be past due immediately after renegotiation.
In Wholesale Banking, larger SME accounts and Private Banking renegotiated loans continue to be managed by GSAM until considered to be performing and no longer a problem account. Provisions are taken on a case by case basis if further problems arise. In other parts of Consumer Banking all renegotiated loans are managed within a separate portfolio, and if such loans subsequently become past due, write off and IIP is accelerated to 90 days past due (unsecured and automobile finance) and 120 days past due (secured) respectively. The accelerated loss rates applied to this portfolio are derived from experience with other renegotiated loans, rather than the Consumer Banking portfolio as a whole, to recognise the greater degree of Inherent risk.
Loans to banks have increased by $7.4 billion between 30 June 2011 and 30 June 2010 and by $4.5 billion between 30 June 2011 and 31 December 2010. Most of the Group’s loans to financial institutions are in the credit grade 1-5 category as we lend in the interbank market to highly rated counterparties. Exposure in the credit grade 6-8 category predominantly relates to trade finance business with financial institutions in our core markets.
In the Wholesale Banking corporate portfolio, the negative credit grade migration observed during 2009 stabilised in 2010, and in the first half of 2011 the trend has been largely positive. This is also reflected in the level of early alert accounts throughout the period, which remain at a low level.
Total loans to Wholesale Banking customers increased by $25.5 billion, or 22 per cent, since 30 June 2010 and by $12.7 billion, or 10 per cent, since 31 December 2010. As at 30 June 2011 only 2.7 per cent of the loans are either past due or individually impaired, down from 2.9 per cent as at 31 December 2010. The increase in loans to customers is due to increased commercial lending, corporate finance and trade financing activity as Wholesale Banking deepens relationships in core markets.
Consumer Banking loans to customers increased by $22.9 billion, or 22 per cent, since 30 June 2010 and $8.7 billion, or 7 per cent, since 31 December 2010. The mortgage portfolio makes up 58 per cent of the Consumer Banking portfolio as at 30 June 2011, is well collateralised and has an average loan to value ratio of 49 per cent. The proportion of past due or individually impaired loans has increased to 4.3 per cent at 30 June 2011 compared to 3.7 per cent at 31 December 2010, largely driven though by an increase in loans in the less than 30 days past due category. In a high proportion of cases the overdue amounts are collected well before they reach more than 30 days past due.

Standard Chartered PLC – Risk review continued
38
Analysis of the loan portfolio continued
30.06.11 30.06.10
Loans to banks
Loans to customers –
Wholesale Banking
Loans to customers –
Consumer Banking
Total loans to customers
Loans to banks
Loans to customers –
Wholesale Banking
Loans to customers –
Consumer Banking
Total loans to customers
$million $million $million $million $million $million $million $million
Neither past due nor individually impaired loans
- Grades 1-5 47,284 58,822 56,608 115,430 42,725 44,972 47,631 92,603 - Grades 6-8 9,426 56,509 39,593 96,102 6,342 46,812 29,679 76,491 - Grades 9-11 815 23,190 22,771 45,961 1,145 21,607 19,524 41,131 - Grade 12 62 1,713 1,962 3,675 18 1,404 1,932 3,336
57,587 140,234 120,934 261,168 50,230 114,795 98,766 213,561
Past due but not individually impaired loans
- Up to 30 days past due 12 414 3,453 3,867 18 571 2,749 3,320 - 31 - 60 days past due - 187 431 618 - 231 401 632 - 61 - 90 days past due - 94 217 311 - 123 303 426 - 91 - 150 days past due - - 148 148 - - 188 188
12 695 4,249 4,944 18 925 3,641 4,566
Individually impaired loans 248 3,188 1,139 4,327 289 2,822 997 3,819 Individually impairment provisions (94) (1,396) (504) (1,900) (134) (1,300) (510) (1,810)
Net individually impaired loans 154 1,792 635 2,427 155 1,522 487 2,009
Total loans and advances 57,753 142,721 125,818 268,539 50,403 117,242 102,894 220,136 Portfolio impairment provision (2) (300) (448) (748) (2) (313) (468) (781)
57,751 142,421 125,370 267,791 50,401 116,929 102,426 219,355
Of which, held at fair value through profit or loss:
Neither past due nor individually impaired
- Grades 1-5 78 1,497 - 1,497 569 3,005 - 3,005 - Grades 6-8 356 3,172 - 3,172 442 744 - 744 - Grades 9-11 - 793 - 793 - 601 - 601 - Grade 12 - 203 - 203 - - - -
434 5,665 - 5,665 1,011 4,350 - 4,350

Standard Chartered PLC – Risk review continued
39
Analysis of the loan portfolio continued
31.12.10
Loans to banks
Loans to customers –
Wholesale Banking
Loans to customers –
Consumer Banking
Total loans to customers
$million $million $million $million
Neither past due nor individually impaired loans
- Grades 1-5 42,979 48,518 54,603 103,121 - Grades 6-8 9,263 55,577 35,521 91,098 - Grades 9-11 843 21,914 21,219 43,133 - Grade 12 19 1,564 1,983 3,547
53,104 127,573 113,326 240,899 Past due but not individually impaired loans
- Up to 30 days past due 5 223 2,587 2,810 - 31 - 60 days past due 1 190 412 602 - 61 - 90 days past due - 137 223 360 - 91 - 150 days past due - - 181 181
6 550 3,403 3,953
Individually impaired loans 249 3,209 927 4,136 Individually impairment provisions (93) (1,318) (506) (1,824)
Net individually impaired loans 156 1,891 421 2,312
Total loans and advances 53,266 130,014 117,150 247,164 Portfolio impairment provision (2) (309) (451) (760)
53,264 129,705 116,699 246,404
Of which, held at fair value through profit or loss:
Neither past due nor individually impaired
- Grades 1-5 295 1,174 - 1,174 - Grades 6-8 904 4,118 - 4,118 - Grades 9-11 7 586 - 586 - Grade 12 - 168 - 168
1,206 6,046 - 6,046

Standard Chartered PLC – Risk review continued
40
Debt securities and treasury bills
Debt securities and treasury bills are analysed as follows:
30.06.11 30.06.10
Debt securities
Treasury bills Total
Debt securities
Treasury bills Total
$million $million $million $million $million $million
Net impaired securities:
Impaired securities 629 - 629 239 - 239 Impairment provisions (263) - (263) (162) - (162)
366 - 366 77 - 77 Securities neither past due nor impaired:
AAA 14,940 3,742 18,682 9,015 2,697 11,712 AA- to AA+ 17,247 6,924 24,171 20,260 11,216 31,476 A- to A+ 23,136 7,942 31,078 19,186 9,293 28,479 BBB- to BBB+ 7,378 4,271 11,649 8,071 1,695 9,766 Lower than BBB- 1,813 1,110 2,923 3,073 1,089 4,162 Unrated 8,236 776 9,012 6,328 459 6,787
72,750 24,765 97,515 65,933 26,449 92,382
73,116 24,765 97,881 66,010 26,449 92,459
Of which: Held at fair value through profit or loss 14,624 4,617 19,241 11,752 5,794 17,546
31.12.10
Debt securities
Treasury bills Total
$million $million $million
Net impaired securities:
Impaired securities 241 - 241 Impairment provisions (180) - (180)
61 - 61 Securities neither past due nor impaired: AAA 10,427 2,791 13,218 AA- to AA+ 19,689 8,562 28,251 A- to A+ 18,384 8,378 26,762 BBB- to BBB+ 8,078 2,516 10,594 Lower than BBB- 2,947 1,361 4,308 Unrated 7,615 485 8,100
67,140 24,093 91,233
67,201 24,093 91,294
Of which: Held at fair value through profit or loss 11,817 6,198 18,015 The impaired debt securities includes the Group’s holdings of asset backed securities, on which a $9 million (30 June 2010: $15 million, 31 December 2010: $11 million) impairment charge was taken in 30 June 2011. The increase in H1 2011 is due to a bond investment in India arising from credit concerns around the issuer.
The above table also analyses debt securities and treasury bills that are neither past due nor impaired by external credit rating. The standard credit ratings used by the Group are those used by Standard & Poor’s or their equivalent. Debt securities held that have a short-term rating are reported against the long-term rating of the issuer. For securities that are unrated, the Group applies an internal credit rating as described under Loans and Advances.
Unrated securities primarily relate to corporate issuers. Using internal credit ratings, $7,762 million (30 June 2010: $5,875 million, 31 December 2010: $6,775 million) of these securities are considered to be equivalent to investment grade and $1,250 million (30 June 2010: $912 million, 31 December 2010: $1,325 million) sub-investment grade.

Standard Chartered PLC – Risk review continued
41
Asset backed securities
Total exposures to asset backed securities
30.06.11 30.06.10
Percentage Percentage of notional Carrying Fair of notional Carrying Fair
value of Notional value value1 value of Notional value value1
portfolio $million $million $million portfolio
$million $million $million Residential Mortgage Backed Securities (RMBS) US Alt-A 2% 61 28 24 2% 69 39 30 US Prime
- 1 - - - 1 - -
Other
31% 802 749 746 26% 777 730 700
Collateralised Debt Obligations (CDOs)
Asset Backed Securities
2% 62 9 8 2% 69 12 11
Other CDOs
12% 297 247 257 11% 322 273 268
Commercial Mortgage Backed Securities (CMBS)
US CMBS
5% 126 106 110 5% 135 119 110
Other
23% 587 442 429 20% 587 432 381
Other Asset Backed Securities (Other ABS)
25% 614 574 591 34% 1,028 960 967
100% 2,550 2,155 2,165 100% 2,988 2,565 2,467 Of which included within:
Financial assets held at fair value through profit or loss 6% 160 157 157 2% 50 48 48 Investment securities - available-for-sale
24% 610 402 402 28% 828 586 586
Investment securities - loans and receivables
70% 1,780 1,596 1,606 70% 2,110 1,931 1,833
100% 2,550 2,155 2,165 100% 2,988 2,565 2,467
31.12.10
Percentage of notional Carrying Fair
value of Notional value value1
portfolio
$million $million $million Residential Mortgage Backed Securities (RMBS) US Alt-A 2% 64 32 25 US Prime
- 1 - -
Other
29% 779 740 715
Collateralised Debt Obligations (CDOs)
Asset Backed Securities
2% 65 10 10
Other CDOs
12% 310 268 261
Commercial Mortgage Backed Securities (CMBS)
US CMBS
5% 131 117 110
Other
22% 586 452 414
Other Asset Backed Securities (Other ABS)
28% 737 690 697
100% 2,673 2,309 2,232 Of which included within:
Financial assets held at fair value through profit or loss 3% 86 85 85 Investment securities - available-for-sale
27% 724 499 499
Investment securities - loans and receivables
70% 1,863 1,725 1,648
100% 2,673 2,309 2,232 1 Fair value reflects the value of the entire portfolio, including assets redesignated to loans and recievables.

Standard Chartered PLC – Risk review continued
42
Asset backed securities continued The carrying value of ABS represents 0.4 per cent (30 June 2010: 0.5 per cent, 31 December 2010: 0.5 per cent) of our total assets.
The notional value of the ABS portfolio fell by approximately $123 million during the first half of 2011 due to natural redemptions in the portfolio and some asset sales. The difference between carrying value and fair value of the remaining portfolio is $10 million at 30 June 2011, benefiting from both the redemptions and a recovery in market prices in certain asset classes.
The credit quality of the asset backed securities portfolio remains strong. With the exception of those securities subject to an
impairment charge, 75 per cent of the overall portfolio is rated A or better, and 25 per cent of the overall portfolio is rated as AAA. The portfolio is broadly diversified across asset classes and geographies, and there is no direct exposure to the US sub-prime market. The portfolio has an average credit grade of A+.
The Group reclassified some ABS from trading and available-for-sale to loans and receivables with effect from 1 July 2008. The securities were reclassified at their fair value on the date of reclassification. Note 12 to the financial statements provides details of the remaining balance of those assets reclassified in 2008. No assets have been reclassified since 2008.
Writedowns of asset backed securities
Available-
for-sale Loans and receivables Total
$million $million $million
Six months to 30 June 2011 Credit to available-for-sale reserves 6 - 6 Charge to the profit and loss account (5) (4) (9)
Six months to 31 December 2010 Credit to available-for-sale reserves 36 - 36 Charge to the profit and loss account (7) (4) (11)
Six months to 30 June 2010 Credit to available-for-sale reserves 32 - 32 Charge to the profit and loss account (15) - (15)

Standard Chartered PLC – Risk review continued
43
Country cross-border risk
Country cross-border risk is the risk that we will be unable to obtain payment from our customers or third parties on their contractual obligations as a result of certain actions taken by foreign governments, chiefly relating to convertibility and transferability of foreign currency.
The GRC is responsible for our country cross-border risk limits and delegates the setting and management of country limits to the Group Country Risk function.
The business and country chief executive officers manage exposures within these limits and policies. Countries designated as higher risk are subject to increased central monitoring.
Cross-border assets comprise loans and advances, interest-bearing deposits with other banks, trade and other bills, acceptances, amounts receivable under finance leases, derivatives, certificates of deposit and other negotiable paper, investment securities and formal commitments where the counterparty is resident in a country other than where the assets are recorded. Cross-border assets also include exposures to local residents denominated in currencies other than the local currency.
Our cross-border exposure to China, Hong Kong, India, Indonesia and UAE has risen significantly over the past year, reflecting our business focus and continued expansion in our core countries.
For China the increase was driven principally by banks making increased use of foreign currency funding for their trade finance activities, Chinese entities taking unfunded risk participation in offshore loans and interbank lending.
India cross-border exposure reflects financing of acquisitions for Indian corporate clients of offshore assets.
In Indonesia there is significant growth in cross border exposure due to increased client demand for US dollar loans, principally from local corporates.
Cross-border exposure to the UAE has increased as we grew our core business with particular emphasis on the Abu Dhabi portfolio.
The growth in onshore client commodity holdings in the US has contributed significantly to the higher cross border exposure.
Cross-border exposure to countries in which we do not have a significant presence predominantly relates to short-dated money market activity, and some global corporate business. Such business is originated in our footprint countries with counterparties domiciled outside our footprint. This explains our significant exposure in the US and Switzerland.
The table below, which is based on our internal cross-border country risk reporting requirements, shows cross-border outstandings where they exceed one per cent of total assets.
30.06.11 30.06.10 31.12.10
One year or less
Over one year Total
One year or less
Over one year Total
One year or less
Over one year Total
$million $million $million $million $million $million $million $million $million
India 11,088 16,684 27,772 12,396 11,040 23,436 13,117 12,706 25,823 China 17,764 8,750 26,514 9,590 5,507 15,097 12,623 7,131 19,754 US 16,582 5,437 22,019 13,674 5,686 19,360 13,857 4,226 18,083 Hong Kong 17,200 5,160 22,360 11,578 4,215 15,793 12,781 5,542 18,323 UAE 7,158 10,807 17,965 7,491 9,501 16,992 5,927 10,717 16,644 Singapore 12,241 3,825 16,066 11,629 3,497 15,126 11,692 3,514 15,206 South Korea 7,379 6,512 13,891 8,519 5,945 14,464 7,488 5,846 13,334 Switzerland 3,638 2,674 6,312 2,560 1,675 4,235 3,918 2,362 6,280 Indonesia 3,062 2,953 6,015 2,075 1,782 3,857 2,782 2,231 5,013

Standard Chartered PLC – Risk review continued
44
Market risk
We recognise market risk as the potential for loss of earnings or economic value due to adverse changes in financial market rates or prices. Our exposure to market risk arises principally from customer-driven transactions. The objective of our market risk policies and processes is to obtain the best balance of risk and return whilst meeting customers’ requirements.
The primary categories of market risk for Standard Chartered are:
• interest rate risk: arising from changes in yield curves, credit spreads and implied volatilities on interest rate options;
• currency exchange rate risk: arising from changes in exchange rates and implied volatilities on foreign exchange options;
• commodity price risk: arising from changes in commodity prices and commodity option implied volatilities; covering energy, precious metals, base metals and agriculture;
• equity price risk: arising from changes in the prices of equities, equity indices, equity baskets and implied volatilities on related options.
Market risk governance The GRC approves our market risk appetite taking account of market volatility, the range of products and asset classes, business volumes and transaction sizes. Market risk exposures have remained broadly stable in 2011.
The Group Market Risk Committee (GMRC), under authority delegated by the GRC, is responsible for setting VaR and stress loss triggers for market risk within our risk appetite. The GMRC is also responsible for policies and other standards for the control of market risk and overseeing their effective implementation. These policies cover both trading and non-trading books of the Group. The trading book is defined as per the FSA Handbook’s Prudential Sourcebook for Banks, Building Societies and Investment Firms (BIPRU). This is more restrictive than the broader definition within IAS 39 ‘Financial Instruments: Recognition and Measurement’, as the FSA only permits certain types of financial instruments or arrangements to be included within the trading book. Limits by location and portfolio are proposed by the businesses within the terms of agreed policy.
Group Market Risk (GMR) approves the limits within delegated authorities and monitors exposures against these limits. Additional limits are placed on specific instruments and position concentrations where appropriate. Sensitivity measures are used in addition to VaR as risk management tools. For example, interest rate sensitivity is measured in terms of exposure to a one basis point increase in yields, whereas foreign exchange, commodity and equity sensitivities are measured in terms of the underlying values or amounts involved. Option risks are controlled through revaluation limits on underlying price and volatility shifts, limits on volatility risk and other variables that determine the option’s value.
Value at Risk We measure the risk of losses arising from future potential adverse movements in market rates, prices and volatilities using a VaR methodology. VaR, in general, is a quantitative measure of market risk that applies recent historical market conditions to estimate the potential future loss in market value that will not be exceeded in a set time period at a set statistical confidence level. VaR provides a consistent measure that can be applied across trading businesses and products over time and can be set against actual daily trading profit and loss outcome.
VaR is calculated for expected movements over a minimum of one business day and to a confidence level of 97.5 per cent. This confidence level suggests that potential daily losses, in excess of the VaR measure, are likely to be experienced six times per year.
We apply two VaR methodologies:
• historical simulation: involves the revaluation of all existing positions to reflect the effect of historically observed changes in market risk factors on the valuation of the current portfolio. This approach is applied for general market risk factors.
• Monte Carlo simulation: this methodology is similar to historical simulation but with considerably more input risk factor observations. These are generated by random sampling techniques, but the results retain the essential variability and correlations of historically observed risk factor changes. This approach is applied for credit spread VaR.
In both methods an historical observation period of one year is chosen and applied.
VaR is calculated as our exposure as at the close of business, generally London time. Intra-day risk levels may vary from those reported at the end of the day.
Back testing To assess their predictive power, VaR models are back tested against actual results. In the first half of 2011 there has been one exception in the regulatory back testing, compared with one in 2010. This is well within the ‘green zone’ applied internationally to internal models by bank supervisors, and implies that model reliability is statistically greater than 95 per cent.
Stress testing Losses beyond the confidence interval are not captured by a VaR calculation, which therefore gives no indication of the size of unexpected losses in these situations.
GMR complements the VaR measurement by weekly stress testing of market risk exposures to highlight the potential risk that may arise from extreme market events that are rare but plausible.
Stress testing is an integral part of the market risk management framework and considers both historical market events and forward-looking scenarios. A consistent stress testing methodology is applied to trading and non-trading books. The stress testing methodology assumes that scope for management action would be limited during a stress event, reflecting the decrease in market liquidity that often occurs.
Stress scenarios are regularly updated to reflect changes in risk profile and economic events. The GMRC has responsibility for reviewing stress exposures and, where necessary, enforcing reductions in overall market risk exposure. The GRC considers the results of stress tests as part of its supervision of risk appetite.
Regular stress test scenarios are applied to interest rates, credit spreads, exchange rates, commodity prices and equity prices. This covers all asset classes in the Financial Markets banking and trading books.
Ad hoc scenarios are also prepared reflecting specific market conditions and for particular concentrations of risk that arise within the businesses.

Standard Chartered PLC – Risk review continued
45
Market risk continued Market risk changes Total average VaR and Trading book average VaR in the first half of 2011 has been at around the same level as the first and second halves of 2010. Commodities average VaR in the first half of 2011 is 32 per cent higher than in the second half of 2010. This reflects increased volatility in the commodities markets in the first half of 2011.
Daily value at risk (VaR at 97.5%, 1 day) 6 months to 30.06.11 6 months to 30.06.10
Average High3 Low3 Actual4 Average High3 Low3 Actual4
Trading and Non-trading $million $million $million $million $million $million $million $million
Interest rate risk1 19.3 22.3 15.2 15.9 21.6 25.5 16.3 16.3
Foreign exchange risk 4.5 8.8 2.7 4.6 5.8 12.5 3.3 6.8
Commodity risk 2.5 3.7 1.3 1.9 2.0 4.0 0.7 0.7
Equity risk 10.5 12.2 9.0 10.0 10.3 11.3 9.4 9.8
Total2 20.2 25.4 16.9 17.1 23.9 31.0 18.6 19.7
6 months to 31.12.10
Average High3 Low3 Actual4
Trading and Non-trading $million $million $million $million
Interest rate risk1 18.7 21.3 16.7 19.2
Foreign exchange risk 5.5 12.5 3.1 7.6
Commodity risk 1.9 3.7 0.8 3.5
Equity risk 8.8 11.3 6.9 10.7
Total2 20.5 26.9 17.3 25.2
6 months to 30.06.11 6 months to 30.06.10
Average High3 Low3 Actual4 Average High3 Low3 Actual4
Trading $million $million $million $million $million $million $million $million
Interest rate risk1 8.0 11.4 5.4 5.4 9.3 11.9 6.3 6.3
Foreign exchange risk 4.5 8.8 2.7 4.6 5.8 12.5 3.3 6.8
Commodity risk 2.5 3.7 1.3 1.9 2.0 4.0 0.7 0.7
Equity risk 1.8 2.7 1.3 2.2 2.0 2.9 1.3 1.5
Total2 10.2 13.8 8.5 9.1 12.0 16.7 8.7 11.7
6 months to 31.12.10
Average High3 Low3 Actual4
Trading $million $million $million $million
Interest rate risk1 8.0 11.2 5.1 6.7
Foreign exchange risk 5.5 12.5 3.1 7.6
Commodity risk 1.9 3.7 0.8 3.5
Equity risk 1.7 2.3 1.2 1.4
Total2 10.4 15.0 8.1 9.6
1 Interest rate risk VaR includes credit spread risk arising from securities held for trading or available-for-sale. 2 The total VaR shown in the tables above is not a sum of the component risks due to offsets between them. 3 Highest and lowest VaR for each risk factor are independent and usually occur on different days. 4 Actual one day VaR at period end date.

Standard Chartered PLC – Risk review continued
46
Market risk continued
6 months to 30.06.11 6 months to 30.06.10
Average High3 Low3 Actual4 Average High3 Low3 Actual4
Non-trading $million $million $million $million $million $million $million $million
Interest rate risk1 14.0 17.0 11.1 12.4 17.1 22.2 11.8 12.9
Equity risk 10.6 12.5 9.4 10.9 9.5 10.0 9.1 9,8
Total2 16.8 19.9 13.2 15.7 19.7 23.2 15.7 16.0
6 months to 31.12.10
Average High3 Low3 Actual4
Non-trading $million $million $million $million
Interest rate risk1 12.9 15.0 11.2 14.3
Equity risk 9.3 10.8 8.1 10.0
Total2 15.2 17.1 13.5 16.9
1 Interest rate risk VaR includes credit spread risk arising from securities held for trading or available-for-sale. 2 The total VaR shown in the tables above is not a sum of the component risks due to offsets between them. 3 Highest and lowest VaR for each risk factor are independent and usually occur on different days. 4 Actual one day VaR as at period end date.
Average daily income earned from market risk related activities
Trading
6 months to 30.06.11
6 months to 30.06.10
6 months to 31.12.10
$million $million $million
Interest rate risk 4.8 6.1 3.6 Foreign exchange risk 6.1 5.2 4.3 Commodity risk 2.1 0.9 1.6 Equity risk 0.5 0.4 0.4
Total 13.5 12.6 9.9 Non-Trading
Interest rate risk 3.4 4.0 3.1 Equity risk 0.2 0.2 0.8
Total 3.6 4.2 3.9 Market risk VaR coverage Interest rate risk from non-trading book portfolios is transferred to Financial Markets where it is managed by local ALM desks under the supervision of local Asset and Liability Committees (ALCO). ALM deals in the market in approved financial instruments in order to manage the net interest rate risk, subject to approved VaR and risk limits.
VaR and stress tests are therefore applied to these non-trading book exposures (except Group Treasury, see below) in the same way as for the trading book, including listed available for sale securities. Securities classed as Loans and receivables or Held to maturity are not reflected in VaR or stress tests since they are accounted on an amortised cost basis and are match funded, so market price movements have no effect on either profit and loss or reserves.
Foreign exchange risk on the non-trading book portfolios is minimised by match funding assets and liabilities in the same currency. Structural foreign exchange currency risks are not included within Group VaR.
Equity risk relating to non-listed Private Equity and strategic investments is not included within the VaR. It is separately managed through delegated limits for both investment and divestment, and is also subject to regular review by an investment committee. These are included as Level 3 assets as disclosed in note 12 to the financial statements.
Group Treasury market risk Group Treasury raises debt and equity capital and the proceeds are invested within the Group as capital or placed with ALM. Interest rate risk arises due to the investment of equity and reserves into rate-sensitive assets, as well as some tenor mismatches between debt issuance and placements. This risk is measured as the impact on net interest income (NII) of an unexpected and instantaneous adverse parallel shift in rates and is monitored over a rolling one-year time horizon (see table below).
This risk is monitored and controlled by the Group’s Capital Management Committee (CMC).
NII sensitivity to parallel shifts in yield curves 30.06.11 30.06.10 31.12.10
$million $million $million
+25 basis points 30.0 21.5 29.9
–25 basis points (30.0) (21.5) (29.9)
The increase in NII sensitivity is primarily due to the placement of the 2010 rights issue proceeds at the US Federal Reserve over the year end.
Group Treasury also manages the structural foreign exchange risk that arises from non-US dollar currency net investments in branches and subsidiaries. The impact of foreign exchange movements is taken to reserves which form part of the capital base. The effect of exchange rate movements on the capital

Standard Chartered PLC – Risk review continued
47
ratio is partially mitigated by the fact that both the value of these investments and the risk weighted assets in those currencies follow broadly the same exchange rate movements. With the approval of CMC, Group Treasury may hedge the net investments if it is anticipated that the capital ratio will be materially affected by exchange rate movements. At 30 June 2011, the Group had taken net investment hedges (using a combination of derivative and non-derivative financial instruments) of $991 million (30 June 2010: $803 million, 31 December 2010: $1,112 million) to partly cover its exposure to Korean won.
The table below sets out the principal structural foreign exchange exposures (net of investment hedges) of the Group:
30.06.11 30.06.10 31.12.10
$million $million $million
Hong Kong dollar 6,252 6,248 5,817
Korean won 5,916 4,944 5,266
Indian rupee 3,707 3,159 3,400
Taiwanese dollar 2,917 2,365 2,606
Thai baht 1,491 1,347 1,495
UAE dirham 1,481 1,193 1,343
Singapore dollar 1,563 739 841
Malaysian ringgit 1,098 949 1,047
Chinese yuan 1,534 1,217 1,420
Indonesian rupiah 965 734 882
Pakistani rupee 619 592 614
Other 3,049 2,438 2,838
30,592 25,925 27,569
An analysis has been performed on these exposures to assess the impact of a one per cent fall in the US dollar exchange rates adjusted to incorporate the impacts of correlations of these currencies to the US dollar. The impact on the positions above would be an increase of $222 million (30 June 2010: $187 million, 31 December 2010: $197 million). Changes in the valuation of these positions are taken to reserves.
Derivatives Derivatives are contracts with characteristics and value derived from underlying financial instruments, interest and exchange rates or indices. They include futures, forwards, swaps and options transactions. Derivatives are an important risk management tool for banks and their customers because they can be used to manage market price risk. The market risk of derivatives is managed in essentially the same way as other traded products.
Our derivative transactions are principally in instruments where the mark-to-market values are readily determinable by reference to independent prices and valuation quotes.
We enter into derivative contracts in the normal course of business to meet customer requirements and to manage our exposure to fluctuations in market price movements.
Derivatives are carried at fair value and shown in the balance sheet as separate totals of assets and liabilities. Recognition of fair value gains and losses depends on whether the derivatives are classified as trading or held for hedging purposes.
The credit risk arising from all financial derivatives is managed as part of the overall lending limits to financial institutions and corporate customers. This is covered in more detail in the Credit risk section.
Hedging Countries within the Group use futures, forwards, swaps and options transactions primarily to mitigate interest and foreign exchange risk arising from their in-country exposures. The Group also uses futures, forwards and options to hedge foreign exchange and interest rate risk.
In accounting terms under IAS 39, hedges are classified into three types: fair value hedges, predominantly where fixed rates of interest or foreign exchange are exchanged for floating rates; cash flow hedges, predominantly where variable rates of interest or foreign exchange are exchanged for fixed rates; and hedges of net investments in overseas operations translated to the parent company’s functional currency, US dollars.
The use of interest rate swaps for the purposes of fair value and cash flow hedging increased in the first half of 2011 compared with December 2010, as we continued to focus on liquidity management together with an active balance sheet hedging strategy. The increase in interest rate swaps used for cash flow hedges was primarily due to hedge floating rate mortgage exposures in Taiwan, and the increase in fair value hedges largely reflected the growth of fixed deposits and bonds in Hong Kong. Currency swaps for fair value hedging increased primarily to hedge the increased level of Medium term note issuances in the UK. Forward Foreign exchange contracts held for cash flow hedges increased as we switched from using foreign exchange options to hedge costs.
We may also, under certain individually approved circumstances, enter into economic hedges that do not qualify for IAS 39 hedge accounting treatment, and which are accordingly marked to market through the profit and loss account, thereby creating an accounting asymmetry. These are entered into primarily to ensure that residual interest rate and foreign exchange risks are being effectively managed.
Liquidity risk
Liquidity risk is the risk that we either do not have sufficient financial resources available to meet our obligations as they fall due, or can only access these financial resources at excessive cost.
It is our policy to maintain adequate liquidity at all times, in all geographic locations and for all currencies, and hence to be in a position to meet obligations as they fall due. We manage liquidity risk both on a short-term and medium-term basis. In the short-term, our focus is on ensuring that the cash flow demands can be met through asset maturities, customer deposits and wholesale funding where required. In the medium-term, the focus is on ensuring the balance sheet remains structurally sound and aligned to our strategy.
The GALCO is the responsible governing body that approves our liquidity management policies. The Liquidity Management Committee (LMC) receives authority from the GALCO and is responsible for setting or delegating authority to set liquidity limits and proposing liquidity risk policies. Liquidity in each country is managed by the Country ALCO within the pre-defined liquidity limits set by the LMC and in compliance with Group liquidity policies and practices and local regulatory requirements. GMR and Group Treasury propose and oversee the implementation of policies and other controls relating to the above risks.

Standard Chartered PLC – Risk review continued
48
We seek to manage our liquidity prudently in all geographical locations and for all currencies. Exceptional market events can impact us adversely, thereby affecting our ability to fulfill our obligations as they fall due. The principal uncertainties for liquidity risk are that customers withdraw their deposits at a substantially faster rate than expected, or that asset repayments are not received on the intended maturity date. To mitigate these uncertainties, our customer deposit base is diversified by type and maturity. In addition we have contingency funding plans including a portfolio of liquid assets that can be realised if a liquidity stress occurs, as well as ready access to wholesale funds under normal market conditions.
Policies and procedures Our policy is to manage liquidity, in-country without presumption of Group support. Each ALCO is responsible for ensuring that the country is able to meet all its obligations to make payments as they fall due, and operates within the local regulations and liquidity limits set for the country.
Our liquidity risk management framework requires limits to be set for prudent liquidity management. There are limits on:
• The local and foreign currency cash flow gaps
• The level of wholesale borrowing to ensure that the size of this funding is proportionate to the local market and our local operations
• Commitments, both on and off balance sheet, to ensure there are sufficient funds available in the event of drawdown on these commitments
• The advances to deposits ratio to ensure that commercial advances are funded by stable sources and that customer lending is funded by customer deposits
• The amount of assets that may be funded from other currencies
• The amount of local currency funding sourced from foreign currency sources
In addition, we prescribe a liquidity stress scenario that includes accelerated withdrawal of deposits over a period of time. Each country has to ensure that cash inflows exceed outflows under such a scenario.
All limits are reviewed at least annually, and more frequently if required, to ensure that they remain relevant given market conditions and business strategy. Compliance with limits is monitored independently on a regular basis by GMR and Finance. Limit excesses are escalated and approved under a delegated authority structure and reviewed by ALCO. Excesses are also reported monthly to the LMC and GALCO which provide further oversight.
We have significant levels of marketable securities, including government securities which can be realised, repo’d or used as collateral in the event that there is a need for liquidity in a crisis. In addition, liquidity crisis management plans are maintained by Group and within each country, and are reviewed and approved annually. The liquidity crisis management plan lays out trigger points and actions in the event of a liquidity crisis to ensure that there is an effective response by senior management.
Primary sources of funding A substantial portion of our assets is funded by customer deposits made up of current and savings accounts and other deposits. These customer deposits, which are widely diversified by type and maturity, represent a stable source of funds. The ALCO in each country monitors trends in the balance sheet and ensures that any concerns that might impact the stability of these deposits are addressed effectively. The ALCO also reviews balance sheet plans to ensure that projected asset growth is matched by growth in the stable funding base.
We maintain access to the interbank wholesale funding markets in all major financial centres and countries in which we operate as well as commercial paper issuance. This seeks to ensure that we have flexibility around maturity transformation, have market intelligence, maintain stable funding lines and can obtain optimal pricing when we perform our interest rate risk management activities.
Liquidity metrics We also monitor key liquidity metrics on a regular basis both on a country basis and in aggregate across the Group. The key metrics are:
Advances to deposits ratio This is defined as the ratio of total loans and advances to customers relative to total customer deposits. A low advances to deposits ratio demonstrates that customer deposits exceed customer loans resulting from emphasis placed on generating a high level of stable funding from customers.
30.06.11 $million
30.06.10$million
31.12.10 $million
Loans and advances to customers1 267,791 219,355 246,404Customer accounts2 342,690 287,740 316,502 % % %
Advances to deposits ratio 78.1 76.2 77.91 see note 16 on page 86. 2 see note 21 on page 91.
Liquid asset ratio This is the ratio of liquid assets to total assets. The significant level of holdings of liquid assets in the balance sheet reflects the application of our liquidity policies and practices. The following table shows the ratio of liquid assets to total assets:
30.06.11
%30.06.10
%31.12.10
%
Liquid assets1 to total assets ratio 26.5 27.2 26.61 Liquid assets are the total of Cash (less restricted balances), net unsecured
interbank, treasury bills and debt securities less illiquid securities.

Standard Chartered PLC – Risk review continued
49
Liquidity analysis of the Group's balance sheet
This table analyses assets and liabilities into relevant maturity groupings based on the remaining period to the contractual maturity date as at the balance sheet date, on a discounted basis. Contractual maturities do not necessarily reflect actual repayments or cash flow. Within the tables below cash and balances with central banks, loans and advances to banks, treasury bills and debt securities classified as trading, held at fair value or available for sale included within investment securities are used by the Group principally for liquidity management purposes.
30.06.11
Three months or less
Betweenthree
months and one year
Between one year
and five years
More than five years Total
$million $million $million $million $million
Assets Cash and balances at central banks 33,795 - - 9,894 43,689 Derivative financial instruments 9,882 14,447 23,336 3,169 50,834 Loans and advances to banks1 37,952 16,257 2,217 1,325 57,751 Loans and advances to customers1 84,602 44,401 60,916 77,872 267,791 Investment securities1 25,022 32,857 31,541 13,226 102,646 Other assets 15,848 2,846 62 26,239 44,995
Total assets 207,101 110,808 118,072 131,725 567,706 Liabilities Deposits by banks1 33,927 2,286 568 283 37,064 Customer accounts1 281,190 45,237 11,383 4,880 342,690 Derivative financial instruments 9,679 13,715 23,078 3,165 49,637 Debt securities in issue1 15,941 8,938 15,863 2,503 43,245 Other liabilities1 19,035 2,074 972 15,424 37,505 Subordinated liabilities and other borrowed funds 19 377 279 15,329 16,004
Total liabilities 359,791 72,627 52,143 41,584 526,145
Net liquidity gap (152,690) 38,181 65,929 90,141 41,561
1 Amounts include financial instruments held at fair value through profit or loss (see note 12).
30.06.10
Three months or less
Between three
months and one year
Between one year
and five years
More than five years Total
$million $million $million $million $million
Assets Cash and balances at central banks 23,761 - - 5,933 29,694 Derivative financial instruments 7,694 9,654 19,117 8,090 44,555 Loans and advances to banks1 37,843 9,903 2,124 531 50,401 Loans and advances to customers1 65,976 33,520 53,682 66,177 219,355 Investment securities1 20,303 32,614 31,283 11,513 95,713 Other assets 23,947 14,175 42 2,945 41,109
Total assets 179,524 99,866 106,248 95,189 480,827 Liabilities Deposits by banks1 27,970 3,490 817 130 32,407 Customer accounts1 246,863 30,290 8,806 1,781 287,740 Derivative financial instruments 8,263 8,907 18,469 7,786 43,425 Debt securities in issue1 13,683 8,430 13,084 1,415 36,612 Other liabilities1 19,593 1,438 1,121 12,883 35,035 Subordinated liabilities and other borrowed funds - 6 1,154 14,395 15,555
Total liabilities 316,372 52,561 43,451 38,390 450,774
Net liquidity gap (136,848) 47,305 62,797 56,799 30,053
1 Amounts include financial instruments held at fair value through profit or loss (see note 12).

Standard Chartered PLC – Risk review continued
50
Liquidity analysis of the Group’s balance sheet continued
31.12.10
Three months or less
Between three
months and one year
Between one year
and five years
More than five years Total
$million $million $million $million $million
Assets Cash and balances at central banks 25,339 - - 7,385 32,724 Derivative financial instruments 9,204 12,182 19,596 6,877 47,859 Loans and advances to banks1 39,800 10,715 2,391 358 53,264 Loans and advances to customers1 81,268 35,921 55,450 73,765 246,404 Investment securities1 20,269 32,564 29,091 13,641 95,565 Other assets2 13,831 5,839 65 21,009 40,744
Total assets 189,711 97,221 106,593 123,035 516,560 Liabilities Deposits by banks1 26,565 2,258 498 153 29,474 Customer accounts1 269,213 37,464 6,943 2,882 316,502 Derivative financial instruments 9,159 11,887 19,606 6,481 47,133 Debt securities in issue1 10,817 9,052 13,691 1,131 34,691 Other liabilities1,2 16,153 2,602 911 14,290 33,956 Subordinated liabilities and other borrowed funds 5 290 918 14,726 15,939
Total liabilities 331,912 63,553 42,567 39,663 477,695
Net liquidity gap (142,201) 33,668 64,026 83,372 38,865
1 Amounts include financial instruments held at fair value through profit or loss (see note 12). 2 Amounts have been restated as explained in note 32.

Standard Chartered PLC – Risk review continued
51
Behavioural maturity of financial liabilities As discussed on pages 47 to 48 the Group seeks to manage its liabilities both on a contractual and behavioural basis primarily by matching the maturity profiles of assets and liabilities. The cash flows presented on pages 49 to 50 reflect the cash flows that will be contractually payable over the residual maturity of the instruments. In practice, however, certain liability instruments behave differently from their contractual terms and typically, for short term customer accounts, extend to a longer period than their contractual maturity. The Group’s expectation of when such liabilities are likely to become payable is provided in the table below:
30.06.11
Three months or less
Between three months
and one year
Between one year
and five years
More than five years Total
$million $million $million $million $million
Deposits by banks 33,093 2,906 757 308 37,064
Customer accounts 141,299 52,905 117,910 30,576 342,690
Total 174,392 55,811 118,667 30,884 379,754
30.06.10
Three months or less
Between three months
and one year
Between one year
and five years
More than five years Total
$million $million $million $million $million
Deposits by banks 28,348 3,796 78 185 32,407
Customer accounts 131,712 55,591 77,189 23,248 287,740
Total 160,060 59,387 77,267 23,433 320,147
31.12.10
Three months or less
Between three months
and one year
Between one year
and five years
More than five years Total
$million $million $million $million $million
Deposits by banks 25,306 3,124 892 152 29,474
Customer accounts 130,275 49,199 113,105 23,923 316,502
Total 155,581 52,323 113,997 24,075 345,976

Standard Chartered PLC – Risk review continued
52
Operational risk
Operational risk is the potential for loss arising from the failure of people, process or technology or the impact of external events. We seek to minimise our exposure to operational risk, subject to cost trade-offs. Operational risk exposures are managed through a consistent set of management processes that drive risk identification, assessment, control and monitoring.
The Group Operational Risk Committee oversees the management of operational risks across the Group, supported by business, functional, and country-level committees. This formal structure of governance provides the GRC with confidence that operational risks are being proactively identified and effectively managed.
Group Operational Risk is responsible for setting and maintaining standards for operational risk management and measurement. In addition specialist operational risk control owners have responsibility for the management of operational risk arising from the following activities Group-wide: legal processes, people management, technology management, vendor management, property management, security management, accounting and financial control, tax management, corporate authorities and structure and regulatory compliance. (See additional information relating to regulatory compliance under “Regulatory changes and compliance” on page 21.)
Each risk control owner is responsible for identifying risks that are material to the Group and for maintaining an effective control environment, which includes defining appropriate policies and procedures for approval by authorised risk committees.
Reputational risk
Reputational risk is the potential for damage to our franchise, resulting in loss of earnings or adverse impact on market capitalisation as a result of stakeholders taking a negative view of the organisation or its actions.
Reputational risk will arise from the failure to effectively mitigate one or more of country, credit, liquidity, market, regulatory, operational, environmental or social risk. All employees are responsible for day to day identification and management of reputational risk.
The Wholesale Banking Responsibility and Reputational Risk Committee and the Consumer Banking Reputational Risk Committee have responsibility for managing reputational risk in their respective businesses, while the GRC provides Group-wide oversight, sets policy and monitors any material risks.
The BRC and BVC provide additional oversight of reputational risk on behalf of the Board.
At country level, the Head of Corporate Affairs is the risk control owner and it is their responsibility to protect our reputation in that market with the support of the country management team. To achieve this, the Head of Corporate Affairs and Country Chief Executive Officer must actively:
• Promote awareness and application of our policy and procedures regarding reputational risk
• Encourage business and functions to take account of our reputation in all decision-making, including dealings with customers and suppliers
• Implement effective in-country reporting systems to ensure they are aware of all potential issues in tandem with respective business committees
• Promote effective, proactive stakeholder management through ongoing engagement.
Pension risk
Pension risk is the potential for loss due to having to meet an actuarially assessed shortfall in the Group’s pension schemes. Pension risk exposure is not concerned with the financial performance of our pension schemes but is focused upon the risk to our financial position arising from our need to meet our pension scheme funding obligations. The risk assessment is focused on our obligations towards our major pension schemes, ensuring that our funding obligation to these schemes is comfortably within our financial capacity. Pension risk is monitored on a quarterly basis, taking account of the actual variations in asset values and updated expectations regarding the progression of the pension fund assets and liabilities.
The PEC is the body responsible for governance of pension risk and it receives its authority directly from the Court.

Standard Chartered PLC – Capital
53
Capital management
Our approach to capital management is driven by our desire to maintain a strong capital base to support the development of our business, to meet regulatory capital requirements at all times and to maintain good credit ratings.
Strategic, business and capital plans are drawn up annually covering a three year horizon and are approved by the Board. The capital plan ensures that adequate levels of capital and an optimum mix of the different components of capital are maintained to support our strategy.
The capital plan takes the following into account:
• current regulatory capital requirements and our assessment of future standards
• demand for capital due to business growth forecasts, loan impairment outlook and market shocks or stresses
• forecast demand for capital to support credit ratings and as a signaling tool to the market
• available supply of capital and capital raising options
We use a capital model to assess the capital demand for material risks, and support our internal capital adequacy assessment. Each material risk is assessed, relevant mitigants considered, and appropriate levels of capital determined. The capital modelling process is a key part of our management disciplines.
A strong governance and process framework is embedded in our capital planning and assessment methodology. Overall responsibility for the effective management of risk rests with the Board. The Board Risk Committee reviews specific risk areas and the issues discussed at the key capital management committees. The Group Asset and Liability Committee (GALCO) sets internal triggers and target ranges for capital management and oversees adherence with these.
Current compliance with Capital Adequacy Regulations Our lead supervisor is the UK’s Financial Services Authority (FSA). The capital that we are required to hold by the FSA is determined by our balance sheet, off-balance sheet, counterparty and other risk exposures. Further detail on counterparty and risk exposures is included in the Risk review on pages 20 to 52.
Capital in branches and subsidiaries is maintained on the basis of host regulators’ requirements. Suitable processes and controls are in place to monitor and manage capital adequacy and ensure compliance with local regulatory ratios in all our legal entities. These processes are designed to ensure that we have sufficient capital available to meet local regulatory capital requirements at all times.
The table on page 54 summarises the consolidated capital position of the Group. The principal forms of capital are included in the following items on the consolidated balance sheet: share capital and reserves (called-up ordinary share capital, preference shares, and eligible reserves), subordinated liabilities (innovative Tier 1 securities and qualifying subordinated liabilities), and loans to banks and customers (portfolio impairment provision).
Movement in capital On a Basel II basis, Core Tier 1 capital has increased by $10,140 million since 30 June 2010 and by $2,198 million since 31 December 2010. Comprehensive income attributable to ordinary shareholders was $3.2 billion which was offset by the payment of $544 million for the final 2010 dividend (less scrip) and an increase in goodwill and intangibles of $399 million.
Non-Core Tier 1 capital increased by $52 million since 30 June 2010 (mostly due to increased innovate Tier 1 securities) and decreased by $50 million since 31 December 2010 (due to increased material holdings deductions). Tier 2 capital increased by $545 million since 30 June 2010 (due to increased subordinated debt) and decreased by $175 million since 31 December 2010 (largely due to increased material holdings deductions).
Basel II The Group complies with the Basel II framework, which has been implemented in the UK through the FSA’s general prudential sourcebook and its prudential sourcebook for Banks, Building Societies and Investment Firms.
From 1 January 2008, we have been using the Advanced Internal Ratings Based approach for the measurement of credit risk capital. This approach builds on our risk management practices and is the result of a significant investment in data warehousing and risk models.
We use Value at Risk (VaR) models for the measurement of market risk capital for part of our trading book exposures where permission to use such models has been granted by the FSA. Where our market risk exposures are not approved for inclusion in VaR models, the capital requirements are determined using standard rules provided by the regulator.
We apply the Standardised Approach for determining the capital requirements for operational risk.
Basel III The Basel III rules text published in December 2010 by the Basel Committee on Banking Supervision (the BCBS) serves to bring together the details of global regulatory standards on bank capital adequacy and liquidity. While these give us greater clarity on the global regulatory standards and the various timelines for transition, some proposals are yet to be finalised, in particular the capital requirements for global systemically important banks.
The Group estimates that the impact of adjustments to risk-weighted assets and regulatory capital under both the proposed amendments to Basel II and the introduction of Basel III will reduce the Group’s future Core Tier 1 capital ratio by approximately 100 to 110 basis points. The actual outcome will depend on how the emerging rules are implemented, what the future shape of the Group is and the extent to which the Group’s regulators give recognition to its schedule of model-based calculation of risk weighted assets (RWA).
In setting global regulatory standards, the BCBS has left significant discretion to individual regulators on the exact interpretation and implementation of Basel III and other proposed changes. At present, there remains significant uncertainty as to how the EU, the FSA, as the Group’s lead regulator, and various other regulators in our key markets will seek to interpret and apply these arrangements. The Group believes, as it did at the rights issue in October 2010, that it is prudent to assume the imposition of an accelerated timetable for the adoption of the new Basel III framework and that certain regulators are likely to take a conservative approach to the implementation of new capital buffers, resulting in higher effective minimum capital requirements than have yet been announced.

Standard Chartered PLC – Capital continued
54
The GALCO targets Tier 1 and total capital ratios within a range of 7 to 9 per cent and 12 to 14 per cent respectively. In light of the uncertain economic environment and evolving regulatory debate on banks' capital structures, we continue to believe it is appropriate to remain strongly capitalised above our target ranges.
30.06.11 30.06.10 31.12.10 3
$million $million $million
Tier 1 capital: Called-up ordinary share capital 1,190 1,037 1,174
Eligible reserves1 37,968 26,828 35,270
Non-controlling interests 309 274 332
Less: excess expected losses2 (749) (590) (664)
Less: securitisation (113) (138) (132)
Goodwill and other intangible assets (7,397) (6,513) (6,998)
Other regulatory adjustments (88) 82 (60)
Core Tier 1 capital 31,120 20,980 28,922
Innovative Tier 1 securities 2,856 2,790 2,828
Preference shares 2,694 2,674 2,686
Tax on excess expected losses1 213 177 185
Less: material holdings (440) (370) (326)
Total Tier 1 capital 36,443 26,251 34,295
Tier 2 capital: Eligible revaluation reserves 530 293 530
Portfolio impairment provision 255 258 266
Less: excess expected losses2 (749) (590) (664)
Qualifying subordinated liabilities: Perpetual subordinated debt 1,527 1,447 1,494
Other eligible subordinated debt 9,585 9,150 9,602
Less: material holdings and securitisations (553) (508) (458)
Total Tier 2 capital 10,595 10,050 10,770
Deductions from Tier 1 and Tier 2 capital (4) (55) (3)
Total capital base 47,034 36,246 45,062
Risk weighted assets Credit risk 214,153 190,001 202,333
Operational risk 28,762 26,972 26,972
Market risk 19,374 17,211 15,772
Total risk weighted assets 262,289 234,184 245,077
Capital ratios Core Tier 1 capital 11.9% 9.0% 11.8%
Tier 1 capital 13.9% 11.2% 14.0%
Total capital ratio 17.9% 15.5% 18.4%
1 The tax benefit on excess expected losses is included 50 per cent in eligible reserves and 50 per cent in tax on excess expected losses. 2 Excess expected losses are shown gross of any tax benefit. 3 Amounts have been restated as explained in note 32.

Standard Chartered PLC – Capital continued
55
Risk weighted assets
30.06.11 30.06.10 31.12.10
$million $million $million
Consumer Banking 73,329 59,547 67,551 Wholesale Banking 188,960 174,637 177,526
Total risk weighted assets 262,289 234,184 245,077 Hong Kong 32,702 27,781 31,138 Singapore 33,529 25,135 29,294 Korea 26,884 26,421 25,707 Other Asia Pacific 51,530 45,976 46,896 India 21,108 19,615 19,247 Middle East & Other S Asia 35,560 31,828 32,952 Africa 11,990 10,245 11,220 Americas, UK & Europe 54,880 53,827 55,505
268,183 240,828 251,959 Less : Intra-group balances1 (5,894) (6,644) (6,882)
Total risk weighted assets 262,289 234,184 245,077
1 Intra-group balances are netted in calculating capital ratios.
Risk weighted contingent liabilities and commitments2
30.06.11 30.06.10 31.12.10
$million
$million $million
Contingent liabilities 14,951
14,555 15,266
Commitments 10,560
9,128 10,394
2 Includes amounts relating to the Group share of joint ventures.
Risk weighted assets (RWA) increased by $17.2 billion or 7 per cent compared to December 2010, with an increase in Wholesale Banking and Consumer Banking of $11.4 billion and $5.8 billion respectively. Wholesale Banking RWA growth was concentrated in Other Asia Pacific, Hong Kong and Korea. Consumer Banking RWA growth was mainly in Singapore, Korea, Other Asia Pacific and Hong Kong.
Wholesale Banking credit risk RWA increase of $6.1 billion is driven by good levels of asset growth of $14.1 billion across Americas, UK and Europe, Singapore, Korea and Other Asia Pacific offset by RWA efficiencies of $7.6 billion due to higher collateral recoveries. Credit migration was $0.4 billion.
The growth in Consumer Banking credit risk RWA, of $5.5 billion primarily arose from strong growth in retail unsecured $0.7 billion, SME $1.3 billion and Wealth Management $0.6 billion and $0.8 billion favourable foreign exchange movement. The acquisition of GE Money in Singapore increased RWA by $1.2 billion.
The FSA has granted the Group CAD2 internal model approval covering the majority of interest rate, foreign exchange risk, energy and agricultural trading, as well as market risk arising from precious and base metals trading. Positions outside the CAD2 scope are assessed according to standard FSA rules.
At 30 June 2011 our market risk RWA was $19.4 billion (30 June 2010: $17.2 billion, 31 December 2010: $15.8 billion). The increase is primarily driven by the expansion of Equity derivatives ($2.3 billion) and continued growth in hedging solutions offered to clients in Commodities ($0.8 billion) and Fixed Income ($0.4 billion). Of the total market risk RWA, 19 per cent is CAD2 internal model and 81 per cent is standard rules.
Operational risk RWA increased by $1.8 billion, or 7 per cent. Given that this is primarily determined by the change in income over a rolling three year time horizon, the growth reflects the strong performance of the Group over that period.

Standard Chartered PLC
Condensed consolidated interim income statement For the six months ended 30 June 2011
56
6 months ended 6 months ended 6 months ended
Notes
30.06.11 30.06.10 31.12.10
$million $million $million
Interest income 7,886 6,462 7,038
Interest expense (2,945) (2,307) (2,723)
Net interest income 4,941 4,155 4,315
Fees and commission income 2,401 2,288 2,268 Fees and commission expense (222) (140) (178)Net trading income 3 1,366 1,351 1,226 Other operating income 4 278 270 507
Non-interest income 3,823 3,769 3,823
Operating income 8,764 7,924 8,138
Staff costs 5 (3,224) (2,808) (2,957)Premises costs (422) (381) (419)General administrative expenses (731) (884) (1,015)Depreciation and amortisation 6 (300) (271) (288)
Operating expenses (4,677) (4,344) (4,679)
Operating profit before impairment losses and taxation 4,087 3,580 3,459
Impairment losses on loans and advances and other credit risk provisions 7 (412) (437) (446)
Other impairment 8 (72) (50) (26)
Profit from associates 33 23 19
Profit before taxation 3,636 3,116 3,006
Taxation 9 (1,032) (935) (773)
Profit for the period 2,604 2,181 2,233
Profit attributable to: Non-controlling interests 27 38 33 49
Parent company shareholders 2,566 2,148 2,184
Profit for the period 2,604 2,181 2,233
cents cents cents
Earnings per share: Basic earnings per ordinary share 11 107.0 99.61 96.8
Diluted earnings per ordinary share 11 105.6 98.21 94.8
Dividends per ordinary share:
Interim dividend declared 10 24.75 - -
Interim dividend paid 10 - 22.501 -
Final dividend paid 10 - - 46.65
$million $million $million
Total dividend:
Total interim dividend payable2 586 - -
Total interim dividend (paid 5 October 2010) - 481 -
Total final dividend (paid 11 May 2011) - - 1,089
1 Amounts have been restated as explained in note 32. 2 Dividend declared/payable represents the interim dividend as declared by the Board of Directors on 3 August 2011 and is expected to be paid on 7 October
2011. This dividend does not represent a liability to the Group at 30 June 2011 and is a non-adjusting event as defined by IAS 10 ‘Events after the reporting period’.

Standard Chartered PLC
Condensed consolidated interim statement of comprehensive income For the six months ended 30 June 2011
57
6 months ended 6 months ended 6 months ended
30.06.11 30.06.10 31.12.10
Notes $million $million $million
Profit for the period 2,604 2,181 2,233 Other comprehensive income:
Exchange differences on translation of foreign operations: Net gains/(losses) taken to equity 643 (296) 1,138 Net (losses)/gains on net investment hedges (69) 5 (82) Reclassified to income statement on change of control - - 4 Actuarial gains/(losses) on retirement benefit obligations 25 41 (42) 125
Share of other comprehensive income from associates - (3) (2)Available-for-sale investments: Net valuation gains taken to equity 77 479 307 Reclassified to income (60) (73) (211)Cash flow hedges: Net gains/(losses) taken to equity 96 (36) 78 Reclassified to income (53) 36 (19)Taxation relating to components of other comprehensive income (47) (94) (7)
Other comprehensive income for the period, net of taxation 628 (24) 1,331
Total comprehensive income for the period 3,232 2,157 3,564 Total comprehensive income attributable to: Non-controlling interests 27 24 48 64 Parent company shareholders 3,208 2,109 3,500
3,232 2,157 3,564

Standard Chartered PLC
Condensed consolidated interim balance sheet As at 30 June 2011
58
Notes
30.06.11 30.06.10 31.12.10
$million $million $million Assets Cash and balances at central banks 12, 29 43,689 29,694 32,724 Financial assets held at fair value through profit or loss 12, 13 27,401 24,287 27,021 Derivative financial instruments 12, 14 50,834 44,555 47,859 Loans and advances to banks 12, 15 57,317 49,390 52,058 Loans and advances to customers 12, 16 262,126 215,005 240,358 Investment securities 12, 17 81,344 76,787 75,796 Other assets 12, 18 28,791 24,771 25,356 Current tax assets 227 159 179 Prepayments and accrued income 2,154 4,072 2,127 Interests in associates 857 620 631 Goodwill and intangible assets 7,397 6,513 6,998 1
Property, plant and equipment 4,714 3,971 4,507 Deferred tax assets 855 1,003 946 Total assets 567,706 480,827 516,560 Liabilities Deposits by banks 12, 20 36,334 31,903 28,551 Customer accounts 12, 21 333,485 279,089 306,992 Financial liabilities held at fair value through profit or loss 12, 13 20,326 18,380 20,288 Derivative financial instruments 12, 14 49,637 43,425 47,133 Debt securities in issue 12, 22 38,640 33,364 31,381 Other liabilities 12, 23 25,983 23,716 21,094 Current tax liabilities 1,162 897 981 Accruals and deferred income 3,936 3,572 4,528 Subordinated liabilities and other borrowed funds 12, 24 16,004 15,555 15,939 Deferred tax liabilities 150 179 183 1
Provisions for liabilities and charges 176 224 315 Retirement benefit obligations 25 312 470 310 Total liabilities 526,145 450,774 477,695 Equity Share capital 26 1,190 1,037 1,174 Reserves 39,743 28,421 37,038 Total parent company shareholders’ equity 40,933 29,458 38,212 Non-controlling interests 27 628 595 653 Total equity 41,561 30,053 38,865 Total equity and liabilities 567,706 480,827 516,560
1 Amounts have been restated as explained in note 32.

Standard Chartered PLC
Condensed consolidated interim statement of changes in equity For the six months ended 30 June 2011
59
Share capital
Share premium account
Capitaland capital redemption
reserve1 Merger reserve
Available-for-sale reserve
Cash flow hedge
reserveTranslation
reserveRetained earnings
Parent company
shareholders equity
Non-controlling
interests Total
$million $million $million $million $million $million $million $million $million $million $million
At 1 January 2010 1,013 4,828 18 7,284 (93) 15 (1,185) 15,460 27,340 580 27,920
Profit for the period - - - - - - - 2,148 2,148 33 2,181
Other comprehensive income - - - - 287 (1) (288) (37)2 (39) 15 (24)
Distributions - - - - - - - - - (32) (32)
Shares issued, net of expenses 15 519 - - - - - - 534 - 534
Net own shares adjustment - - - - - - - (163) (163) - (163)
Share option expense, net of taxation - - - - - - - 115 115 - 115
Capitalised on scrip dividend 9 (9) - - - - - - - - -
Dividends, net of scrip - - - - - - - (477) (477) - (477)
Other decreases - - - - - - - - - (1) (1)
At 30 June 2010 1,037 5,338 18 7,284 194 14 (1,473) 17,046 29,458 595 30,053
Profit for the period - - - - - - - 2,184 2,184 49 2,233
Other comprehensive income - - - - 114 43 1,061 98 2 1,316 15 1,331
Distributions - - - - - - - - - (22) (22)
Shares issued, net of expenses 132 53 - 5,137 - - - - 5,322 - 5,322
Net own shares adjustment - - - - - - - 28 28 - 28
Share option expense, net of taxation - - - - - - - 181 181 - 181
Capitalised on scrip dividend 5 (5) - - - - - - - - -
Dividends, net of scrip - - - - - - - (268) (268) - (268)
Other increases - - - - - - - (9) (9) 16 7
At 31 December 2010 1,174 5,386 18 12,421 308 57 (412) 19,260 38,212 653 38,865
Profit for the period - - - - - - - 2,566 2,566 38 2,604
Other comprehensive income - - - - 4 29 581 28 2 642 (14) 628
Distributions - - - - - - - - - (45) (45)
Shares issued, net of expenses 4 21 - - - - - - 25 - 25
Net own shares adjustment - - - - - - - (106) (106) - (106)
Share option expense, net of taxation - - - - - - - 138 138 - 138
Capitalised on scrip dividend 12 (12) - - - - - - - - -
Dividends, net of scrip - - - - - - - (544) (544) - (544)
Other decreases - - - - - - - - - (4) (4)
At 30 June 2011 1,190 5,395 18 12,421 312 86 169 21,342 40,933 628 41,561 1 Includes capital reserve of $5 million and capital redemption reserve of $13 million. 2 For the period ended 30 June 2011, comprises actuarial gains, net of taxation and non-controlling interests of $28 million (30 June 2010: losses of $(34)
million and 31 December 2010: gains of $100 million) and share of comprehensive losses from associates of $nil million (30 June 2010: $(3) million and 31 December 2010: $(2) million).

Standard Chartered PLC
Condensed consolidated interim cash flow statement For the six months ended 30 June 2011
60
6 months ended 6 months ended 6 months ended
Notes
30.06.11 30.06.10 1 31.12.10 1
$million $million $million
Cash flows from operating activities Profit before taxation 3,636 3,116 3,006
Adjustments for: Non-cash items and other adjustments included within income statement 28 982 965 909
Change in operating assets 28 (31,620) (57,979) (24,373)
Change in operating liabilities 28 33,336 44,849 14,443
Contributions to defined benefit schemes (17) (75) (75)
UK and overseas taxes paid, net of refund (823) (798) (623)
Net cash from/(used in) operating activities 5,494 (9,922) (6,713)
Net cash flows from investing activities Purchase of property, plant and equipment (249) (159) (211)
Disposal of property, plant and equipment 76 121 62
Acquisition of investment in subsidiaries and associates, net of cash acquired (889) (228) (317)
Purchase of investment securities (63,346) (56,589) (57,487)
Disposal and maturity of investment securities 59,490 55,295 61,363
Dividends received from investment in associates 5 9 13
Net cash (used in)/from investing activities (4,913) (1,551) 3,423
Net cash flows from financing activities Issue of ordinary and preference share capital, net of expenses 25 534 5,322
Purchase of own shares (146) (178) (4)2
Exercise of share options through ESOP 40 15 32
Interest paid on subordinated liabilities (538) (561) (212)
Gross proceeds from issue of subordinated liabilities 96 750 20
Repayment of subordinated liabilities (513) (1,534) (15)
Interest paid on senior debts (302) (569) (387)
Gross proceeds from issue of senior debts 7,171 6,784 7,069
Repayment of senior debts (3,244) (5,094) (6,052)
Dividends paid to non-controlling interests and preference shareholders, net of scrip (95) (82) (73)
Dividends paid to ordinary shareholders, net of scrip (494) (427) (217)
Net cash from/(used in) financing activities 2,000 (362) 5,483
Net increase/(decrease) in cash and cash equivalents 2,581 (11,835) 2,193
Cash and cash equivalents at beginning of the period 59,734 68,073 56,168
Effect of exchange rate movements on cash and cash equivalents 1,079 (70) 1,373
Cash and cash equivalents at end of the period 29 63,394 56,168 59,734
1 Amounts have been restated as explained in note 32. 2 Net of proceeds from sale of rights by the trusts

Standard Chartered PLC – Notes
61
1. Basis of preparation The Group condensed consolidated interim financial statements consolidate those of Standard Chartered PLC (the Company) and its subsidiaries (together referred to as the Group), equity account the Group’s interest in associates and proportionately consolidate interest in jointly controlled entities.
These interim financial statements have been prepared in accordance with the Disclosure and Transparency Rules of the FSA and with IAS 34 ‘Interim Financial Reporting’ as adopted by the European Union (EU). They do not include all of the information required for full annual financial statements, and should be read in conjunction with the consolidated financial statements of the Group as at, and for, the year ended 31 December 2010, which were prepared in accordance with International Financial Reporting Standards (IFRS) and IFRS Interpretations Committee (IFRIC) interpretations as adopted by the EU.
The following parts of the Risk review form part of these interim financial statements: from the start of the “Risk management” section on page 22 to the end of the “Operational risk” section on page 52, with the exception of the “Asset backed securities” section on pages 41 and 42.
These interim financial statements were approved by the Board of Directors on 3 August 2011.
Except as noted below, the accounting policies applied by the Group in these interim financial statements are the same as those applied by the Group in its consolidated financial statements as at, and for, the year ended 31 December 2010.
On 1 January 2011 the Group adopted retrospectively IAS 24 (revised) ‘Related Parties’. IAS 24 (revised) widens the scope of the definition of related parties to include an investor, its subsidiaries and associates as related parties to each other. These changes do not have an impact to the Group’s financial statements.
On 1 January 2011, the Group adopted improvements to IFRS (2010), a collection of amendments to a number of IFRSs. The amendments to IFRS 7, IAS 1, IAS 34 and IFRIC 13 were applied on a retrospective basis and amendments to IFRS 3 were applied on a prospective basis. None of these amendments had a material impact on the Group’s interim financial statements.
The preparation of interim financial statements requires management to make judgements, estimates and assumptions that affect the application of accounting policies and the reported amounts of assets and liabilities, income and expense. Actual results may differ from these estimates. The significant judgements made by management in applying the Group’s accounting policies and key sources of uncertainty were the same as those applied to the consolidated financial statements as at, and for, the year ended 31 December 2010.
A summary of the Group’s significant accounting policies will be included in the 2011 Annual Report and Accounts.

Standard Chartered PLC – Notes continued
62
2. Segmental Information
The Group is organised on a worldwide basis for management and reporting purposes into two main business segments: Consumer Banking and Wholesale Banking. The products offered by these segments are summarised under ‘Income by product’ below. The businesses’ focus is on broadening and deepening the relationship with customers, rather than maximising a particular product line. Hence the Group evaluates segmental performance based on overall profit or loss before taxation (excluding corporate items not allocated) and not individual product profitability. Product revenue information is used as a way of assessing customer needs and trends in the market place. The strategies adopted by Consumer Banking and Wholesale Banking need to be adapted to local market and regulatory requirements, which is the responsibility of country management teams. While not the primary driver of the business, country performance is an important part of the Group’s matrix structure and is also used to evaluate performance and reward staff. Corporate items not allocated are not aggregated into the businesses because of the one-off nature of these items.
The Group’s entity-wide disclosure comprises geographic areas, classified by the location of the customer, except for Financial Market products which are classified by the location of the dealer.
Transactions between the business segments and geographic areas are carried out on an arms length basis. Apart from the entities that have been acquired in the last two years, Group central expenses have been distributed between the business segments and geographic areas in proportion to their direct costs, and the benefit of the Group’s capital has been distributed between segments in proportion to their average risk weighted assets. In the year in which an acquisition is made, the Group does not charge or allocate the benefit of the Group’s capital. The distribution of central expenses is phased in over two years, based on the estimate of central management costs associated with the acquisition.
By class of business 30.06.11 30.06.10
Consumer Banking
Wholesale Banking
Total reportable segments
Corporate items not
allocated2 TotalConsumer
BankingWholesale
Banking
Total reportable segments
Corporate items not
allocated3 Total
$million $million $million $million $million $million $million $million $million $million
Internal income (6) 6 - - - (16) 16 - - - Net interest income 2,248 2,693 4,941 - 4,941 1,996 2,159 4,155 - 4,155 Non-interest income 1,095 2,728 3,823 - 3,823 932 2,837 3,769 - 3,769
Operating income 3,337 5,427 8,764 - 8,764 2,912 5,012 7,924 - 7,924 Operating expenses (2,109) (2,568) (4,677) - (4,677) (1,966) (2,357) (4,323) (21) (4,344)
Operating profit/(loss) before impairment losses and taxation 1,228 2,859 4,087 - 4,087 946 2,655 3,601 (21) 3,580
Impairment losses on loans and advances and other credit risk provisions (211) (201) (412) - (412) (299) (138) (437) - (437)Other impairment (4) (68) (72) - (72) (4) (46) (50) - (50)Profit from associates - - - 33 33 - - - 23 23
Profit before taxation 1,013 2,590 3,603 33 3,636 643 2,471 3,114 2 3,116
Total assets employed 136,775 428,992 565,767 1,939 567,706 110,921 368,124 479,045 1,782 480,827
Total liabilities employed 168,742 356,091 524,833 1,312 526,145 148,182 301,515 449,697 1,077 450,774
Other segment items: Capital expenditure1 97 412 509 - 509 108 130 238 - 238 Depreciation 93 83 176 - 176 73 85 158 - 158 Interests in associates - - - 857 857 - - - 620 620 Amortisation of intangible assets 33 91 124 - 124 33 80 113 - 113
1 Includes capital expenditure in Wholesale Banking of $148 million in respect of operating lease assets (30 June 2010: $nil million). 2 Relates to the Group’s share of profit from associates. 3 Relates to UK payroll tax and the Group’s share of profit from associates.
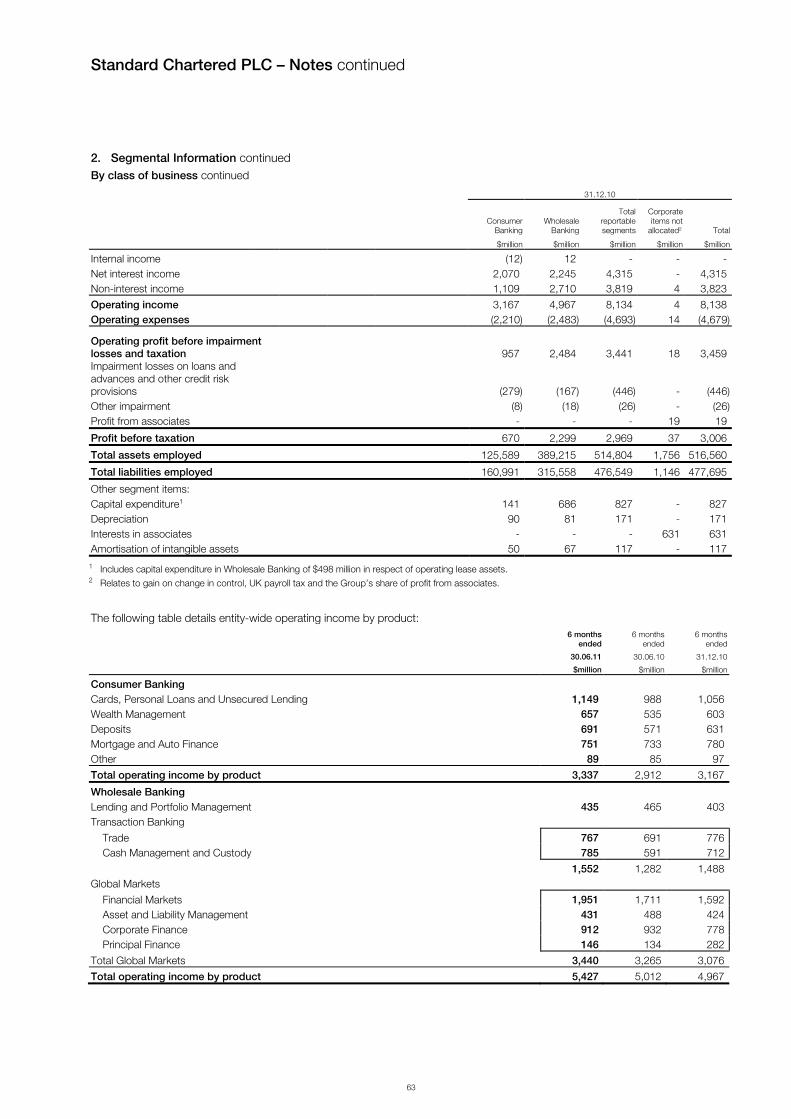
Standard Chartered PLC – Notes continued
63
2. Segmental Information continued By class of business continued
31.12.10
Consumer
BankingWholesale
Banking
Total reportable segments
Corporate items not
allocated2 Total
$million $million $million $million $million
Internal income (12) 12 - - - Net interest income 2,070 2,245 4,315 - 4,315 Non-interest income 1,109 2,710 3,819 4 3,823
Operating income 3,167 4,967 8,134 4 8,138 Operating expenses (2,210) (2,483) (4,693) 14 (4,679)
Operating profit before impairment losses and taxation 957 2,484 3,441 18 3,459 Impairment losses on loans and advances and other credit risk provisions (279) (167) (446) - (446)Other impairment (8) (18) (26) - (26)Profit from associates - - - 19 19
Profit before taxation 670 2,299 2,969 37 3,006
Total assets employed 125,589 389,215 514,804 1,756 516,560
Total liabilities employed 160,991 315,558 476,549 1,146 477,695
Other segment items: Capital expenditure1 141 686 827 - 827 Depreciation 90 81 171 - 171 Interests in associates - - - 631 631 Amortisation of intangible assets 50 67 117 - 117
1 Includes capital expenditure in Wholesale Banking of $498 million in respect of operating lease assets. 2 Relates to gain on change in control, UK payroll tax and the Group’s share of profit from associates.
The following table details entity-wide operating income by product:
6 months
ended 6 months
ended6 months
ended
30.06.11 30.06.10 31.12.10
$million $million $million
Consumer Banking Cards, Personal Loans and Unsecured Lending 1,149 988 1,056 Wealth Management 657 535 603 Deposits 691 571 631 Mortgage and Auto Finance 751 733 780 Other 89 85 97
Total operating income by product 3,337 2,912 3,167
Wholesale Banking Lending and Portfolio Management 435 465 403 Transaction Banking
Trade 767 691 776 Cash Management and Custody 785 591 712
1,552 1,282 1,488 Global Markets
Financial Markets 1,951 1,711 1,592 Asset and Liability Management 431 488 424 Corporate Finance 912 932 778 Principal Finance 146 134 282
Total Global Markets 3,440 3,265 3,076
Total operating income by product 5,427 5,012 4,967

Standard Chartered PLC – Notes continued
64
2. Segmental Information continued Entity-wide information
By geography
The Group manages its reportable business segments on a global basis. The operations are based in eight main geographic areas. The UK is the home country of the Company.
30.06.11
Asia Pacific
Hong Kong Singapore Korea
Other Asia
Pacific India
Middle East & Other
S Asia Africa
Americas UK &
Europe1 Total
$million $million $million $million $million $million $million $million $million
Internal income 13 (34) (29) 37 89 11 40 (127) - Net interest income 730 517 684 1,130 430 566 292 592 4,941 Fees and commissions income, net 421 303 115 365 207 226 201 341 2,179 Net trading income 331 255 37 159 139 304 118 23 1,366 Other operating income 36 53 33 57 28 11 27 33 278
Operating income 1,531 1,094 840 1,748 893 1,118 678 862 8,764 Operating expenses (684) (582) (564) (952) (390) (532) (367) (606) (4,677)Operating profit before impairment losses and taxation 847 512 276 796 503 586 311 256 4,087 Impairment losses on loans and advances and other credit risk provisions (57) (31) (81) (14) (72) (144) (7) (6) (412)Other impairment - (16) (2) 31 (53) (13) (13) (6) (72)Profit from associates - - - 33 - - - - 33
Profit before taxation 790 465 193 846 378 429 291 244 3,636
Capital expenditure2 134 96 10 33 36 10 9 181 509
1 Americas UK & Europe includes operating income of $428 million in respect of the UK, the Company’s country of domicile. 2 Includes capital expenditure in Americas, UK & Europe of $148 million in respect of operating lease assets. Other capital expenditure comprises additions to
property and equipment and software related intangibles including any post-acquisition additions made by the acquired entities.
30.06.10
Asia Pacific
Hong Kong Singapore Korea
Other Asia
Pacific India
Middle East & Other
S Asia Africa
Americas UK &
Europe1 Total
$million $million $million $million $million $million $million $million $million
Internal income 24 (68) (30) 32 187 (18) 39 (166) - Net interest income 580 446 583 867 401 579 251 448 4,155 Fees and commissions income, net 302 219 115 377 249 312 217 357 2,148 Net trading income 269 280 115 190 155 168 119 55 1,351 Other operating income 16 36 13 75 19 15 20 76 270
Operating income 1,191 913 796 1,541 1,011 1,056 646 770 7,924 Operating expenses (656) (477) (518) (895) (344) (515) (323) (616) (4,344)
Operating profit before impairment losses and taxation 535 436 278 646 667 541 323 154 3,580
Impairment losses on loans and advances and other credit risk provisions (25) (17) (129) (89) (43) (116) (7) (11) (437)Other impairment 1 - - (1) - (25) (5) (20) (50)Profit from associates - - - 23 - - - - 23
Profit before taxation 511 419 149 579 624 400 311 123 3,116
Capital expenditure 2 11 133 31 27 15 8 6 7 238
1 Americas UK & Europe includes operating income of $381 million in respect of the UK, the Company’s country of domicile. 2 Includes capital expenditure in Americas, UK & Europe of $nil million in respect of operating lease assets. Other capital expenditure comprises additions to
property and equipment and software related intangibles including any post-acquisition additions made by the acquired entities.

Standard Chartered PLC – Notes continued
65
2. Segmental Information continued
31.12.10
Asia Pacific
Hong Kong Singapore Korea
Other Asia
Pacific India
Middle East & Other
S Asia Africa
Americas UK &
Europe1 Total
$million $million $million $million $million $million $million $million $million
Internal income (19) 21 (19) 32 162 20 43 (240) - Net interest income 649 461 575 966 366 566 266 466 4,315 Fees and commissions income, net 398 181 118 360 215 277 142 399 2,090 Net trading income 252 87 178 150 112 175 144 128 1,226 Other operating income 29 75 50 116 162 73 5 (3) 507
Operating income 1,309 825 902 1,624 1,017 1,111 600 750 8,138 Operating expenses (699) (509) (562) (1,075) (405) (480) (330) (619) (4,679)
Operating profit before impairment losses and taxation 610 316 340 549 612 631 270 131 3,459
Impairment losses on loans and advances and other credit risk provisions (18) (16) (97) (63) (36) (186) (17) (13) (446)Other impairment - (1) (4) (1) (3) (4) (5) (8) (26)Profit from associates - - - 19 - - - - 19
Profit before taxation 592 299 239 504 573 441 248 110 3,006
Capital expenditure 2 12 153 29 47 23 10 51 502 827
1 Americas UK & Europe includes operating income of $358 million in respect of the UK, the Company’s country of domicile. 2 Includes capital expenditure in Americas, UK & Europe of $498 million in respect of operating lease assets. Other capital expenditure comprises additions to
property and equipment and software related intangibles including any post-acquisition additions made by the acquired entities.

Standard Chartered PLC – Notes continued
66
2. Segmental Information continued
Net interest margin and yield 6 months
ended 6 months
ended6 months
ended
30.06.11 30.06.10 31.12.10
$million $million $million
Net interest margin (%) 2.3 2.3 2.1 Net interest yield (%) 2.1 2.1 2.0 Average interest earning assets 434,492 363,886 401,427 Average interest bearing liabilities 396,116 325,820 368,223
Net interest margin by geography 30.06.11
Asia Pacific
Hong Kong Singapore Korea
Other Asia
Pacific India
Middle East & Other
S Asia Africa
Americas UK &
Europe1 Intra-group/
tax assets Total
$million $million $million $million $million $million $million $million $million $million
Total assets employed 110,315 93,160 69,891 107,516 41,197 50,117 17,276 133,306 (55,072) 567,706
Average interest-earning assets 88,628 66,652 57,590 92,831 31,739 32,944 12,334 92,405 (40,631) 434,492
Net interest income 774 489 644 1,146 482 582 329 495 - 4,941
Net interest margin (%) 1.8 1.5 2.3 2.5 3.1 3.6 5.4 1.1 - 2.3
1 Americas UK & Europe includes total assets employed of $88,605 million in respect of the UK, the Company’s country of domicile.
30.06.10
Asia Pacific
Hong Kong Singapore Korea
Other Asia
Pacific India
Middle East & Other
S Asia Africa
Americas UK &
Europe1 Intra-group/
tax assets Total
$million $million $million $million $million $million $million $million $million $million
Total assets employed 94,266 75,218 64,095 92,469 37,239 46,968 15,069 109,041 (53,538) 480,827
Average interest-earning assets 78,499 51,339 54,207 74,853 27,044 31,001 11,618 72,097 (36,772) 363,886
Net interest income 603 404 548 888 507 580 291 334 - 4,155
Net interest margin (%) 1.5 1.6 2.0 2.4 3.8 3.8 5.1 0.9 - 2.3
1 Americas UK & Europe includes total assets employed of $78,596 million in respect of the UK, the Company’s country of domicile.
31.12.10
Asia Pacific
Hong Kong Singapore Korea
Other Asia
Pacific India
Middle East & Other
S Asia Africa
Americas UK &
Europe1 Intra-group/
tax assets Total
$million $million $million $million $million $million $million $million $million $million
Total assets employed 102,674 82,007 63,936 101,915 39,631 48,028 15,944 117,934 (55,509) 516,560
Average interest-earning assets 85,395 59,647 56,781 84,341 30,704 31,628 13,453 80,286 (40,808) 401,427
Net interest income 669 417 551 997 458 592 307 324 - 4,315
Net interest margin (%) 1.6 1.4 1.9 2.3 3.0 3.7 4.5 0.8 - 2.1
1 Americas UK & Europe includes total assets employed of $75,930 million in respect of the UK, the Company’s country of domicile.
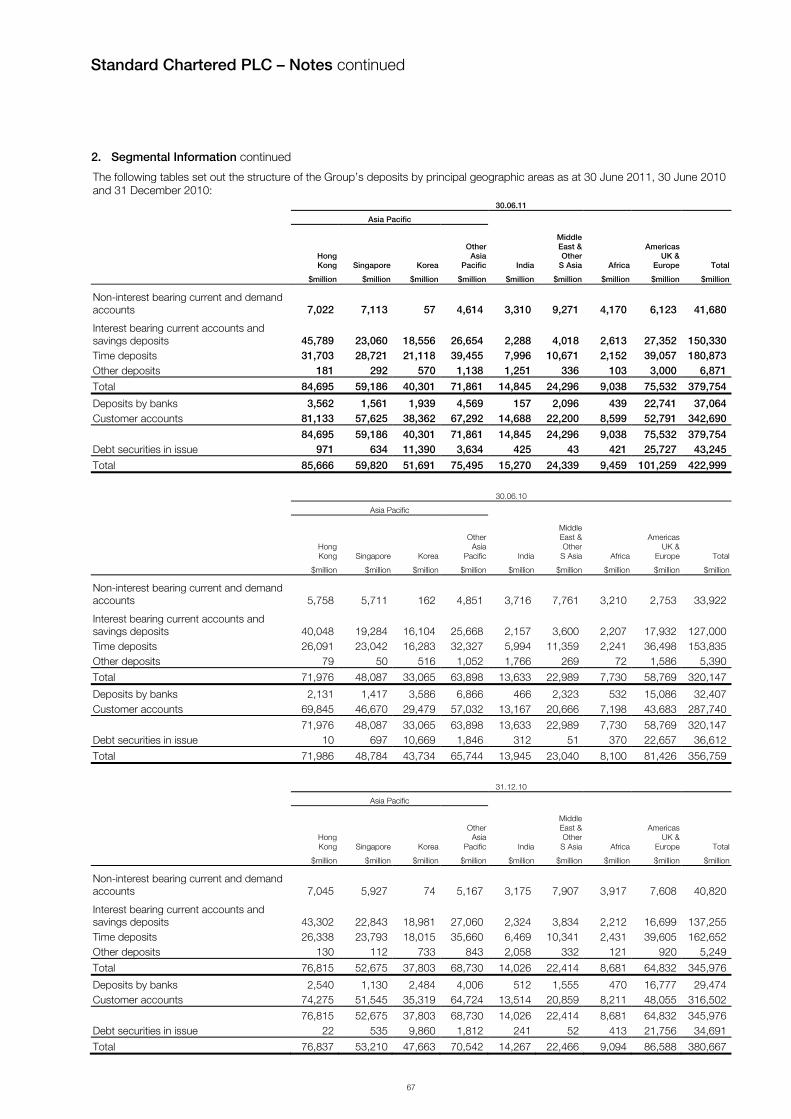
Standard Chartered PLC – Notes continued
67
2. Segmental Information continued
The following tables set out the structure of the Group’s deposits by principal geographic areas as at 30 June 2011, 30 June 2010 and 31 December 2010:
30.06.11
Asia Pacific
Hong Kong Singapore Korea
Other Asia
Pacific India
Middle East & Other
S Asia Africa
Americas UK &
Europe Total
$million $million $million $million $million $million $million $million $million
Non-interest bearing current and demand accounts 7,022 7,113 57 4,614 3,310 9,271 4,170 6,123 41,680
Interest bearing current accounts and savings deposits 45,789 23,060 18,556 26,654 2,288 4,018 2,613 27,352 150,330 Time deposits 31,703 28,721 21,118 39,455 7,996 10,671 2,152 39,057 180,873 Other deposits 181 292 570 1,138 1,251 336 103 3,000 6,871
Total 84,695 59,186 40,301 71,861 14,845 24,296 9,038 75,532 379,754
Deposits by banks 3,562 1,561 1,939 4,569 157 2,096 439 22,741 37,064 Customer accounts 81,133 57,625 38,362 67,292 14,688 22,200 8,599 52,791 342,690
84,695 59,186 40,301 71,861 14,845 24,296 9,038 75,532 379,754 Debt securities in issue 971 634 11,390 3,634 425 43 421 25,727 43,245
Total 85,666 59,820 51,691 75,495 15,270 24,339 9,459 101,259 422,999
30.06.10
Asia Pacific
Hong Kong Singapore Korea
Other Asia
Pacific India
Middle East & Other
S Asia Africa
Americas UK &
Europe Total
$million $million $million $million $million $million $million $million $million
Non-interest bearing current and demand accounts 5,758 5,711 162 4,851 3,716 7,761 3,210 2,753 33,922
Interest bearing current accounts and savings deposits 40,048 19,284 16,104 25,668 2,157 3,600 2,207 17,932 127,000 Time deposits 26,091 23,042 16,283 32,327 5,994 11,359 2,241 36,498 153,835 Other deposits 79 50 516 1,052 1,766 269 72 1,586 5,390
Total 71,976 48,087 33,065 63,898 13,633 22,989 7,730 58,769 320,147
Deposits by banks 2,131 1,417 3,586 6,866 466 2,323 532 15,086 32,407 Customer accounts 69,845 46,670 29,479 57,032 13,167 20,666 7,198 43,683 287,740
71,976 48,087 33,065 63,898 13,633 22,989 7,730 58,769 320,147 Debt securities in issue 10 697 10,669 1,846 312 51 370 22,657 36,612
Total 71,986 48,784 43,734 65,744 13,945 23,040 8,100 81,426 356,759
31.12.10
Asia Pacific
Hong Kong Singapore Korea
Other Asia
Pacific India
Middle East & Other
S Asia Africa
Americas UK &
Europe Total
$million $million $million $million $million $million $million $million $million
Non-interest bearing current and demand accounts 7,045 5,927 74 5,167 3,175 7,907 3,917 7,608 40,820
Interest bearing current accounts and savings deposits 43,302 22,843 18,981 27,060 2,324 3,834 2,212 16,699 137,255 Time deposits 26,338 23,793 18,015 35,660 6,469 10,341 2,431 39,605 162,652 Other deposits 130 112 733 843 2,058 332 121 920 5,249
Total 76,815 52,675 37,803 68,730 14,026 22,414 8,681 64,832 345,976
Deposits by banks 2,540 1,130 2,484 4,006 512 1,555 470 16,777 29,474 Customer accounts 74,275 51,545 35,319 64,724 13,514 20,859 8,211 48,055 316,502
76,815 52,675 37,803 68,730 14,026 22,414 8,681 64,832 345,976 Debt securities in issue 22 535 9,860 1,812 241 52 413 21,756 34,691
Total 76,837 53,210 47,663 70,542 14,267 22,466 9,094 86,588 380,667

Standard Chartered PLC – Notes continued
68
3. Net trading income
6 months
ended 6 months
ended6 months
ended
30.06.11 30.06.10 31.12.10
$million $million $million
Gains less losses on instruments held for trading:
Foreign currency1 1,051 574 1,103 Trading securities (40) 141 208 Interest rate derivatives 194 433 (94) Credit and other derivatives 213 79 (41)
1,418 1,227 1,176 Gains less losses from fair value hedging:
Gains less losses from fair value hedged items 138 (702) 446 Gains less losses from fair value hedged instruments (121) 708 (436)
17 6 10 Gains less losses on instruments designated at fair value:
Financial assets designated at fair value through profit or loss 14 168 33 Financial liabilities designated at fair value through profit or loss (14) (11) (3) Derivatives managed with financial instruments designated at fair value through profit or loss (69) (39) 10
(69) 118 40
1,366 1,351 1,226
1 Includes foreign currency gains and losses arising on the translation of foreign currency monetary assets and liabilities.
4. Other operating income
6 months
ended 6 months
ended6 months
ended
30.06.11 30.06.10 31.12.10
$million $million $million
Other operating income includes: Gains less losses on disposal of financial instruments: Available-for-sale 60 73 211 Loans and receivables 10 - 16 Dividend income 35 20 33 Gains arising on assets fair valued at acquisition1 5 16 13 Rental income from operating lease assets 124 87 126 Gain on disposal of property, plant and equipment 10 25 40 Gain arising on change of control - - 4
1 Relates to acquisitions completed prior to 1 January 2010, and primarily consists of recoveries of fair value adjustments on loans and advances.
5. Staff costs
6 months
ended 6 months
ended6 months
ended
30.06.11 30.06.10 31.12.10
$million $million $million
Staff costs: Wages and salaries 2,548 2,217 2,248 Social security costs 63 77 47 Other pension costs 153 115 67 Share based payment costs 150 145 245 Other staff costs 310 254 350
3,224 2,808 2,957
Number of employees - period end 84,061 82,2901 85,231
1 Restated as primarily due to the inclusion of fixed-term contract workers as employees in line with the definition under the Companies Act 2006

Standard Chartered PLC – Notes continued
69
6. Depreciation and amortisation
6 months
ended 6 months
ended6 months
ended
30.06.11 30.06.10 31.12.10
$million $million $million
Premises 58 57 61 Equipment: Operating lease assets 46 32 39 Others 72 69 71 Intangibles: Software 90 82 86 Acquired on business combinations 34 31 31
300 271 288
7. Impairment losses on loans and advances and other credit risk provisions
The following table reconciles the charge for impairment provisions on loans and advances to the total impairment charge and other credit risk provision:
6 months 6 months 6 monthsended ended ended
30.06.11 30.06.10 31.12.10
$million $million $million
Net charge against profit on loans and advances: Individual impairment charge 409 523 479 Portfolio impairment release (26) (88) (42)
383 435 437 Provisions related to credit commitments 1 3 6 Impairment charges/(releases) relating to debt securities classified as loans and receivables 28 (1) 3
412 437 446
An analysis of impairment provisions by geography and business is set out within the Risk review on pages 31 to 37.
8. Other impairment
6 months
ended 6 months
ended6 months
ended
30.06.11 30.06.10 31.12.10
$million $million $million
Impairment losses on available-for-sale financial assets:
- Asset backed securities 5 15 7 - Other debt securities 50 - - - Equity shares 21 5 5
76 20 12 Other 26 31 14
102 51 26 Recovery of impairment on disposal of equity instruments (30) (1) -
72 50 26 Recoveries of impairments of $30 million (30 June 2010: $1 million and 31 December 2010: $nil million) are in respect of private equity investments sold during the period which had impairment provisions raised against them in previous periods.
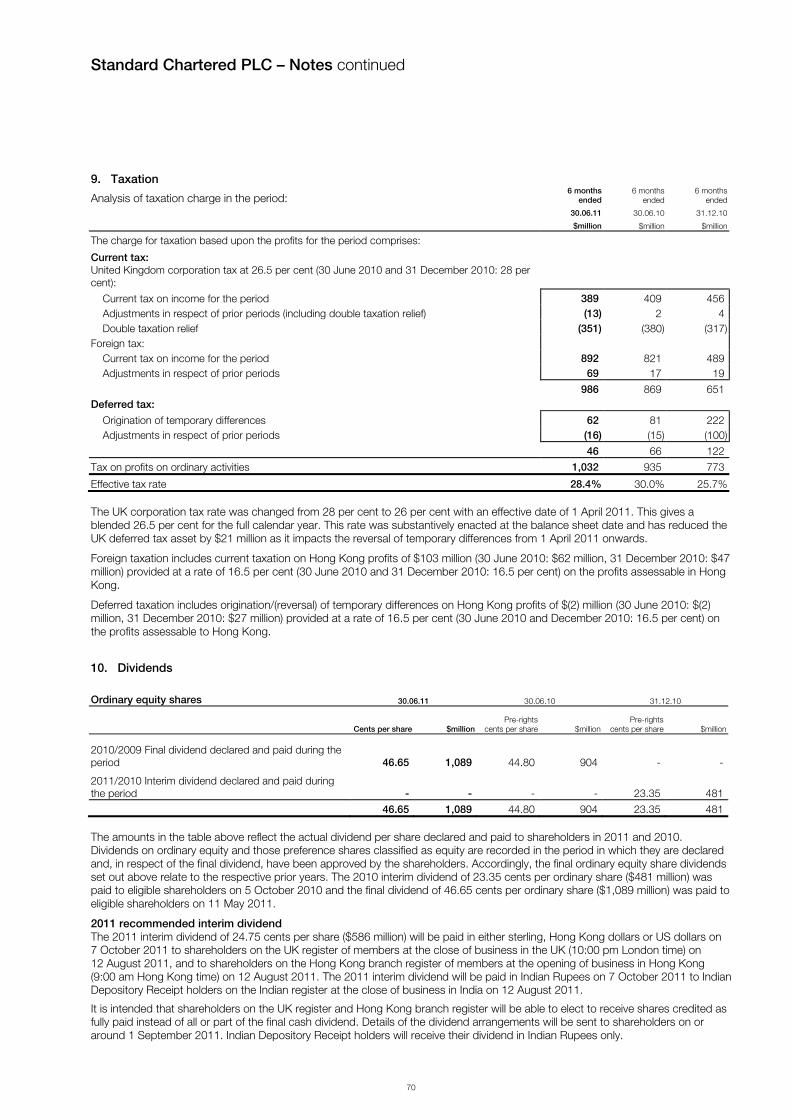
Standard Chartered PLC – Notes continued
70
9. Taxation
Analysis of taxation charge in the period: 6 months
ended 6 months
ended6 months
ended
30.06.11 30.06.10 31.12.10
$million $million $million
The charge for taxation based upon the profits for the period comprises:
Current tax: United Kingdom corporation tax at 26.5 per cent (30 June 2010 and 31 December 2010: 28 per cent): Current tax on income for the period 389 409 456 Adjustments in respect of prior periods (including double taxation relief) (13) 2 4 Double taxation relief (351) (380) (317)Foreign tax: Current tax on income for the period 892 821 489 Adjustments in respect of prior periods 69 17 19
986 869 651 Deferred tax:
Origination of temporary differences 62 81 222 Adjustments in respect of prior periods (16) (15) (100)
46 66 122
Tax on profits on ordinary activities 1,032 935 773
Effective tax rate 28.4% 30.0% 25.7% The UK corporation tax rate was changed from 28 per cent to 26 per cent with an effective date of 1 April 2011. This gives a blended 26.5 per cent for the full calendar year. This rate was substantively enacted at the balance sheet date and has reduced the UK deferred tax asset by $21 million as it impacts the reversal of temporary differences from 1 April 2011 onwards.
Foreign taxation includes current taxation on Hong Kong profits of $103 million (30 June 2010: $62 million, 31 December 2010: $47 million) provided at a rate of 16.5 per cent (30 June 2010 and 31 December 2010: 16.5 per cent) on the profits assessable in Hong Kong.
Deferred taxation includes origination/(reversal) of temporary differences on Hong Kong profits of $(2) million (30 June 2010: $(2) million, 31 December 2010: $27 million) provided at a rate of 16.5 per cent (30 June 2010 and December 2010: 16.5 per cent) on the profits assessable to Hong Kong.
10. Dividends
Ordinary equity shares 30.06.11 30.06.10 31.12.10
Cents per share $millionPre-rights
cents per share $million Pre-rights
cents per share $million
2010/2009 Final dividend declared and paid during the period 46.65 1,089 44.80 904 - -
2011/2010 Interim dividend declared and paid during the period - - - - 23.35 481
46.65 1,089 44.80 904 23.35 481 The amounts in the table above reflect the actual dividend per share declared and paid to shareholders in 2011 and 2010. Dividends on ordinary equity and those preference shares classified as equity are recorded in the period in which they are declared and, in respect of the final dividend, have been approved by the shareholders. Accordingly, the final ordinary equity share dividends set out above relate to the respective prior years. The 2010 interim dividend of 23.35 cents per ordinary share ($481 million) was paid to eligible shareholders on 5 October 2010 and the final dividend of 46.65 cents per ordinary share ($1,089 million) was paid to eligible shareholders on 11 May 2011.
2011 recommended interim dividend The 2011 interim dividend of 24.75 cents per share ($586 million) will be paid in either sterling, Hong Kong dollars or US dollars on 7 October 2011 to shareholders on the UK register of members at the close of business in the UK (10:00 pm London time) on 12 August 2011, and to shareholders on the Hong Kong branch register of members at the opening of business in Hong Kong (9:00 am Hong Kong time) on 12 August 2011. The 2011 interim dividend will be paid in Indian Rupees on 7 October 2011 to Indian Depository Receipt holders on the Indian register at the close of business in India on 12 August 2011.
It is intended that shareholders on the UK register and Hong Kong branch register will be able to elect to receive shares credited as fully paid instead of all or part of the final cash dividend. Details of the dividend arrangements will be sent to shareholders on or around 1 September 2011. Indian Depository Receipt holders will receive their dividend in Indian Rupees only.

Standard Chartered PLC – Notes continued
71
10. Dividends continued Impact of the 2010 rights issue On 13 October 2010, the Company announced the issue of 260,525,763 new ordinary shares by way of rights to qualifying shareholders at 1280 pence per new ordinary share. The issue was on the basis of 1 ordinary share for every 8 ordinary shares held on 21 October 2010.
In the absence of specific guidance in IFRS, the dividend per share amounts in the table below have been adjusted for the bonus element included within the 2010 rights issue in line with the restatement of prior period earnings per share amounts required by IAS 33 'Earnings per share' (see note 11).
30.06.10 31.12.10
Post-rights
cents per sharePost-rights
cents per share
2009 final dividend declared and paid during the period 43.16 - 2010 interim dividend declared and paid during the period - 22.50
Total dividend recommended and declared relating to 2010 on a post-rights basis was 69.15 cents per share (2009: 63.61 cents per share). For the 98.5 per cent of shareholders who exercised their rights, a comparison of the actual cash payments received by the shareholders is better reflected by adjusting the dividend per share amounts by the ratio of shares outstanding immediately before the rights issue to the number of shares outstanding immediately following the rights issue as set out in the table below. This approach is consistent with the adjustments to the dividend per share amounts following the rights issue in 2008.
30.06.10 31.12.10
Adjusted
cents per shareAdjusted
cents per share
2009 final dividend declared and paid during the period 39.82 - 2010 interim dividend declared and paid during the period - 20.76 Total dividend recommended and declared relating to 2010 adjusted using the ratio above was 67.41 cents per share (2009: 58.69 cents per share).
Preference shares 30.06.11 30.06.10 31.12.10
$million $million $million
Non-cumulative irredeemable preference shares: 7 3/8 per cent preference shares of £1 each1 6 6 5 8 1/4 per cent preference shares of £1 each1 7 7 6 Non-cumulative redeemable preference shares: 8.125 per cent preference shares of $5 each1 38 38 37 7.014 per cent preference shares of $5 each2 26 26 27 6.409 per cent preference shares of $5 each2 24 24 24
1 Dividends on these preference shares are treated as interest expense and accrued accordingly. 2 Dividends on those preference shares classified as equity are recorded in the period in which they are declared.

Standard Chartered PLC – Notes continued
72
11. Earnings per ordinary share 6 months ended 30.06.11 6 months ended 30.06.10
Profit1
Weighted average
number of shares
Per share
amount Profit1
Weighted average
number of shares
Per share
amount
$million (‘000) cents $million (‘000) cents
Basic earnings per ordinary share
Pre-rights issue bonus earnings per ordinary share - - - 2,098 2,028,825 103.4
Impact of rights issue3 - 77,056
Post-rights issue bonus earnings per ordinary share 2,516 2,351,718 107.0 2,098 2,105,881 99.6 Effect of dilutive potential ordinary shares: Options2 30,468 - 30,589
Diluted earnings per ordinary share 2,516 2,382,186 105.6 2,098 2,136,470 98.2
6 months ended 31.12.10
Profit1
Weighted average
number of shares
Per share
amount
$million (‘000) cents
Basic earnings per ordinary share
Pre-rights issue bonus earnings per ordinary share 2,133 2,069,386 103.1
Impact of rights issue3 134,955
Post-rights issue bonus earnings per ordinary share 2,133 2,204,341 96.8 Effect of dilutive potential ordinary shares: Options2 45,042
Diluted earnings per ordinary share 2,133 2,249,383 94.8
There were no ordinary shares issued after the balance sheet date that would have significantly affected the number of ordinary shares used in the above calculation had they been issued prior to the end of the balance sheet date.
The Group measures earnings per share on a normalised basis. This differs from earnings defined in IAS 33 ‘Earnings per share’ (IAS 33). The table below provides a reconciliation. 30.06.11 30.06.10 31.12.10
$million $million $million
Profit attributable to ordinary shareholders 2,516 2,098 2,133
Amortisation of intangible assets arising on business combinations 34 31 31 Gain on sale of property, plant and equipment (9) (16) (29)Gain arising on change of control - - (4)Recovery on structured notes
(86) - -
UK bank payroll tax - 21 (14)
Tax on normalised items 20 (5) (1)
Normalised earnings 2,475 2,129 2,116
Normalised basic earnings per ordinary share (cents) 105.2 101.1 3 96.0
Normalised diluted earnings per ordinary share (cents) 103.9 99.7 3 94.1
1 The profit amounts represent the profit attributable to ordinary shareholders, which is profit for the year after non-controlling interest and the declaration of dividends payable to the holders of the non-cumulative redeemable preference shares classified as equity (see note 10).
2 The impact of anti-dilutive options has been excluded from this amount as required by IAS 33. 3 On 13 October 2010 the Company announced the issue of 260,525,763 new ordinary shares by way of rights to qualify shareholders at 1280 pence per
share. The issue was made as 1 share for every 8 shares held on 21 October 2010. As required by IAS 33 the impact of the bonus element included within the rights issue has been included in the calculations of the basic and diluted earnings per share for the year and prior periods (and their normalised equivalent) have been re-presented accordingly as presented in note 32.

Standard Chartered PLC – Notes continued
73
12. Financial instrumentsClassification Financial assets are classified between four measurement categories: held at fair value through profit or loss (comprising trading and designated), available-for-sale, loans and receivables and held-to-maturity; and two measurement categories for financial liabilities: held at fair value through profit or loss (comprising trading and designated) and amortised cost. Instruments are classified in the balance sheet in accordance with their legal form, except for instruments that are held for trading purposes and those that the Group has designated to hold at fair value through the profit or loss account. The latter are combined on the face of the balance sheet and disclosed as financial assets or liabilities held at fair value through profit or loss.
The Group’s classification of its principal financial assets and liabilities is summarised in the table below.
Assets at fair value Assets at amortised cost
Assets
Trading
Derivatives held for hedging
Designated at fair value
through profit or loss
Available-for-sale
Loans and receivables
Held-to- maturity
Non-financial assets Total
$million $million $million $million $million $million $million $million
Cash and balances at central banks - - - - 43,689 - - 43,689 Financial assets held at fair value through profit or loss
Loans and advances to banks 327 - 107 - - - - 434 Loans and advances to customers 5,293 - 372 - - - - 5,665 Treasury bills and other eligible bills 4,617 - - - - - - 4,617 Debt securities 14,557 - 67 - - - - 14,624 Equity shares 1,523 - 538 - - - - 2,061
26,317 - 1,084 - - - - 27,401 Derivative financial instruments 48,723 2,111 - - - - - 50,834 Loans and advances to banks - - - - 57,317 - - 57,317 Loans and advances to customers - - - - 262,126 - - 262,126 Investment securities
Treasury bills and other eligible bills - - - 20,148 - - - 20,148 Debt securities - - - 53,558 4,912 22 - 58,492 Equity shares - - - 2,704 - - - 2,704
- - - 76,410 4,912 22 - 81,344 Other assets - - - - 22,244 - 6,547 28,791
Total at 30 June 2011 75,040 2,111 1,084 76,410 390,288 22 6,547 551,502 Cash and balances at central banks - - - - 29,694 - - 29,694 Financial assets held at fair value through profit or loss
Loans and advances to banks 941 - 70 - - - - 1,011 Loans and advances to customers 4,208 - 142 - - - - 4,350 Treasury bills and other eligible bills 5,548 - 246 - - - - 5,794 Debt securities 11,630 - 122 - - - - 11,752 Equity shares 663 - 717 - - - - 1,380
22,990 - 1,297 - - - - 24,287 Derivative financial instruments 43,504 1,051 - - - - - 44,555 Loans and advances to banks - - - - 49,390 - - 49,390 Loans and advances to customers - - - - 215,005 - - 215,005 Investment securities
Treasury bills and other eligible bills - - - 20,655 - - - 20,655 Debt securities - - - 48,252 5,975 31 - 54,258 Equity shares - - - 1,874 - - - 1,874
- - - 70,781 5,975 31 - 76,787 Other assets - - - - 17,796 - 6,975 24,771
Total at 30 June 2010 66,494 1,051 1,297 70,781 317,860 31 6,975 464,489

Standard Chartered PLC – Notes continued
74
12. Financial instruments continued Classification continued
Assets at fair value Assets at amortised cost
Assets
Trading
Derivatives held for hedging
Designated at fair value
through profit or loss
Available-for-sale
Loans and receivables
Held-to- maturity
Non-financial assets Total
$million $million $million $million $million $million $million $million
Cash and balances at central banks - - - - 32,724 - - 32,724 Financial assets held at fair value through profit or loss
Loans and advances to banks 1,206 - - - - - - 1,206 Loans and advances to customers 5,651 - 395 - - - - 6,046 Treasury bills and other eligible bills 5,933 - 265 - - - - 6,198 Debt securities 11,781 - 36 - - - - 11,817 Equity shares 1,329 - 425 - - - - 1,754
25,900 - 1,121 - - - - 27,021 Derivative financial instruments 46,256 1,603 - - - - - 47,859 Loans and advances to banks - - - - 52,058 - - 52,058 Loans and advances to customers - - - - 240,358 - - 240,358 Investment securities
Treasury bills and other eligible bills - - - 17,895 - - - 17,895 Debt securities - - - 50,555 4,804 25 - 55,384 Equity shares - - - 2,517 - - - 2,517
- - - 70,967 4,804 25 - 75,796 Other assets - - - - 19,628 - 5,728 25,356
Total at 31 December 2010 72,156 1,603 1,121 70,967 349,572 25 5,728 501,172
Liabilities at fair value
Liabilities Trading
Derivatives held for hedging
Designated at fair value
through profit or loss
Amortised cost
Non-financial liabilities Total
$million $million $million $million $million $million
Financial liabilities held at fair value through profit or loss
Deposits by banks 631 - 99 - - 730 Customer accounts 2,445 - 6,760 - - 9,205 Debt securities in issue 2,570 - 2,035 - - 4,605 Short positions 5,786 - - - - 5,786
11,432 - 8,894 - - 20,326 Derivative financial instruments 48,811 826 - - - 49,637 Deposits by banks - - - 36,334 - 36,334 Customer accounts - - - 333,485 - 333,485 Debt securities in issue - - - 38,640 - 38,640 Other liabilities - - - 19,743 6,240 25,983 Subordinated liabilities and other borrowed funds - - - 16,004 - 16,004
Total at 30 June 2011 60,243 826 8,894 444,206 6,240 520,409

Standard Chartered PLC – Notes continued
75
12. Financial instruments continued Classification continued
Liabilities at fair value
Liabilities Trading
Derivatives held for hedging
Designated at fair value
through profit or loss
Amortised cost
Non-financial liabilities Total
$million $million $million $million $million $million
Financial liabilities held at fair value through profit or loss
Deposits by banks 379 - 125 - - 504 Customer accounts 2,114 - 6,537 - - 8,651 Debt securities in issue 1,814 - 1,434 - - 3,248 Short positions 5,977 - - - - 5,977
10,284 - 8,096 - - 18,380 Derivative financial instruments 42,270 1,155 - - - 43,425 Deposits by banks - - - 31,903 - 31,903 Customer accounts - - - 279,089 - 279,089 Debt securities in issue - - - 33,364 - 33,364 Other liabilities - - - 17,804 5,912 23,716 Subordinated liabilities and other borrowed funds - - - 15,555 - 15,555
Total at 30 June 2010 52,554 1,155 8,096 377,715 5,912 445,432
Financial liabilities held at fair value through profit or loss
Deposits by banks 885 - 38 - - 923 Customer accounts 2,307 - 7,203 - - 9,510 Debt securities in issue 2,256 - 1,054 - - 3,310 Short positions 6,545 - - - - 6,545
11,993 - 8,295 - - 20,288 Derivative financial instruments 46,192 941 - - - 47,133 Deposits by banks - - - 28,551 - 28,551 Customer accounts - - - 306,992 - 306,992 Debt securities in issue - - - 31,381 - 31,381 Other liabilities - - - 15,890 5,204 21,094 Subordinated liabilities and other borrowed funds - - - 15,939 - 15,939
Total at 31 December 2010 58,185 941 8,295 398,753 5,204 471,378
Valuation of financial instruments
Valuation hierarchy
The valuation hierarchy, and the types of instruments classified into each level within that hierarchy, is set out below:
Level 1 Level 2 Level 3
Fair value determined using: Unadjusted quoted prices in an active market for identical assets and liabilities
Valuation models with directly or indirectly market observable inputs
Valuation models using significant non-market observable inputs
Types of financial assets: Actively traded government and agency securities
Listed equities
Listed derivative instruments
Investments in publicly traded mutual funds with listed market prices
Corporate and other government bonds and loans
Over-the-counter (OTC) derivatives
Asset backed securities
Private equity investments
Asset backed securities
Private equity investments
Highly structured OTC derivatives with unobservable parameters
Corporate bonds in illiquid markets
Types of financial liabilities: Listed derivative instruments OTC derivatives
Structured deposits
Credit structured debt securities in issue
Highly structured OTC derivatives with unobservable parameters
Illiquid or highly structured debt securities in issue

Standard Chartered PLC – Notes continued
76
12. Financial instruments continued Valuation hierarchy continued
The tables below show the classification of financial instruments held at fair value into the valuation hierarchy set out above as at 30 June 2011, 30 June 2010, 31 December 2010.
Assets Level 1 Level 2 Level 3 Total
$million $million $million $million
Financial instruments held at fair value through profit or loss
Loans and advances to banks 144 290 - 434 Loans and advances to customers 6 5,659 - 5,665 Treasury bills and other eligible bills 4,490 127 - 4,617 Debt securities 8,684 5,582 358 14,624 Equity shares 1,599 7 455 2,061
14,923 11,665 813 27,401 Derivative financial instruments 296 50,418 120 50,834 Available-for-sale financial assets
Treasury bills and other eligible bills 17,942 2,162 44 20,148 Debt securities 14,982 37,538 1,038 53,558 Equity shares 1,113 461 1,130 2,704
34,037 40,161 2,212 76,410
Total at 30 June 2011 49,256 102,244 3,145 154,645 Liabilities
Financial instruments held at fair value through profit or loss
Deposits by banks 149 581 - 730 Customer accounts 49 9,156 - 9,205 Debt securities in issue - 4,341 264 4,605 Short positions 4,938 848 - 5,786
5,136 14,926 264 20,326 Derivative financial instruments 388 49,005 244 49,637
Total at 30 June 2011 5,524 63,931 508 69,963
There were no significant transfers between level 1 and 2 during the period.

Standard Chartered PLC – Notes continued
77
12. Financial instruments continued Valuation hierarchy continued
Assets Level 1 Level 2 Level 3 Total
$million $million $million $million
Financial instruments held at fair value through profit or loss
Loans and advances to banks 595 416 - 1,011 Loans and advances to customers 63 4,287 - 4,350 Treasury bills and other eligible bills 4,564 1,230 - 5,794 Debt securities 6,601 5,061 90 11,752 Equity shares 654 34 692 1,380
12,477 11,028 782 24,287 Derivative financial instruments 151 44,331 73 44,555 Available-for-sale financial assets
Treasury bills and other eligible bills 18,300 2,355 - 20,655 Debt securities 18,149 29,534 569 48,252 Equity shares 480 433 961 1,874
36,929 32,322 1,530 70,781
Total at 30 June 2010 49,557 87,681 2,385 139,623 Liabilities
Financial instruments held at fair value through profit or loss
Deposits by banks - 504 - 504 Customer accounts - 8,651 - 8,651 Debt securities in issue - 3,223 25 3,248 Short positions 5,154 823 - 5,977
5,154 13,201 25 18,380 Derivative financial instruments 85 43,242 98 43,425
Total at 30 June 2010 5,239 56,443 123 61,805
There were no significant transfers between level 1 and 2 during the period.

Standard Chartered PLC – Notes continued
78
12. Financial instruments continued Valuation hierarchy continued
Assets Level 1 Level 2 Level 3 Total
$million $million $million $million
Financial instruments held at fair value through profit or loss
Loans and advances to banks 406 800 - 1,206 Loans and advances to customers 19 6,027 - 6,046 Treasury bills and other eligible bills 6,055 143 - 6,198 Debt securities 7,257 4,333 227 11,817 Equity shares 1,434 19 301 1,754
15,171 11,322 528 27,021 Derivative financial instruments 135 47,537 187 47,859 Available-for-sale financial assets
Treasury bills and other eligible bills 15,335 2,560 - 17,895 Debt securities 20,631 29,342 582 50,555 Equity shares 1,020 446 1,051 2,517
36,986 32,348 1,633 70,967
Total at 31 December 2010 52,292 91,207 2,348 145,847 Liabilities
Financial instruments held at fair value through profit or loss
Deposits by banks 320 603 - 923 Customer accounts - 9,510 - 9,510 Debt securities in issue - 2,999 311 3,310 Short positions 6,072 473 - 6,545
6,392 13,585 311 20,288 Derivative financial instruments 105 46,746 282 47,133
Total at 31 December 2010 6,497 60,331 593 67,421
There were no significant transfers between level 1 and 2 during the period.

Standard Chartered PLC – Notes continued
79
12. Financial instruments continued Level 3 movement tables – Financial assets
Held at fair value through
profit or loss Derivative financial
instruments
Investment securities
Assets Debt securities Equity shares Treasury Bills Debt securities Equity shares Total
$million $million $million $million $million $million $million
At 1 January 2011 227 301 187 - 582 1,051 2,348
Total gains/(losses) recognised in income statement 8 7 15 - (50) 3 (17)Total gains recognised in other comprehensive income - - - - 37 23 60 Purchases 201 157 - 24 237 102 721 Sales (40) (10) (7) - (230) (19) (306)Settlements (18) - (61) - (3) (7) (89)Transfers out (96) - (14) - - (71) (181)Transfers in 76 - - 20 465 48 609
At 30 June 2011 358 455 120 44 1,038 1,130 3,145
Total gains recognised in the income statement relating to assets held at 30 June 2011 18 10 47 - - - 75
Held at fair value through profit or loss Derivative financial
instruments
Investment securities
Assets Debt securities Equity shares Debt securities Equity shares Total
$million $million $million $million $million $million
At 1 January 2010 129 576 138 437 756 2,036
Total (losses)/gains recognised in income statement (40) 86 (48) - - (2)Total gains recognised in other comprehensive income - - - 57 62 119 Purchases 40 30 - 69 162 301 Sales (64) - - - - (64)Settlements - - - - (7) (7)Transfers out - - (23) - (12) (35)Transfers in 25 - 6 6 - 37
At 30 June 2010 90 692 73 569 961 2,385
Total gains recognised in the income statement relating to assets held at 30 June 2010 2 11 19 - - 32
Held at fair value through profit or loss Derivative financial
instruments
Investment securities
Assets Debt securities Equity shares Debt securities Equity shares Total
$million $million $million $million $million $million
At 1 July 2010 90 692 73 569 961 2,385
Total gains/(losses) recognised in income statement 37 84 87 - (15) 193 Total gains recognised in other comprehensive income - - - 46 84 130 Purchases 67 105 - 87 63 322 Sales (16) (574) - (147) (1) (738)Settlements (63) (6) - - (43) (112)Transfers out (23) - (1) - - (24)Transfers in 135 - 28 27 2 192
At 31 December 2010 227 301 187 582 1,051 2,348
Total (losses)/gains recognised in the income statement relating to assets held at 31 December 2010 (6) 50 130 - (1) 173
Transfers in during the periods primarily relate to markets for certain financial instruments becoming illiquid or where the valuation parameters became unobservable during the period. Transfers out during the periods primarily relate to certain financial instruments where the valuation parameters became observable during the period.

Standard Chartered PLC – Notes continued
80
12. Financial instruments continued Level 3 movement tables – Financial liabilities
30.06.11 30.06.10
Liabilities
Debt securities
in issue
Derivative financial
instruments Total
Debt securities
in issue
Derivative financial
instruments Total
$million $million $million $million $million $million
At 1 January 311 282 593 - 150 150 Total (gains)/losses recognised in income statement (12) 21 9 1 (30) (29)Issues 16 1 17 18 - 18 Settlements (53) (32) (85) - (4) (4)Transfers out - (28) (28) - (23) (23)Transfers in 2 - 2 6 5 11
At 30 June 264 244 508 25 98 123 Total losses recognised in the income statement relating to liabilities held at the end of the period 4 127 131 - 1 1
31.12.10
Liabilities
Debt securities
in issue
Derivative financial
instruments Total
$million $million $million
At 1 July 25 98 123 Total losses recognised in income statement 31 123 154 Issues 51 33 84 Settlements (2) 4 2 Transfers in 206 24 230
At 31 December 311 282 593 Total losses recognised in the income statement relating to liabilities held at the end of the period 32 163 195
Transfers in during the periods primarily relate to certain financial instruments which parameters became unobservable during the period.
Instruments carried at amortised cost The following table summarises the carrying amounts and fair values of those financial assets and liabilities not presented on the Group’s balance sheet at fair value. The fair values in the table below are stated as at the reporting dates and may be different from the actual amount that will be received/paid on the settlement or maturity of the financial instrument.
30.06.11 30.06.10 31.12.10
Carrying value Fair value Carrying value Fair value Carrying value Fair value
$million $million $million $million $million $million
Assets Cash and balances at central banks 43,689 43,689 29,694 29,694 32,724 32,724 Loans and advances to banks 57,317 57,353 49,390 49,297 52,058 51,942 Loans and advances to customers 262,126 263,301 215,005 215,347 240,358 239,446 Investment securities 4,934 4,843 6,006 5,844 4,829 4,765 Other assets 22,244 22,244 17,796 17,796 19,628 19,628
Liabilities Deposits by banks 36,334 36,614 31,903 32,102 28,551 28,501 Customer accounts 333,485 333,090 279,089 279,746 306,992 305,560 Debt securities in issue 38,640 37,740 33,364 34,591 31,381 30,710 Subordinated liabilities and other borrowed funds 16,004 16,490 15,555 15,901 15,939 16,298 Other liabilities 19,743 19,743 17,804 17,804 15,890 15,890

Standard Chartered PLC – Notes continued
81
12. Financial instruments continued Reclassification of financial assets In 2008 the Group reclassified certain non-derivative financial assets classified as held for trading into the available-for-sale (AFS) category as these were no longer considered to be held for the purpose of selling or repurchasing in the near term. At the time of transfer, the Group identified the rare circumstances permitting such a transfer as the impact of the ongoing credit crisis in financial markets, particularly from the beginning of 2008, which significantly impacted the liquidity in certain markets. The Group also reclassified certain eligible financial assets from trading and available-for-sale categories to loans and receivables where the Group had the intent and ability to hold the reclassified assets for the foreseeable future or until maturity. There have been no reclassifications since 2008.
The following tables provide details of the remaining balance of assets reclassified during 2008 as at 30 June 2011, 30 June 2010 and 31 December 2010:
If assets had not been reclassified, fair value gain
from 1 January 2011 to 30 June 2011 which would
have been recognised within
For assets reclassified:
Carrying amount at30 June 2011
Fair value at 30 June 2011 Income
AFS reserve
Income recognised in
income statement
Effective interest rate at
date of reclassification
Estimated amounts of
expected cash flows
$million $million $million $million $million % $million
From trading to AFS 218 218 9 1 - 5 5.2 284 From trading to loans and receivables 1,146 1,142 31 - 27 5.8 1,355 From AFS to loans and receivables 923 899 - 19 15 5.5 1,199
2,287 2,259 40 19 47
Of which asset backed securities: reclassified to AFS 132 132 7 1 - 3 reclassified to loans and receivables 1,596 1,606 14 19 25
1 Post reclassification, the gain is recognised within the available-for-sale reserve.
If assets had not been reclassified, fair value gain from 1 January 2010 to
30 June 2010 which would have been recognised within
For assets reclassified:
Carrying amount at30 June 2010
Fair value at 30 June 2010 Income AFS reserve
Income recognised in
income statement
Effective interest rate at
date of reclassification
Estimated amounts of
expectedcash flows
$million $million $million $million $million % $million
From trading to AFS 352 352 27 1 - 12 5.3 452 From trading to loans and receivables 1,972 1,847 31 - 34 5.5 2,152 From AFS to loans and receivables 1,200 1,146 - 76 10 5.6 1,408
3,524 3,345 58 76 56
Of which asset backed securities: reclassified to AFS 126 126 23 1 - 4 reclassified to loans and receivables 1,931 1,833 19 76 19
1 Post reclassification, the gain is recognised within the available-for-sale reserve.
If assets had not been reclassified, fair value gain/(loss)
from 1 July 2010 to 31 December 2010 which would
have been recognised within
For assets reclassified:
Carrying amount at 31 December 2010
Fair value at 31 December 2010 Income AFS reserve
Income recognised in
income statement
Effective interest rate at
date of reclassification
Estimated amounts of
expectedcash flows
$million $million $million $million $million % $million
From trading to AFS 339 339 13 1 - 11 5.2 416 From trading to loans and receivables 1,562 1,490 49 - 39 5.6 1,686 From AFS to loans and receivables 1,090 1,052 - (1) 25 5.4 1,132
2,991 2,881 62 (1) 75
Of which asset backed securities: reclassified to AFS 122 122 12 1 - 4 reclassified to loans and receivables 1,725 1,648 23 (1) 34
1 Post reclassification, the gain is recognised within the available-for-sale reserve.

Standard Chartered PLC – Notes continued
82
13. Financial instruments held at fair value through profit or lossFinancial assets held at fair value through profit or loss
Financial assets held at fair value through profit or loss comprise assets held for trading and those financial assets designated as being held at fair value through profit or loss. For certain loans and advances and debt securities with fixed rates of interest, interest rate swaps have been acquired with the intention of significantly reducing interest rate risk. Derivatives are recorded at fair value whereas loans and advances are usually recorded at amortised cost. To significantly reduce the accounting mismatch between fair value and amortised cost, these loans and advances and debt securities have been designated at fair value through profit or loss. The Group ensures the criteria under IAS 39 are met by matching the principal terms of interest rate swaps to the corresponding loans and debt securities.
Debt securities, equity shares and treasury bills held at fair value through profit or loss
30.06.11
Debt
SecuritiesEquity
Shares Treasury
bills Total
$million $million $million $million
Issued by public bodies: Government securities 8,613 Other public sector securities 107
8,720
Issued by banks: Certificates of deposit 479 Other debt securities 2,047
2,526
Issued by corporate entities and other issuers: Other debt securities 3,378
Total debt securities 14,624
Of which: Listed on a recognised UK exchange 397 59 - 456 Listed elsewhere 8,038 1,547 1,119 10,704 Unlisted 6,189 455 3,498 10,142
14,624 2,061 4,617 21,302
Market value of listed securities 8,435 1,606 1,119 11,160
Trading securities subject to sale and repurchase transaction 830 - 133 963
30.06.10
Debt
SecuritiesEquity
Shares Treasury
bills Total
$million $million $million $million
Issued by public bodies: Government securities 7,412 Other public sector securities 66
7,478
Issued by banks: Certificates of deposit 114 Other debt securities 1,063
1,177
Issued by corporate entities and other issuers: Other debt securities 3,097
Total debt securities 11,752
Of which: Listed on a recognised UK exchange 85 - - 85 Listed elsewhere 5,110 687 971 6,768 Unlisted 6,557 693 4,823 12,073
11,752 1,380 5,794 18,926
Market value of listed securities 5,195 687 971 6,853
Trading securities subject to sale and repurchase transactions 937 - 715 1,652

Standard Chartered PLC – Notes continued
83
13. Financial instruments held at fair value through profit or loss continuedDebt securities, equity shares and treasury bills held at fair value through profit or loss continued
31.12.10
Debt
SecuritiesEquity
Shares Treasury
bills Total
$million $million $million $million
Issued by public bodies: Government securities 7,156 Other public sector securities 120
7,276
Issued by banks: Certificates of deposit 151 Other debt securities 1,302
1,453
Issued by corporate entities and other issuers: Other debt securities 3,088
Total debt securities 11,817
Of which: Listed on a recognised UK exchange 180 - - 180 Listed elsewhere 5,865 1,453 769 8,087 Unlisted 5,772 301 5,429 11,502
11,817 1,754 6,198 19,769
Market value of listed securities 6,045 1,453 769 8,267
Trading securities subject to sale and repurchase transactions 739 - 108 847 Financial liabilities held at fair value through profit or loss
The Group designates certain financial liabilities at fair value through profit or loss where either the liabilities:
have fixed rates of interest and interest rate swaps or other interest rate derivatives have been entered into with the intention of significantly reducing interest rate risk; or
are exposed to foreign currency risk and derivatives have been acquired with the intention of significantly reducing exposure to market changes; or
have been acquired to fund trading asset portfolios or assets, or where the assets and liabilities are managed, and performance evaluated, on a fair value basis for a documented risk management or investment strategy.
Derivatives are recorded at fair value whereas non-trading financial liabilities (unless designated at fair value) are recorded at amortised cost. Designation of certain liabilities at fair value through profit or loss significantly reduces the accounting mismatch between fair value and amortised cost expense recognition (a criterion of IAS 39). The Group ensures the criteria under IAS 39 are met by matching the principal terms of derivatives to the corresponding liabilities, either individually or on a portfolio basis.

Standard Chartered PLC – Notes continued
84
14. Derivative financial instruments Derivatives are financial instruments that derive their value in response to changes in interest rates, financial instrument prices, commodity prices, foreign exchange rates, credit risk and indices. The types of derivatives used by the Group are set out below.
All derivatives are recognised and subsequently measured at fair value, with all revaluation gains recognised in profit and loss (except where cash flow or net investment hedging has been achieved, in which case the effective portion of changes in fair value is recognised within reserves until the cash flow occurs or net investment realised).
The tables below analyse the notional principal amounts and the positive and negative fair values of the Group’s derivative financial instruments. Notional principal amounts are the amount of principal underlying the contract at the reporting date.
The Group limits exposure to credit losses in the event of default by entering into master netting agreements with certain market counterparties. As required by IAS 32, exposures are not presented net in these accounts as in the ordinary course of business they are not intended to be settled net. Details of the amounts available for offset can be found in the Risk review on page 26.
The Derivatives and Hedging sections of the Risk review on page 47 explain the Group’s risk management of derivative contracts and application of hedging.
30.06.11 30.06.10
Total derivatives
Notional principal amounts Assets Liabilities
Notional principal amounts Assets Liabilities
$million $million $million $million $million $million
Foreign exchange derivative contracts: Forward foreign exchange contracts 1,217,210 11,853 11,858 856,789 10,458 9,346 Currency swaps and options 974,693 14,005 14,245 531,875 9,632 10,427 Exchange traded futures and options 584 - - 456 - -
2,192,487 25,858 26,103 1,389,120 20,090 19,773
Interest rate derivative contracts: Swaps 2,445,236 17,347 16,212 1,467,540 18,694 18,192 Forward rate agreements and options 279,873 931 973 271,726 2,438 2,210 Exchange traded futures and options 1,470,652 746 763 577,989 262 243
4,195,761 19,024 17,948 2,317,255 21,394 20,645
Credit derivative contracts 94,041 1,936 1,992 57,093 1,291 1,336
Equity and stock index options 10,969 417 917 6,338 293 299
Commodity derivative contracts 56,945 3,599 2,677 30,372 1,487 1,372
Total derivatives 6,550,203 50,834 49,637 3,800,178 44,555 43,425 31.12.10
Total derivatives
Notional principal amounts Assets Liabilities
$million $million $million
Foreign exchange derivative contracts: Forward foreign exchange contracts 986,615 12,503 12,236 Currency swaps and options 566,291 11,343 11,712 Exchange traded futures and options 855 - -
1,553,761 23,846 23,948
Interest rate derivative contracts: Swaps 1,745,286 17,487 17,001 Forward rate agreements and options 234,926 1,010 1,029 Exchange traded futures and options 619,859 350 346
2,600,071 18,847 18,376
Credit derivative contracts 65,986 1,602 1,679
Equity and stock index options 8,842 479 757
Commodity derivative contracts 36,524 3,085 2,373
Total derivatives 4,265,184 47,859 47,133

Standard Chartered PLC – Notes continued
85
14. Derivative financial instruments continuedDerivatives held for hedging
Hedge accounting is applied to derivatives and hedged items when the criteria under IAS 39 have been met. The tables below list the types of derivatives that the Group holds for hedge accounting.
30.06.11 30.06.10
Notional principal amounts Assets Liabilities
Notional principal amounts Assets Liabilities
$million $million $million $million $million $million
Derivatives designated as fair value hedges: Interest rate swaps 40,794 1,876 506 31,518 937 1,066 Forward foreign exchange contracts 1,373 15 15 1,547 13 3 Currency swaps 3,819 83 244 2,311 37 40
45,986 1,974 765 35,376 987 1,109
Derivatives designated as cash flow hedges: Interest rate swaps 21,730 31 24 17,778 42 29 Options 387 43 - 1,082 21 - Forward foreign exchange contracts 1,622 59 2 377 1 4 Currency swaps 2,026 4 2 467 - 1
25,765 137 28 19,704 64 34
Derivatives designated as net investment hedges: Forward foreign exchange contracts 691 - 33 803 - 12
Total derivatives held for hedging 72,442 2,111 826 55,883 1,051 1,155 31.12.10
Notional principal amounts Assets Liabilities
$million $million $million
Derivatives designated as fair value hedges: Interest rate swaps 33,280 1,424 652 Forward foreign exchange contracts 1,650 28 11 Currency swaps 3,178 46 172
38,108 1,498 835
Derivatives designated as cash flow hedges: Interest rate swaps 18,591 20 23 Options 950 54 - Forward foreign exchange contracts 148 22 6 Currency swaps 1,751 9 1
21,440 105 30
Derivatives designated as net investment hedges: Forward foreign exchange contracts 803 - 76
Total derivatives held for hedging 60,351 1,603 941

Standard Chartered PLC – Notes continued
86
15. Loans and advances to banks
30.06.11 30.06.10 31.12.10
$million $million $million
Loans and advances to banks 57,847 50,537 53,359 Individual impairment provision (94) (134) (93)Portfolio impairment provision (2) (2) (2)
57,751 50,401 53,264 Of which: loans and advances held at fair value through profit or loss (note 12) (434) (1,011) (1,206)
57,317 49,390 52,058 Analysis of loans and advances to banks by geography as set out in the Risk review on pages 27 to 28.
16. Loans and advances to customers
30.06.11 30.06.10 31.12.10
$million $million $million
Loans and advances to customers 270,439 221,946 248,988 Individual impairment provision (1,900) (1,810) (1,824)Portfolio impairment provision (748) (781) (760)
267,791 219,355 246,404 Of which: loans and advances held at fair value through profit or loss (note 12) (5,665) (4,350) (6,046)
262,126 215,005 240,358
Loans and advances sold subject to sale and repurchase transactions 97 213 39 Analysis of loans and advances to customers by geography as set out in the Risk review on pages 27 to 28.
17. Investment securities
30.06.11
Debt securities
Held-to-maturity
Available-for-sale
Loans and receivables
Equity shares
Treasury bills Total
$million $million $million $million $million $million
Issued by public bodies: Government securities 22 20,129 388 Other public sector securities - 671 -
22 20,800 388
Issued by banks: Certificates of deposit - 5,600 - Other debt securities - 18,019 1,161
- 23,619 1,161
Issued by corporate entities and other issuers: Other debt securities - 9,139 3,363
Total debt securities 22 53,558 4,912
Of which: Listed on a recognised UK exchange - 3,570 254 1 184 - 4,008 Listed elsewhere 22 16,963 996 1 935 7,154 26,070 Unlisted - 33,025 3,662 1,585 12,994 51,266
22 53,558 4,912 2,704 20,148 81,344
Market value of listed securities 22 20,533 1,223 1,119 7,154 30,051
Investment securities sold subject to sale and repurchase transactions - 2,562 17 - 195 2,774
1 These debt securities, which are listed or registered on a recognised UK exchange or elsewhere, are in illiquid markets.

Standard Chartered PLC – Notes continued
87
17. Investment securities continued
30.06.10
Debt securities
Held-to-maturity
Available-for-sale
Loans and receivables
Equity shares
Treasury bills Total
$million $million $million $million $million $million
Issued by public bodies: Government securities 31 19,563 389 Other public sector securities - 675 -
31 20,238 389
Issued by banks: Certificates of deposit - 4,532 1,100 Other debt securities - 15,515 1,337
- 20,047 2,437
Issued by corporate entities and other issuers : Other debt securities - 7,967 3,149
Total debt securities 31 48,252 5,975
Of which: Listed on a recognised UK exchange - 1,470 327 1 182 - 1,979 Listed elsewhere 27 15,324 878 1 343 6,898 23,470 Unlisted 4 31,458 4,770 1,349 13,757 51,338
31 48,252 5,975 1,874 20,655 76,787
Market value of listed securities 27 16,794 1,208 525 6,898 25,452
Investment securities subject to sale and repurchase transactions - 734 16 - 688 1,438
1 These debt securities, which are listed or registered on a recognised UK exchange or elsewhere, are in illiquid markets.
31.12.10
Debt securities
Held-to-maturity
Available-for-sale
Loans and receivables
Equity shares
Treasury bills Total
$million $million $million $million $million $million
Issued by public bodies: Government securities 25 20,776 388 Other public sector securities - 629 -
25 21,405 388
Issued by banks: Certificates of deposit - 4,670 44 Other debt securities - 15,135 864
- 19,805 908
Issued by corporate entities and other issuers: Other debt securities - 9,345 3,508
Total debt securities 25 50,555 4,804
Of which: Listed on a recognised UK exchange - 1,443 285 1 140 - 1,868 Listed elsewhere 25 14,937 1,081 1 830 6,574 23,447 Unlisted - 34,175 3,438 1,547 11,321 50,481
25 50,555 4,804 2,517 17,895 75,796
Market value of listed securities 25 16,380 1,348 970 6,574 25,297 Investment securities subject to sale and repurchase transactions - 430 73 - 1,090 1,593
1 These debt securities, which are listed or registered on a recognised UK exchange or elsewhere, are in illiquid markets.
Equity shares held largely comprise investments in corporates.

Standard Chartered PLC – Notes continued
88
17. Investment securities continued
The change in the carrying amount of investment securities comprised:
30.06.11 30.06.10
Debt
securitiesEquity shares
Treasury bills Total
Debt securities
Equity shares
Treasury bills Total
$million $million $million $million $million $million $million $million
Balances held at 1 January 55,384 2,517 17,895 75,796 55,121 1,649 18,958 75,728 Exchange translation differences 1,085 42 494 1,621 (329) (15) (386) (730)Additions 39,467 395 23,484 63,346 36,979 213 19,397 56,589 Maturities and disposals (37,388) (336) (21,766) (59,490) (37,847) (48) (17,400) (55,295)Impairment, net of recoveries on disposal (83) 9 - (74) (15) (4) - (19)Changes in fair value (including the effect of fair value hedging) 65 77 (43) 99 412 79 45 536 Amortisation of discounts and premiums (38) - 84 46 (63) - 41 (22)
Balances held at 30 June 58,492 2,704 20,148 81,344 54,258 1,874 20,655 76,787
31.12.10
Debt
securities Equity shares
Treasury bills Total
$million $million $million $million
Balances held at 1 July 54,258 1,874 20,655 76,787 Exchange translation differences 1,732 25 869 2,626 Additions 41,246 544 15,697 57,487 Maturities and disposals (41,748) (231) (19,384) (61,363)Impairment, net of recoveries on disposal (9) (5) - (14)Changes in fair value (including the effect of fair value hedging) (57) 310 1 254 Amortisation of discounts and premiums (38) - 57 19
Balances held at 31 December 55,384 2,517 17,895 75,796 At 30 June 2011, unamortised premiums on debt securities held for investment purposes amounted to $404 million (30 June 2010: $535 million, 31 December 2010: $430 million) and unamortised discounts amounted to $383 million (30 June 2010: $499 million, 31 December 2010: $397 million). Income from listed equity shares amounted to $13 million (30 June 2010: $6 million, 31 December 2010: $2 million) and income from unlisted equity shares amounted to $22 million (30 June 2010: $14 million, 31 December 2010: $31 million).
18. Other assets
30.06.11 30.06.10 31.12.10
$million $million $million
Financial assets held at amortised cost (note 12)
Hong Kong SAR Government certificates of indebtedness (note 23) 4,052 3,549 4,063 Cash collateral 6,294 6,267 5,620 Acceptances and endorsements 5,617 4,355 4,847 Unsettled trades and other financial assets 6,281 3,625 5,098
22,244 17,796 19,628 Non-financial assets Commodities 3,091 2,627 2,852 Other assets 3,456 4,348 2,876
Total other assets 28,791 24,771 25,356
The Hong Kong SAR Government certificates of indebtedness are subordinated to the claims of other parties in respect of bank notes issued.

Standard Chartered PLC – Notes continued
89
19. Business Combinations 2011 acquisitions
Following the finalisation of the provisional fair values relating to deferred tax in respect of the Group’s acquisition of the custody business of Barclays Bank PLC across various locations in Africa in 2010, the fair value of net assets acquired decreased by $18 million increasing goodwill by the same amount. Prior period numbers have been restated accordingly.
On 8 April 2011, the Group acquired 100 per cent interest in GE Money Pte Limited, a leading specialist in auto and unsecured personal loans in Singapore, for a total cash consideration of $695 million, recognising goodwill of $208 million.
If the acquisition had occurred on 1 January 2011 the operating income of the Group would have been approximately $8,788 million and profit before taxation would have been $3,651 million.
The assets and liabilities arising from this acquisition is as follows:
Fair value
Acquiree’s carrying amount
$million $million
Loans and advances to banks 16 16 Loans and advances to customers 1,536 1,525 Prepayments and accrued income 1 1 Intangibles other than goodwill 4 - Goodwill - 35 Property, plant and equipment 1 1 Other assets 2 2
Total assets 1,560 1,580
Other liabilities 1,067 1,067 Accruals and deferred income 6 6
Total liabilities 1,073 1,073
Net assets acquired 487 507
Purchase consideration settled in cash (695) Cash and cash equivalents in subsidiary acquired -
Cash outflow on acquisition (695)
Purchase consideration: Cash paid 695 Less: Fair value of net assets acquired (487)
Goodwill 208
Intangible assets acquired: Customer relationships 4
Total 4
Contribution from acquisition to 30 June 2011: Operating income 18 Profit before taxation 13 Goodwill arising on the acquisition is attributable to the synergies expected to arise from integration with the Group, together with the distribution network acquired. The primary reason for the acquisition is to enhance capability and broaden product offering to customers.
The fair value amounts contain some provisional balances which will be finalised within 12 months of the acquisition date.
The fair value of loans to banks is $16 million. The gross contractual amount due is $16 million, which is expected to be collected.
The fair value of loans to customers is $1,536 million. The gross contractual amount due is $1,554 million, of which $14 million is the best estimate of the contractual cash flows not expected to be collected.
Acquisition related costs of $0.5 million are included within operating expenses.

Standard Chartered PLC – Notes continued
90
19. Business Combinations continued
2010 acquisitions
On 12 April 2010, the Group acquired 100 per cent of the consumer finance business of GE Capital (Hong Kong) Limited, a Hong Kong (restricted licence) banking company. The Group purchased this interest for $144 million, recognising goodwill of $3 million.
On 2 August 2010, the Group acquired 100 per cent of the consumer finance business of GE Commercial Financing (Singapore) Limited in Singapore. The businesses were acquired for $70 million and goodwill of $14 million was recognised.
On 1 October 2010 the Group purchased the remaining 25.1 per cent interest in Standard Chartered STCI Capital Markets (STCI) for $18 million. By virtue of this transaction STCI became a subsidiary of the Group. The fair value of the 74.9 per cent interest held by the Group at 1 October 2010, which is included in the purchase consideration, was $55 million. As required by IFRS 3 – ‘Business Combinations’, the Group recognised a gain (net of foreign exchange) of $4 million within ‘Other operating income’ from remeasuring the 74.9 per cent interest held by the Group to fair value. Following this transaction, goodwill relating to STCI increased to $75 million.
Between 31 October 2010 and 5 December 2010 the Group acquired the custody business of Barclays Bank PLC across various locations in Africa. The business was acquired for $130 million and goodwill of $21 million was recognised.
If the acquisitions had occurred on 1 January 2010, the operating income of the Group would have been approximately $16,099 million and profit before taxation would have been approximately $6,135 million.
The assets and liabilities arising from the acquisitions were as follows:
Fair value Acquiree's
carrying amount
$million $million
Cash and balances at central banks 20 20 Loans and advances to banks 6 6 Loans and advances to customers 894 901 Investment securities 2 2 Intangibles other than goodwill 112 -Deferred tax assets 4 12 Other assets 16 26
Total assets 1,054 967
Other liabilities 737 736 Accruals and deferred income 11 11
Total liabilities 748 747
Net assets acquired 306 220
Purchase consideration settled in cash (364) Cash and cash equivalents in subsidiary acquired 20
Cash outflow on acquisition (344)
Purchase consideration : Cash paid 364 Fair Value of interest held prior to change in control 55 Fair value of net assets acquired (306)
Goodwill 113
Intangible assets acquired: Customer relationships 112
Total 112
Contribution from acquisition date to 31 December 2010: Operating income 22 Profit before taxation 8
Goodwill arising on the acquisitions is attributable to the synergies expected to arise from their integration with the Group and to those intangibles which are not recognised separately, such as the acquired workforce. The primary reason for its acquisition was to enhance capability and for strategic intent.
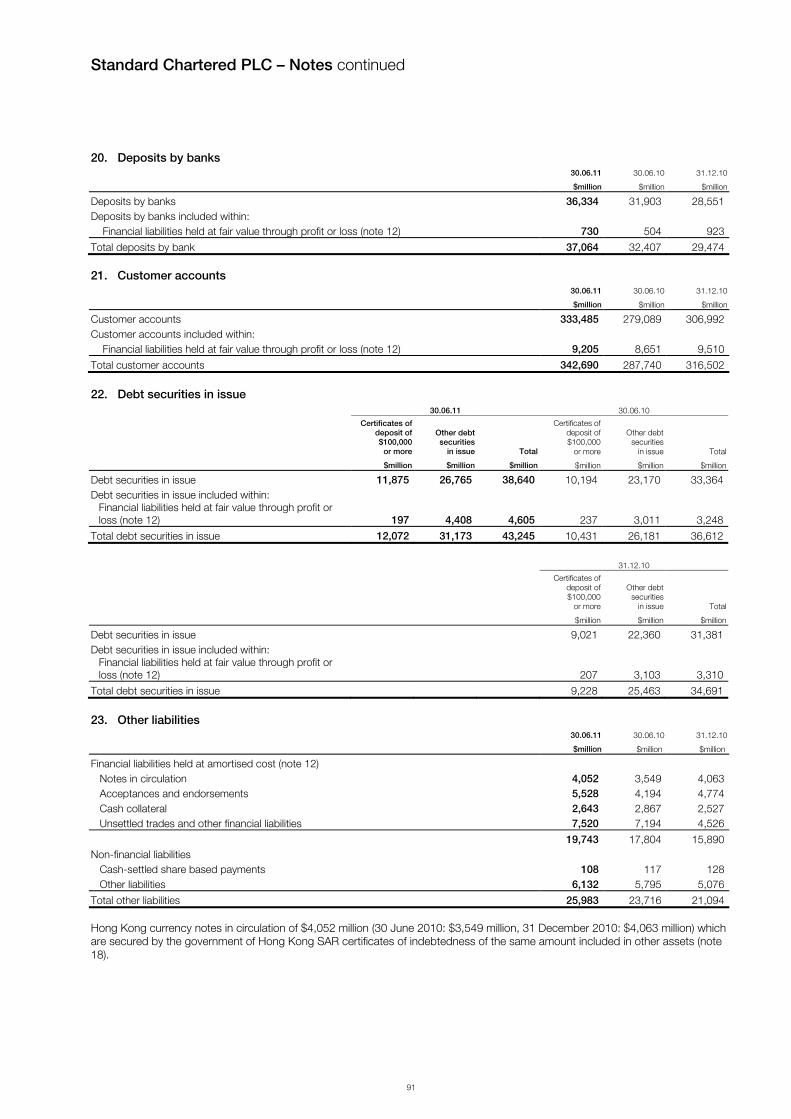
Standard Chartered PLC – Notes continued
91
20. Deposits by banks 30.06.11 30.06.10 31.12.10
$million $million $million
Deposits by banks 36,334 31,903 28,551 Deposits by banks included within: Financial liabilities held at fair value through profit or loss (note 12) 730 504 923
Total deposits by bank 37,064 32,407 29,474 21. Customer accounts
30.06.11 30.06.10 31.12.10
$million $million $million
Customer accounts 333,485 279,089 306,992 Customer accounts included within: Financial liabilities held at fair value through profit or loss (note 12) 9,205 8,651 9,510
Total customer accounts 342,690 287,740 316,502 22. Debt securities in issue 30.06.11 30.06.10
Certificates of deposit of $100,000
or more
Other debt securities
in issue Total
Certificates of deposit of $100,000
or more
Other debt securities
in issue Total
$million $million $million $million $million $million
Debt securities in issue 11,875 26,765 38,640 10,194 23,170 33,364 Debt securities in issue included within:
Financial liabilities held at fair value through profit or loss (note 12) 197 4,408 4,605 237 3,011 3,248
Total debt securities in issue 12,072 31,173 43,245 10,431 26,181 36,612 31.12.10
Certificates of deposit of $100,000
or more
Other debt securities
in issue Total
$million $million $million
Debt securities in issue 9,021 22,360 31,381 Debt securities in issue included within:
Financial liabilities held at fair value through profit or loss (note 12) 207 3,103 3,310
Total debt securities in issue 9,228 25,463 34,691 23. Other liabilities
30.06.11 30.06.10 31.12.10
$million $million $million
Financial liabilities held at amortised cost (note 12)
Notes in circulation 4,052 3,549 4,063 Acceptances and endorsements 5,528 4,194 4,774 Cash collateral 2,643 2,867 2,527 Unsettled trades and other financial liabilities 7,520 7,194 4,526
19,743 17,804 15,890 Non-financial liabilities Cash-settled share based payments 108 117 128 Other liabilities 6,132 5,795 5,076
Total other liabilities 25,983 23,716 21,094 Hong Kong currency notes in circulation of $4,052 million (30 June 2010: $3,549 million, 31 December 2010: $4,063 million) which are secured by the government of Hong Kong SAR certificates of indebtedness of the same amount included in other assets (note 18).

Standard Chartered PLC – Notes continued
92
24. Subordinated liabilities and other borrowed funds 30.06.11 30.06.10 31.12.10
$million $million $million
Subordinated liabilities and other borrowed funds 16,004 15,555 15,939
All subordinated liabilities are unsecured, unguaranteed and subordinated to the claims of other creditors including without limitation, customer deposits and deposits by banks. The Group has the right to settle these debt instruments in certain circumstances as set out in the contractual agreements.
Of the total subordinated liabilities and other borrowings, $11,971 million is at fixed interest rates (30 June 2010: $11,354 million, 31 December 2010: $11,611 million).
On 24 May 2011, Standard Chartered Bank (Botswana) Limited issued $70 million floating notes due June 2020.
During 2011, PT Bank Permata Tbk issued IDR 748 billion floating subordinated notes.
During January 2011, Standard Chartered (Pakistan) Limited redeemed the remaining balance of its PKR750 million floating rates note 2011 of PKR 187 million.
On 21 Jan 2011, Standard Chartered First Bank Korea Limited redeemed its KRW 3 billion 6.11 per cent notes in full.
On 9 June 2011, Standard Chartered Bank exercised its right to redeem its $500 million subordinated floating rate notes in full on the first optional call date.
On 20 June 2011, Standard Chartered Bank (Botswana) Limited redeemed BWP50 million fixed rates notes in full.
25. Retirement benefit obligations
Retirement benefit obligations comprise: 30.06.11 30.06.10 31.12.10
$million $million $million
Total market value of assets 2,262 1,981 2,149 Present value of the schemes' liabilities (2,559) (2,443) (2,446)
Defined benefit schemes obligation (297) (462) (297)Defined contribution schemes obligation (15) (8) (13)
Net book amount (312) (470) (310)
Retirement benefit charge comprises:
6 months
ended 6 months
ended6 months
ended
30.06.11 30.06.10 31.12.10
$million $million $million
Defined benefit schemes 58 47 (8)Defined contribution schemes 95 68 75
Charge against profit 153 115 67 The UK government announced on 8 July 2010 that it would extend the use of the Consumer Prices Index (CPI) for increases to pensions in deferment and payment from the public sector to private sector occupational pension arrangements rather than the Retail Prices Index (RPI). It is expected that CPI increases will be around 0.9 per cent per annum lower than RPI. As the UK pension scheme rules link some increases directly to the index used by the government, the changes in legislation means that these will be automatically linked to CPI. As at 31 December 2010, the resulting reduction in liability of $54 million was recognised in the income statement as a negative past service cost. In the case of discretionary pension increases, the change is not automatic but the Group still expects that future discretionary increases will be referenced to CPI. A reduction in liability of $100 million at 31 December 2010 was treated as a change in assumptions and recognised in other comprehensive income.

Standard Chartered PLC – Notes continued
93
25. Retirement benefit obligations continued
The pension cost for defined benefit schemes was:
6 months ended
30.06.11
6 months ended
30.06.10
6 months ended
31.12.10
$million $million $million
Current service cost 54 47 41 Past service cost 2 3 (56)Gain on settlements and curtailments - (10) - Expected return on pension scheme assets (59) (53) (58)Interest on pension scheme liabilities 61 60 65
Total charge/(credit) to profit before deduction of tax 58 47 (8)
(Gain)/loss on assets below expected return (41) 20 (79)Experience loss/(gain) on liabilities - 22 (46)
Total (gain)/loss recognised directly in statement of comprehensive income before tax (41) 42 (125)Deferred taxation 13 (8) 25
Total (gain)/loss after tax (28) 34 (100) 26. Share capital, reserves and own shares
Number of ordinary shares
Ordinary share capital
Preference share capital Total
millions $million $million $million
At 1 January 2010 2,025 1,013 - 1,013 Capitalised on scrip dividend 18 9 - 9 Shares issued 30 15 - 15
At 30 June 2010 2,073 1,037 - 1,037 Capitalised on scrip dividend 10 5 - 5 Shares issued 265 132 - 132
At 31 December 2010 2,348 1,174 - 1,174 Capitalised on scrip dividend 23 12 - 12 Shares issued 8 4 - 4
At 30 June 2011 2,379 1,190 - 1,190
2011 On 11 May 2011, the Company issued 23,196,890 new ordinary shares instead of the 2010 final dividend.
During the period 7,764,575 shares were issued under employee share plans at prices between nil and 1463 pence.
2010 On 11 June 2010, the Group completed the listing of Indian Depository Receipts (IDRs) on the Bombay Stock Exchange and National Stock Exchanges of India by issuing 24,000,000 shares of the Company against 240,000,000 IDRs (at a ratio of 10 IDRs representing 1 Company share). The shares were issued at a price of Indian Rupees (INR)104 per IDR representing a 6 per cent discount to the Company’s closing share price of 1637 pence on 28 May 2010, which contributed $504 million towards the Group’s capital, net of expenses of $27 million. The proceeds of this listing will be used by the Group in the ordinary course of business.
On 13 May 2010, the Company issued 18,190,898 new ordinary shares instead of the 2009 final dividend. On 4 October 2010 the Company issued 9,688,558 new ordinary shares instead of the 2010 Interim dividend.
During the year 10,550,826 shares were issued under employee share plans at prices between nil and 1146 pence.
On 13 October 2010, the Company announced the issue of 260,525,763 new ordinary shares by way of rights to qualifying shareholders at 1280 pence per new ordinary share. The issue was on the basis of 1 ordinary share for every 8 ordinary shares held on 21 October 2010. The rights issue raised $5.2 billion in additional capital for the Company, net of expenses of $122 million. The proceeds will be used in the ordinary course of business. The rights issue used a cash box structure involving a Jersey subsidiary (JerseyCo) which was fully owned by the Company prior to the transaction. In return for an issue of shares by the Company to the investors, the net proceeds of the share issue were paid to JerseyCo. Pursuant to the issue of those shares, the Company acquired the remaining share capital of JerseyCo, being all of its redeemable preference shares it did not own. Under this structure merger relief applies under Section 612 of the Companies Act 2006 which provides relief from the requirements under Section 610 of the Companies Act 2006 to create a share premium account. JerseyCo then redeemed its redeemable shares in exchange for the share issue proceeds.

Standard Chartered PLC – Notes continued
94
26. Share Capital, reserves and own shares continued
Own shares
Bedell Cristin Trustees Limited is trustee of both the 1995 Employees’ Share Ownership Plan Trust (the 1995 trust), which is an employee benefit trust used in conjunction with some of the Group’s employee share schemes, and of the Standard Chartered 2004 Employee Benefit Trust (the 2004 trust) which is an employee benefit trust used in conjunction with the Group’s deferred bonus plan. The trustee has agreed to satisfy a number of awards made under the employee share schemes and the deferred bonus plan through the relevant employee benefit trust. As part of these arrangements Group companies fund the trust, from time to time, to enable the trustee to acquire shares to satisfy these awards. All shares have been acquired through the London Stock Exchange.
Except as disclosed, neither the Company nor any of its subsidiaries has bought, sold or redeemed any securities of the company listed on The Stock Exchange of Hong Kong Limited during the year. Details of the shares purchased and held by the trusts are set out below.
1995 Trust 2004 Trust Total
Number of shares 30.06.11 30.06.10 31.12.10 30.06.11 30.06.10 31.12.10 30.06.11 30.06.10 31.12.10
Shares purchased during the period 4,500,000 6,240,000 6,856,494 1,136,086 382,516 401,018 5,636,086 6,622,516 7,257,512
Market value of shares purchased ($ million) 117 168 182 29 10 10 146 178 192
Shares held at the end of period 12,953,132 13,209,573 13,429,212 282,990 523,867 539,605 13,236,122 13,733,440 13,968,817
Maximum number of shares during the period 15,590,159 14,034,284 13,971,029 27. Non-controlling interests
$300m 7.267%
Hybrid Tier 1 Securities
Other non-controlling
interests Total
$million $million $million
At 1 January 2010 324 256 580
Income in equity attributable to non-controlling interests - 15 15 Other profits attributable to non-controlling interests 9 24 33
Comprehensive income for the period 9 39 48 Distributions (12) (20) (32)Other decreases - (1) (1)
At 30 June 2010 321 274 595
Income in equity attributable to non-controlling interests - 15 15 Other profits attributable to non-controlling interests 10 39 49
Comprehensive income for the period 10 54 64 Distributions (10) (12) (22)Other increases - 16 16
At 31 December 2010 321 332 653
Expense in equity attributable to non-controlling interests - (14) (14)Other profits attributable to non-controlling interests 11 27 38
Comprehensive income for the period 11 13 24 Distributions (11) (34) (45)Other decreases - (4) (4)
At 30 June 2011 321 307 628

Standard Chartered PLC – Notes continued
95
28. Cash flow statement
Adjustment for non-cash items and other adjustments included within the income statement
30.06.11 30.06.10 1 31.12.10
$million
$million $million
Interest expense on subordinated liabilities
210 209 221 Depreciation and amortisation
300 271 288
Gains less losses on disposal of financial instruments:
Available-for-sale
(60) (73) (211)
Loan and receivables
(10) - (16)Recoveries of acquisition fair values and discount unwind (38) (45) (46)Gain on disposal of property, plant and equipment
(10) (25) (40)
Movement in fair value hedges on available-for-sale assets (23) (50) 46 Amortisation of discounts and premiums of investment securities (46) 22 (19)Pension costs for defined benefit schemes
58 47 (8)
Share based payment costs
150 145 245
Impairment losses on loans and advances and other credit risk provisions
412 437 446 Other impairment
72 50 26
Profit from associates
(33) (23) (19)Gain arising on change of control - - (4)
982 965 909
Change in operating assets
30.06.11 30.06.10 31.12.10 1
$million $million $million
Increase in derivative financial instruments
(1,973) (6,587) (2,149)
Net increase in debt securities, treasury bills and equity shares held at fair value through profit
or loss (1,537) (10,736) (2,818)Net increase in loans and advances to banks and customers (29,388) (32,646) (17,873)Decrease/(increase) in prepayments and accrued income 12 (895) 2,060 Decrease/(increase) in other assets
1,266 (7,115) (3,593)
(31,620) (57,979) (24,373)
Change in operating liabilities
30.06.11 30.06.10 1 31.12.10 1
$million
$million $million
Increase in derivative financial instruments
1,510 7,042 2,586
Net increase in deposits from banks, customer accounts, debt securities in issue, Hong Kong notes in circulation and short positions
29,890 29,734 14,145
(Decrease)/increase in accruals and deferred income (698) (518) 816 Increase/(decrease) in other liabilities
2,634 8,591 (3,104)
33,336 44,849 14,443
1 Amounts have been restated as explained in note 32
29. Cash and cash equivalents For the purposes of the cash flow statement, cash and cash equivalents comprise the following balances with less than three months maturity from the date of acquisition. Restricted balances comprise minimum balances required to be held at central banks.
30.06.11 30.06.10 31.12.10
$million $million $million
Cash and balances at central banks 43,689 29,694 32,724 Less restricted balances (9,894) (5,932) (7,385)Treasury bills and other eligible bills 4,617 7,434 4,770 Loans and advances to banks 21,262 21,458 26,161 Trading securities 3,720 3,514 3,464
63,394 56,168 59,734

Standard Chartered PLC – Notes continued
96
30. Contingent liabilities and commitments
The table below shows the contract or underlying principal amounts of unmatured off-balance sheet transactions at the balance sheet date. The contract or underlying principal amounts indicate the volume of business outstanding and do not represent amounts at risk.
30.06.11 30.06.10 31.12.10
$million $million $million
Contingent liabilities1 Guarantees and irrevocable letters of credit 28,994 31,639 31,765
Other contingent liabilities 12,796 7,811 10,039
41,790 39,450 41,804
Commitments1 Documentary credits and short term trade-related transactions 9,455 7,556 7,505
Forward asset purchases and forward deposits placed 1,331 276 877
Undrawn formal standby facilities, credit lines and other commitments to lend: One year and over 27,143 20,931 24,014
Less than one year 24,529 24,206 21,610
Unconditionally cancellable 85,332 74,9952 80,5252
147,790 127,964 134,531
1 Includes amounts relating to the Group's share of its joint ventures. 2 Amounts have been restated to include facilities extended to certain Consumer Banking customers.
31. Repurchase and reverse repurchase agreements
The Group enters into collateralised reverse repurchase and repurchase agreements and securities borrowing and lending transactions. It also receives securities as collateral for commercial lending.
Balance sheet assets - Reverse repurchase agreements 30.06.11 30.06.10 31.12.10
$million $million $million
Banks 10,771 2,773 10,740 Customers 2,090 1,998 3,540
12,861 4,771 14,280
Under reverse repurchase and securities borrowing arrangements, the Group obtains securities on terms which permit it to repledge or resell the securities to others. Amounts on such terms are:
30.06.11 30.06.10 31.12.10
$million $million $million
Securities and collateral which can be repledged or sold (at fair value) 10,452 4,428 14,168
Thereof repledged/transferred to others for financing activities, to satisfy commitments under short sale transactions or liabilities under sale and repurchase agreements (at fair value) 1,228 199 2,153
Balance sheet liabilities - Repurchase agreements 30.06.11 30.06.10 31.12.10
$million $million $million
Banks 2,580 2,190 1,707 Customers 1,419 904 1,305
3,999 3,094 3,012 Collateral pledged against these liabilities is disclosed in note 13, note 16 and note 17. The terms and conditions relating to the collateral pledged typically permits the collateral to be sold or repledged, subject to the obligation to return the collateral at the end of the agreement.

Standard Chartered PLC – Notes continued
97
32. Restatement of prior periods Earnings per share On 13 October 2010 the Group announced the issue of 260,525,763 new ordinary shares by way of rights to qualifying shareholders at 1280 pence per share. The issue was made as 1 share for every 8 held on 21 October 2010. As required by International Accounting Standard 33 "Earnings per share" (IAS 33) the Group has adjusted the 2009 basic, diluted, normalised basic and normalised diluted earnings per share with the bonus element included within the rights issue.
As reported at 30 June 2010 Restated
Restated at30 June 2010
cents cents cents
Basic earnings per ordinary share 103.4 (3.8) 99.6
Diluted earnings per ordinary share 101.9 (3.7) 98.2
Normalised basic earnings per ordinary share 104.9 (3.8) 101.1
Normalised diluted earnings per ordinary share 103.4 (3.7) 99.7
Dividend per share
The dividend per share amounts in the table below have been adjusted for the bonus element included within the 2010 rights issue in line with the restatement of prior period earnings per share amounts required by IAS 33.
As reported Restated As Restated
cents cents cents
Dividend per share – Final dividend 2009 44.80 (1.64) 43.16
Dividend per share – Interim dividend 2010 23.35 (0.85) 22.50
Cash flow statement The cash flow statement has been re-presented as follows: Share based payment costs have been reclassified under 'Non-cash items included within income statement', previously these
costs were included in ‘change in operating liabilities’; Cash flow information relating to senior debts has been reclassified from 'Cash flows from operating activities' to 'Net cash from
financing activities.
As reported at
30. 06. 2010 Reclassified Re-presented at
30.06.2010
$million $million $million
Non-cash items included within income statement 820 145 965
Change in operating liabilities 46,115 (1,266) 44,849
Net cash used in operating activities (8,801) (1,121) (9,922)
Interest paid on senior debts - (569) (569)
Gross proceeds from issue of senior debts - 6,784 6,784
Repayment of senior debts - (5,094) (5,094)
Net cash used in financing activities (1,483) 1,121 (362) Acquisitions
Provisional balances relating to the Group’s acquisition of the custody business from Barclays Bank PLC in 2010 have been finalised. As a result, the Group has revised the fair value of the deferred tax balances by $18 million. Goodwill at acquisition has been restated to $39 million.
As reported Restated at 31.12.10 Restated 31.12.10
Balance sheet $million $million $million
Goodwill and intangible assets 6,980 18 6,998
Deferred tax liabilities 165 18 183
Tangible net asset value per share (cents) 1,274.1 (0.7) 1,273.4
Cash flow statement
Change in operating assets (24,355) (18) (24,373)
Change in operating liabilities 14,425 18 14,443

Standard Chartered PLC – Notes continued
98
33. Special purpose entities
The Group uses Special Purpose Entities (SPEs) in the normal course of business across a variety of activities. SPEs are established for specific limited purposes and take a number of legal forms. The main types of activities for which the Group utilises SPEs cover synthetic credit default swaps for portfolio management purposes, managed investment funds (including specialised principal finance funds) and structured finance.
SPEs are consolidated into the Group’s financial statements where the Group bears the majority of the residual risk or reward. Most of the Group’s consolidated SPEs are in respect of the Group’s securitised portfolios of residential mortgages (see page 25 of the Risk review).
The total assets of unconsolidated SPEs in which the Group has an interest are set out below.
30.06.11 30.06.10 31.12.10
Total assets
Maximum exposure
Total assets
Maximum exposure
Total assets
Maximum exposure
$million $million $million $million $million $million
Portfolio management vehicles 976 166 1,970 305 2,083 262 Principal Finance Funds1 999 138 988 130 995 134 Structured Finance 308 101 932 590 948 690
Total 2,283 405 3,890 1,025 4,026 1,086
1 Committed capital for these funds is $375 million (30 June 2010 and 31 December 2010: $375 million) of which $129 million (30 June 2010: $130 million; 31 December 2010: $129 million) have been drawn down net of provisions for impairment of $34 million (30 June 2010: $nil million; 31 December 2010: $33million).
For the purposes of portfolio management, the Group has entered into synthetic credit default swaps with note-issuing SPEs. The referenced assets remain on the Group’s balance sheet as the credit risk is not transferred to these SPEs. The Group’s exposure arises from (a) the capitalised start-up costs in respect of the swap vehicles and (b) interest in the first loss notes and investment in a minimal portion of the mezzanine and senior rated notes issued by the note issuing SPEs. The proceeds of the notes issuance are typically invested in AAA-rated Government securities, which are used to collateralise the SPE’s swap obligations to the Group, and to repay the principal to investors at maturity. The SPEs reimburse the Group on actual losses incurred, through the realisation of the collateral security. Correspondingly, the SPEs write down the notes issued by an equal amount of the losses incurred, in reverse order of seniority. All the funding is committed for the life of these vehicles and hence the Group has no indirect exposure in respect of the vehicles’ liquidity position. During the period certain portfolios have matured leading to a decrease in the Group’s exposure to the related SPEs.
The Group’s exposure to Principal Finance Funds represents committed or invested capital in unleveraged investment funds, primarily investing in pan-Asian infrastructure and real estate.
Structured finance comprises interests in transactions that the Group or, more usually, a customer has structured, using one or more SPEs, which provide beneficial arrangements for customers. The Group’s exposure primarily represents the provision of funding to these structures as a financial intermediary, for which it receives a lender’s return. The transactions largely related to the provision of ship finance. The Group’s exposure to unconsolidated structured finance SPEs has reduced during the period through changes to underlying structures that have led to the consolidation of certain SPEs.
The Group has reputational risk in respect of certain portfolio management vehicles and investment funds either because the Group is the arranger and lead manager or because the SPEs have Standard Chartered branding.
34. Related party transactions Directors, connected persons or officers There were no material transactions, arrangements or agreements outstanding for any director, connected person or officer of the Company which have to be disclosed under the Act, the rules of the UK Listing Authority or the HK Listing Rules.
Associates The Group has loans and advances to Merchant Solutions Private Limited totalling $30 million at 30 June 2011 (30 June 2010: $27 million; 31 December 2010: $42 million) and deposits of $19 million (30 June 2010: $12 million and 31 December 2010: $34 million). The Group has loans and advances to China Bohai Bank of $1 million at 30 June 2011 (30 June 2010: $5 million and 31 December 2010: $6 million) and deposits of $14 million (30 June 2010: $1 million and 31 December 2010: $2 million). During 2011, China Bohai Bank and Asia Commercial Bank undertook rights issues to which the Group subscribed, increasing its investment by $182 million and $12 million respectively.
Except as disclosed, the Group did not have any other amounts due to or from associate investments.
Joint ventures The Group has loans and advances to PT Bank Permata Tbk totalling $6 million at 30 June 2011 (30 June 2010: $6 million; 31 December 2010: $2 million), and deposits of $8 million (30 June 2010: $6 million; 31 December 2010: $24 million).
The Group has an investment in subordinated debt issued by PT Bank Permata Tbk of $138 million (30 June 2010: $127 million and 31 December 2010: $127 million).

Standard Chartered PLC – Notes continued
99
On 3 August 2011, the Directors declared an interim dividend of 24.75 cents per share.
The UK Finance (No.3) Act 2011 (the 2011 Act) was deemed to be substantively enacted on 5 July 2011 and was enacted on 19 July 2011. Accordingly none of its provisions have been reflected in this half year report.
The 2011 Act introduced a levy on certain qualifying liabilities of the Group with effect from January 2011, based on the balance sheet at the end of the financial year. The levy, which will not be deductible for corporation tax, will be charged on total liabilities excluding Tier 1 capital, insured or guaranteed retail deposits and repos secured on certain sovereign debt. There will also be a deduction from chargeable liabilities for an amount equal to certain high quality liquid assets and an allowance of GBP 20 billion before the levy is due. The rate of the levy for 2011 has been set at 0.075 per cent of qualifying liabilities, with a lower rate of 0.0375 per cent applied to liabilities with a maturity greater than one year and any deposits not otherwise excluded from the scope of levy (except for those from financial institutions and financial traders). The Group estimates that the liability in respect of 2011 would be between $180 million and $210 million. No amount has been recognised in these financial statements for the levy as the 2011 Act was not substantively enacted as at 30 June 2011.
If the Bank levy had been included in these interim financial statements, the impact would be as follows:
30.06.2011
(Excluding Bank Levy)
Bank Levy Impact
30.06.2011 (Including
Bank Levy)
Profit before tax ($million) 3,636 (95.0) 3,541
Normalised earnings per share (cents) 105.2 (4.0) 101.2
Normalised return on equity (per cent) 13.0 (0.5) 12.5
On 22 June 2010, the UK government announced its intention to reduce the UK corporation tax rate from 28 per cent to 27 per cent in 2011-12, with further reductions to 26 percent in 2012-13, 25 percent in 2013-14 and 24 percent in 2014-15. On 23 March 2011 the UK government announced a reduction in the UK corporation tax rate by a further 1 per cent with effect from 1st April 2011 in addition to the four annual reductions announced in June 2010. As of 30 June 2011, only the 26 per cent tax rate change for 2011-12 had been substantively enacted. Had the changes of UK corporation tax rates for 2012-2015 been substantively enacted at that date, the Group estimates that the UK deferred tax assets for 2011 would have reduced by a further $35 million.
The 2011 Act provides for the profits of foreign branches of a UK company to be exempt from UK corporation tax where that company makes an election for exemption. Once made, an election is irrevocable, applies to all foreign branches of the company and has effect from the start of the first accounting period following that in which the election is made. Standard Chartered Bank will therefore be able to elect on or before 31 December 2011 for its foreign branches to be exempt from UK taxation with effect from 1 January 2012. This legislation had not been substantively enacted as at 30 June 2011. Had it been substantively enacted at that date and had Standard Chartered Bank made an election for its foreign branches to be exempt from UK taxation with effect from 1 January 2012, the Group estimates that the UK deferred tax asset would have reduced by $100 million as at 30 June 2011.
The information in this half year report is unaudited and does not constitute statutory accounts within the meaning of section 434 of the Companies Act 2006. This document was approved by the Board on 3 August 2011. The statutory accounts for the year ended 31 December 2010 have been reported on by the Company's auditors and delivered to the Registrar of Companies in England and Wales. The report of the auditors was (i) unqualified, (ii) did not include a reference to any matters to which the auditors drew attention by way of emphasis without qualifying their report, and (iii) did not contain a statement under section 498 of the Companies Act 2006.
The directors confirm that, throughout the period, the Company has complied with the provisions of Appendix 14 of the Listing Rules of the Hong Kong Stock Exchange Limited (HK Listing Rules). The directors also confirm that the announcement of these results has been reviewed by the Company’s Audit Committee. The Company confirms that it has adopted a code of conduct regarding securities transactions by directors on terms no less exacting than required by Appendix 10 of the Listing Rules of the Hong Kong Stock Exchange, and that the directors of the Company have complied with this code of conduct throughout the period.
38. UK and Hong Kong accounting requirementsAs required by the HK Listing Rules, an explanation of the differences in accounting practices between EU endorsed IFRS and Hong Kong Financial Reporting Standards is required to be disclosed. There would be no significant differences had these accounts been prepared in accordance with Hong Kong Financial Reporting Standards. EU endorsed IFRS may differ from IFRSs published by the International Accounting Standards Board if a standard has not been endorsed by the EU.
35. Post balance sheet events
36. Statutory accounts
37. Corporate governance

Standard Chartered PLC – Statement of directors’ responsibilities
100
The directors confirm that this condensed consolidated interim financial information has been prepared in accordance with IAS 34 ‘Interim Financial Reporting’, as adopted by the European Union (EU); that the preparation of the financial statements on a going concern basis continues to be appropriate; and that the interim management report includes a fair review of the information required by the Disclosure and Transparency Rules 4.2.7 and 4.2.8, namely:
(a) an indication of important events that have occurred during the first six months and their impact on the condensed Interim financial statements, and a description of the principal risks and uncertainties for the remaining six months of the financial year; and
(b) material related party transactions in the first six months ended 30 June 2011 and any material changes in the related party transactions described in the last annual report of the Group.
By order of the Board
R H Meddings Group Finance Director
3 August 2011

Independent review report by KPMG Audit Plc to Standard Chartered PLC
101
Introduction We have been engaged by the Company to review the condensed set of financial statements in the half-yearly financial report for the six-months ended 30 June 2011 set out on pages 56 to 99, which comprises the condensed consolidated interim balance sheet, the condensed consolidated interim income statement, the condensed consolidated interim statement of comprehensive income, the condensed consolidated interim statement of changes in equity, the condensed consolidated interim cash flow statement, and the related explanatory notes. We have read the other information contained in the half-yearly financial report and considered whether it contains any apparent misstatements or material inconsistencies with the information in the condensed set of financial statements.
This report is made solely to the Company in accordance with the terms of our engagement to assist the Company in meeting the requirements of the Disclosure and Transparency Rules (the DTR) of the UK’s Financial Services Authority (the UK FSA). Our review has been undertaken so that we might state to the Company those matters we are required to state to it in this report and for no other purpose. To the fullest extent permitted by law, we do not accept or assume responsibility to anyone other than the Company for our review work, for this report, or for the conclusions we have reached.
Directors’ responsibilities The half yearly financial report is the responsibility of, and has been approved by, the directors. The directors are responsible for preparing the half yearly financial report in accordance with the DTR of the UK FSA. As disclosed in note 1, the annual financial statements of the Company are prepared in accordance with IFRSs as adopted by the EU. The condensed set of financial statements included in this half-yearly financial report has been prepared in accordance with IAS 34 Interim Financial Reporting as adopted by the EU.
Our responsibility Our responsibility is to express to the Company a conclusion on the condensed set of financial statements in the half-yearly financial report based on our review.
Scope of review We conducted our review in accordance with the International Standard on Review Engagements (UK and Ireland) 2410 Review of Interim Financial Information Performed by the Independent Auditor of the Entity issued by the Auditing Practices Board for use in the United Kingdom. A review of interim financial information consists of making enquiries, primarily of persons responsible for financial and accounting matters, and applying analytical and other review procedures. A review is substantially less in scope than an audit conducted in accordance with International Standards on Auditing (UK and Ireland) and consequently does not enable us to obtain assurance that we would become aware of all significant matters that might be identified in an audit. Accordingly, we do not express an audit opinion.
Conclusion Based on our review, nothing has come to our attention that causes us to believe that the condensed set of financial statements in the half-yearly financial report for the six months ended 30 June 2011 is not prepared, in all material aspects, in accordance with IAS 34 as adopted by the EU and the DTR of the UK FSA. John E Hughes for and on behalf of KPMG Audit Plc Chartered Accountants London 3 August 2011

Standard Chartered PLC – Additional information
102
A. Remuneration Within the authority delegated by the board of directors, the Remuneration Committee is involved in determining the remuneration policy of the Group and specifically for agreeing the individual remuneration packages for executive directors and other highly remunerated individuals. No executive directors are involved in deciding their own remuneration. The Group’s remuneration policy is to:
Support a strong performance-oriented culture and ensure that individual rewards and incentives relate directly to: (i) the performance of the individual; (ii) the performance of the business; and (iii) the interests of shareholders;
Maintain competitive reward that reflects our international nature and enables us to attract, retain and motivate our employees;
Reflects the fact that many of our employees bring international experience and expertise, and we recruit from a global marketplace.
The Remuneration Committee review the policy on a regular basis against significant regulatory developments, market practice and shareholder views and makes appropriate adjustments.
Our One Bank philosophy, which applies to all employees, ensures that behaviours including prudent risk management and values are rewarded as well as business performance and is central to our remuneration policy. It means that we seek to ensure our approach to reward and performance management is consistent across all employees. We believe that performance and related reward outcomes should be a consequence of both how performance is delivered and what is delivered. This is taken into account in all personal objectives, performance assessments and reward decisions made within Standard Chartered and has a tangible impact on the reward that employees receive.
Target total compensation is benchmarked to the relevant market in which each individual is employed, while the potential total compensation is set at upper quartile or higher for excellent individual and business performance.
All employees have the opportunity to receive an element of performance-related compensation, subject to their contractual entitlement. Typically, the higher the total compensation, the greater the proportion delivered in variable form (either through a cash award, deferred shares and/or performance shares).
The Group believes strongly in encouraging employee share ownership at all levels in the organisation. The Group’s existing performance share plan expired in 2011. Given the need to renew the Performance Share Plan (PSP) the Group took the opportunity to review and amend all its discretionary share plan arrangements and the 2011 Standard Chartered Share Plan was approved by shareholders at the Group’s Annual General Meeting on 5 May 2011.
B. Share awards 2000 Executive Share Option Scheme (2000 ESOS)
No share awards were granted during 2011 and no further awards may be granted under the 2000 ESOS.
A reconciliation of option movements over the period to 30 June 2011 is shown below:
2011
No. of shares
Weighted average
exercise price
Outstanding at 1 January 1,386,144 £7.01
Exercised (51,829) £7.16
Outstanding at 30 June 1,334,315 £7.02
Exercisable at 30 June 1,334,315 £7.02
2011
Range of exercise price for options outstanding
Weighted average
exercise price
Weightedaverage
remainingcontractual life
£5.82/£8.76 £7.02 2.1 years
The weighted average share price at the time the options were exercised during the current period was £16.26.

Standard Chartered PLC – Additional information continued
103
2001 Performance Share Plan (2001 PSP) The 2001 PSP is designed to be an intrinsic part of total remuneration for the Group’s executive directors and for a small number of the Group’s most senior executives. It is an internationally competitive long-term incentive plan that focuses executives on meeting and exceeding the long-term performance targets of the Group. The performance criteria that need to be met are set out in the Directors’ remuneration report in the Group’s 2010 Annual report and Accounts. Awards of nil price options to acquire shares in the Company are granted to the executives and will normally be exercisable between three and 10 years after the date of grant if the individual is still employed by the Group. There is provision for earlier exercise in certain limited circumstances. No further awards may be granted under the 2001 PSP.
A reconciliation of option movements over the period to 30 June 2011 is shown below:
2011
No. of shares
Weighted average
exercise price
Outstanding at 1 January 9,571,846 –
Lapsed (1,096,640) –
Exercised (1,266,630) –
Outstanding at 30 June 7,208,576 –
Exercisable at 30 June 1,163,218 – 2011
Range of exercise price for options outstanding
Weighted average
exercise price
Weightedaverage
remainingcontractual life
n/a – 7.6 years
The weighted average share price at the time the options were exercised during the current period was £16.02.
1997/2006 Restricted Share Scheme (1997/2006 RSS) Restricted shares are used to deliver the deferred portion of annual performance awards and as an incentive to motivate and retain high-performing employees. In line with similar schemes operated by our competitors, our existing restricted share awards do not have any performance conditions. Half of the award vests two years after the date of grant and the balance after three years. Awards granted in 2010 for the deferred element of the annual performance award, vest in three equal tranches over one, two and three years. No further awards will be granted under the RSS.
A reconciliation of option movements over the period to 30 June 2011 is shown below:
2011
No. of shares
Weighted average
exercise price
Outstanding at 1 January 24,500,160 –
Granted 12,500,000 –
Lapsed (542,365) –
Exercised (5,070,392) –
Outstanding at 30 June 31,387,403 –
Exercisable at 30 June 3,276,501 –
2011
Range of exercise price for options outstanding
Weighted average
exercise price
Weightedaverage
remainingcontractual life
n/a – 5.7 years
The weighted average share price at the time the options were exercised during the current period was £16.12.

Standard Chartered PLC – Additional information continued
104
2007 Supplementary Restricted Share Scheme (2007 SRSS) The Group operates a Supplementary Restricted Share Scheme, which is similar to the RSS. This scheme is principally used for Global Markets. It was used in 2010 to defer one third on an employee’s 2009 Annual Performance Award, which vest after one year. For all other grants, half of the award vests two years after the date of grant and the balance after three years. Executive directors are specifically prohibited from the plan; no new shares can be issued to satisfy awards; and there is no individual annual limit. No further awards will be granted under the SRSS.
A reconciliation of option movements over the period to 30 June 2011 is shown below:
2011
No. of shares
Weighted average
exercise price
Outstanding at 1 January 13,885,072 –
Granted 250,000 –
Lapsed (69,224) –
Exercised (6,016,614) –
Outstanding at 30 June 8,049,234 –
Exercisable at 30 June 2,050,213 –
2011
Range of exercise price for options outstanding
Weighted average
exercise price
Weighted average
remainingcontractual life
n/a – 5.3 years
The weighted average share price when the options were exercised was £16.07.
2011 Standard Chartered Share Plan The 2011 Standard Chartered Share Plan replaced all the Group’s existing discretionary share plan arrangements following approval by shareholders at the Group’s Annual General Meeting on 5 May 2011. Under the Plan the Group can grant a variety of discretionary awards including performance share awards (PSA), which will be subject to the achievement of long-term performance targets of the Group, and restricted share awards (RSA), which will not have any performance conditions. For PSAs, in addition to the performance conditions which applied to the existing 2001 PSP of Total Shareholder Return (TSR) and Earnings per Share (EPS), Return on Risk Weighted Assets (RoRWA) has been included. PSAs and RSAs will generally be in the form of nil price options to acquire shares in the Company. Further details of the 2011 Standard Chartered Share Plan are set out in the 2011 Notice of AGM and the Directors Remuneration Report. The remaining life of the Plan is ten years.
A reconciliation of option movements over the period to 30 June 2011 is shown below:
Performance Share Awards (PSA) 2011
No. of shares
Weighted average
exercise price
Outstanding at 1 January – –
Granted 4,139,078 –
Lapsed (2,299) –
Outstanding at 30 June 4,136,779 –
Exercisable at 30 June – – 2011
Range of exercise price for options outstanding
Weighted average
exercise price
Weightedaverage
remainingcontractual life
n/a – 9.9 years

Standard Chartered PLC – Additional information continued
105
Restricted Share Awards (RSA) 2011
No. of shares
Weighted average
exercise price
Outstanding at 1 January – –
Granted 199,637 –
Outstanding at 30 June 199,637 –
Exercisable at 30 June – – 2011
Range of exercise price for options outstanding
Weighted average
exercise price
Weightedaverage
remainingcontractual life
n/a – 7.0 years No awards were exercised during the period to 30 June 2011.
2004 Deferred Bonus Plan A reconciliation of share movements over the period to 30 June 2011 is shown below:
2011
No. of shares
Outstanding at 1 January 383,985
Shares vested (383,559)
Shares awarded 70,255
Outstanding at 30 June 70,681
Notes: a) The market value of shares on the date of award (8 March 2011) was £16.6625 b) The shares vest one year after the date of award. c) A notional scrip dividend accrues on the shares held in the Trust. The dividend is normally delivered in the form of shares and is released on vesting.
All Employee Sharesave Schemes No awards have been made under the 1994 UK Sharesave and 1996 International Sharesave schemes since 2003, as these were replaced by the 2004 UK and International Sharesave schemes. In 2008 a new Irish sharesave scheme was introduced for all employees of the Group in the Republic of Ireland. Under these Sharesave schemes, employees have the choice of opening a three-year or five-year savings contract. Within a period of six months after the third or fifth anniversary, as appropriate, employees may purchase ordinary shares in the Company. The price at which they may purchase shares is at a discount of up to 20 per cent on the share price at the date of invitation. There are no performance conditions attached to options granted under the Sharesave schemes.
In some countries in which the Group operates, it is not possible to operate Sharesave schemes, typically because of securities law, regulatory or other similar restrictions. In these countries the Group offers an equivalent cash-based scheme to its employees. The remaining life of the scheme is four years.
2004 UK and International Sharesave Schemes A reconciliation of option movements over the current period to 30 June 2011 is shown below:
2011
No. of shares
Weighted average
exercise price
Outstanding at 1 January 14,798,991 £11.31
Lapsed (1,217,468) £10.80
Exercised (1,293,817) £9.75
Outstanding at 30 June 12,287,706 £11.52
Exercisable at 30 June – – 2010
Range of exercise price for options outstanding
Weighted average
exercise price
Weightedaverage
remainingcontractual life
£8.32/£14.63 £11.52 2.1 years The weighted average share price at the time the options were exercised during the current period was £16.24 for the UK Sharesave scheme and £16.12 for the International Sharesave scheme.

Standard Chartered PLC – Additional information continued
106
2008 Irish Sharesave Scheme The first awards under this scheme were made on 29 September 2008.
2011
No. of shares
Weighted average
exercise price
Outstanding at 1 January 19,586 £10.10
Lapsed (878) £10.19
Outstanding at 30 June 18,708 £10.10
Exercisable at 30 June – – 2010
Range of exercise price for options outstanding
Weighted average
exercise price
Weightedaverage
remainingcontractual life
£9.80/£11.04 £10.10 2.0 years
Valuation of options Details of the valuation models used in determining the fair values of options granted are detailed in the Group’s 2010 Annual Report and Accounts.
C. Directors’ interests in ordinary shares
Director At 1 January 20111
Total interests Personal interests Family interests At 30 June 20112
Total interests
Chairman :
Sir John Peace 7,543 7,543 – 7,543
Executive directors:
P A Sands 200,000 200,000 – 200,000
S P Bertamini 47,465 85,415 – 85,415
J Bindra 58,956 153,378 – 153,378
R H Meddings 121,030 60,000 60,000 120,000
A M G Rees 135,334 137,176 – 137,176
Independent Non-Executive Directors :
R Delbridge 4,961 6,592 – 6,592
J F T Dundas 3,141 3,141 – 3,141
V F Gooding 3,154 3,154 – 3,154
Dr Han Seung-soo KBE 2,250 2,310 – 2,310
S J Lowth 3,392 4,464 – 4,464
R H P Markham3 3,994 4,066 – 4,066
R Markland 3,616 3,682 – 3,682
J G H Paynter 5,625 8,750 – 8,750
P D Skinner 13,446 15,315 – 15,315
O H J Stocken 17,915 17,915 – 17,915 1 or at date of appointment to the Board, if later. 2 or at date of resignation from the Board, if earlier. 3 Senior Independent Non-Executive Director
The beneficial interests of directors and their families in the ordinary shares of the Company are set out above. The directors do not have any non-beneficial interests in the Company’s shares.
No director had an interest in the Company’s preference shares or loan stock, nor the shares or loan stocks of any subsidiary or associated undertaking of the Group.
No director had any corporate interests in the Company’s ordinary shares.
The Group operates a number of share based payment schemes for its directors and employees.

Standard Chartered PLC – Additional information continued
107
2004 Deferred Bonus Plan
Director
Shares held in trust at
1 January 20111
Shares awarded during the
period(1)
Shares awardedin respect of
notional dividend
Shares vested during
the period(1)
Shares held in trust at
30 June 20112
P A Sands 66,093 - 567 66,660 –
S P Bertamini 28,916 - 248 29,164 –
J S Bindra 12,649 - 108 12,757 –
R H Meddings 45,439 - 390 45,829 –
A M G Rees 227,198 70,255 1,951 229,149 70,255
1 or at date of appointment to the Board, if later. 2 or date of resignation from Board if earlier.
Notes (1) Market value on date of awards (8 March 2011) was 1666.25 pence. (2) Under the 2004 Deferred Bonus Plan, shares were conditionally awarded as part of the director’s deferred element of their annual performance award. The
shares are held in an employee benefit trust and automatically vest one year after the date of acquisition. No exercise is necessary. A notional scrip dividend accrues on the shares held in the trust. The dividend is delivered in the form of shares and is released on vesting.
(3) Mr Rees will also be granted an award under the Deferred Bonus Plan (DBP) in March 2012 in line with the arrangements put in place to deliver the outstanding deferred elements of his 2009 Annual Performance Award.
Under the 2004 Deferred Bonus Plan, shares are conditionally awarded as part of the executive directors’ annual performance award. Further details are contained in the Directors’ remuneration report in the Group’s 2010 Annual Report and Accounts. The remaining life of the plan is four years.
Long term incentives – Share options
Director Scheme Grant date As at
1 January 20111
Exercise price
(pence) Exercised Lapsed
As at 30 June
20112 Period
of exercise
P A Sands Sharesave 26 September 2007 1,601 1,048.22 – – 1,601 2012-2013
S P Bertamini Sharesave 9 October 2009 1,407 1,104.00 – – 1,407 2014-2015
J S Bindra Sharesave 9 October 2009 1,407 1,104.00 – – 1,407 2014-2015
R H Meddings Sharesave 4 October 2010 614 1,463.00 – – 614 2013-2014 1 or date of appointment to the Board or date of grant, if later. 2 or date of resignation from the Board if earlier.
Long term incentives – Shares
Director Scheme Grant date As at
1 January 2011 Exercised Lapsed As at
30 June 2011Period
of exercise
Sir John Peace RSS 28 September 2009 43,105 - - 43,105 2011-2016
RSS 21 September 2010 21,552 - - 21,552 2012-2017
RSS(1) 22 June 2011 - - - 14,863 2013-2018
P A Sands PSP 11 March 2008 191,791 138,875 52,916 - 2011-2018
PSP 11 March 2009 370,020 - - 370,020 2012-2019
PSP 11 March 2010 193,875 - - 193,875 2013-2020
PSA(2) 6 May 2011 - - - 211,526 2014-2021
Deferred RSS 11 March 2009 87,430 43,715 - 43,715 2011-2016
Deferred RSS 11 March 2010 61,700 - - 61,700 2012-2017
Deferred RSS(3) 10 March 2011 - - - 77,240 2013-2018
S P Bertamini PSP 16 September 2008 61,590 - - 61,590 2011-2018
PSP 11 March 2009 165,073 - - 165,073 2012-2019
PSP 11 March 2010 104,393 - - 104,393 2013-2020
PSA(2) 6 May 2011 - - - 113,427 2014-2021
Deferred RSS 11 March 2009 29,517 14,758 - 14,759 2011-2016
Deferred RSS 11 March 2010 26,993 - - 26,993 2012-2017
Deferred RSS(3) 10 March 2011 - - - 37,516 2013-2018
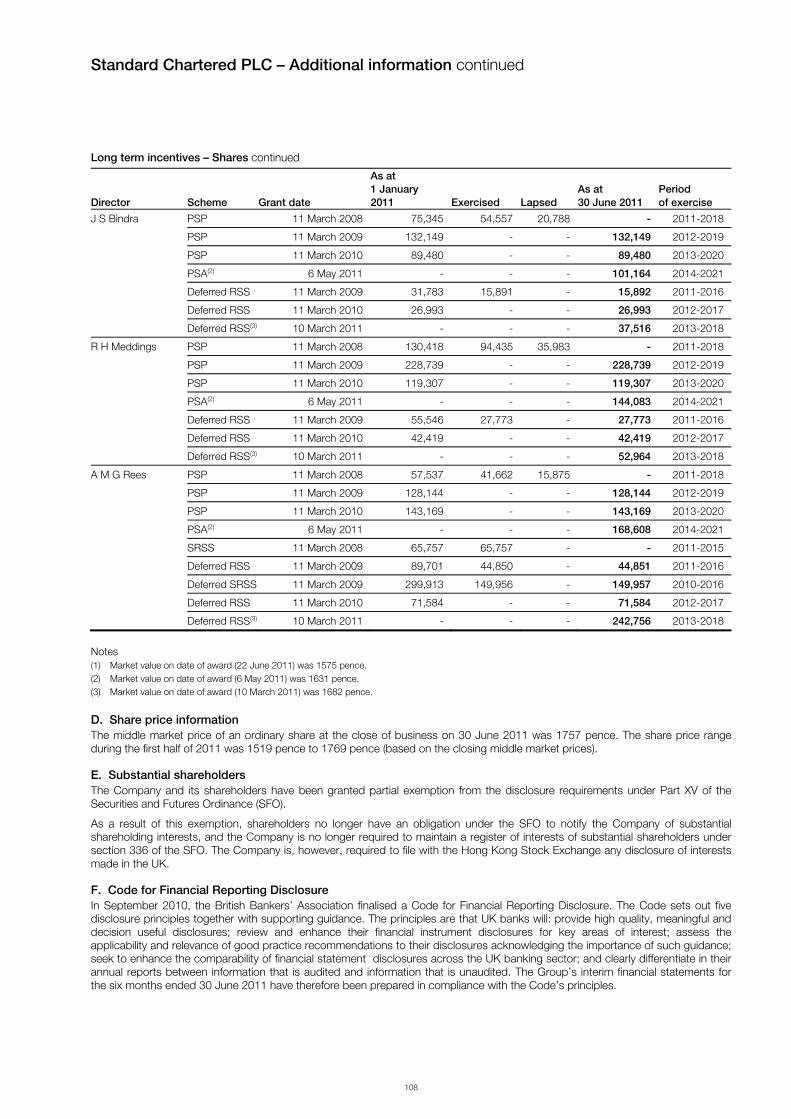
Standard Chartered PLC – Additional information continued
108
Long term incentives – Shares continued
Director Scheme Grant date
As at 1 January 2011 Exercised Lapsed
As at 30 June 2011
Period of exercise
J S Bindra PSP 11 March 2008 75,345 54,557 20,788 - 2011-2018
PSP 11 March 2009 132,149 - - 132,149 2012-2019
PSP 11 March 2010 89,480 - - 89,480 2013-2020
PSA(2) 6 May 2011 - - - 101,164 2014-2021
Deferred RSS 11 March 2009 31,783 15,891 - 15,892 2011-2016
Deferred RSS 11 March 2010 26,993 - - 26,993 2012-2017
Deferred RSS(3) 10 March 2011 - - - 37,516 2013-2018
R H Meddings PSP 11 March 2008 130,418 94,435 35,983 - 2011-2018
PSP 11 March 2009 228,739 - - 228,739 2012-2019
PSP 11 March 2010 119,307 - - 119,307 2013-2020
PSA(2) 6 May 2011 - - - 144,083 2014-2021
Deferred RSS 11 March 2009 55,546 27,773 - 27,773 2011-2016
Deferred RSS 11 March 2010 42,419 - - 42,419 2012-2017
Deferred RSS(3) 10 March 2011 - - - 52,964 2013-2018
A M G Rees PSP 11 March 2008 57,537 41,662 15,875 - 2011-2018
PSP 11 March 2009 128,144 - - 128,144 2012-2019
PSP 11 March 2010 143,169 - - 143,169 2013-2020
PSA(2) 6 May 2011 - - - 168,608 2014-2021
SRSS 11 March 2008 65,757 65,757 - - 2011-2015
Deferred RSS 11 March 2009 89,701 44,850 - 44,851 2011-2016
Deferred SRSS 11 March 2009 299,913 149,956 - 149,957 2010-2016
Deferred RSS 11 March 2010 71,584 - - 71,584 2012-2017
Deferred RSS(3) 10 March 2011 - - - 242,756 2013-2018
Notes (1) Market value on date of award (22 June 2011) was 1575 pence. (2) Market value on date of award (6 May 2011) was 1631 pence. (3) Market value on date of award (10 March 2011) was 1682 pence. D. Share price information The middle market price of an ordinary share at the close of business on 30 June 2011 was 1757 pence. The share price range during the first half of 2011 was 1519 pence to 1769 pence (based on the closing middle market prices).
E. Substantial shareholders The Company and its shareholders have been granted partial exemption from the disclosure requirements under Part XV of the Securities and Futures Ordinance (SFO).
As a result of this exemption, shareholders no longer have an obligation under the SFO to notify the Company of substantial shareholding interests, and the Company is no longer required to maintain a register of interests of substantial shareholders under section 336 of the SFO. The Company is, however, required to file with the Hong Kong Stock Exchange any disclosure of interests made in the UK.
F. Code for Financial Reporting Disclosure In September 2010, the British Bankers’ Association finalised a Code for Financial Reporting Disclosure. The Code sets out five disclosure principles together with supporting guidance. The principles are that UK banks will: provide high quality, meaningful and decision useful disclosures; review and enhance their financial instrument disclosures for key areas of interest; assess the applicability and relevance of good practice recommendations to their disclosures acknowledging the importance of such guidance; seek to enhance the comparability of financial statement disclosures across the UK banking sector; and clearly differentiate in their annual reports between information that is audited and information that is unaudited. The Group’s interim financial statements for the six months ended 30 June 2011 have therefore been prepared in compliance with the Code’s principles.

Standard Chartered PLC – Additional information continued
109
G. Shareholder information
2011 Interim dividend
Ex dividend date 10 August 2011
Record date for dividend 12 August 2011
Dividend payment date 7 October 2011
2011 Final dividend (provisional only)
Results and dividend announced 3 March 2012
Preference shares Next half-yearly dividend
7 3/8 per cent Non-Cumulative Irredeemable preference shares of £1 each 1 October 2011
8 ¼ per cent Non-Cumulative Irredeemable preference shares of £1 each 1 October 2011
6.409 per cent Non-Cumulative preference shares of $5 each 30 July 2011
7.014 per cent Non-Cumulative preference shares of $5 each 30 July 2011
8.125 per cent Non-Cumulative preference shares of $5 each 27 November 2011
Previous dividend payments (not adjusted for rights issue)
Dividend and financial year Payment dateCash dividend per
ordinary share Cost of one new ordinary share
under the share dividend scheme
Interim 2001 12 October 2001 12.82c/8.6856p No offer
Final 2001 17 May 2002 29.10c/19.91p £8.43/$12.32
Interim 2002 15 October 2002 14.10c/9.023p £6.537/$10.215
Final 2002 13 May 2003 32.9c/20.692p/ HK$2.566 £6.884/$10.946
Interim 2003 10 October 2003 15.51c/9.3625p/HK$1.205 £8.597/$14.242
Final 2003 14 May 2004 36.49c/20.5277p/HK$2.8448 £8.905/$15.830
Interim 2004 8 October 2004 17.06c/9.4851p/HK$1.3303 £9.546/$17.16958
Final 2004 13 May 2005 40.44c/21.145p/HK$3.15156 £9.384/$17.947
Interim 2005 14 October 2005 18.94c/10.7437p/HK$1.46911 £11.878/$21.3578
Final 2005 12 May 2006 45.06c/24.9055p/HK$3.49343 £14.276/$24.77885
Interim 2006 11 October 2006 20.83c/11.14409p/HK$1.622699 £13.2360/$25.03589
Final 2006 11 May 2007 50.21c/25.17397p/HK$3.926106 £14.2140/$27.42591
Interim 2007 10 October 2007 23.12c/11.39043p/HK$1.794713 £15.2560/$30.17637
Final 2007 16 May 2008 56.23c/28.33485p/HK$4.380092 £16.2420/$32.78447
Interim 2008 9 October 2008 25.67c/13.96133p/HK$1.995046 £14.00/$26.0148
Final 2008 15 May 2009 42.32c/28.4693p/HK$3.279597 £8.342/$11.7405
Interim 2009 8 October 2009 21.23c/13.25177p/HK$1.645304 £13.876/$22.799
Final 2009 13 May 2010 44.80c/29.54233p/HK$3.478306 £17.351/$26.252
Interim 2010 5 October 2010 23.35c/14.71618p/HK$1.811274/INR0.984124* £17.394/$27.190
Final 2010 11 May 2011 46.65c/28.272513p/HK$3.623404/INR1.9975170* £15.994/$25.649
* The INR dividend is per Indian Depository Receipt
ShareCare ShareCare is available to shareholders on the Company’s United Kingdom register who have a United Kingdom address and bank account, and allows you to hold your Standard Chartered shares in a nominee account. Your shares will be held in electronic form so you will no longer have to worry about keeping your share certificates safe. If you join ShareCare you will still be invited to attend the Company’s AGM and you will still receive your dividend at the same time as everyone else. ShareCare is free to join and there are no annual fees to pay. If you would like to receive more information please visit our website at http://investors.standardchartered.com/mypage.cfm or contact the shareholder helpline on 0870 702 0138.
Donating shares to ShareGift Shareholders who have a small number of shares often find it uneconomical to sell them. An alternative is to consider donating them to the charity ShareGift (registered charity 1052686), which collects donations of unwanted shares until there are enough to sell and uses the proceeds to support UK charities. Further information can be obtained from the Company’s Registrars or from ShareGift on 020 7930 3737 or from www.sharegift.org. There is no implication for Capital Gains Tax (no gain no loss) when you donate shares to charity and UK tax payers may be able to claim income tax relief on the value of their donation.

Standard Chartered PLC – Additional information continued
110
Bankers’ Automated Clearing System (BACS) Dividends can be paid straight into your bank or building society account. Please register online at www.investorcentre.co.uk contact our registrar for a mandate form.
Registrars and shareholder enquiries If you have any enquiries relating to your shareholding and you hold your shares on the United Kingdom register, please contact our registrar Computershare Investor Services PLC at The Pavilions, Bridgwater Road, Bristol, BS99 7ZY. There is a shareholder helpline on 0870 702 0138.
If you hold your shares on the Hong Kong branch register and you have enquiries, please contact Computershare Hong Kong Investor Services Limited, 17M Floor, Hopewell Centre, 183 Queen’s Road East, Hong Kong. You can check your shareholding at: www.investorcentre.co.uk
Chinese translation If you would like a Chinese version of this Half year report, please contact: Computershare Hong Kong Investor Services Limited at 17M Floor, Hopewell Centre, 183 Queen’s Road East, Hong Kong.
本半年報告之中文譯本可向香港中央證券登記有限公司索取,地址﹕香港皇后大道東183號合和中心17M樓
Shareholders on the Hong Kong branch register who have asked to receive corporate communications in either Chinese or English can change this election by contacting Computershare.
If you hold Indian Depository Receipts and you have enquiries, please contact Karvy Computershare Private Limited, 17-24, Vithalrao Nagar, Madhapur, Hyderabad 500 001, India.
If there is a dispute between any translation and the English version of this Half year report, the English text shall prevail.
Taxation Information on taxation applying to dividends paid to you if you are a shareholder in the United Kingdom, Hong Kong and the United States will be sent to you with your dividend documents.

Standard Chartered PLC – Additional information continued
111
H. Convenience translation of selected financial statements into Indian Rupees In compliance with clause 37(3) of Indian Depository Receipts Listing agreement, the condensed interim financial statements on pages 56 to 60 are presented in Indian Rupees (INR) using a US Dollar / Indian Rupee exchange rate of 44.72 as at 30 June 2011 as published by Reserve Bank of India. Amounts have been translated using the said exchange rate including totals and sub-totals and any discrepancies in any table between totals and sums of the amounts listed are due to rounding.
Condensed consolidated interim income statement (Translated to INR)
For the six months ended 30 June 2011
6 months
ended 6 months
ended6 months
ended
30.06.11 30.06.10 31.12.10
Rs. million Rs. million Rs. million
Interest income 352,662 288,981 314,739 Interest expense (131,700) (103,169) (121,773)
Net interest income 220,962 185,812 192,967
Fees and commission income 107,373 102,319 101,425 Fees and commission expense (9,928) (6,261) (7,960)Net trading income 61,088 60,417 54,827 Other operating income 12,432 12,074 22,673
Non-interest income 170,965 168,550 170,965
Operating income 391,926 354,361 363,931
Staff costs (144,177) (125,574) (132,237)Premises costs (18,872) (17,038) (18,738)General administrative expenses (32,690) (39,532) (45,391)Depreciation and amortisation (13,416) (12,119) (12,879)
Operating expenses (209,155) (194,264) (209,245)Operating profit before impairment losses and taxation 182,771 160,098 154,686 Impairment losses on loans and advances and other credit risk provisions (18,425) (19,543) (19,945)Other impairment (3,220) (2,236) (1,163)Profit from associates 1,476 1,029 850
Profit before taxation 162,602 139,348 134,428 Taxation (46,151) (41,813) (34,569)
Profit for the period 116,451 97,534 99,860
Profit attributable to: Non-controlling interests 1,699 1,476 2,191 Parent company shareholders 114,752 96,059 97,668
Profit for the period 116,451 97,534 99,860
Rupees Rupees Rupees
Earnings per share: Basic earnings per ordinary share 47.9 44.5 43.3 Diluted earnings per ordinary share 47.2 43.9 42.4
Dividends per ordinary share: Interim dividend declared 11.07 - - Interim dividend paid - 10.06 - Final dividend paid - - 20.86
Rs. million Rs. million Rs. million
Total dividend: Total interim dividend payable 26,206 - - Total interim dividend (paid 5 October 2010) - 21,510 - Total final dividend (paid 11 May 2011) - - 48,700

Standard Chartered PLC – Additional information continued
112
Condensed consolidated interim statement of comprehensive income (Translated to INR)
For the six months ended 30 June 2011
6 months ended 6 months ended 6 months ended
30.06.11 30.06.10 31.12.10
Rs.million Rs.million Rs.million
Profit for the period 116,451 97,534 99,860 Other comprehensive income :
Exchange differences on translation of foreign operations: Net gains/(losses) taken to equity 28,755 (13,237) 50,891 Net (losses)/gains on net investment hedges (3,086) 224 (3,667) Reclassified to income statement on change of control - - 179 Actuarial gains/(losses) on retirement benefit obligations 1,834 (1,878) 5,590
Share of other comprehensive income from associates - (134) (89)Available-for-sale investments: Net valuation gains taken to equity 3,443 21,421 13,729 Reclassified to income (2,683) (3,265) (9,436)Cash flow hedges: Net gains/(losses) taken to equity 4,293 (1,610) 3,488 Reclassified to income (2,370) 1,610 (850)Taxation relating to components of other comprehensive income (2,102) (4,204) (313)
Other comprehensive income for the period, net of taxation 28,084 (1,073) 59,522
Total comprehensive income for the period 144,535 96,461 159,382 Total comprehensive income attributable to: Non-controlling interests 1,073 2,147 2,862 Parent company shareholders 143,462 94,314 156,520
144,535 96,461 159,382

Standard Chartered PLC – Additional information continued
113
Condensed consolidated interim balance sheet (Translated to INR) As at 30 June 2011
30.06.11 30.06.10 31.12.10
Rs.million Rs.million Rs.million
Assets Cash and balances at central banks 1,953,772 1,327,916 1,463,417 Financial assets held at fair value through profit or loss 1,225,373 1,086,115 1,208,379 Derivative financial instruments 2,273,296 1,992,500 2,140,254 Loans and advances to banks 2,563,216 2,208,721 2,328,034 Loans and advances to customers 11,722,275 9,615,024 10,748,810 Investment securities 3,637,704 3,433,915 3,389,597 Other assets 1,287,534 1,107,759 1,133,920 Current tax assets 10,151 7,110 8,005 Prepayments and accrued income 96,327 182,100 95,119 Interests in associates 38,325 27,726 28,218 Goodwill and intangible assets 330,794 291,261 312,951 1
Property, plant and equipment 210,810 177,583 201,553 Deferred tax assets 38,236 44,854 42,305 Total assets 25,387,812 21,502,583 23,100,563 Liabilities Deposits by banks 1,624,856 1,426,702 1,276,801 Customer accounts 14,913,449 12,480,860 13,728,682 Financial liabilities held at fair value through profit or loss 908,979 821,954 907,279 Derivative financial instruments 2,219,767 1,941,966 2,107,788 Debt securities in issue 1,727,981 1,492,038 1,403,358 Other liabilities 1,161,960 1,060,580 943,324 Current tax liabilities 51,965 40,114 43,870 Accruals and deferred income 176,018 159,740 202,492 Subordinated liabilities and other borrowed funds 715,699 695,620 712,792 Deferred tax liabilities 6,708 8,005 8,184 1
Provisions for liabilities and charges 7,871 10,017 14,087 Retirement benefit obligations 13,953 21,018 13,863 Total liabilities 23,529,204 20,158,613 21,362,520 Equity Share capital 53,217 46,375 52,501 Reserves 1,777,307 1,270,987 1,656,339 Total parent company shareholders’ equity 1,830,524 1,317,362 1,708,841 Non-controlling interests 28,084 26,608 29,202 Total equity 1,858,608 1,343,970 1,738,043 Total equity and liabilities 25,387,812 21,502,583 23,100,563
1 Amounts have been restated.

Standard Chartered PLC – Additional information continued
114
Condensed consolidated interim statement of changes in equity (Translated to INR)
For the six months ended 30 June 2011
Share capital
Share premium account
Capital and
Capital redemption
reserve1 Merger reserve
Available-for-sale reserve
Cash flow
hedge reserve
Translation reserve
Retained earnings
Parent company
shareholders equity
Non-controlling
interests Total
Rs.million Rs.million Rs.million Rs.million Rs.million Rs.million Rs.million Rs.million Rs.million Rs.million Rs.million
At 1 January 2010 45,301 215,908 805 325,740 (4,159) 671 (52,993) 691,371 1,222,645 25,938 1,248,582
Profit for the period - - - - - - - 96,059 96,059 1,476 97,534
Other comprehensive income - - - - 12,835 (45) (12,879) (1,655)2 (1,744) 671 (1,073)
Distributions - - - - - - - - - (1,431) (1,431)
Shares issued, net of expenses 671 23,210 - - - - - - 23,880 - 23,880
Net own shares adjustment - - - - - - - (7,289) (7,289) - (7,289)
Share option expense, net of taxation - - - - - - - 5,143 5,143 - 5,143 Capitalised on scrip dividend 402 (402) - - - - - - - - -
Dividends, net of scrip - - - - - - - (21,331) (21,331) - (21,331)
Other decreases - - - - - - - - - (45) (45)
At 30 June 2010 46,375 238,715 805 325,740 8,676 626 (65,873) 762,297 1,317,362 26,608 1,343,970
Profit for the period - - - - - - - 97,668 97,668 2,191 99,860
Other comprehensive income - - - - 5,098 1,923 47,448 4,383 2 58,852 671 59,522 Distributions - - - - - - - - - (984) (984)
Shares issued, net of expenses 5,903 2,370 - 229,727 - - - - 238,000 - 238,000
Net own shares adjustment - - - - - - - 1,252 1,252 - 1,252
Share option expense, net of taxation - - - - - - - 8,094 8,094 - 8,094
Capitalised on scrip dividend 224 (224) - - - - - - - - -
Dividends, net of scrip - - - - - - - (11,985) (11,985) - (11,985)
Other increases - - - - - - - (402) (402) 716 313
At 31 December 2010 52,501 240,862 805 555,467 13,774 2,549 (18,425) 861,307 1,708,841 29,202 1,738,043
Profit for the period - - - - - - - 114,752 114,752 1,699 116,451
Other comprehensive income - - - - 179 1,297 25,982 1,252 2 28,710 (626) 28,084
Distributions - - - - - - - - - (2,012) (2,012)
Shares issued, net of expenses 179 939 - - - - - - 1,118 - 1,118
Net own shares adjustment - - - - - - - (4,740) (4,740) - (4,740)
Share option expense, net of taxation - - - - - - - 6,171 6,171 - 6,171 Capitalised on scrip dividend 537 (537) - - - - - - - - -
Dividends, net of scrip - - - - - - - (24,328) (24,328) - (24,328)
Other decreases - - - - - - - - - (179) (179)
At 30 June 2011 53,217 241,264 805 555,467 13,953 3,846 7,558 954,414 1,830,524 28,084 1,858,608
1 Includes capital reserve of Rs. 224 million and capital redemption reserve of Rs. 581 million. 2 For the period ended 30 June 2011, comprises actuarial gains, net of taxation and non-controlling interests of Rs. 1,252 million (30 June 2010: losses of
Rs. (1,520) million and 31 December 2010: gains of Rs. 4,472 million) and share of comprehensive losses from associates of Rs. nil million (30 June 2010: Rs. (134) million and 31 December 2010: Rs. (89) million).

Standard Chartered PLC – Additional information continued
115
Condensed consolidated interim cash flow statement (Translated to INR)
For the six months ended 30 June 2011
6 months ended 6 months ended 6 months ended
30.06.11 30.06.10 1 31.12.10 1
Rs.million Rs.million Rs.million
Cash flows from operating activities Profit before taxation 162,602 139,348 134,428
Adjustments for: Non-cash items and other adjustments included within income statement 43,915 43,155 40,650
Change in operating assets (1,414,046) (2,592,821) (1,089,961)
Change in operating liabilities 1,490,786 2,005,647 645,891
Contributions to defined benefit schemes (760) (3,354) (3,354)
UK and overseas taxes paid, net of refund (36,805) (35,687) (27,861)
Net cash from/(used in) operating activities 245,692 (443,712) (300,205)
Net cash flows from investing activities Purchase of property, plant and equipment (11,135) (7,110) (9,436)
Disposal of property, plant and equipment 3,399 5,411 2,773
Acquisition of investment in subsidiaries and associates, net of cash acquired (39,756) (10,196) (14,176)
Purchase of investment securities (2,832,833) (2,530,660) (2,570,819)
Disposal and maturity of investment securities 2,660,393 2,472,792 2,744,153
Dividends received from investment in associates 224 402 581
Net cash (used in)/from investing activities (219,709) (69,361) 153,077
Net cash flows from financing activities Issue of ordinary and preference share capital, net of expenses 1,118 23,880 238,000
Purchase of own shares (6,529) (7,960) (179)
Exercise of share options through ESOP 1,789 671 1,431
Interest paid on subordinated liabilities (24,059) (25,088) (9,481)
Gross proceeds from issue of subordinated liabilities 4,293 33,540 894
Repayment of subordinated liabilities (22,941) (68,600) (671)
Interest paid on senior debts (13,505) (25,446) (17,307)
Gross proceeds from issue of senior debts 320,687 303,380 316,126
Repayment of senior debts (145,072) (227,804) (270,645)
Dividends paid to non-controlling interests and preference shareholders, net of scrip (4,248) (3,667) (3,265)
Dividends paid to ordinary shareholders, net of scrip (22,092) (19,095) (9,704)
Net cash from/(used in) financing activities 89,440 (16,189) 245,200
Net increase/(decrease) in cash and cash equivalents 115,422 (529,261) 98,071
Cash and cash equivalents at beginning of the period 2,671,304 3,044,225 2,511,833
Effect of exchange rate movements on cash and cash equivalents 48,253 (3,130) 61,401
Cash and cash equivalents at end of the period 2,834,980 2,511,833 2,671,304
1 Amounts have been restated.

Standard Chartered PLC – Additional information continued
116
I. Summary of significant differences between Indian GAAP and IFRS The consolidated financial statements of the Group for the period ended 30 June 2011with comparatives as at 31 December 2010 and 30 June 2010 are prepared in accordance with International Financial Reporting Standards (IFRS) and IFRS Interpretations Committee (IFRIC) interpretations as adopted by the European Union and the Disclosure and Transparency rules of the UK Financial Services Authority.
IFRS differs in certain significant respects from Indian Generally Accepted Accounting Principles (GAAP). Such differences involve methods for measuring the amounts shown in the financial statements of the Group, as well as additional disclosures required by Indian GAAP.
Set out below are descriptions of certain accounting differences between IFRS and Indian GAAP that could have a significant effect on profit attributable to parent company shareholders for the periods ended 30 June 2011, 31 December 2010 and 30 June 2010 and total parent company shareholders’ equity as at the same date. This section does not provide a comprehensive analysis of such differences. In particular, this description considers only those Indian GAAP pronouncements for which adoption or application is required in financial statements for periods ended on or prior to 30 June 2011. The Group has not quantified the effect of differences between IFRS and Indian GAAP, nor prepared consolidated financial statements under Indian GAAP, nor undertaken a reconciliation of IFRS and Indian GAAP financial statements. Had the Group undertaken any such quantification or preparation or reconciliation, other potentially significant accounting and disclosure differences may have come to its attention which are not identified below. Accordingly, the Group does not provide any assurance that the differences identified below represent all the principal differences between IFRS and Indian GAAP relating to the Group. Furthermore, no attempt has been made to identify future differences between IFRS and Indian GAAP. Finally, no attempt has been made to identify all differences between IFRS and Indian GAAP that may affect the financial statements as a result of transactions or events that may occur in the future.
In making an investment decision, potential investors should consult their own professional advisers for an understanding of the differences between IFRS and Indian GAAP and how those differences may have affected the financial results of the Group. The summary does not purport to be complete and is subject and qualified in its entirety by reference to the pronouncements of the International Accounting Standards Board (IASB), together with the pronouncements of the Indian accounting profession.
Changes in accounting policy IFRS Changes in accounting policy are applied retrospectively. Comparatives are restated and the effect of period(s) not presented is adjusted against opening retained earnings of the earliest year presented. Policy changes made on the adoption of a new standard are made in accordance with that standard’s transitional provisions.
Indian GAAP The cumulative amount of the change is included in the income statement for the period in which the change is made except as specified in certain standards (transitional provision) where the change during the transition period resulting from adoption of the standard has to be adjusted against opening retained earnings and the impact disclosed.
Where a change in accounting policy has a material effect in the current period, the amount by which any item in the financial statements is affected by such change should also be disclosed to the extent ascertainable. Where such an amount is not ascertainable this fact should be indicated.
Functional and presentation currency IFRS Assets and liabilities are translated at the exchange rate at the balance sheet date when the financial statements are presented in a currency other than the functional currency. Income statement items are translated at the exchange rate at the date of transaction or at average rates. The functional currency is the currency of the primary economic environment in which an entity operates. The presentation currency of the Group is US dollars.
Indian GAAP There is no concept of functional or presentation currency. Entities in India have to prepare their financial statements in Indian rupees.
Consolidation IFRS Entities are consolidated when the Group has the power to govern the financial and operating policies so as to obtain benefits. Control is presumed to exist when the Group owns more than one half of an entity’s voting power. Currently exercisable voting rights should also be taken into consideration when determining whether control exists.
Indian GAAP Similar to IFRS, except that currently exercisable voting rights are not considered in determining control.
Consolidation of Special Purpose Vehicles IFRS Under the IASB’s Standards Interpretations Committee (SIC) Interpretation 12 (SIC-12), an SPE should be consolidated when the substance of the relationship between an enterprise and the SPE indicates that the SPE is controlled by that entity. The definition of an SPE includes employee share trusts.
Indian GAAP No specific guidance. SPEs including employee share trusts are not consolidated.

Standard Chartered PLC – Additional information continued
117
I. Summary of significant differences between Indian GAAP and IFRS continued Business combinations IFRS All business combinations are treated as acquisitions. Assets, liabilities and contingent liabilities acquired are measured at their fair values. Pooling of interest method is prohibited.
For acquisitions occurring on or after 1 January 2004, IFRS 3 ’Business Combinations’ (IFRS 3) requires that, when assessing the value of the assets of an acquired entity, certain identifiable intangible assets must be recognised and if considered to have a finite life, amortised through the income statement over an appropriate period. As the Group has not applied IFRS 3, or its predecessor IAS 22, to transactions that occurred before 1 January 2004, no intangible assets, other than goodwill, were recognised on acquisitions prior to that date.
Adjustments to provisional fair values are permitted provided those adjustments are made within 12 months from the date of acquisition, with a corresponding adjustment to goodwill.
After re-assessment of respective fair values of net assets acquired, any excess of acquirer’s interest in the net fair values of acquirer’s identifiable assets is recognised immediately in the income statement.
Where less than 100 per cent of an entity is acquired, non-controlling interests are stated at their proportion of the fair value of the identifiable net assets and contingent liabilities acquired.
Indian GAAP Treatment of a business combination depends on whether the acquired entity is held as a subsidiary, whether it is an amalgamation or whether it is an acquisition of a business.
For an entity acquired and held as a subsidiary, the business combination is accounted for as an acquisition. The assets and liabilities acquired are incorporated at their existing carrying amounts.
For an amalgamation of an entity, either pooling of interests or acquisition accounting may be used. The assets and liabilities amalgamated are incorporated at their existing carrying amounts or, alternatively, if acquisition accounting is adopted, the consideration can be allocated to individual identifiable assets (which may include intangible assets) and liabilities on the basis of their fair values.
Adjustments to the value of acquired or amalgamated balances are not permitted after initial recognition.
Any excess of acquirer’s interest in the net fair values of acquirer’s identifiable assets is recognised as capital reserve, which is neither amortised nor available for distribution to shareholders. However, in case of an amalgamation accounted under the purchase method, the fair value of intangible assets with no active market is reduced to the extent of capital reserve, if any, arising on the amalgamation.
Goodwill IFRS IFRS 3 requires that goodwill arising on all acquisitions by the Group and associated undertakings is capitalised but not amortised and is subject to an annual review for impairment. Under the transitional provisions of IFRS 1, the Group has not applied IFRS 3, or its predecessor IAS 22, to transactions that occurred before 1 January 2004, the date of transition to IFRS. Accordingly, goodwill previously written off to reserves, as permitted under UK GAAP until the implementation of FRS 10 ‘Goodwill and intangible assets’ in 1998, has not been reinstated nor will it be written back on disposal.
Amortisation of goodwill that has been charged up to 31 December 2003 has not been reversed and the deemed carrying value of the goodwill on transition to IFRS is equal to the net book value as at 31 December 2003.
Goodwill is tested annually for impairment. Any impairment losses recognised may not be reversed in subsequent accounting periods.
Indian GAAP Goodwill arising for amalgamations is capitalised and amortised over useful life not exceeding five years, unless a longer period can be justified.
For goodwill arising on acquisition of a subsidiary or a business, there is no specific guidance – in practice there is either no amortisation or amortisation not exceeding 10 years.
Goodwill is reviewed for impairment whenever an indicator of impairment exists. Impairment losses recognised may be reversed under exceptional circumstances only in subsequent accounting periods through the income statement.
Acquired and internally generated intangible assets IFRS Intangible assets are recognised if the specific criteria are met. Assets with a finite useful life are amortised on a systematic basis over their useful life. An asset with an indefinite useful life and which is not yet available for use should be tested for impairment annually.
Indian GAAP Intangible assets are capitalised if specific criteria are met and are amortised over their useful life, generally not exceeding 10 years. The recoverable amount of an intangible asset that is not available for use or is being amortised over a period exceeding 10 years should be reviewed at least at each financial year-end even if there is no indication that the asset is impaired.

Standard Chartered PLC – Additional information continued
118
I. Summary of significant differences between Indian GAAP and IFRS continued Property, plant and equipment IFRS Fixed assets are recorded at cost or revalued amounts. Under the transition rules of IFRS 1, the Group elected to freeze the value of all its properties held for its own use at their 1 January 2004 valuations, their ‘deemed cost’ under IFRS. They will not be revalued in the future.
Foreign exchange gains or losses relating to the procurement of property, plant and equipment, under very restrictive conditions, can be capitalised as part of the asset.
Depreciation is recorded over the asset’s estimated useful life. The residual value and the useful life of an asset and the depreciation method shall be reviewed at least at each financial year-end.
The Group has the option to capitalise borrowing costs incurred during the period that the asset is getting ready for its intended use.
Indian GAAP Fixed assets are recorded at historical costs or revalued amounts.
Relevant borrowing costs are capitalised if certain criteria are met.
Depreciation is recorded over the asset’s useful life. Schedule XIV of the Companies Act and Banking Regulations prescribe minimum rates of depreciation and these are typically used as the basis for determining useful life.
Recognition and measurement of financial instruments IFRS IAS 39 requires all financial instruments to be initially measured at their fair value, which is usually to be the transaction price. In those cases where the initial fair value is based on a valuation model that uses inputs which are not observable in the market, the difference between the transaction price and the valuation model is not recognised immediately in the income statement but is amortised to the income statement until the inputs become observable, the transaction matures or is terminated.
At the time of initial recognition, IAS 39 requires all financial assets to be classified as either:
• held at fair value through profit or loss (as a trading instrument or as designated by management), with realised and unrealised gains or losses reflected in profit or loss; or
• available for-sale at fair value, with unrealised gains and losses reflected in shareholders’ equity, and recycled to the income statement when the asset is sold or is impaired; or
• held-to-maturity at amortised cost, where there is the intent and the ability to hold them to maturity; or
• as loans and receivables at amortised cost.
At the time of initial recognition, IAS 39 requires all financial liabilities to be classified as either:
• held at fair value through profit or loss (as a trading instrument or as designated by management), with realised and unrealised gains or losses reflected in profit or loss; or
• at amortised cost.
A financial asset or financial liability, other than one held for trading, can be designated as being held at fair value through profit or loss if it meets the criteria set out below:
• the designation eliminates or significantly reduces a measurement or recognition inconsistency that would otherwise arise from measuring assets or liabilities on a different basis, or
• a group of financial assets and/or liabilities is managed and its performance evaluated on a fair value basis, or
• assets or liabilities include embedded derivatives and such derivatives are not recognised separately.
The designation of a financial instrument as held at fair value through profit or loss is irrevocable in respect of the financial instruments to which it relates. Subsequent to initial recognition instruments cannot be classified into or out of this category.
Changes in the fair value of available for sale financial assets resulting from movements in foreign currency exchange rates are included in the income statement as exchange differences. Foreign currency exchange movements for available for sale equity securities is recognised in reserves.
Indian GAAP Investments are categorised as follows:
• Current investments, which are those readily realisable and intended to be held for less than one year, are carried at the lower of cost and fair value, with changes in fair value taken directly to profit or loss;
• Long term investments, which are those investments not classified as current, are carried at cost unless there is a permanent diminution in value, in which case a provision for diminution is required to be made by the entity.
For investments, Reserve Banking India regulations require similar classifications to IFRS, but the classification criteria and measurement requirements differ from those set out in IFRS.
Financial liabilities are usually carried at cost.
There is no ability to designate instruments at fair value.

Standard Chartered PLC – Additional information continued
119
I. Summary of significant differences between Indian GAAP and IFRS continued Measurement of derivative instruments and hedging activities IFRS IAS 39 requires that all derivatives be recognised on balance sheet at fair value. Changes in the fair value of derivatives that are not hedges are reported in the income statement. Changes in the fair value of derivatives that are designated as hedges are either offset against the change in fair value of the hedged asset or liability through earnings or recognised directly in equity until the hedged item is recognised in earnings, depending on the nature of the hedge. The ineffective portion of the hedge’s change in fair value is immediately recognised in earnings. A derivative may only be classified as a hedge if an entity meets stringent qualifying criteria in respect of documentation and hedge effectiveness.
IAS 39 requires the separation of derivatives embedded in a financial instrument if it is not deemed to be closely related to the economic characteristics of the underlying host instrument.
Indian GAAP Foreign exchange contracts held for trading or speculative purposes are carried at fair value, with gains and losses recognised in the income statement.
In the absence of specific guidance, equity options are carried at the lower of cost or market value.
There is no specific guidance on hedge accounting since Accounting Standard 30 is not mandatory. However, based on Reserve Bank of India guidelines hedge accounting is applied.
The hedging instrument will be accounted for on accrual basis except for a hedging instrument designated with an asset or liability that is carried at market value or lower of cost or market value in the financial statements. In that case the hedging instrument will be marked to market with the resulting gain or loss recorded as an adjustment to the market value of the designated asset. The market value of the designated item will be adjusted only till the time the hedge is effective and the ineffectiveness will be recognised directly in P&L.
Impairment of financial assets IFRS At each balance sheet date, an assessment is made as to whether there is any objective evidence of impairment. A financial asset is impaired and impairment losses are incurred if, any only if, there is objective evidence of impairment.
Assets held at amortised cost If objective evidence of impairment exists, an assessment is made to determine what, if any, impairment loss should be
recognised. The impairment loss is the difference between the asset’s carrying amount and its estimated recoverable amount.
The recoverable amount is determined based on the present value of expected future cash flows, discounted at the instrument’s original effective interest rate, either individually or collectively. Individually assessed assets for which there is no objective evidence of impairment are collectively assessed for impairment.
Available-for-sale assets If objective evidence of impairment exists, the cumulative loss (measured as the difference between the acquisition cost and the
current fair value, less any previously recognised impairment) is removed from equity and recognised in the income statement.
Market recoveries leading to a reversal of an impairment provision for available-for-sale debt securities are recognised in the income statement. Impairment losses for equity instruments classified as available-for-sale are not permitted to be reversed through profit or loss.
Indian GAAP Long-term investments are written down when there is a decline in fair value which is deemed to be other than temporary. Impairments may be reversed through the income statement in subsequent periods if the investment rises in value, or the reasons for the impairment no longer exist.
Derecognition of financial assets IFRS A financial asset is derecognised if substantially all the risks and rewards of ownership have been transferred. If substantially all the risks and rewards have not been transferred, the asset will continue to be recognised to the extent of any continuing involvement.
Indian GAAP There is limited guidance on derecognition of financial assets. Securitised financial assets can only be derecognised if the originator has surrendered control over the assets. Control is not surrendered where the securitised assets are not beyond the reach of the creditors of the originator or where the transferee does not have the right to pledge, sell, transfer or exchange the securitised asset for its own benefit, or where there is an option entitles the originator to repurchase the financial assets transferred under a securitisation transaction from the transferee.

Standard Chartered PLC – Additional information continued
120
I. Summary of significant differences between Indian GAAP and IFRS continued
Liabilities and equity IFRS A financial instrument is classified as a liability where there is a contractual obligation to deliver either cash or another financial asset to the holder of that instrument, regardless of the manner in which the contractual obligation will be settled.
Preference shares, which carry a mandatory coupon or are redeemable on a specific date or at the option of the shareholder, are classified as financial liabilities and are presented in other borrowed funds. The dividends on these preference shares are recognised in the income statement as interest expense on an amortised cost basis using the effective interest method.
Indian GAAP Classification is based on the legal form rather than substance.
Provisions for liabilities and charges IFRS The amount recognised as a provision is the best estimate at the balance sheet date of the expenditure required to settle the obligation, discounted using a pre-tax market discount rate if the effect is material.
Indian GAAP Provisions are recognised and measured on a similar basis to IFRS, except that discounting is not permitted.
Pension obligations IFRS IAS 19 ‘Employee Benefits’ (IAS 19) requires defined benefit pension liabilities to be assessed on the basis of current actuarial valuations performed on each plan, and pension assets to be measured at fair value. The net pension surplus or deficit, representing the difference between plan assets and liabilities, is recognised on the balance sheet.
The discount rate to be used for determining defined benefit obligations is established by reference to market yields at the balance sheet date on high quality corporate bonds of a currency and term consistent with the currency and term of the post employment benefit obligations.
Under the transitional provisions of IFRS 1 ‘First time adoption of International Financial Reporting Standards’ (IFRS 1) and in accordance with IAS 19, the Group has elected to record all actuarial gains and losses on the pension surplus or deficit in the year in which they occur within the ‘Consolidated statement of comprehensive income’.
Indian GAAP The liability for defined benefit plans is determined on a similar basis to IFRS.
The discount rate to be used for determining defined benefit obligations is established by reference to market yields at the balance sheet date on government bonds.
Actuarial gains or losses are recognised immediately in the statement of income.
In respect of termination benefits, the revised AS 15 (2005), specifically contains a transitional provision providing that where expenditure on termination benefits is incurred on or before 31 March 2009, the entities can choose to follow the accounting policy of deferring such expenditure over its pay-back period. However, any expenditure deferred cannot be carried forward to accounting periods commencing on or after 1 April, 2010. Therefore any expenditure deferred should be written off over the shorter of (a) the pay-back period or (b) the period from the date expenditure on termination benefits is incurred to 1 April, 2010.
Share based compensation IFRS IFRS 2 ‘Share based payment’ requires that all share-based payments are accounted for using a fair value method. The fair value of the employee services received in exchange for the grant of the options is recognised as an expense. For equity-settled awards, the total amount to be expensed over the vesting period must be determined by reference to the fair value of the options granted (determined using an option pricing model), excluding the impact of any non-market vesting conditions (for example, profitability and growth targets). Non-market vesting conditions must be included in assumptions about the number of options that are expected to become exercisable. At each balance sheet date, the Group revises its estimates of the number of options that are expected to become exercisable. It recognises the impact of the revision of original estimates, if any, in the income statement, and a corresponding adjustment to equity over the remaining vesting period. The proceeds received net of any directly attributable transaction costs are credited to share capital (nominal value) and share premium when the options are exercised. Cash-settled awards must be revalued at each balance sheet date on an intrinsic value basis (being the difference between the market price of the share at the measurement date and the exercise price) with any changes in fair value charged or credited to staff costs in the income statement.
Deferred tax is recognised based on the intrinsic value of the award and is recorded in the income statement if the tax deduction is less than or equal to the cumulative share-based compensation expense or equity if the tax deduction exceeds the cumulative expense.
Indian GAAP Entities may either follow the intrinsic value method or the fair value method for determining the costs of benefits arising from share based compensation plans. Although the fair value approach is recommended, entities may use the intrinsic value method and provide fair value disclosures.
Deferred tax is not recognised as it is not considered to represent a timing difference.

Standard Chartered PLC – Additional information continued
121
I. Summary of significant differences between Indian GAAP and IFRS continued
Deferred Taxation IFRS Deferred tax is determined based on temporary differences, being the difference between the carrying amount and tax base of assets and liabilities, subject to certain exceptions.
Deferred tax assets are recognised if it is probable (more likely than not) that sufficient future taxable profits will be available to utilise to deferred tax assets.
Indian GAAP Deferred tax is determined based on timing differences, being the difference between accounting income and taxable income for a period that is capable of reversal in one or more subsequent periods.
Deferred tax assets recognised only if virtually certain with entities with tax losses carried forward or if reasonably certain with entities with no tax losses.
Interest income and expense IFRS Interest income and expense is recognised in the income statement using the effective interest method. The effective interest rate is the rate that discounts estimated future cash payments or receipts through the expected life of the financial instrument. When calculating the effective interest rate, the Group estimates cash flows considering all contractual terms of the financial instrument but does not consider future credit losses. The calculation includes all fees and points paid or received between parties to the contract that are an integral part of the effective interest rate, transaction costs and all other premiums or discounts.
Indian GAAP In the absence of a specific effective interest rate requirement, premiums and discounts are usually amortised on a straight line basis over the term of the instrument.
Dividends IFRS Dividends to holders of equity instruments, when proposed or declared after the balance sheet date, should not be recognised as a liability on the balance sheet date. A company however is required to disclose the amount of dividends that were proposed or declared after the balance sheet date but before the financial statements were authorised for issue.
Indian GAAP Dividends are reflected in the financial statements of the year to which they relate even if proposed or approved after the year end.

Standard Chartered PLC – Glossary
122
Advances-to-deposits ratio The ratio of total loans and advances to customers relative to total customer deposits. A low advances to deposits ratio demonstrates that customer deposits exceed customer loans resulting from emphasis placed on generating a high level of stable funding from customers.
Asset Backed Securities (ABS) Securities that represent an interest in an underlying pool of referenced assets. The referenced pool can comprise any assets which attract a set of associated cash flows but are commonly pools of residential or commercial mortgages and in the case of Collateralised Obligation (CDOs), the reference pool may be ABS.
Advanced Internal Rating Based (AIRB) approach
The AIRB approach under the Basel II framework is used to calculate credit risk capital based on the Group’s own estimates of certain parameters.
Alt-A Loans regarded as lower risk than sub-prime, but they share higher risk characteristics than lending under normal criteria.
Attributable profit to ordinary shareholders
Profit for the year after non-controlling interests and the declaration of dividends on preference shares classified as equity.
CAD2 An amendment to Capital Adequacy Directive that gives national regulators the discretion to permit firms to use their own value at risk model for calculating capital requirements subject to certain criteria.
Collateralised Debt Obligations (CDOs)
Securities issued by a third party which reference ABSs and/or certain other related assets purchased by the issuer. CDOs may feature exposure to sub-prime mortgage assets through the underlying assets.
Collateralised Loan Obligation (CLO)
A security backed by the repayments from a pool of commercial loans. The payments may be made to different classes of owners (in tranches).
Commercial Mortgage Backed Securities (CMBS)
Securities that represent interests in a pool of commercial mortgages. Investors in these securities have the right to cash received from future mortgage payments (interest and/or principal).
Commercial real estate Includes office buildings, industrial property, medical centres, hotels, malls, retail stores, shopping centres, farm land, multifamily housing buildings, warehouses, garages, and industrial properties. Commercial real estate loans are those backed by a package of commercial real estate assets.
Contractual maturity Contractual maturity refers to the final payment date of a loan or other financial instrument, at which point all the remaining outstanding principal will be repaid and interest is due to be paid.
Cost to income ratio Represents the proportion of total operating expense to total operating income.
Cover ratio Represents the extent to which non-performing loans are covered by impairment allowances.
Commercial Paper (CP) An unsecured promissory note issued to finance short-term credit needs. It specifies the face amount paid to investors on the maturity date.
Constant currency Constant currency change is derived by applying a simple translation of the previous period functional currency number in each entity using the current average and period end US dollar exchange rates to the income statement and balance sheet respectively.
Core Tier 1 Capital Core Tier 1 capital comprises called-up ordinary share capital and eligible reserves plus non-controlling interests, less goodwill and other intangible assets and deductions relating to excess expected losses over eligible provisions and securitisation positions as specified by the UK’s FSA (Financial Services Authority).
Core Tier 1 Capital ratio Core Tier 1 capital as a percentage of risk weighted assets.
Credit Conversion Factor (CCF) CCF is an internally modelled parameter based on historical experience to determine the amount that is expected to be further drawn down from the undrawn portion in a committed facility.
Credit Default Swaps (CDSs) A credit derivative is an arrangement whereby the credit risk of an asset (the reference asset) is transferred from the buyer to the seller of protection. A credit default swap is a contract where the protection seller receives premium or interest-related payments in return for contracting to make payments to the protection buyer upon a defined credit event. Credit events normally include bankruptcy, payment default on a reference asset or assets, or downgrades by a rating agency.
Credit risk spread The credit spread is the yield spread between securities with the same coupon rate and maturity structure but with different associated credit risks, with the yield spread rising as the credit rating worsens. It is the premium over the benchmark or risk-free rate required by the market to take on a lower credit quality.
Credit valuation adjustments (CVA)
An adjustment to fair value primarily in respect of derivative contracts that reflects the possibility that the counterparty may default such that the Group would not receive the full market value of the transactions.
Customer deposits Money deposited by all individuals and companies which are not credit institutions. Such funds are recorded as liabilities in the Group’s balance sheet under Customer accounts.
Debt restructuring This is when the terms and provisions of outstanding debt agreements are changed. This is often done in order to improve cash flow and the ability of the borrower to repay the debt. It can involve altering the repayment schedule as well as debt or interest charge reduction.
Debt securities Debt securities are assets on the Group’s balance sheet and represent certificates of indebtedness of credit institutions, public bodies or other undertakings excluding those issued by central banks.

Standard Chartered PLC – Glossary continued
123
Debt securities in issue Debt securities in issue are transferrable certificates of indebtedness of the Group to the bearer of the certificate. These are liabilities of the Group and include certificates of deposits.
Delinquency A debt or other financial obligation is considered to be in a state of delinquency when payments are overdue. Loans are considered to be delinquent when consecutive payments are missed.
Dividend per share Represents the entitlement of each shareholder in the share of the profits of the company. Calculated in the lowest unit of currency in which the shares are quoted.
Effective tax rate (ETR) The tax on profits on ordinary activities as a percentage of profit on ordinary activities before taxation.
Expected loss (EL) The Group measure of anticipated loss for exposures captured under an internal ratings based credit risk approach for capital adequacy calculations. It is measured as the Group-modelled view of anticipated loss based on Probability of Default (PD), Loss Given Default (LGD) and Exposure at Default (EAD), with a one-year time horizon.
Exposures Credit exposures represent the amount lent to a customer, together with an undrawn commitments
Exposure at default (EAD) The estimation of the extent to which the Group may be exposed to a customer or counterparty in the event of, and at the time of, that counterparty’s default. At default, the customer may not have drawn the loan fully or may already have repaid some of the principal, so that exposure is typically less than the approved loan limit.
Foundation Internal Ratings Based Approach
A method of calculating credit risk capital requirements using internal PD models but with supervisory estimates of LGD and conversion factors for the calculation of EAD.
Funded/unfunded exposures Exposures where the notional amount of the transaction is funded or unfunded. Represents exposures where there is a commitment to provide future funding is made but funds have been released / not released.
Guaranteed mortgages Mortgages for which there is a guarantor to provide the lender a certain level of financial security in the event of default of the borrower.
Impaired loans Loans where individual identified impairment allowance has been raised and also include loans which are collateralised or where indebtedness has already been written down to the expected realisable value. The impaired loan category may include loans, which, while impaired, are still performing.
Impairment allowances Impairment allowances are a provision held on the balance sheet as a result of the raising of a charge against profit for the incurred loss. An impairment allowance may either be identified or unidentified and individual or collective.
Individually/collectively assessed
Impairment is measured individually for assets that are individually significant, and collectively where a portfolio comprises homogenous assets and where appropriate statistical techniques are available. Typically assets within the Wholesale Banking business of the Group are assessed individually whereas assets within the Consumer Banking business are assessed on a portfolio basis.
Internal Ratings Based (IRB) approach
The IRB approach is used to calculate risk weighted assets in accordance with the Basel Capital Accord where capital requirements are based on a firm’s own estimates of certain parameters.
Investment grade A debt security, treasury bill or similar instrument with a credit rating measured by external agencies of AAA to BBB.
Jaws The rate of income growth less the rate of expense growth, expressed as positive jaws when income growth exceeds expense growth (and vice versa for negative jaws).
Leveraged finance Loans or other financing agreements provided to companies whose overall level of debt is high in relation to their cash flow (net debt: EBITDA (earnings before interest tax, depreciation and amortisation)) typically arising from private equity sponsor led acquisitions of the businesses concerned.
Liquidity and credit enhancements
Credit enhancement facilities are used to enhance the creditworthiness of financial obligations and cover losses due to asset default. Two general types of credit enhancement are third-party loan guarantees and self-enhancement through over-collateralisation. Liquidity enhancement makes funds available if required, for other reasons than asset default, e.g. to ensure timely repayment of maturing commercial paper.
Liquid asset ratio Ratio of total liquid assets to total assets. Liquid assets comprise cash (less restricted balances), net interbank, treasury bills and debt securities less illiquid securities.
Loans and advances This represents lending made under bilateral agreements with customers entered into in the normal course of business and is based on the legal form of the instrument. An example of a loan product is a home loan.
Loans to individuals Money loaned to individuals rather than institutions. The loans may be for car or home purchases, medical care, home repair, holidays, and other consumer uses.
Loan-to-value ratio The loan-to-value ratio is a mathematical calculation which expresses the amount of a first mortgage lien as a percentage of the total appraised value of real property. The loan-to-value ratio is used in determining the appropriate level of risk for the loan and therefore the correct price of the loan to the borrower.
Loans past due Loans on which payments have been due for up to a maximum of 90 days including those on which partial payments are being made.
Loss given default (LGD) LGD is the percentage of an exposure that a lender expects to lose in the event of obligor default.

Standard Chartered PLC – Glossary continued
124
Master netting agreement An agreement between two counterparties that have multiple derivative contracts with each other that provides for the net settlement of all contracts through a single payment, in a single currency, in the event of default on, or termination of, any one contract.
Mezzanine capital Financing that combines debt and equity characteristics. For example, a loan that also confers some profit participation to the lender.
Mortgage Backed Securities (MBS)
Securities that represent interests in a group of mortgages. Investors in these securities have the right to cash received from future mortgage payments (interest and/or principal).
Mortgage related assets Assets which are referenced to underlying mortgages.
Medium term notes (MTNs) Corporate notes continuously offered by a company to investors through a dealer. Investors can choose from differing maturities, ranging from nine months to 30 years.
Net asset value per share Ratio of net assets (total assets less total liabilities) to the number of ordinary shares outstanding at the end of a reporting period.
Net interest income The difference between interest received on assets and interest paid on liabilities.
Net interest margin The margin is expressed as net interest income divided by average interest earning assets.
Net interest yield Interest income divided by average interest earning assets less interest expense divided by average interest bearing liabilities.
Non-performing loans A non performing loan is any loan that is more than 90 days past due or is otherwise individually impaired, other than a loan which is: – renegotiated before 90 days past due, and on which no default in interest payments or loss of
principal is expected; or – renegotiated at or after 90 days past due, but on which there has been no default in interest or
principal payments for more than 180 days since renegotiation, and against which no loss of principal is expected.
Normalised earnings Profit attributable to ordinary shareholders adjusted for profits or losses of a capital nature; amounts consequent to investment transactions driven by strategic intent; and other infrequent and/or exceptional transactions that are significant or material in the context of the Group’s normal business earnings for the period.
Pre-provision profit Operating profit before impairment losses and taxation
Private equity investments Equity securities in operating companies generally not quoted on a public exchange. Investment in private equity often involves the investment of capital in private companies. Capital for private equity investment is raised by retail or institutional investors and used to fund investment strategies such as leveraged buyouts, venture capital, growth capital, distressed investments and mezzanine capital.
Probability of default (PD) PD is an internal estimate for each borrower grade of the likelihood that an obligor will default on an obligation.
Profit attributable to ordinary shareholders
Profit for the year after non-controlling interests and dividends declared in respect of preference shares classified as equity.
Renegotiated loans Loans and advances are generally renegotiated either as part of an ongoing customer relationship or in response to an adverse change in the circumstances of the borrower. In the latter case renegotiation can result in an extension of the due date of payment or repayment plans under which the Group offers a concessionary rate of interest to genuinely distressed borrowers. Such assets will be individually impaired where the renegotiated payments of interest and principal will not recover the original carrying amount of the asset. In other cases, renegotiation may lead to a new agreement, which would be treated as a new loan.
Repo/Reverse repo A repurchase agreement or repo is a short term funding agreements which allow a borrower to sell a financial asset, such as ABS or Government bonds as collateral for cash. As part of the agreement the borrower agrees to repurchase the security at some later date, usually less than 30 days, repaying the proceeds of the loan. For the party on the other end of the transaction (buying the security and agreeing to sell in the future) it is a reverse repurchase agreement or reverse repo.
Residential mortgage A loan to purchase a residential property which is then used as collateral to guarantee repayment of the loan. The borrower gives the lender a lien against the property, and the lender can foreclose on the property if the borrower does not repay the loan per the agreed terms. Also known as a Home loan.
Residential Mortgage Backed Securities (RMBS)
Securities that represent interests in a group of residential mortgages. Investors in these securities have the right to cash received from future mortgage payments (interest and/or principal).
Return on equity Represents the ratio of the current year’s profit available for distribution to ordinary shareholders to the weighted average ordinary shareholders equity for the reporting period.
Risk weighted assets A measure of a bank’s assets adjusted for their associated risks. Risk weightings are established in accordance with the Basel Capital Accord as implemented by the FSA.
Securitisation Securitisation is a process by which debt instruments are aggregated into a pool, which is used to back new securities. A company sells assets to an SPE (special purpose entity) who then issues securities backed by the assets based on their value. This allows the credit quality of the assets to be separated from the credit rating of the original company and transfers risk to external investors.

Standard Chartered PLC – Glossary continued
125
Sovereign exposures Exposures to central governments and central government departments, central banks and entities owned or guaranteed by the aforementioned. Sovereign exposures as defined by the European Banking Authority includes only exposures to central governments.
Special purpose entities (SPEs) SPEs are entities that are created to accomplish a narrow and well defined objective. There are often specific restrictions or limits around their ongoing activities. Transactions with SPEs take a number of forms, including: – The provision of financing to fund asset purchases, or commitments to provide finance for future
purchases. – Derivative transactions to provide investors in the SPE with a specified exposure. – The provision of liquidity or backstop facilities which may be drawn upon if the SPE experiences
future funding difficulties. – Direct investment in the notes issued by SPEs.
Standardised approach In relation to credit risk, a method for calculating credit risk capital requirements using External Credit Assessment Institutions (ECAI) ratings and supervisory risk weights. In relation to operational risk, a method of calculating the operational capital requirement by the application of a supervisory defined percentage charge to the gross income of eight specified business lines.
Structured finance /notes A structured note is an investment tool which pays a return linked to the value or level of a specified asset or index and sometimes offers capital protection if the value declines. Structured notes can be linked to equities, interest rates, funds, commodities and foreign currency.
Subordinated liabilities Liabilities which, in the event of insolvency or liquidation of the issuer, are subordinated to the claims of depositors and other creditors of the issuer.
Sub-prime Sub-prime is defined as loans to borrowers typically having weakened credit histories that include payment delinquencies and potentially more severe problems such as court judgements and bankruptcies. They may also display reduced repayment capacity as measured by credit scores, high debt-to-income ratios, or other criteria indicating heightened risk of default.
Tangible net asset value per share
Ratio of parent shareholders’ equity less preference shares classified as equity and goodwill and intangible assets to the number of ordinary shares outstanding at the end of the reporting period.
Tier 1 capital Tier 1 capital comprises Core Tier 1 capital plus innovative Tier 1 securities and preference shares and tax on excess expected losses less material holdings in credit or financial institutions.
Tier 1 capital ratio Tier 1 capital as a percentage of risk weighted assets.
Tier 2 capital Tier 2 capital comprises qualifying subordinated liabilities, allowable portfolio impairment provision and unrealised gains in the eligible revaluation reserves arising from the fair valuation of equity instruments held as available-for-sale.
VaR Value at Risk is an estimate of the potential loss which might arise from market movements under normal market conditions, if the current positions were to be held unchanged for one business day, measured to a confidence level of 97.5 per cent.
Working profit Operating profit before impairment losses and taxation.
Write Downs After an advance has been identified as impaired and is subject to an impairment allowance, the stage may be reached whereby it is concluded that there is no realistic prospect of further recovery. Write downs will occur when and to the extent that, the whole or part of a debt is considered irrecoverable.

Standard Chartered PLC – Financial calendar
126
Financial Calendar
Ex-dividend date 10 August 2011
Record date 12 August 2011
Expected posting to shareholders of 2011 Half Year Report 1 September 2011
Payment date – interim dividend on ordinary shares 7 October 2011 Copies of this statement are available from:
Investor Relations, Standard Chartered PLC, 1 Basinghall Avenue, London, EC2V 5DD or from our website on http://investors.standardchartered.com
For further information please contact:
Gavin Laws, Group Head of Corporate Affairs +44 20 7885 7168
Piotr Zajac, Head of Investor Relations +44 20 7885 6454
Ashia Razzaq, Head of Investor Relations, Asia Pacific +852 2820 3958
Uttam Hazarika, Manager, Investor Relations, India +91 22 67350424
Tim Baxter, Head of Corporate Communications +44 20 7885 5573
The following information will be available on our website:
Interim results video with Peter Sands, Group Chief Executive and Richard Meddings, Group Finance Director
Interim results presentation in pdf format
A live webcast of the interim results analyst presentation
The archived podcast, webcast and Q/A session of analyst presentation in London
Images of Standard Chartered are available for the media at http://www.standardchartered.com/global/mc/plib/directors_p01.html
Information regarding the Group’s commitment to Sustainability is available at http://www.standardchartered.com/sustainability
Forward looking statements It is possible that this document could or may contain forward-looking statements that are based on current expectations or beliefs, as well as assumptions about future events. These forward-looking statements can be identified by the fact that they do not relate only to historical or current facts. Forward looking statements often use words such as anticipate, target, expect, estimate, intend, plan, goal, believe, will, may, should, would, could or other words of similar meaning. Undue reliance should not be placed on any such statements because, by their very nature, they are subject to known and unknown risks and uncertainties and can be affected by other factors that could cause actual results, and the Group’s plans and objectives, to differ materially from those expressed or implied in the forward-looking statements.
There are several factors which could cause actual results to differ materially from those expressed or implied in forward looking statements. Among the factors that could cause actual results to differ materially from those described in the forward looking statements are changes in the global, political, economic, business, competitive, market and regulatory forces, future exchange and interest rates, changes in tax rates and future business combinations or dispositions.
The Group undertakes no obligation to revise or update any forward looking statement contained within this document, regardless of whether those statements are affected as a result of new information, future events or otherwise.
Disclaimer The securities referred to in this announcement have not been and will not be registered under the U.S. Securities Act of 1933 (the “U.S. Securities Act”) and may not be offered, sold or transferred within the United States except pursuant to an exemption from, or in a transaction not subject to, the registration requirements of the U.S. Securities Act. No public offering of the Placing Shares will be made in the United States.

Standard Chartered PLC – Index
127
Page
Page
Assets at fair value through profit or loss 82 Industry concentration in loans and advances 27
Asset backed securities 41 Investment securities 86
Balance sheet 58 Liabilities at fair value through profit or loss 83
Business combinations 89 Liquidity risk 47
Capital base and ratios 53 Loans and advances 86
Cash flow statement 60 Loans portfolio analysis 27
Consumer Banking: Loans maturity analysis 29
Financial review 11 Market risk 44
Loan impairment coverage ratio 30 Non-controlling interests 94
Contingent liabilities and commitments 96 Normalised earnings 72
Country cross-border risk 43 Operational risk 52
Customer accounts 91 Other impairment 69
Derivatives 84 Other operating income 68
Depreciation and amortisation 69 Principal uncertainties 20
Dividends 70 Remuneration 102
Earnings per share 72 Reputational risk 52
Financial calendar 126 Retirement benefit obligations 92
Financial instruments: Risk management framework 22
Classification 73 Risk weighted assets 55
Valuation 75 Segmental and entity-wide information:
Instruments carried at amortised cost 80 By business 62
Reclassification 81 By geography 64
Financial review of Group: Net interest margin and yield 66
Operating income and profit 9 By structure of deposits 67
Group summary consolidated balance sheet 18 Share capital 93
Glossary 122 Shares held by share scheme trust 94
Hedging 85 Special purpose entities 98
Highlights 1 Statement of changes in equity 59
Impairment losses on loans and advances: Statement of comprehensive income 57
Total individual impairment 35 Subordinated liabilities 92
Consumer Banking 30 Summary of results 3
Wholesale Banking 33 Taxation 70
Income statement 56 Trading income 68
India listing additional information: Wholesale Banking: Condensed financial statements in Indian Rupees 111 Financial review 14 Significant differences between Indian GAAP and IFRS 116 Loan impairment coverage ratio 33