Embed Size (px)
Citation preview

STAKEHOLDERFEEDBACK AND OPPORTUNITIESVOCATIONAL REHABILITATION FEE SCHEDULE

OVERALL PROGRAM PERFORMANCEOHIO’S VOCATIONAL REHABILITATION PROGRAM

VR PROGRAM PERFORMANCE OVERVIEW
2011 2018
Eligible + Served 30,377 37,152
Time to Eligibility 127 days 25.3 days
Time to Rehabilitation 28.5 months (FFY 2012) 17.2 months
Employment Outcomes 3,373 5,755
Wage per Hour $10.07 (FFY 2014) $11.48
Order of Selection Yes (waiting list for SD and D) No (serving all categories for the first time since 1991)
Employer Engagement No formal strategy Dedicated Business Relations Unit
3Stakeholder Feedback and Opportunities
Over the past eight years, we have made significant improvements in the VR program.

Stakeholder Feedback and Opportunities 4

VOCATIONAL REHABILITATION CASE PROCESSINGSERVED, ELIGIBILITY DETERMINATIONS AND INDIVIDUALIZED PLANS FOR EMPLOYMENT

30,377
36,52339,503 39,214 38,820 38,876
37,574 37,152
0
5,000
10,000
15,000
20,000
25,000
30,000
35,000
40,000
45,000
2011 2012 2013 2014 2015 2016 2017 2018
Eligible + Served
Eligible + Served
Stakeholder Feedback and Opportunities 6
Results: A 22.3% increase in this metric, although the number has leveled off during the past several federal fiscal years. OOD is actively engaged in outreach to individuals with
disabilities who could benefit from VR services.

6,467
10,015 10,83812,014 12,875
14,090 13,480 13,164
15,122
16,27417,086 17,016
17,88719,443
18,542 17,870
0
5,000
10,000
15,000
20,000
25,000
30,000
35,000
40,000
2011 2012 2013 2014 2015 2016 2017 2018
Vocational Rehabilitation Program Case Processing
New IPEs Eligibility Determinations
Stakeholder Feedback and Opportunities 7
Results: An 18.2% increase in eligibility determinations and a 103.6% increase in new IPE’s.

FACTORS INFLUENCING NUMBER SERVED
• Order of Selection (approximately 17,500 individuals released from the waiting list)
• Implementation of the Employment First partnership agreement with the Ohio Department of Developmental Disabilities (DODD)
• Implementation of the Ohio Transition Support Program (OTSP) with the Ohio Department of Education
• New federal requirements under the Workforce Innovation and Opportunity Act (WIOA), including Section 511 requirements, Pre-Employment Transition Services and a revised definition of Competitive Integrated Employment
• Decrease in the number of VR Case Management Contracts
• Decreased unemployment and increased number of jobs available in Ohio
Stakeholder Feedback and Opportunities 8

TIME IN SERVICETIME TO ELIGIBILITY AND INDIVIDUALIZED PLAN FOR EMPLOYMENT

92
7773
48
36
28 26 25.3
0
10
20
30
40
50
60
70
80
90
100
FFY 2011 FFY 2012 FFY 2013 FFY 2014 FFY 2015 FFY 2016 FFY 2017 FFY 2018
Time from Application to Eligibility (in days)
Results: A 72.5% reduction in time from application to eligibility. Note: This does not include a reduction of 35 days that resulted from eliminating a pre-application referral
process (total reduction of 102.6 days).
10Stakeholder Feedback and Opportunities
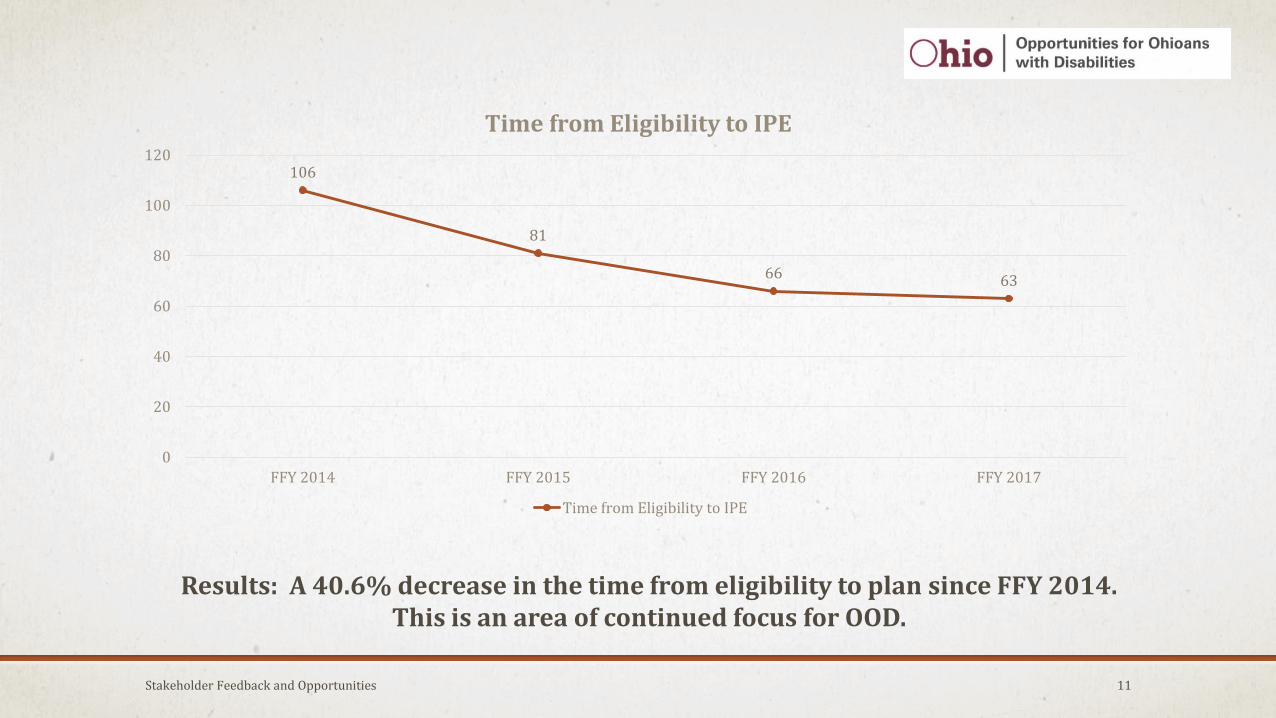
Stakeholder Feedback and Opportunities 11
Results: A 40.6% decrease in the time from eligibility to plan since FFY 2014. This is an area of continued focus for OOD.
106
81
66 63
0
20
40
60
80
100
120
FFY 2014 FFY 2015 FFY 2016 FFY 2017
Time from Eligibility to IPE
Time from Eligibility to IPE

COMMUNITY BASED ASSESSMENT & WORK ADJUSTMENT
Stakeholder Feedback and Opportunities 12Data as of 9/25/2018; does not capture complete FFY 2018Source: 2018 Fiscal Data 09/26/18 & 2017 Fiscal Data 04/03/18
CBA and Work Adjustment will continue to be utilized, but have been declining slightly. Note: final analysis will not be complete until all bills for FFY 2018 are submitted and processed,
typically in January. For CBA in particular, there is a need to complete the service quickly so that OOD can meet federal requirements to complete the IPE within 90 days.
Community Based Assessment/Work Adjustment
2017 2018 % Change
# PARTICIPANTSPAID
(Includes Mileage & Report)# PARTICIPANTS PAID
TOTAL AUTHORIZED
Community Based Assessment (CBA)
3,973 $5,159,036.94 3,122 $4,051,323.05 $4,681,047.10 -9.27%
Work Adjustment (WA) 1,253 $2,327,277.79 982 $1,813,195.79 $2,126,517.24 -8.63%
Average Cost Per CBA$1,298.52
$1,499.37 +15.47%
Average Cost Per WA$1,857.37 $2,165.50 +16.59%

TRANSITION SERVICESINCREASE IN SERVICES TO STUDENTS WITH DISABILITIES

CASELOAD TRENDS- STUDENTS AND YOUTH WITH DISABILITIES
Applications of 14-18 year old individuals:
FFY 2014 = 3,276
FFY 2018= 4,601
This is a 40% increase in applications for that age group
Caseload make up for number of transition age youth (14 to 25 at application):
FFY 2014 = 6,818 (43% of our entire active caseload)
FFY 2018 = 9,702 (62% of our entire active caseload)
This is a 19% increase in the number of active cases that are transition age youth
Stakeholder Feedback and Opportunities 14

Stakeholder Feedback and Opportunities 15
Summer Youth continues to be an important service, and OOD expects the need to continue to increase. Note: final analysis will not be complete until all bills for FFY 2018 are submitted and
processed, typically in January. OOD would like to increase the number of students participating in more independent work experiences in the summer and throughout the school year.
Data as of 9/25/2018; does not capture complete FFY 2018Source: 2018 Fiscal Data 09/26/18 & 2017 Fiscal Data 04/03/18
SUMMER YOUTH PROGRAMMING
SUMMER YOUTH2017
2018 % Change
# PARTICIPANTS PAID # PARTICIPANTS PAIDTOTAL
AUTHORIZED
Non-Permanent Job Development
288 $234,015.78 506 $314,727.45 $417,706.95 +78.5%
Summer Youth Work Experience
2,109 $5,383,412.32 2,195 $4,654,283.13 $5,566,384.03 +3.40%
Summer Youth Career Exploration
460 $536,419.44 547 $539,311.31 $608,417.53 +13.42%
Summer Youth – Mileage (Non-Unique)
1,117 $135,130.70
TOTAL 2,857 $6,288,978.24 3,248 $5,508,321.89 $6,592,508.51 +4.82%
Average Cost Per Case (NPJD included)
$2,201.25 $2,029.71 -7.79%

EMPLOYMENT OUTCOMES

3,373 3,5103,714
4,580
5,562
6,642
5,9805,755
0
1,000
2,000
3,000
4,000
5,000
6,000
7,000
FFY 2011 FFY 2012 FFY 2013 FFY 2014 FFY 2015 FFY 2016 FFY 2017 FFY 2018
Total Rehabilitations
Stakeholder Feedback and Opportunities 17
Results: A 70.6% increase in Total Rehabilitations.

$11.11
$10.58
$10.27 $10.07
$10.34
$11.14 $11.04
$11.48
$9.00
$9.50
$10.00
$10.50
$11.00
$11.50
$12.00
FFY 2011 FFY 2012 FFY 2013 FFY 2014 FFY 2015 FFY 2016 FFY 2017 FFY 2018
Average Wage Per Hour
Average Wage Per Hour
Stakeholder Feedback and Opportunities 18
Results: An increase of 14% in average wage per hour since FFY 2014. Making further improvements in this area is an important area of focus for OOD. Note: New common
performance measures under WIOA include median earnings of participants in unsubsidized employment during the 2nd quarter after exit from the program.

23.9
28.527.3
25.3
22.8
19.317.6 17.2
0
5
10
15
20
25
30
FFY 2011 FFY 2012 FFY 2013 FFY 2014 FFY 2015 FFY 2016 FFY 2017 FFY 2018
Time to Rehabilitation (in months)
Results: A 28% reduction in the time to rehabilitation (39.6% since FFY 2012). This is occurring while the percentage of students with disabilities served (who have a
longer time to rehabilitation) is increasing.
19Stakeholder Feedback and Opportunities

JOB DEVELOPMENT
Stakeholder Feedback and Opportunities 20
JOB DEVELOPMENT
(EXCLUDES SITE DEVELOPMENT & NON-PERMANENT
JOB DEVELOPMENT)
2017
(Includes Mileage &
Report)
2018 % Change
# Participants 12,228 11,755
(2,316 Supported Employment)
PAID PAID TOTAL AUTHORIZED
Job Development – UOS $8,658,247.40 $1,524,148.02 $1,661,601.52 -80.81%Job Development – Tier I $6,641,628.46 $6,919,847.50 $7,974,100.00 +20.06%Job Development – Tier II $3,755,741.79 $3,637,251.14 $5,458,505.31 +45.34%Job Development – Tier III (Includes Premiums) $3,406,859.20 $3,783,606.30 $4,876,974.85 +43.15%Job Development - Subsequent $119,559.10 $112,213.90 $180,521.30 +50.99%PB-JD Mileage $618,042.23 N/A N/A N/A
SE-JD Tier I N/A $2,224,025.97 $2,589,421.97 N/A
SE – JD Tier II N/A $1,197,830.50 $1,930,563.00 N/A
SE-JD Tier III (Includes Premiums) N/A $1,132,622.75 $1,512,958.75 N/A
SE-JD Subsequent N/A $37,091.00 $59,576.25 N/A
TOTAL $23,200,078.18 $20,568,637.08 $26,244,222.95 +13.12%
Average Cost Per Case $1,897.29 $2,232.60 +17.67%
While slightly fewer participants required Job Development, spending in this area is projected to be comparable in FFY 2018. Note: final analysis will not be complete until all
bills for FFY 2018 are submitted and processed, typically in January.
Data as of 9/25/2018; does not capture complete FFY 2018Source: 2018 Fiscal Data 09/26/18 & 2017 Fiscal Data 04/03/18

CASELOAD MAKEUP- ORDER OF SELECTION
FFY 2018:
• 57% Most Significant Disability (MSD)
• 42% Significant Disability (SD)
• 1% Disability (D)
According to 34 CFR 361.5(30), there are seven functional capacity areas that are taken into consideration when determining priority for services:
Mobility
Communication
Self-Care
Self-Direction
Interpersonal Skills
Work Tolerance
Work Skills
Stakeholder Feedback and Opportunities 21

Stakeholder Feedback and Opportunities 22Data as of 10/5/18; does not capture complete FFY 2018Source: 2018 Fiscal Data 09/6/18 & 2017 Fiscal Data 04/03/18
In FFY 2018, OOD is projected to spend $2.9 Million on Placement Premiums. Note: final analysis will not be complete until all bills for FFY 2018 are submitted and processed,
typically in January.
PLACEMENT PREMIUMS TO DATE (NO DATA FOR FFY17 – NEW SERVICE)
TOTAL # AUTHORIZED
PAID OUTSTANDING TOTAL
Tier III A - Rapid 889 $1,409,218.15 $340,844.05 $1,750,062.20 Tier III B - SGA 127 $209,671.55 $36,647.05 $246,318.60 Tier III C – Rapid + SGA 189 $347,370.55 $95,220.00 $442,590.55 SE-JD Tier III A - Rapid 196 $350,185.75 $106,897.50 $457,083.25 SE-JD Tier III B - SGA 6 $14,252.50 $0.00 $14,252.50 SE-JD Tier III C – Rapid + SGA 14 $30,135.50 $8,326.50 $38,462.00 TOTAL 1,421 $2,360,834.00 $587,935.10 $2,948,769.10
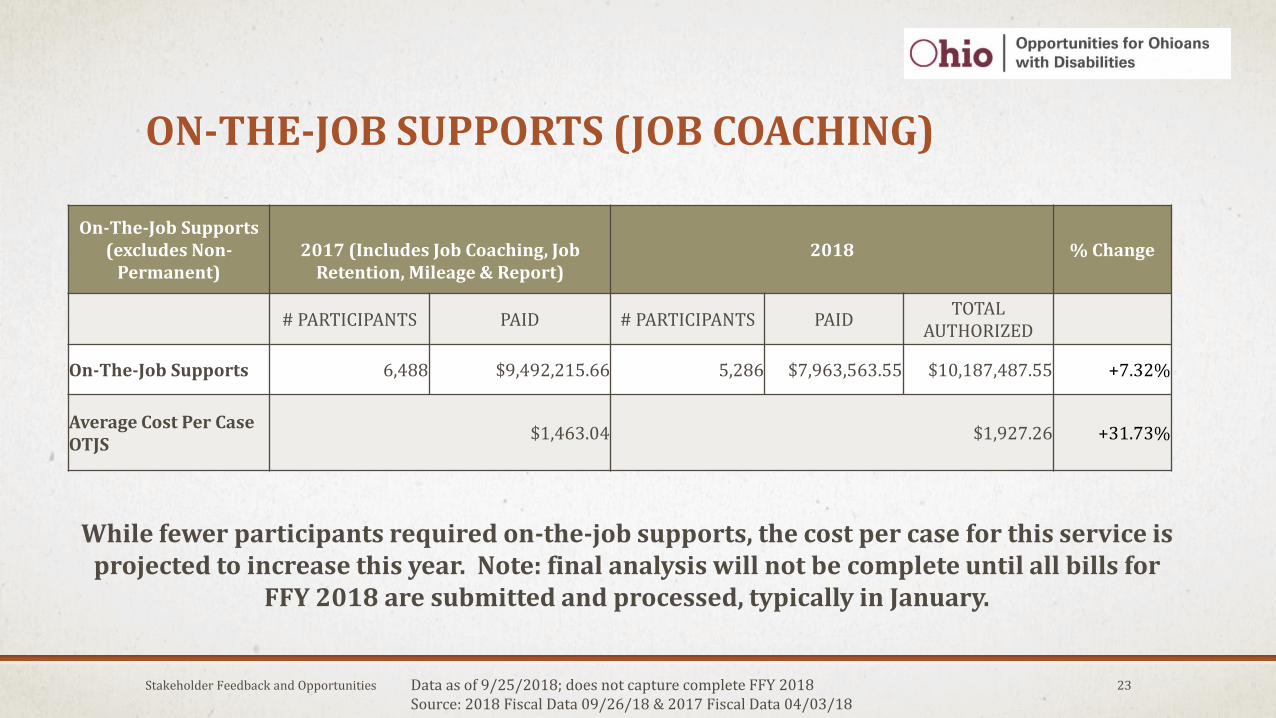
ON-THE-JOB SUPPORTS (JOB COACHING)
Stakeholder Feedback and Opportunities 23
While fewer participants required on-the-job supports, the cost per case for this service is projected to increase this year. Note: final analysis will not be complete until all bills for
FFY 2018 are submitted and processed, typically in January.
Data as of 9/25/2018; does not capture complete FFY 2018Source: 2018 Fiscal Data 09/26/18 & 2017 Fiscal Data 04/03/18
On-The-Job Supports (excludes Non-
Permanent)2017 (Includes Job Coaching, Job
Retention, Mileage & Report)2018 % Change
# PARTICIPANTS PAID # PARTICIPANTS PAIDTOTAL
AUTHORIZED
On-The-Job Supports 6,488 $9,492,215.66 5,286 $7,963,563.55 $10,187,487.55 +7.32%
Average Cost Per Case OTJS
$1,463.04 $1,927.26 +31.73%

COST PER CASE METRICS

$10,190 $10,152 $9,773
$8,786
$7,451 $7,442
$0
$2,000
$4,000
$6,000
$8,000
$10,000
$12,000
FFY 2012 FFY 2013 FFY 2014 FFY 2015 FFY 2016 FFY 2017
Cost Per Employment Outcome
Results: A 24.1% reduction in Cost Per Employment Outcome.
25Stakeholder Feedback and Opportunities

$3,555 $3,378
$2,800 $2,760 $2,921
$2,697
$0
$500
$1,000
$1,500
$2,000
$2,500
$3,000
$3,500
$4,000
FFY 2012 FFY 2013 FFY 2014 FFY 2015 FFY 2016 FFY 2017
Cost Per Served
Cost Per Served
Stakeholder Feedback and Opportunities 26
Results: A 24.1% reduction in the average cost per individual served.

PROVIDER CAPACITYSERVICE AREA MODIFIER

SERVICE AREA MODIFIER (SAM)
• The Service Area Modifier (SAM) is an additional flat fee that is authorized when a provider is asked to serve participants outside of their designated territory should the need arise. OOD built this into the Fee Schedule to ensure statewide service coverage, so that if no local providers were available, participants would still be able to obtain required services.
• OOD has only issued 25 authorizations that included a SAM during FFY 2018, for a total of $5,242.20
• The limited need for SAM utilization demonstrates that provider coverage through the state has stayed strong.
Stakeholder Feedback and Opportunities 28Data as of 9/25/2018; does not capture complete FFY 2018Source: 2018 Fiscal Data 09/26/18 & 2017 Fiscal Data 04/03/18
Note: Final analysis will not be complete until all bills for FFY 2018 are submitted and processed, typically in January.
COMMUNITY EMPLOYMENT SUPPORT PROFESSIONAL CERTIFICATIONREQUIREMENT EFFECTIVE JANUARY 1, 2019

CESP CREDENTIAL – INVESTING IN OUR PROVIDERS
• OOD sponsored 328 provider staff to sit for the CESP examination in its initial round of support
• OOD has arranged funding for an additional round of support for 500 provider staff to sit for the CESP examination
• APSE reports that there are currently 520 professionals in the state of Ohio who hold this credential
• OOD has invested over $88,000 during FFY 2018, and plans to invest an additional $99,500 in FFY 2019, for CESP examinations for provider staff
Stakeholder Feedback and Opportunities 30APSE.org CESP Directory Search on 10/5/2018

NEXT STEPS

FEEDBACK FOLLOWING STAKEHOLDER MEETINGS
• Stakeholder Meetings are being held regionally during October and early November
• Please send any additional feedback to [email protected] for consideration by November 16th
• OOD values your input and partnership
• Thank you!
Stakeholder Feedback and Opportunities 32