Embed Size (px)
Citation preview

Introduction
In a solvent extraction (SX) plant, stage efficiencycalculations are used to determine mixer efficien-cy. With modern extractants and mixing equip-ment, it is generally taken for granted that stageefficiencies will be above 95%, but this is notalways the case. Dependant on mixer/solutionconditions, stage efficiencies can occasionally below, therefore leading to higher reagent usage.Proper methods to identify when stage efficiencyperformance is below expectations, and ways toidentify if it is an equipment or chemical issue arevaluable tools for a plant metallurgist. With thesetools and skills an on-site metallurgist can morequickly return their SX plant to proper operation.This paper will discuss methods for analyzingstage efficiency, evaluating factors that may affectstage efficiency, and evaluating the impact of stageefficiency on the overall operation.
Methods for DeterminingStage Efficiency
Stage efficiency is a critical parameter to monitorin solvent extraction plants in order to ensure costefficient operation. Stage efficiency calculationsmay be completed in a number of different wayshowever they are most commonly determined viaMcCabe-Thiele construction. Stage efficiency
calculations give an indication of how well thesolutions are being mixed and their approach toequilibrium.
Graphical MethodTypically stage efficiencies are calculated by graph-ical methods comparing the circuit performanceto that which could be achieved based on theequilibrium isotherms.
The isotherms are generated by mixing the aque-ous feed solution (Pregnant Leach Solution, orPLS) and plant organic to equilibrium at variousO/A ratios. PLS is mixed with the barren organicfor an extract isotherm. Lean electrolyte is mixedwith the loaded organic for a strip isotherm. Theaqueous and organic solutions are then separated,filtered, and the copper concentrations in boththe aqueous and organic phases are measured.This data is then graphed to show the equilibriumconditions achievable, as shown in Figure 1 and 2.
Stage Efficiency in Copper SolventExtraction Plants
TECHN I CAL PAPER Solvent Extract ion
By Matthew Soderstrom, Cytec Industries Inc., Tempe, AZ, USA
Troy Bednarski, Cytec Industries Inc., Tempe, AZ, USA
Enrique Villegas, Cytec Industries Inc., Hermosillo, Sonora, Mexico
Figure 1 - Extract Isotherm Figure 2 - Strip Isotherm
www.cytec.com
Aq Cu
Org
Cu
Org Cu
Aq
Cu
A full metallurgical profile of the plant (i.e.analyzing the copper concentration of all inlets,outlets and intermediate stages of the plant) isobtained and plotted against the equilibriumisotherms generated under the plant conditionsat the time. Figure 3 shows an example processflow diagram.
Samples 1-8 would then be analyzed and plottedagainst the extract and strip isotherm graphspreviously created, as shown in Figures 4 and 5for extract and strip stages respectively.
After completion of the McCabe-Thieleconstruction, stage efficiency for any stage can bedetermined graphically. The distance between theisotherm and the McCabe-Thiele diagrams indi-cates the efficiency at which each stage is running.
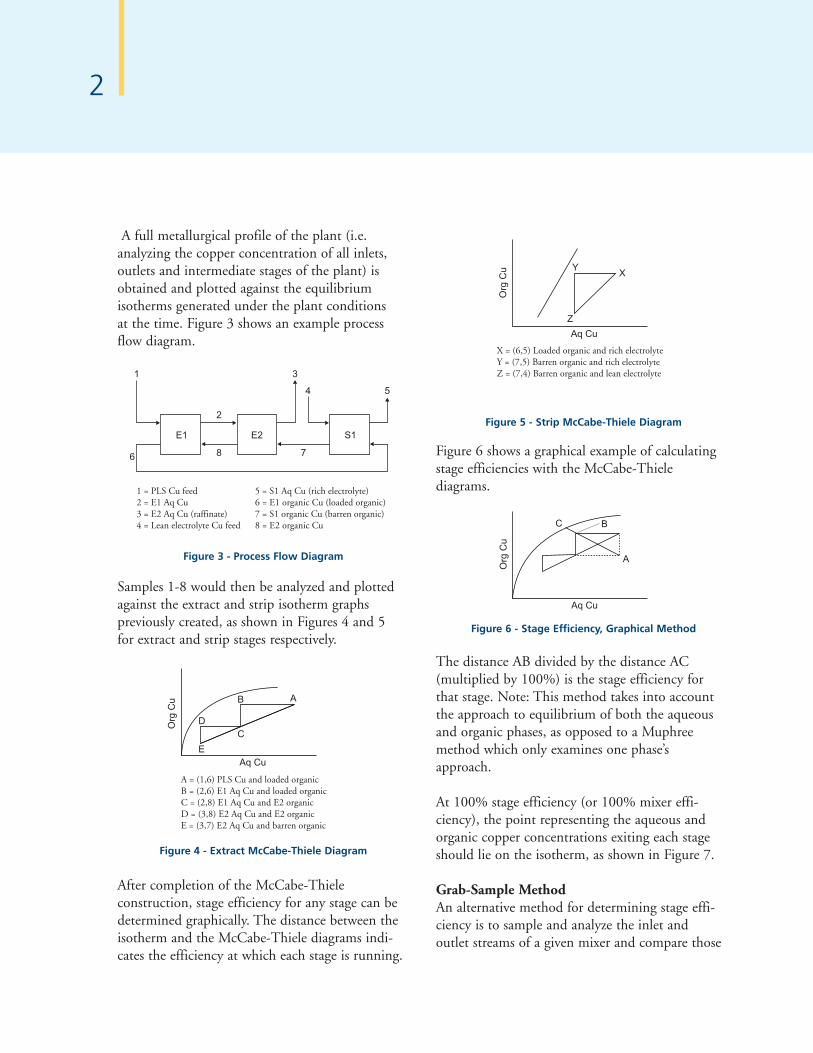
Figure 6 shows a graphical example of calculatingstage efficiencies with the McCabe-Thielediagrams.
The distance AB divided by the distance AC(multiplied by 100%) is the stage efficiency forthat stage. Note: This method takes into accountthe approach to equilibrium of both the aqueousand organic phases, as opposed to a Muphreemethod which only examines one phase’sapproach.
At 100% stage efficiency (or 100% mixer effi-ciency), the point representing the aqueous andorganic copper concentrations exiting each stageshould lie on the isotherm, as shown in Figure 7.
Grab-Sample MethodAn alternative method for determining stage effi-ciency is to sample and analyze the inlet andoutlet streams of a given mixer and compare those
2
Figure 3 - Process Flow Diagram
1 = PLS Cu feed2 = E1 Aq Cu3 = E2 Aq Cu (raffinate)4 = Lean electrolyte Cu feed
5 = S1 Aq Cu (rich electrolyte)6 = E1 organic Cu (loaded organic)7 = S1 organic Cu (barren organic)8 = E2 organic Cu
E1 E2
1 3
6 8
2
7
4 5
S1
Figure 4 - Extract McCabe-Thiele Diagram
D
B A
C
Aq Cu
Org
Cu
E
A = (1,6) PLS Cu and loaded organicB = (2,6) E1 Aq Cu and loaded organicC = (2,8) E1 Aq Cu and E2 organicD = (3,8) E2 Aq Cu and E2 organicE = (3,7) E2 Aq Cu and barren organic
Figure 5 - Strip McCabe-Thiele Diagram
X = (6,5) Loaded organic and rich electrolyteY = (7,5) Barren organic and rich electrolyteZ = (7,4) Barren organic and lean electrolyte
Aq Cu
Org
Cu X
Y
Z
Figure 6 - Stage Efficiency, Graphical Method
B
A
C
Aq Cu
Org
Cu

3
results to what could be obtained by mixing theinlet streams to equilibrium separately using theflow O/A ratio. The stage efficiency can then becalculated as shown by Figure 8 and Equation 1:
If a circuit profile indicates a low stage efficiency,it should be rechecked through additionalMcCabe-Thiele evaluations or using the grab-sample method for determining stage efficiency.There can be a number of reasons for poor stageefficiency (i.e. poor mixing due to short circuit-ing, non-homogeneity, organic quality, impuritieswithin the feed, insufficient retention time, lowtemperatures, etc.). Whatever the cause, improv-ing stage efficiency will result in lower operatingcosts and overall better operation.
Impact of Poor Stage Efficiency
Poor stage efficiency has a direct impact onreagent utilization and net transfer properties –therefore operating costs. Low stage efficiencywill lead to low copper recovery for the givenoperational conditions.
Table 1 shows the impact of stage efficiency oncopper recovery and the net transfer achievedfor fixed circuit conditions.[3]
Operational conditions:Circuit: 2 extract stages, 1 stripFeed: 3 gpl Cu pH 2.0Lean electrolyte: 30 gpl Cu; 180 gpl acidRich electrolyte: 45 gpl CuExtract O/A ratio 1:1Reagent 10 vol% ACORGA® M5774Strip Stage Efficiency: 95%Extract Stage Efficiency: Variable
To compensate for poor stage efficiency an opera-tion would need to add additional extractant toachieve the same Cu recovery. Note, there is alimit to the recovery gain by reagent additionalone. Using the above circuit conditions, theadditional reagent required to achieve 94.3%recovery (i.e., recovery corresponding to 97%stage efficiency) was calculated, as shown inFigure 9.
Figure 8 - Stage Efficiency, Batch Method
CD
A = Aqueous from equilibrated mixer sampleB = Organic from equilibrated mixer sampleC = Organic entering the mixerD = Aqueous entering the mixerE = Organic exiting the MixerF = Aqueous exiting the Mixer
EF
Figure 7 - Stage Efficiency, Graphical Method
B
A
C
Aq Cu
Org
Cu
Table 1 - Recovery and Net Transfer with Varying ExtractStage Efficiencies
Extract StageEfficiency
RecoveryNet Transfer (gpl Cuper v/o extractant)
85% 87.7% 0.263
90% 90.6% 0.272
95% 93.3% 0.280
97% 94.3% 0.283
*100%Equation 1

4
For the extreme case (comparing 85% StageEfficiency to 97%) an additional 5 vol% reagentwould be required to achieve the same recovery.Under these conditions, the circuit would be farfrom optimized and the net transfer would suffer.The additional extractant required to achieve theCu recovery target would result in more uncom-plexed oxime, which would then be available forpotential Fe transfer. The cost implications of lowstage efficiency can be estimated. The impact onreagent consumption is shown in Table 2. (Basis:8000 gpm flow, 40 ppm entrainment, EquivalentSX Cu transfer, $10 USD/kg reagent cost)
The other cost implications of low stage efficiencyand the approach selected to overcome it (moreextractant; more mixer energy; etc.) also need tobe considered. Higher mixer agitation can lead to
higher entrainments. Higher extractant concentra-tion can potentially lead to higher Fe transfer,adding other costs (Co loss, current efficiency, Cure-circulated, mist suppressants, leveling agents,etc.)[2]
Graphical Method for Determining MixerEfficiency from Kinetics Data2
Although difficult to scale, batch kinetic data givesa real and accurate method to evaluate differentvariables for their potential impact on stage effi-ciency under the given mixing conditions. Somevariables are listed below.• Temperature• Residence time• Tip speed/energy input• Reagent quality• Surfactants / impurities• Solution viscosity• Mix box O/A ratio• Reagent Formulation
Note: Dependant on plant mixing conditions, thekinetic or mixing differences brought about by achange may or may not result in lower plant stageefficiency. Example: a plant with efficient multi-stage mixing and/or longer retention times may beable to tolerate a greater variation in conditions –without a noticeable variation in stage efficiency.However plants with limited mixing, limitedretention times, or operating significantly beyonddesign may be more limited in their tolerance tochanging operational conditions.
Using standardized mixing equipment, as shownin Figure 10, generate a kinetics curve under pre-determined conditions (O/A, continuity, mixerspeed, temperature, etc.).
Figure 9 - % Cu Recovery vs. Additional ExtractantRequirement
95
93
94
92
91
90
89
88
87
%C
uR
ecov
ery
6Additional Extractant Required (v/o)
85% SE 90% SE 95% SE 97% SE
0 1 2 3 4 5
Table 2 - Reagent Consumption as a Function of ExtractStage Efficiency
Extract StageEfficiency
Reagent Cost/yr
Cost Difference/year
97% $611,142 $0
95% $635,588 $24,446
90% $733,371 $122,228
85% $916,714 $305,571

5
1) Mix the aqueous and organic samples togetherand sample the mixture at various time inter-vals (for example 0, 15, 30, 60, 90, 120, 900seconds).
2) Allow the phases to separate and analyze themetal concentration in one phase (both toconfirm accuracy).
3) Plot the results as metal concentration (g/l) inone phase against time (sec).
4) Draw a smooth curve through the points anddraw tangent lines to the curve at several metalconcentration points along the curve (shownin Figure 11).
The slope of the tangent lines for each metal con-centration will give a rate of change (gpl metal perunit time) vs the specified metal concentrations asshown in Table 3.
Once the rate/concentration data has been collect-ed, plot the rate of change against concentration.Draw a line with a slope equivalent to the recipro-cal of the target residence time – begin at theinlet/starting concentration and a rate of zero (0).Stage efficiency can then be estimated for differ-ent residence times by drawing lines of differentslopes as shown in Figure 12.
The point of intersection of the retention timeline and rate curve is the expected exit concentra-tion of the phase under consideration at the givenresidence time. The intersection of the rate curvewith the X axis provides the expected equilibriumvalue.
Once the exit concentration is known, the stageefficiency can be calculated from the equilibriumvalue (900 second value). The stage efficiency iscalculated as the exit concentration minus thestarting concentration divided by the equilibriumconcentration minus the starting concentration.Table 4 shows the results for Figure 12.Figure 11 - Organic Cu Concentration vs Time
76.5
65.5
54.5
43.5
32.5
21.5
10.5
00 10 20 30 40 50 60 70 80 90 100 110 120 13 0
Org
Cu
(gpl
)
Time (sec)
Figure 12 - Stage Efficiency for a Single Mixer Stage
60’ sec
120 sec
60 sec0.1000.0900.0800.0700.0600.0500.0400.0300.0200.0100.000
0 0.5 1 1.5 2 2.5 3Org Cu (gpl)
Rat
eof
Cha
nge
(gpl
/s)
3.5 4 4.5 5 5.5 6
Figure 10 - Standard Mixing Vesssel
1 cm Baffle(4 in all)
1 literBeaker
Graduatedscale (mm)
Water out
Thermometerpocket
Water in3 cm
B 24 sockets
10.2 cm
Table 3 - Transfer Rate as a Function of MetalConcentration
Org Cu (gpl) 1.57 3.74 4.80 5.41 5.66
Rate (gpl/sec) 0.209 0.082 0.029 0.011 0.005

6
Multiple MixersFor multiple mixers the same technique may beused. Draw a straight line representing the resi-dence time of the first mixer. Use the exit concen-tration as the starting concentration for the linerepresenting the residence time in the secondmixer.
Figure 13 shows an example of a single mixer witha residence time of two minutes in comparison totwo-stage mixing with a primary and secondarymixer each with a residence time of one minute.The two stage mixer has a first outlet concentra-tion of 4.05 gpl which is used as the starting con-centration in the second mixer. The resulting exitconcentration of the second stage mixer is 5.20gpl corresponding to a stage efficiency of 88.5%.The exit concentration of the single stage mixerafter an equivalent residence time of two minutesis 4.60 gpl corresponding to a stage efficiency of78.3%.
Stage Efficiency Based onBatch Kinetic Data
Oxime comparisonThree commercial oximes samples were comparedunder identical extract mixing conditions in thelaboratory. The reagents were made up to 20 vol%solutions in standard diluent, and mixed with asynthetic feed solution containing 6 gpl Cu at pH2.0. The mixing vessel was a one liter jacketedflask, fitted with baffles. The mixer was a six blad-ed flat turbine mixer located three cm from thevessel bottom. The agitation rate was set at 600rpm. (Note: 600 rpm was selected as a low agita-tion setting for this test equipment to increasesensitivity for kinetic differences.)
The organic solutions were added to the mixer,the agitator was started and the aqueous solutionwas then added (maintaining organic continuity).Ten ml samples of the solution were then takenfrom the mixer at set time intervals (15, 30, 45,60, 90, 500 seconds). The plot of organic metalconcentration vs. time was generated and from it atransfer rate vs. organic metal concentration curvewas generated. The expected results for a singlestage mixer using a three minute mixer retention
time was then calculated as shown in Table 5.As shown the C9 aldoxime formulation is expect-ed to obtain the highest stage efficiency, followedby the C12 aldoxime and then the ketoxime.
Formulation comparisonNumerous commercial reagent formulations werethen compared under identical conditions. The
Table 4 - Stage Efficiency vs. Retention Time
Time(sec)
StartingConc (gpl)
Oulet Conc(gpl)
EquilibriumConc (gpl)
SE%
60 0 4.05 5.877 68.9
120 0 4.60 5.877 78.3
180 0 4.85 5.877 82.5
Figure 13 - Stage Efficiency for a Multi-Stage vsSingle Mixer Stage
0.100
60’ sec
120 sec
60 sec0.0900.0800.0700.0600.0500.0400.0300.0200.0100.000
0 0.5 1 1.5 2 2.5 3Org Cu (gpl)
Rat
eof
Cha
nge
(gpl
/s)
3.5 4 4.5 5 5.5 6
Table 5 - Stage Efficiency
Formulation Stage Efficiency
20 vol% C9 aldoxime 90%
20 vol% C12 aldoxime 7%
20 vol% ketoxime 72%

7
expected stage efficiency for a single mixer (3minute mixer retention time) is shown in Table 6.
As shown the C9 aldoxime formulations tend tohave the faster kinetics and therefore expected toprovide higher stage efficiencies for given mixingconditions. Note: All the calculated stage efficien-cies are lower than what would typically be seen inpractice – but demonstrates the relative kineticdifferences.
Impact of Aqueous viscosity20 v/o ACORGA M5640 kinetic behavior wasevaluated with numerous aqueous solutions con-taining varying amounts of impurity ions. Eachaqueous solution was prepared by diluting a realleach liquor sample (one with a high content ofimpurities) with water and then adjusting Cu andpH to the same original value. Solutions weremixed at a mixer speed of 600 rpm, under organiccontinuity at room temperature. The analysis wascompleted assuming three stage mixing, each stagewith one minute retention time (3-minutes total).The results are shown in Table 7.
The leach liquor sample for this evaluation hadextremely high aqueous viscosity due to thebuildup of Al and Mg sulfate over time. Thehigher the aqueous viscosity, the lower the stageefficiency under the test conditions.
Plant Organic Quality ComparisonAlthough the quality of the supplied reagent iscritical to its performance in the SX circuit, withany formulation, the overall organic quality willtend to decrease with time if the organic remainsuntreated. Build up of surfactants/impurities fromleaching, presence of oxidative degradation prod-ucts, or other impurities may have a significantimpact on the stage efficiencies obtainable forgiven mixing conditions. A 10 v/o ACORGAM5640 formulation was intentionally degradedwithin the laboratory through contact with anelectrolyte containing permanganate ions (result-ing in oxidative degradation). The kinetics andimpact on stage efficiency for the fresh organicand the degraded organic is shown in Table 8.Conditions: 600 rpm; 3-minute retention time;organic continuity; one mixer; 25°C.
Oxidative degradation (or the presence of anyother impurities) within the organic phase canhave a significant effect on stage efficiency. Thepresence of impurities within the organic phasecan often (but not always) be seen in the phasedisengagement or interfacial characteristics of theorganic. Low interfacial tension or prolongedphase disengagement is often the sign of poororganic quality and should be considered for itspotential impact on stage efficiency. Standardpractice to remove the impurities is treatmentwith activated clay.
Table 6 - Formulation Comparison
*LIX is a registered trademark of Cognis Corp.
FormulationStage
Efficiency
ACORGA® M5774(C9 modified aldoxime)
86.5%
ACORGA® OPT® 5510(modified C9 aldoxime/ketoxime blend)
81.1%
LIX* 984N(C9 aldoxime /ketoxime blend)
80.0%
LIX 984(C12 aldoxime/ketoxime blend)
77.3
Table 7 - Impact of Aqueous Viscosity
WaterDilution, %
AqueousViscosities, cP
Stage Efficiency, %
0 7.8 91.6
25 4.2 94.1
50 2.8 95.6
75 1.7 98.3
Table 8 - Organic Quality Comparison
StageEfficiency
Phase DisengagementTime(s)
IFT
Fresh 91% 15 35.8
Degraded 88% 105 35.0

Organic/Aqueous Mixer RatioA sample of plant organic was tested utilizing twoO/A ratios under strip conditions. Conditions:600 rpm; organic continuity; 25°C; single mixer;1.8 minute mixer retention time. Results areshown in Table 9.
Under these mixing conditions, the mix was non-homogenous at the high O/A ratio resulting inlow stage efficiency.
Typical Plant Operating Stage Efficiency
Table 10 shows typical stage efficiencies (deter-mined via McCabe-Thiele analysis) for a numberof North and South American Cu SX operations.As shown, stage efficiency tends to be high, espe-cially in stripping. Nearly 50% of the stages havestage efficiencies averaging above 95%; and over80% have stage efficiencies greater than 90%.
Stage efficiency is shown as-measured fromcommercial plant profiles using McCabe-Thieletechniques. Some variability is expected. Whenevaluating a plant via McCabe-Thiele techniquesthere are a number of factors to be considered:bleed addition location; acid make-up location;impact of entrainments; temperature variationbetween isotherm generation and plant operation;and plant conditions when sampling (i.e., is theplant at steady state).
Practical ExampleMcCabe-Thiele analysis showed low stageefficiency in a strip mixer. Based on theseresults, grab-sample stage efficiency analysis
was completed on-site confirming the low stageefficiency. Samples were then taken to thelaboratory for further analysis. The kinetics of
8
Table 9 - Impact of Strip O/A Ratio
O/A Mix Ratio Stage Efficiency
5.2/1 75%
2.0/1 84%
Plant/Train E1 E2 E3 S1 S2
1 89 94 982 90 93 943 90 96 994 93 91 97 725 92 84 97 796 99 98 97 977 100 98 988 93 95 1019 93 96 10110 87 91 93 9111 86 89 98 8912 98 98 10513 93 86 10214 87 95 10215 98 100 9016 92 94 10217 88 92 10118 88 98 9219 95 100 9320 95 97 93 10021 96 96 100 10022 92 95 100 10023 98 87 9124 96 90 9325 96 90 9926 99 98 9827 94 97 98 9328 92 100 95 9629 88 87 9730 85 93 9131 97 96 97 8732 92 92 94 6633 92 92 9034 92 98 92 7535 87 98 94 7736 93 90 78 7537 98 98 9638 92 92 9839 89 85 90
Table 10 - Plant Stage Efficiency

9
plant organic was compared to the kinetics of freshorganic under controlled conditions. The resultsindicated equivalent stage efficiency would beexpected for the two organics, therefore not organ-ic-quality related. Testing with synthetic and plantelectrolyte also showed equivalent performancebetween plant and fresh reagent, therefore notlikely due to impurities in the electrolyte. Theinvestigation was then focused on plant mixingconditions. Numerous options for improving stageefficiency were identified. Through plant testing,improvement of stage efficiency was obtainedthrough optimization of aqueous recycle flow,creating a more uniform mix (flow had beendiminished by scaling issues).
Conclusions
Stage efficiency is an important metallurgicalparameter for Cu SX plants. The McCabe-Thieleand Grab-Sample techniques are valid methods formonitoring stage efficiency of the plant. Batchkinetic data may be generated within the labunder controlled conditions to allow a relativecomparison of the impact of operational changesor solution characteristics. The methodology canassist greatly in troubleshooting an operation. Thekinetic performance of the extractant formulationis one key criteria which should be consideredwhen comparing reagents. Do not assume allreagents will achieve the same stage efficiency,especially when non-ideal mixing conditions (lowtemperatures, higher-than-design flows, etc.) exist.
References
[1] Matthew Soderstrom, Troy Bednarski, DamienShiels, Keith Cramer (2007) UnderstandingReagent Consumption, ALTA 2007.
[2] Dom Cupertino, M. Charlton, D. Buttar, RonSwart and Charles Maes, (1999), A Study ofCopper/Iron Separation in Modern SolventExtraction Plants, Copper 1999.
[3] Octave Levenspiel, Chemical ReactionEngineering, 2nd ed., Wiley & Sons, pg. 62(1972).
Cytec Industries Inc. in its own name and on behalf of its affiliated companies (collectively, "Cytec") decline any liability with respect to theuse made by anyone of the information contained herein. The information contained herein represents Cytec's best knowledge thereon with-out constituting any express or implied guarantee or warranty of any kind (including, but not limited to, regarding the accuracy, the com-pleteness or relevance of the data set out herein). Cytec is the sole owner or authorized user of the intellectual property rights relating tothe information communicated. The information relating to the use of the products is given for information purposes only. No guarantee orwarranty is provided that the product is adapted for any specific use. The user or purchaser should perform its own tests to determine thesuitability for a particular purpose. The final choice of use of a product remains the sole responsibility of the user.
© 2010 Cytec Industries Inc. All rights reserved.
TRADEMARK NOTICE: The ® indicates a RegisteredTrademark in the United States and the ™ or *
indicates a Trademark in the United States. The markmay also be registered, the subject of an application
for registration or a trademark in other countries.
MCT-1032-A-EN-WW-07B
• Email: [email protected] Worldwide Contact Info: www.cytec.com US Toll Free 800-652-6013 Tel 973-357-3193 •