Embed Size (px)
Citation preview

Staff Reports for May 2018

Sep-17 Oct-17 Nov-17 Dec-17 Jan-18 Feb-18 Mar-18 Apr-18 May-18 Jun-18 Jul-18 Aug-18
FYTD
Total 2018
TREC LL 20,080 24,167 19,613 17,392 29,256 26,446 28,439 26,271 30,063 221,727
TALCB LL 1,426 2,015 1,671 1,371 3,279 2,930 2,619 1,495 1,926 18,732
Total Calls 21,506 26,182 21,284 18,763 32,535 29,376 31,058 27,766 31,989 0 0 0 240,459
Sep-17 Oct-17 Nov-17 Dec-17 Jan-18 Feb-18 Mar-18 Apr-18 May-18 Jun-18 Jul-18 Aug-18
FYTD
Total 2018
Licensing 117 235 123 152 223 296 320 272 295 2,033
Education 27 14 21 18 12 19 23 23 14 171
Inspector 10 11 3 14 5 4 15 11 16 89
Enforcement 18 12 14 16 9 25 16 15 21 146
TALCB Lic 10 5 4 7 6 6 11 13 12 74
TALCB Enf 2 4 2 0 0 1 0 0 3 12
Total 184 281 167 207 255 351 385 334 361 0 0 0 2,525
Sep-17 Oct-17 Nov-17 Dec-17 Jan-18 Feb-18 Mar-18 Apr-18 May-18 Jun-18 Jul-18 Aug-18
FYTD
Total 2018
Licensing 6,518 7,290 8,032 5,748 12,637 10,781 9,148 7,247 8,426 75,827
Education 2,216 1,717 1,498 1,145 433 802 675 390 399 9,275
Inspector 466 382 320 236 104 109 109 92 128 1,946
Enforcement 190 244 259 176 192 315 258 254 292 2,180
TALCB Lic 474 381 366 401 526 384 296 318 341 3,487
TALCB Enf 15 9 10 11 11 17 16 18 14 121
Total 9,879 10,023 10,485 7,717 13,903 12,408 10,502 8,319 9,600 0 0 0 92,836
C1 Report
FY2018
Reception and Communication Services Division
Walk Ins
Emails
Incoming Calls
TREC TALCB
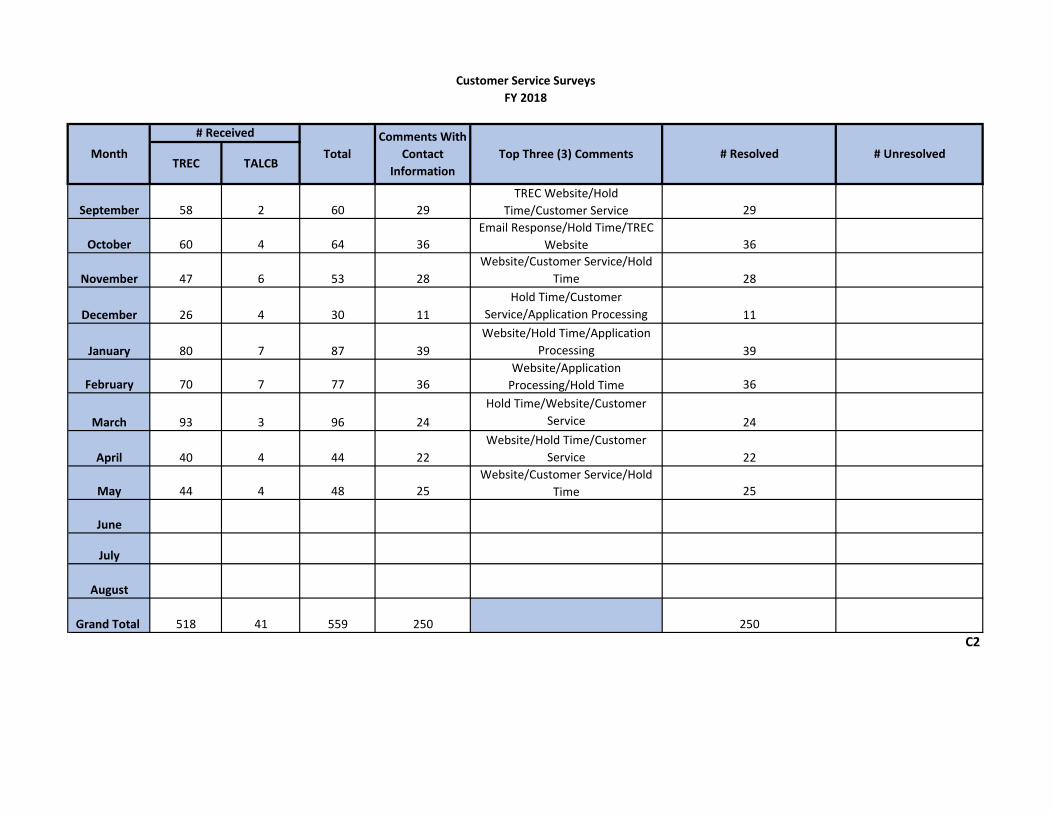
September 58 2 60 29
TREC Website/Hold
Time/Customer Service 29
October 60 4 64 36
Email Response/Hold Time/TREC
Website 36
November 47 6 53 28
Website/Customer Service/Hold
Time 28
December 26 4 30 11
Hold Time/Customer
Service/Application Processing 11
January 80 7 87 39
Website/Hold Time/Application
Processing 39
February 70 7 77 36
Website/Application
Processing/Hold Time 36
March 93 3 96 24
Hold Time/Website/Customer
Service 24
April 40 4 44 22
Website/Hold Time/Customer
Service 22
May 44 4 48 25
Website/Customer Service/Hold
Time 25
June
July
August
Grand Total 518 41 559 250 250
C2
Customer Service Surveys
FY 2018
Month
# Received
Total
Comments With
Contact
Information
Top Three (3) Comments # Resolved # Unresolved

C3
Average Length of Call
Average Hold Time
Sept - Nov Dec - Feb March - May June - Aug
5:156:00 6:00
0:00
15:00
18:15
16:45
0:00
FY 2018 CALL AVERAGESMIN:SEC
Average Length of Call Average Hold Time

FISCAL END OF TOTAL G.R.L. TRAINEE TOTAL
YEAR MONTH GENERAL RESIDENTIAL LICENSE G.R.L. CHANGE TRAINEE CHANGE TOTAL CHANGE
2013 Aug13 2,367 2,371 470 5,208 724 5,932
2014 Aug14 2,386 2,405 453 5,244 36 760 36 6,004 72
2015 Aug 15 2,408 2,415 434 5,257 13 779 19 6,036 32
2016 Sep15 2,406 2,417 428 5,251 -6 786 7 6,037 1
Oct15 2,414 2,418 431 5,263 12 791 5 6,054 17
Nov15 2,417 2,420 430 5,267 4 793 2 6,060 6
Dec15 2,419 2,425 430 5,274 7 795 2 6,069 9
Jan16 2,420 2,422 428 5,270 -4 794 -1 6,064 -5
Feb16 2,418 2,418 427 5,263 -7 783 -11 6,046 -18
Mar16 2,423 2,417 427 5,267 4 784 1 6,051 5
Apr16 2,431 2,415 429 5,275 8 774 -10 6,049 -2
May16 2,425 2,415 417 5,257 -18 773 -1 6,030 -19
Jun16 2,425 2,422 416 5,263 6 784 11 6,047 17
Jul16 2,425 2,423 417 5,265 2 774 -10 6,039 -8
Aug16 2,426 2,425 416 5,267 2 789 15 6,056 17
2017 Sep16 2,429 2,423 412 5,264 -3 784 -5 6,048 -8
Oct16 2,431 2,419 414 5,264 0 787 3 6,051 3
Nov16 2,428 2,418 408 5,254 -10 777 -10 6,031 -20
Dec16 2,436 2,422 411 5,269 15 782 5 6,051 20
Jan17 2,431 2,416 410 5,257 -12 789 7 6,046 -5
Feb17 2,434 2,412 423 5,269 12 792 3 6,061 15
Mar17 2,440 2,424 425 5,289 20 807 15 6,096 35
Apr17 2,428 2,426 421 5,275 -14 817 10 6,092 -4
May17 2,425 2,418 422 5,265 -10 822 5 6,087 -5
Jun17 2,410 2,412 421 5,243 -22 827 5 6,070 -17
Jul17 2,404 2,404 422 5,230 -13 852 25 6,082 12
Aug17 2,398 2,407 423 5,228 -2 868 16 6,096 14
2018 Sep17 2,408 2,410 426 5,244 16 883 15 6,127 31
Oct17 2,417 2,412 431 5,260 16 912 29 6,172 45
Nov17 2,396 2,406 428 5,230 -30 893 -19 6,123 -49
Dec17 2,400 2,406 432 5,238 8 907 14 6,145 22
Jan18 2,394 2,401 436 5,231 -7 922 15 6,153 8
Feb18 2,387 2,403 441 5,231 0 928 6 6,159 6
Mar18 2,375 2,396 436 5,207 -24 911 -17 6,118 -41
Apr18 2,371 2,391 432 5,194 -13 914 3 6,108 -10
May18 2,370 2,386 432 5,188 -6 907 -7 6,095 -13
May 2018: Out-of-State Temporary Registrations = 136; Inactive Appraisers = 165)
TEXAS APPRAISER LICENSING AND CERTIFICATION BOARD
ACTIVE CERTIFICATIONS AND LICENSES

FISCAL Paper Online Total Total AMC Total AMC
YEAR MONTH Apps Received Apps Received Apps Received Registrations Issued Renewals Issued
2012 - Total 130 46 176 169 0
2013 - Total 6 11 17 23 0
2014 - Total 3 9 12 13 138
2015 - Total 11 5 16 15 17
2016 - Total 8 2 10 11 128
2017 Sep16 2 0 2 2 1
Oct 16 0 1 1 0 3
Nov 16 0 0 0 1 2
Dec 16 0 1 1 1 3
Jan 17 2 0 2 0 0
Feb 17 0 1 1 2 1
Mar 17 0 0 0 0 0
Apr 17 1 0 1 0 3
May 17 1 2 3 1 0
Jun 17 1 2 3 2 4
Jul 17 2 0 2 6 1
Aug 17 0 0 0 0 3
2017 - Total 9 7 16 15 21
2018 Sep 17 1 2 3 1 1
Oct 17 0 0 0 2 2
Nov 17 0 1 1 1 1
Dec 17 0 0 0 0 2
Jan 18 0 0 0 0 3
Feb 18 0 1 1 1 4
Mar 18 1 1 2 0 4
Apr 18 0 0 0 1 4
May 18 0 2 2 1 7
CUMULATIVE TOTALS 169 87 256 253 332
Registrations Surrendered as of May 2018 23
Registrations Revoked as of May 2018 3
Registrations Expired > 6 months as of May 2018 48
TOTAL AMC REGISTRATIONS - May 2018 175
TEXAS APPRAISER LICENSING AND CERTIFICATION BOARD
APPRAISAL MANAGEMENT COMPANY REGISTRATIONS
May 2018

This YTD Last YTD 09/17 - 05/18 09/16 - 05/17 Count Percent
Original Applications ReceivedCertified General Applications 114 109 5 4.59%
Certified Residential Applications 93 60 33 55.00%
Licensed Residential Applications 59 67 -8 -11.94%
Appraiser Trainee Applications 296 259 37 14.29%
Non-Residential Temporary Applications 190 169 21 12.43%
Total Original Applications 752 664 88 13.25%
Licenses Issued from Original ApplicationsCertified General Licenses 83 94 -11 -11.70%
Certified Residential Licenses 71 55 16 29.09%
Licensed Residential Licenses 54 54 0 0.00%
Appraiser Trainee Licenses 265 212 53 25.00%
Non-Residential Temporary Licenses 189 170 19 11.18%
Total Licenses from Original Applications 662 585 77 13.16%
Licenses Issued from Renewal Applications Certified General Renewals 861 1,006 -145 -14.41%
Certified Residential Renewals 897 901 -4 -0.44%
Licensed Residential Renewals 166 183 -17 -9.29%
Appraiser Trainee Renewals 289 346 -57 -16.47%
Total Renewal Licenses Issued 2,213 2,436 -223 -9.15%
Licenses Issued from Late Renewal Applications Certified General Late Renewals 5 3 2 66.67%
Certified Residential Late Renewals 3 5 -2 -40.00%
Licensed Residential Late Renewals 3 3 0 0.00%
Appraiser Trainee Late Renewals 16 14 2 14.29%
Total Late Renewal Licenses Issued 27 25 2 8.00%
Change
Education & Licensing Services Division - TALCBFiscal Year Comparison
MAY
ELS Division Fiscal Year Comparison L1 Report

YEAR-TO-DATE RESULTS: September 2017 thru May 2018 Overall Pass Rate
Licensed Certified CertifiedResidential Residential General
Examinations Passed 31 38 37 106
Examinations Failed 23 36 17
Examinations Taken 54 74 54 182
Examination Pass Rate (%) 57.41% 51.35% 68.52% 58.24%
108
74
106
76
182
MONTHLY RESULTS: Overall Pass Rate
Licensed Certified CertifiedResidential Residential General
Examinations Passed 3 5 5 13
Examinations Failed 3 2 4
Examinations Taken 6 7 9 22
Examination Pass Rate (%) 50.00% 71.43% 55.56% 59.09%
14
8
13
9
22
Total fail:
Total examinations taken:
Total pass:
Total fail:
Total examinations taken:
Examination Activity - Fiscal Year 2018
May 2018
All examination types
Total first time candidates:
Examination Activity - Fiscal Year 2018
All examination types
Total first time candidates:
Total repeat candidates:
Total repeat candidates:
Total pass:

EXAMINATION ACTIVITY
YEAR-TO-DATE COMPARISON
MAY
2017 2018
Pass Rate Pass Rate
Certified General Appraiser 74.4% 68.52%
Certified Residential Appraiser 61.9% 51.35%
Licensed Residential Appraiser 54.6% 57.41%
Overall Appraiser Pass Rate 62.4% 58.24%

Website FYTD Total
Prior FYTD
Total
Total Pages Viewed 134,995 4,491,697 6,382,822Total Monthly Unique Visits 12,600 249,251 259,909
Online FYTD Online Prior FYTD
Online Transactions Total Online Percent Percent PercentApplications 41 26 63.4% 64.3% 52.1%
AMC 2 1 50.0% 75.0% 8.3%Certified General Appraiser 8 2 25.0% 41.5% 23.7%Certified Residential Appraiser 6 3 50.0% 46.0% 39.6%State Licensed Appraiser 5 4 80.0% 59.5% 45.4%Appraiser Trainee 20 16 80.0% 77.1% 72.2%
Renewals 210 195 92.9% 92.3% 91.5%AMC 14 9 64.3% 77.1% 100.0%Certified General Appraiser 63 62 98.4% 90.3% 90.1%Certified Residential Appraiser 93 87 93.5% 95.5% 94.8%State Licensed Appraiser 16 15 93.8% 92.4% 80.2%Appraiser Trainee 24 22 91.7% 88.1% 93.2%
AMC Panel Transactions 1725 1725 100.0% 100.0% 100.0%Additions 739 739 100.0% 100.0% 100.0%Removals 986 986 100.0% 100.0% 100.0%
Information & Technology Services Electronic Information Outlet Statistics I1 Report
Information & Technology Services Division
Electronic Information Outlet Statistics
May 2018
Current Month

Applications May '17 June '17 July '17 Aug '17 Sep '17 Oct '17 Nov '17 Dec '17 Jan '18 Feb '18 Mar '18 Apr '18 May '18AMC 0.0% 0.0% 50.0% N/A 100.0% 100.0% 100.0% N/A N/A 100.0% N/A 0.0% 50.0%
Certified General Appraiser 14.3% 75.0% 0.0% 40.0% 44.4% 44.4% 50.0% 37.5% 50.0% 57.1% 37.5% 33.3% 25.0%
Certified Residential Appraiser 50.0% 66.7% 10.0% 33.3% 0.0% 75.0% 36.4% 37.5% 20.0% 60.0% 54.5% 50.0% 50.0%
State Licensed Appraiser 0.0% 75.0% 50.0% 50.0% 66.7% 60.0% 50.0% 75.0% 33.3% 62.5% 50.0% 50.0% 80.0%
Appraiser Trainee 72.0% 76.0% 71.4% 75.0% 70.0% 78.8% 82.4% 78.6% 70.4% 73.9% 80.8% 80.0% 80.0%
Total Utilization - Applications 52.5% 71.1% 47.0% 63.4% 60.0% 71.7% 61.5% 64.6% 57.5% 67.3% 66.0% 62.9% 63.4%
Renewals May '17 June '17 July '17 Aug '17 Sep '17 Oct '17 Nov '17 Dec '17 Jan '18 Feb '18 Mar '18 Apr '18 May '18AMC N/A 100.0% 100.0% N/A 100.0% 100.0% 0.0% 100.0% 100.0% 75.0% 75.0% 100.0% 64.3%
Certified General Appraiser 93.9% 89.6% 93.0% 95.8% 92.5% 89.5% 90.1% 91.3% 88.7% 85.7% 85.9% 94.3% 98.4%
Certified Residential Appraiser 94.1% 96.9% 97.6% 87.5% 95.1% 97.5% 98.8% 93.1% 96.8% 85.7% 93.8% 91.5% 93.5%
State Licensed Appraiser 75.0% 100.0% 85.7% 76.5% 100.0% 100.0% 95.0% 70.6% 100.0% 93.8% 92.9% 90.9% 93.8%
Appraiser Trainee 100.0% 93.3% 91.7% 100.0% 75.0% 93.8% 100.0% 100.0% 94.4% 84.2% 68.4% 87.0% 91.7%
Total Utilization - Renewals 93.9% 93.5% 94.5% 89.9% 93.2% 94.7% 94.4% 91.1% 93.5% 91.3% 87.8% 91.9% 92.9%
Panel Management Tool May '17 June '17 July '17 Aug '17 Sep '17 Oct '17 Nov '17 Dec '17 Jan '18 Feb '17 Mar '18 Apr '18 May '18AMC Panel Invitations 100.0% 100.0% 100.0% 100.0% 100.0% 100.0% 100.0% 100.0% 100.0% 100.0% 100.0% 100.0% 100.0%
AMC Panel Removals 100.0% 100.0% 100.0% 100.0% 100.0% 100.0% 100.0% 100.0% 100.0% 100.0% 100.0% 100.0% 100.0%
Total Utilization - Panel Manageme 100.0% 100.0% 100.0% 100.0% 100.0% 100.0% 100.0% 100.0% 100.0% 100.0% 100.0% 100.0% 100.0%
Information & Technology Services Electronic Information Outlet Statistics I2 Report
Information & Technology Services Division
Electronic Information Outlet Statistics
May 2018
20.0%30.0%40.0%50.0%60.0%70.0%80.0%
May '17 June '17 July '17 Aug '17 Sep '17 Oct '17 Nov '17 Dec '17 Jan '18 Feb '18 Mar '18 Apr '18 May '18
Utilization Online Application Services
Total Utilization - Applications
80.0%
85.0%
90.0%
95.0%
100.0%
May '17 June '17 July '17 Aug '17 Sep '17 Oct '17 Nov '17 Dec '17 Jan '18 Feb '18 Mar '18 Apr '18 May '18
Utilization Online Renewal Services
Total Utilization - Renewals
80.0%
85.0%
90.0%
95.0%
100.0%
May '17 June '17 July '17 Aug '17 Sep '17 Oct '17 Nov '17 Dec '17 Jan '18 Feb '17 Mar '18 Apr '18 May '18
Utilization Online Panel Management Tool
Total Utilization - Panel…

Staff & Support Services Division
TALCB Budget Status Report
3/12 =25.00%
Budget Actual Budget %
FY2018 Expenditures Balance Remaining Comments
Salaries & Wages $895,655 $622,718 $272,937 30.5%
Employee Benefits 288,204 210,170 78,034 27.1%
Retiree Insurance 45,582 22,402 23,180 50.9%
Other Personnel Costs 33,440 21,792 11,648 34.8%remaining budget geared toward possible lump sum
payments, compensatory per diem for board members and
longevity pay
Professional Fees & Services 54,710 30,922 23,788 43.5%remaining budget geared toward any expert testimony,
OAG and SOAH costs, Sunset Advisory Audit Services
Consumables 6,500 1,325 5,175 79.6%
Utilities 2,200 687 1,513 68.8%
Travel 35,000 27,974 7,026 20.1%remaining budget geared toward remaining travel costs for
Board Members
Office Rent 15,853 27,253 (11,400) -71.9%Annual rent paid to Texas Facilities Commission. Rent
expense higher than anticipated due to decrease in SWCAP
allocation.
Equipment Rental 10,250 6,354 3,896 38.0%
Registration & Membership 10,375 5,109 5,266 50.8%remaining budget geared toward conferences and
Attorney CLE costs
Maintenance & Repairs 5,707 16,347 (10,640) -186.4% Versa software maintenance $14K
Reproduction & Printing 1,600 13 1,588 99.2%remaining budget geared toward envelopes, business
cards and any miscellaneous services needed
Contract Services 23,060 4,854 18,206 79.0%remaining budget geared toward court reporters,
transcripts, subpoenas, security guards for meetings,
imaging and storage of documents/records
Postage 6,350 2,800 3,550 55.9%
Supplies & Equipment 3,500 2,367 1,133 32.4%
Communication Services 17,526 11,654 5,872 33.5%remaining budget geared toward electronic subscriptions,
Local and long distance service
Other Operating Expenses 4,342 3,478 864 19.9%
Subtotal -Operations Expenditures 1,459,854 1,018,218 441,636 30.3%
DPS Criminal History Background Checks 3,200 92 3,108 97.1%
Statewide Cost Allocation Plan (SWCAP) 35,510 13,675 21,835 61.5%SWCAP 1st and 2nd quarterly payments made as of report
date
Contribution to General Revenue 25,275 18,956 6,319 25.0% allocated monthly; will be paid in August 2018
Subtotal - Nonoperational Expenditures 63,985 32,723 31,262 48.9%Total Expenditures $1,523,839 $1,050,941 $472,898 31.0%
Revenue
FY2018
Projected
Revenue
Collected
Revenue
Remaining to be
Collected
Revenue %
Remaining to be
Collected Comments
License Fees $1,046,482 $875,389 $171,093 16.3%
AMCs 731,100 382,605 $348,495 47.7%
9 new AMCs; 55 renewals; added 4,952 panelists and
14,985 panelists renewed as of report date. Majority of
projected AMC revenues occur in last two quarters of the
year.
Administrative Penalties 34,560 18,051 $16,509 47.8%
Other Miscellaneous Revenue 21,215 15,706 $5,509 26.0% Exam Admin Fees/NSF fees/Misc/Public Info fees
Total Revenue $1,833,357 $1,291,751 $541,606 29.5%
FY18
Carry Forward
Allocated
Amount
Remaining to be
Allocated
Carry Forward %
Remaining
AMC Revenue Carry Forward from FY18 to FY19 ($284,337) ($213,253) ($71,084) 25.0% Pro-rated thru May
Revenue Over/(Under) Expenditures & Transfers $25,181 $27,557 Includes AMC Carry Forward from FY18 to FY19
Expenditure Category
May 2018
Staff and Support Services Agency Budget Status Report S1 Report

Beginning Ending
Purchase Par Purchase Market Additions Market Accrued Maturity
Date Value Price Value Changes Value Interest Description Date
09/13/2017 374,000.00 374,856.23 372,597.50 359.04 372,956.54 792.72 U.S. T-Notes, 1.000% 09/15/2018
12/20/2017 200,000.00 199,034.34 198,914.00 156.00 199,070.00 1,153.85 U.S. T-Notes, 1.250% 12/15/2018
06/20/2017 250,000.00 249,725.92 249,812.50 137.50 249,950.00 1,298.08 U.S. T-Notes, 1.130% 06/15/2018
Totals $ 824,000.00 $ 823,616.49 $ 821,324.00 $ 652.54 $ 821,976.54 $ 3,244.65
Beginning Current Cumulative
Balance Month Totals
Beginning Cash Available Balance $ 755,574.85
Current Month Receipts $ 194,768.52
Current Month Disbursements $ (111,280.00)
Total Cash $ 839,063.37
Investment Ending Market Value 821,976.54
Total Account Balance 1,661,039.91
Reserved for Long-Term Facilities Master Plan (1,016,776.00)
Reserved for Education Development (80,171.93)
Ending Balance Available for Operations $ 564,091.98
Investment Compliance: These investments have been made in compliance with the Board's Investment Policy.
Melissa Huerta, Alternate Investment Officer Oretha Trice, Alternate Investment OfficerPriscilla Pipho, Investment Officer
Staff Services DivisionTx Appraiser Licensing & Certification Board Operating Account No. 3056 Investments
Holdings ReportMay 2018
Monthly Activity
Staff and Support Services TALCB Operating Account Investments S1A Report

Case Classification FY2016 FY2017 17-Sep 17-Oct 17-Nov 17-Dec 18-Jan 18-Feb 18-Mar 18-Apr 18-May 18-Jun 18-Jul 18-Aug FYTDComplaint Category:AMCs 0 0 0 0 0 0 0 0 0 0 0 0Dodd Frank 18 10 1 1 0 1 0 1 0 1 0 5Ethics 4 10 0 0 1 1 0 5 7 8 5 27USPAP 131 107 7 9 4 10 6 6 7 6 7 62Other 32 39 0 2 0 0 0 4 0 0 2 8No Jurisdiction 8 9 0 1 0 0 0 0 0 2 3 6
193 175 8 13 5 12 6 16 14 17 17 0 0 0 SUB: 108Experience Audits 146 139 14 21 12 11 9 11 17 9 8 112RFAs & Covert Complaints 5 1 0 0 0 0 0 0 0 0 0 0MCD Inquiries 8 10 1 0 0 1 1 1 0 0 1 5
158 150 15 21 12 12 10 12 17 9 9 0 0 0 SUB: 117Opened During FY Year|Month 351 325 23 34 17 24 16 28 31 26 26 0 0 0 225
Case Disposition FY2016 FY2017 17-Sep 17-Oct 17-Nov 17-Dec 18-Jan 18-Feb 18-Mar 18-Apr 18-May 18-Jun 18-Jul 18-Aug FYTD
Surrendered 7 3 0 0 0 0 0 2 0 0 0 2Agreed Final Order / Final Order 54 40 0 0 15 27 0 10 0 6 0 58Other Disciplinary Action 1 1 0 0 0 0 0 0 0 0 0 0Insufficient Evidence 4 3 1 0 1 0 0 0 0 0 0 2Dismissed 129 98 9 8 12 26 32 11 1 5 11 115No Jurisdiction 9 13 0 1 0 0 0 0 0 2 3 6
204 158 10 9 28 53 32 23 1 13 14 0 0 0 SUB: 183Experience Audits 140 112 12 11 21 5 10 26 9 12 19 125RFAs 4 9 0 1 0 0 1 0 0 0 1 3MCD Inquiries 6 12 0 1 0 0 1 1 0 0 1 4
151 133 12 13 21 5 12 27 9 12 21 0 0 0 SUB: 132Closed During FY Year|Month 345 291 22 22 49 58 44 50 10 25 35 0 0 0 315
Total Cases Open as of 5/31/18: 138
# of Cases Received
# of Cases Closed
TALCB Standards & Enforcement ServicesCASE STATUS REPORT as of May 31, 2018

Case Classification FY2016 FY2017 17-Sep 17-Oct 17-Nov 17-Dec 18-Jan 18-Feb 18-Mar 18-Apr 18-May 18-Jun 18-Jul 18-Aug FYTDComplaint Category:AMC Compliance 0 8 0 0 0 0 0 0 0 0 0 0Dodd Frank 0 0 0 0 0 0 0 0 0 0 0 0Ethics 0 0 0 0 0 0 0 0 0 0 0 0USPAP 0 0 0 0 0 0 0 0 0 0 0 0Other 15 1 1 0 0 1 1 0 1 0 0 4No Jurisdiction 3 0 0 0 0 0 0 0 0 0 1 1
18 9 1 0 0 1 1 0 1 0 1 0 0 0 SUB: 5RFAs & Covert Complaints 0 0 0 0 0 0 0 0 0 0 0
Opened During FY Year|Month 18 9 1 0 0 1 1 0 1 0 1 0 0 0 5
Case Disposition FY2016 FY2017 17-Sep 17-Oct 17-Nov 17-Dec 18-Jan 18-Feb 18-Mar 18-Apr 18-May 18-Jun 18-Jul 18-Aug FYTD
Surrendered 0 1 0 0 0 0 0 0 0 0 0 0Agreed Final Order 0 0 0 0 0 0 0 0 0 0 0 0Other Disciplinary Action 0 0 0 0 0 0 0 0 0 0 0 0Insufficient Evidence 2 1 0 0 0 0 0 0 0 0 0 0Dismissed 8 12 1 1 0 0 0 0 0 0 1 3No Jurisdiction 2 0 1 0 0 1 0 0 1 0 1 4
12 14 2 1 0 1 0 0 1 0 2 0 0 0 SUB: 7RFAs & Covert Complaints 0 0 0 0 0 0 0 0 0 0 0
Closed During FY Year|Month 12 14 2 1 0 1 0 0 1 0 2 0 0 0 7
Total Cases Open as of 5/31/18: 4
TALCB Standards & Enforcement ServicesAMC CASE STATUS REPORT as of May 31, 2018
# of Cases Received
# of Cases Closed