Embed Size (px)
DESCRIPTION
Bioarchaeological research must balance scholarly commitment to the generation of new knowledge,descendants’ interests in their collective past, and the now common practice of rapid re-interment ofexcavated human remains. This paper documents the first results of a negotiated protocol built on theretention of one tooth per archaeologically derived skeleton, teeth that can then be used for destructivetesting associated with ancient DNA and stable isotope investigations. Seven archaeological sites datingfrom the 13th to 16th centuries provided 53 teeth, 10 of which were subdivided between DNA andisotope labs. All tooth roots yielded haplogroup results, and five provided more detailed sequence results.Stable isotopes of carbon and nitrogen document heavy reliance on maize among all individuals, as wellas reliance on a diverse range of fish. This work establishes baseline mtDNA information for NorthernIroquoians, and confirms the value of using dental tissues for dietary reconstruction. Particularly whenhuman remains are fragmentary or co-mingled, this approach holds promise for ongoing incorporationof bioarchaeology into reconstructions of past peoples’ lives. 2013 The Authors. Published by Elsevier Ltd. All rights reserved.
Citation preview
lable at ScienceDirect
Journal of Archaeological Science 42 (2014) 334e345
Contents lists avai
Journal of Archaeological Science
journal homepage: http: / /www.elsevier .com/locate/ jas
Stable dietary isotopes and mtDNA from Woodland period southernOntario people: results from a tooth sampling protocolq
Susan Pfeiffer a,b,*, Ronald F. Williamson c, Judith C. Sealy b, David G. Smith d,Meradeth H. Snowe
aDepartment of Anthropology, University of Toronto, 19 Russell Street, Toronto M5S 2S2, CanadabDepartment of Archaeology, University of Cape Town, Private Bag X3, Rondebosch 7701, South AfricacArchaeological Services Inc., 528 Bathurst Street, Toronto M5S 2P9, CanadadDepartment of Anthropology, University of California, One Shields Avenue, Davis 95616, USAeUniversity of Montana, Missoula, MT 59812, USA
a r t i c l e i n f o
Article history:Received 21 May 2013Received in revised form11 October 2013Accepted 6 November 2013
Keywords:Mitochondrial DNAOntario archaeologyLate WoodlandIroquoisMolecular anthropologyBioarchaeologyPalaeodietBone and tooth chemistryEnamelDentinCarbon isotopesNitrogen isotopesFisheriesGenetic diversity
q This is an open-access article distributed undeCommons Attribution-NonCommercial-No Derivativemits non-commercial use, distribution, and reproductthe original author and source are credited.* Corresponding author. Department of Anthropolo
Russell Street, Toronto M5S 2S2, Canada. Tel.: þ1 413217.
E-mail addresses: [email protected] (S. PfeF. Williamson), [email protected] (J.C. Sealy)G. Smith), [email protected] (M.H. Snow
0305-4403/$ e see front matter � 2013 The Authorshttp://dx.doi.org/10.1016/j.jas.2013.11.008
a b s t r a c t
Bioarchaeological research must balance scholarly commitment to the generation of new knowledge,descendants’ interests in their collective past, and the now common practice of rapid re-interment ofexcavated human remains. This paper documents the first results of a negotiated protocol built on theretention of one tooth per archaeologically derived skeleton, teeth that can then be used for destructivetesting associated with ancient DNA and stable isotope investigations. Seven archaeological sites datingfrom the 13th to 16th centuries provided 53 teeth, 10 of which were subdivided between DNA andisotope labs. All tooth roots yielded haplogroup results, and five provided more detailed sequence results.Stable isotopes of carbon and nitrogen document heavy reliance on maize among all individuals, as wellas reliance on a diverse range of fish. This work establishes baseline mtDNA information for NorthernIroquoians, and confirms the value of using dental tissues for dietary reconstruction. Particularly whenhuman remains are fragmentary or co-mingled, this approach holds promise for ongoing incorporationof bioarchaeology into reconstructions of past peoples’ lives.
� 2013 The Authors. Published by Elsevier Ltd. All rights reserved.
1. Introduction
The lower Great Lakes of North America were the focus of dra-matic cultural developments prior to European contact. The Tran-sitional to the Late Woodland period, ca. 1500 to 350 BP, saw thedevelopment of distinctive Iroquoian and Algonquian speaking
r the terms of the CreativeWorks License, which per-
ion in any medium, provided
gy, University of Toronto, 196 978 4004; fax: þ1 416 978
iffer), [email protected] (R., [email protected] (D.).
. Published by Elsevier Ltd. All righ
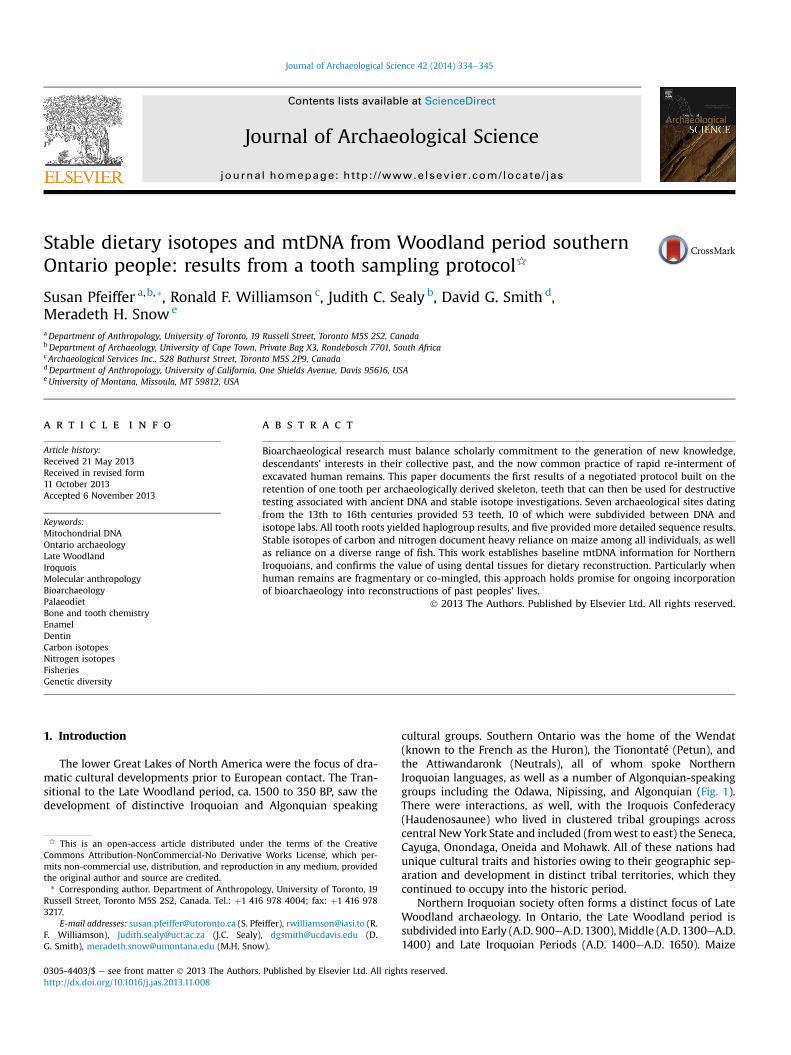
cultural groups. Southern Ontario was the home of the Wendat(known to the French as the Huron), the Tionontaté (Petun), andthe Attiwandaronk (Neutrals), all of whom spoke NorthernIroquoian languages, as well as a number of Algonquian-speakinggroups including the Odawa, Nipissing, and Algonquian (Fig. 1).There were interactions, as well, with the Iroquois Confederacy(Haudenosaunee) who lived in clustered tribal groupings acrosscentral New York State and included (fromwest to east) the Seneca,Cayuga, Onondaga, Oneida and Mohawk. All of these nations hadunique cultural traits and histories owing to their geographic sep-aration and development in distinct tribal territories, which theycontinued to occupy into the historic period.
Northern Iroquoian society often forms a distinct focus of LateWoodland archaeology. In Ontario, the Late Woodland period issubdivided into Early (A.D. 900eA.D.1300), Middle (A.D.1300eA.D.1400) and Late Iroquoian Periods (A.D. 1400eA.D. 1650). Maize
ts reserved.
Fig. 1. Distribution of First Nations populations of the Great Lakes, prior to disruptions associated with European contact. Labels in CAPS indicate broader language groups of theregion.
S. Pfeiffer et al. / Journal of Archaeological Science 42 (2014) 334e345 335
agriculture was an important organizing principle as large pali-saded base settlements around which maize was grown developedfrom about A.D. 1000 onward (Pihl et al., 2008). Around the turn ofthe fourteenth century, a fully developed agricultural systemincluding large, year-round occupied villages, new socially inte-grative institutions and distinctive material culture all point for thefirst time to a recognizably “Iroquoian” pattern as described in earlyEuropean reports of their life. Population growth followed(Warrick, 2008). By the mid-fifteenth century, communities werecoalescing in the face of violent conflict. By the early sixteenthcentury, these communities had consolidated with populationsbetween 1500 and 2000 people with new fully integrated identities(Birch and Williamson, 2013). One of the distinguishing sociallyintegrative features of ancestral and historic Huron-Wendat pop-ulationswas the Feast of the Dead, associatedwith secondary burialin ossuaries of as many as 500 deceased community members(Williamson and Steiss, 2003).
Early to mid-seventeenth century accounts from explorers andmissionaries provide information that can form a basis for hy-pothesis building (Thwaites, 1896-1901; Trigger, 1976). Thisapproach must be supplemented, or even challenged, when sitesare several hundred years older and when topics of interest arebeyond the scope of historic observations.
Among First Nations descendant communities, interest inancestral populations is growing. Permission to study the remainsof archaeologically discovered ancestors is often granted, contin-gent on conditions that only small fragments of human tissue beretained and that questions deemed pertinent to the descendantsbe addressed. In part because of the analytical limitations of co-mingled ossuary remains, a protocol of retaining one tooth perperson is a pragmatic approach. The approximate age and the sex ofthe person can be estimated from the morphology of the maxilla or
mandible fromwhich a permanent molar is taken, or the age in thecase of a deciduous tooth. Insofar as modern teeth are removed aspart of dental treatment and tooth loss is seen as a typical lifeexperience, teeth are rarely seen as being imbued with spiritualpower, so that this approach is acceptable to many descendants.The research described here arose as an exploratory project,designed to maximize the relevant information that could be ob-tained from a single human tooth. This project also marks the firstopportunity to examine the mitochondrial DNA composition ofancient Northern Iroquoian speakers. Relatively little is knownabout the relationship of these groups to other aboriginal pop-ulations of Northeast North America. As the mtDNA of Algonquiangroups of this region becomes better known (Dewar et al., 2010;Shook and Smith, 2008), information about northern Iroquoiansis a missing piece of the puzzle.
The teeth come from excavations in which the human remainswere reinterred after brief descriptive study and tooth sampling. Insome cases, study was limited to in-ground examination. One toothper person was retained with permission of the relevant First Na-tions groups, following a consultative process consistent with theOntario Cemeteries Act. Each archaeological site in the study il-lustrates different research opportunities and challenges. Only onetooth from one site is of probable Attiwandaronk ancestry; allothers are probable Wendat. One site, Staines Road, providednumerous teeth but they are from a disturbed context thatcompromised the generation of population information. Anothersite, Mantle, yielded two different contexts for human remains: aformal cemetery of primary interments and loose teeth foundwithin the living site. Despite varying contexts, study of the teethcan generate information about the proportion of the diet thatcame from maize and the sources of animal protein. Despite dif-ferences in the excavation contexts, the study provides
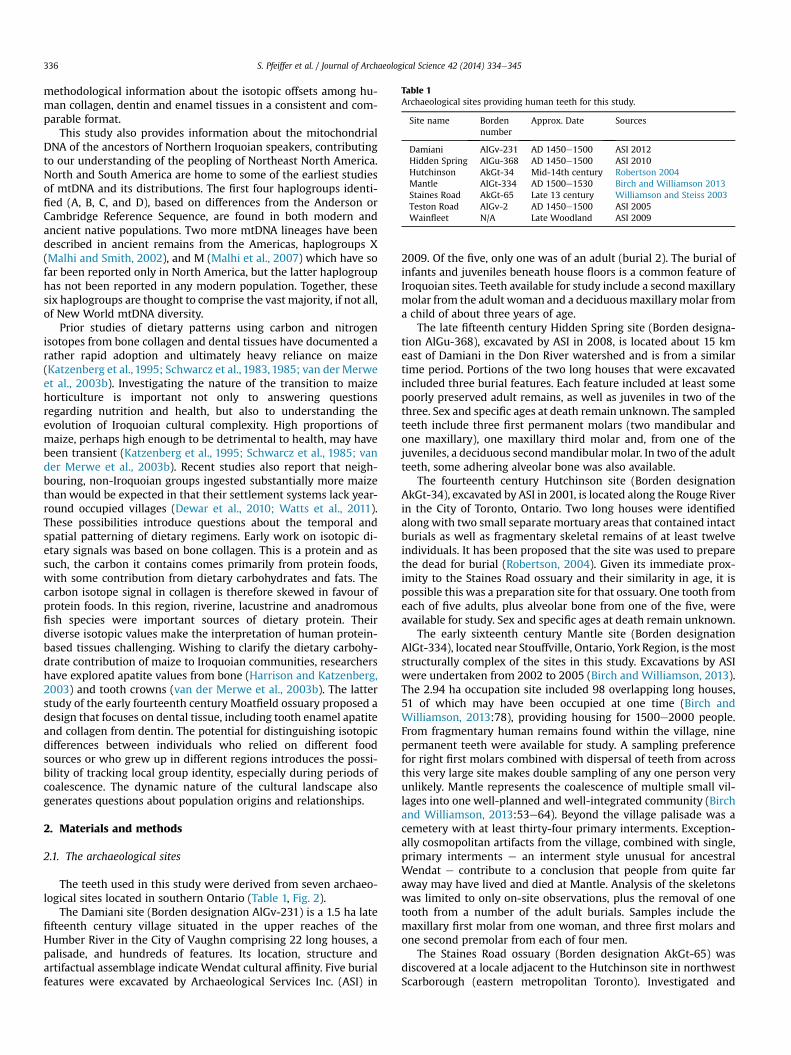
Table 1Archaeological sites providing human teeth for this study.
Site name Bordennumber
Approx. Date Sources
Damiani AlGv-231 AD 1450e1500 ASI 2012Hidden Spring AlGu-368 AD 1450e1500 ASI 2010Hutchinson AkGt-34 Mid-14th century Robertson 2004Mantle AlGt-334 AD 1500e1530 Birch and Williamson 2013Staines Road AkGt-65 Late 13 century Williamson and Steiss 2003Teston Road AlGv-2 AD 1450e1500 ASI 2005Wainfleet N/A Late Woodland ASI 2009
S. Pfeiffer et al. / Journal of Archaeological Science 42 (2014) 334e345336
methodological information about the isotopic offsets among hu-man collagen, dentin and enamel tissues in a consistent and com-parable format.
This study also provides information about the mitochondrialDNA of the ancestors of Northern Iroquoian speakers, contributingto our understanding of the peopling of Northeast North America.North and South America are home to some of the earliest studiesof mtDNA and its distributions. The first four haplogroups identi-fied (A, B, C, and D), based on differences from the Anderson orCambridge Reference Sequence, are found in both modern andancient native populations. Two more mtDNA lineages have beendescribed in ancient remains from the Americas, haplogroups X(Malhi and Smith, 2002), and M (Malhi et al., 2007) which have sofar been reported only in North America, but the latter haplogrouphas not been reported in any modern population. Together, thesesix haplogroups are thought to comprise the vast majority, if not all,of New World mtDNA diversity.
Prior studies of dietary patterns using carbon and nitrogenisotopes from bone collagen and dental tissues have documented arather rapid adoption and ultimately heavy reliance on maize(Katzenberg et al., 1995; Schwarcz et al., 1983, 1985; van der Merweet al., 2003b). Investigating the nature of the transition to maizehorticulture is important not only to answering questionsregarding nutrition and health, but also to understanding theevolution of Iroquoian cultural complexity. High proportions ofmaize, perhaps high enough to be detrimental to health, may havebeen transient (Katzenberg et al., 1995; Schwarcz et al., 1985; vander Merwe et al., 2003b). Recent studies also report that neigh-bouring, non-Iroquoian groups ingested substantially more maizethan would be expected in that their settlement systems lack year-round occupied villages (Dewar et al., 2010; Watts et al., 2011).These possibilities introduce questions about the temporal andspatial patterning of dietary regimens. Early work on isotopic di-etary signals was based on bone collagen. This is a protein and assuch, the carbon it contains comes primarily from protein foods,with some contribution from dietary carbohydrates and fats. Thecarbon isotope signal in collagen is therefore skewed in favour ofprotein foods. In this region, riverine, lacustrine and anadromousfish species were important sources of dietary protein. Theirdiverse isotopic values make the interpretation of human protein-based tissues challenging. Wishing to clarify the dietary carbohy-drate contribution of maize to Iroquoian communities, researchershave explored apatite values from bone (Harrison and Katzenberg,2003) and tooth crowns (van der Merwe et al., 2003b). The latterstudy of the early fourteenth century Moatfield ossuary proposed adesign that focuses on dental tissue, including tooth enamel apatiteand collagen from dentin. The potential for distinguishing isotopicdifferences between individuals who relied on different foodsources or who grew up in different regions introduces the possi-bility of tracking local group identity, especially during periods ofcoalescence. The dynamic nature of the cultural landscape alsogenerates questions about population origins and relationships.
2. Materials and methods
2.1. The archaeological sites
The teeth used in this study were derived from seven archaeo-logical sites located in southern Ontario (Table 1, Fig. 2).
The Damiani site (Borden designation AlGv-231) is a 1.5 ha latefifteenth century village situated in the upper reaches of theHumber River in the City of Vaughn comprising 22 long houses, apalisade, and hundreds of features. Its location, structure andartifactual assemblage indicate Wendat cultural affinity. Five burialfeatures were excavated by Archaeological Services Inc. (ASI) in
2009. Of the five, only one was of an adult (burial 2). The burial ofinfants and juveniles beneath house floors is a common feature ofIroquoian sites. Teeth available for study include a secondmaxillarymolar from the adult woman and a deciduousmaxillarymolar froma child of about three years of age.
The late fifteenth century Hidden Spring site (Borden designa-tion AlGu-368), excavated by ASI in 2008, is located about 15 kmeast of Damiani in the Don River watershed and is from a similartime period. Portions of the two long houses that were excavatedincluded three burial features. Each feature included at least somepoorly preserved adult remains, as well as juveniles in two of thethree. Sex and specific ages at death remain unknown. The sampledteeth include three first permanent molars (two mandibular andone maxillary), one maxillary third molar and, from one of thejuveniles, a deciduous secondmandibular molar. In two of the adultteeth, some adhering alveolar bone was also available.
The fourteenth century Hutchinson site (Borden designationAkGt-34), excavated by ASI in 2001, is located along the Rouge Riverin the City of Toronto, Ontario. Two long houses were identifiedalong with two small separate mortuary areas that contained intactburials as well as fragmentary skeletal remains of at least twelveindividuals. It has been proposed that the site was used to preparethe dead for burial (Robertson, 2004). Given its immediate prox-imity to the Staines Road ossuary and their similarity in age, it ispossible this was a preparation site for that ossuary. One tooth fromeach of five adults, plus alveolar bone from one of the five, wereavailable for study. Sex and specific ages at death remain unknown.
The early sixteenth century Mantle site (Borden designationAlGt-334), located near Stouffville, Ontario, York Region, is themoststructurally complex of the sites in this study. Excavations by ASIwere undertaken from 2002 to 2005 (Birch and Williamson, 2013).The 2.94 ha occupation site included 98 overlapping long houses,51 of which may have been occupied at one time (Birch andWilliamson, 2013:78), providing housing for 1500e2000 people.From fragmentary human remains found within the village, ninepermanent teeth were available for study. A sampling preferencefor right first molars combined with dispersal of teeth from acrossthis very large site makes double sampling of any one person veryunlikely. Mantle represents the coalescence of multiple small vil-lages into one well-planned and well-integrated community (Birchand Williamson, 2013:53e64). Beyond the village palisade was acemetery with at least thirty-four primary interments. Exception-ally cosmopolitan artifacts from the village, combined with single,primary interments e an interment style unusual for ancestralWendat e contribute to a conclusion that people from quite faraway may have lived and died at Mantle. Analysis of the skeletonswas limited to only on-site observations, plus the removal of onetooth from a number of the adult burials. Samples include themaxillary first molar from one woman, and three first molars andone second premolar from each of four men.
The Staines Road ossuary (Borden designation AkGt-65) wasdiscovered at a locale adjacent to the Hutchinson site in northwestScarborough (eastern metropolitan Toronto). Investigated and
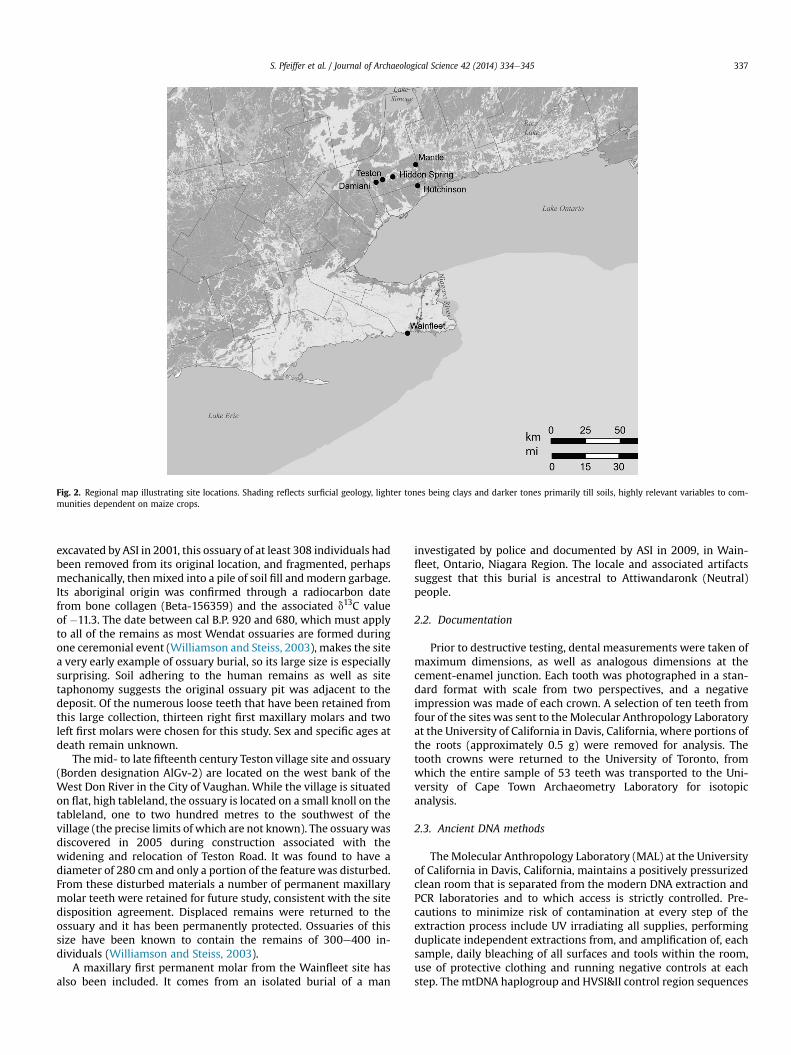
Fig. 2. Regional map illustrating site locations. Shading reflects surficial geology, lighter tones being clays and darker tones primarily till soils, highly relevant variables to com-munities dependent on maize crops.
S. Pfeiffer et al. / Journal of Archaeological Science 42 (2014) 334e345 337
excavated by ASI in 2001, this ossuary of at least 308 individuals hadbeen removed from its original location, and fragmented, perhapsmechanically, thenmixed into a pile of soil fill andmodern garbage.Its aboriginal origin was confirmed through a radiocarbon datefrom bone collagen (Beta-156359) and the associated d13C valueof �11.3. The date between cal B.P. 920 and 680, which must applyto all of the remains as most Wendat ossuaries are formed duringone ceremonial event (Williamson and Steiss, 2003), makes the sitea very early example of ossuary burial, so its large size is especiallysurprising. Soil adhering to the human remains as well as sitetaphonomy suggests the original ossuary pit was adjacent to thedeposit. Of the numerous loose teeth that have been retained fromthis large collection, thirteen right first maxillary molars and twoleft first molars were chosen for this study. Sex and specific ages atdeath remain unknown.
The mid- to late fifteenth century Teston village site and ossuary(Borden designation AlGv-2) are located on the west bank of theWest Don River in the City of Vaughan. While the village is situatedon flat, high tableland, the ossuary is located on a small knoll on thetableland, one to two hundred metres to the southwest of thevillage (the precise limits of which are not known). The ossuary wasdiscovered in 2005 during construction associated with thewidening and relocation of Teston Road. It was found to have adiameter of 280 cm and only a portion of the feature was disturbed.From these disturbed materials a number of permanent maxillarymolar teeth were retained for future study, consistent with the sitedisposition agreement. Displaced remains were returned to theossuary and it has been permanently protected. Ossuaries of thissize have been known to contain the remains of 300e400 in-dividuals (Williamson and Steiss, 2003).
A maxillary first permanent molar from the Wainfleet site hasalso been included. It comes from an isolated burial of a man
investigated by police and documented by ASI in 2009, in Wain-fleet, Ontario, Niagara Region. The locale and associated artifactssuggest that this burial is ancestral to Attiwandaronk (Neutral)people.
2.2. Documentation
Prior to destructive testing, dental measurements were taken ofmaximum dimensions, as well as analogous dimensions at thecement-enamel junction. Each tooth was photographed in a stan-dard format with scale from two perspectives, and a negativeimpression was made of each crown. A selection of ten teeth fromfour of the sites was sent to theMolecular Anthropology Laboratoryat the University of California in Davis, California, where portions ofthe roots (approximately 0.5 g) were removed for analysis. Thetooth crowns were returned to the University of Toronto, fromwhich the entire sample of 53 teeth was transported to the Uni-versity of Cape Town Archaeometry Laboratory for isotopicanalysis.
2.3. Ancient DNA methods
The Molecular Anthropology Laboratory (MAL) at the Universityof California in Davis, California, maintains a positively pressurizedclean room that is separated from the modern DNA extraction andPCR laboratories and to which access is strictly controlled. Pre-cautions to minimize risk of contamination at every step of theextraction process include UV irradiating all supplies, performingduplicate independent extractions from, and amplification of, eachsample, daily bleaching of all surfaces and tools within the room,use of protective clothing and running negative controls at eachstep. The mtDNA haplogroup and HVSI&II control region sequences
S. Pfeiffer et al. / Journal of Archaeological Science 42 (2014) 334e345338
of anyone having any contact with the samples and aDNA facilitiesin which the analyses were conducted were noted, to ensure thatany source of laboratory contamination of the aDNA samples couldbe identified.
The MAL conducted two independent DNA extractions on eachsample, following the standard protocols described in Kemp et al.(2006). Each sample was cleaned with 6% sodium hypochlorite(full strength household bleach; Kemp and Smith, 2005), andsoaked in 2mL of molecular grade 0.5M, pH 8.0, EDTA (Gibco) for atleast 48 h (an average time of seven days) to remove calcium. Threemilligrams of Proteinase K (Invitrogen, Fungal Proteinase K) wasadded to each sample and incubated at 65 �C overnight (an averagetime of 18 h). A three-step phenol-chloroform extraction was car-ried out including two extractions with equal volumes (2 mL) ofphenol:chloroform:isoamyl alcohol (24:24:1; OmniPur), followedby one extraction with an equal volume of chloroform:isoamylalcohol (24:1; Amresco). The DNA was precipitated in a solution ofisoproponol and 5 M ammonium acetate overnight (for at least12 h) to remove PCR inhibitors. The DNA was pelleted by centri-fugation at 3100 rpm for at least 45 min, washed in 1 mL of 80%purified ethanol, centrifuged for at least another 45 min, andallowed to air-dry for 15e20 min. Each sample was purified using aWizard PCR Preps Purification System (Promega) following themanufacturer’s instructions, save for the final elution of the DNAusing 1200 ul of ddH2O.
Regions containing the mutations diagnostic of haplogroups A,B, C, and D were amplified at least twice from each extraction usingthe polymerase chain reaction (PCR) and primers, cycling condi-tions andmethods cited in Kemp et al. (2006). After amplification ofa PCR product of the expected size was confirmed by electropho-resis on 6% polyacrylamide gels, the DNA samples were digestedwith the Hae III (for haplogroup A) and AluI (for haplogroups C andD) restriction enzymes (see Kemp et al., 2006 for further detail).The amplicons were incubated for at least 4 h at 37 �C and then runon a gel to check for digestion. Visual inspection of digestions foreach sample reveals the presence or absence of the restriction sitescharacteristic of haplogroup A, C, or D. Haplogroup A is identified bya Hae III site gain at np 663, haplogroup C by an Alu I site gain at np13261, and haplogroup D by Alu I site loss at np 5176. Haplogroup B,identified by a 9-base pair deletion in region V of the mtDNAgenome, is confirmed by its shorter fragment length after 6%polyacrylamide gel electrophoresis. Haplogroup X was not testedfor using restriction fragment analysis, as it would have beenindistinguishable from M. Snow who conducted the analysis andbelongs to haplogroup X. As all of the samples were identified asbelonging to other haplogroups, and none of the sequencesdemonstrate any haplogroup X diagnostic markers whensequenced, this was not problematic to this research.
Fisher’s exact tests were conducted using Genepop (Raymondand Rousset, 1995) to compare haplogroup frequency distribu-tions from relevant pairs of populations. Interpretation of the re-sults were completed with the sample size in mind, particularlyhow it may influence the statistical significance of haplogroupsimilarities between populations. Samples that could be assigned ahaplogroup were sequenced to independently confirm their hap-logroup assignments and provide more detailed genetic charac-terization of similarities among these samples and those from otherpopulations.
Sequencing was carried out by amplifying four overlapping 150-bp segments of the D-loop of the mtDNA control region from po-sition 16045e16394, according to the Anderson reference sequence(Anderson et al., 1981). Samples were sequenced using an ABI 3130DNA sequencer. The primers and parameters used throughout thisprocess are those given in Kemp et al. (2007). The completed se-quences were analyzed and concatenated using the Sequencher
and Mesquite (Maddison and Maddison, 2007) computer programsand their mutations were compared with those expected based ontheir haplogroup assignments to confirm those assignments.Samples assigned to haplogroup A and B are expected to exhibitmost of their haplogroup’s characteristic HVSI mutations, describedin Table 5.
The DNA sequences containing derived mutations wereincluded in a haplotype median joining (MJ) network constructedusing default parameters in Network 4.6.1.1 (Bandelt et al., 1999)together with other samples cited in Table 5. The MJ Networkpredicts the order in which specific mutations occurred thatdifferentiate samples from the basal haplotype(s) in the network.Sequences that share derivedmutations appear on the same branchof the network and reflect close ancestor/descendant relationships.
2.4. Dietary stable isotope methods
Three different types of tissue were prepared and analyzed forthis research: bone, enamel and dentin. The laboratory work wasdone in large part by a group of six students during a University ofToronto “Science Abroad” course, hosted by the University of CapeTown. To analyze the d13C and d15N in the collagen of bone anddentin, the collagen was extracted using standard proceduresemployed for many years in the stable isotope laboratory at theUniversity of Cape Town (Sealy, 1997, 2010). Small chunks (withdiameters of a few millimetres) of dentin or bone are surface-cleaned with fine sandpaper, decalcified in ca. 2% HCl, rinsed indistilled water, then treated overnight with 0.1 M sodium hydrox-ide to remove humic acids. If rootlets are present, they are removedfrom the wet collagen by hand, using fine tweezers. The collagensamples are soaked in distilled water until the pH remains un-changed, then freeze-dried. The dry collagen is weighed and the %yield (% of the starting weight of whole bone or dentin) calculated.Approximately 0.6 mg of dry collagen is weighed into a tin cup thatis tightly folded to exclude air. Each sample is analysed in duplicate.The tin capsules are loaded into an automated elemental analyzerand combusted at 1020 �C. The resultant gases are introduced into aThermo-Finnigan Delta Plus XP or a Delta V Plus mass spectrometervia a continuous flow (Conflo) inlet, using helium as the carrier gas.Standard deviations of repeated measurements of a homogeneouslaboratory standard (Merck gelatine, n ¼ 12) are less than 0.2& forboth d13C and d15N. Results are reported relative to internationalstandards Vienna PDB and AIR.
The d13C in tooth enamel carbonate was prepared and analysedas follows: For each tooth, a diamond-tipped drill was used to burra line on either the buccal or lingual surface. This line extendedfrom the occlusal surface to the cementeenamel junction, in orderto sample tooth enamel formed over the duration of developmentof the crown. Care was taken to remove only enamel and not theunderlying dentin. About 5 mg of the resultant enamel powder iscollected and transferred to a microcentrifuge tube. In the stableisotope laboratory, the pre-treatment protocol used is that of Lee-Thorp et al. (1997), with slight modifications, as specified below.The powder is reacted with 1.75% sodium hypochlorite for 45 min,then washed three times with distilled water. It is treated with0.1 M acetic acid for 15 min to remove diagenetic carbonates, thenagainwashed three times with distilled water and freeze-dried. Thepre-treated powders are analysed on a Finnigan-MAT 252 stableisotope ratio mass spectrometer coupled to a Finnigan Gas Bench II.Carbon dioxide is produced from enamel apatite by reaction with100% phosphoric acid at 72 �C, then swept in a stream of heliumthrough hygroscopic Nafion� tubing to remove water, thenthrough a glass capillary gas chromatograph, a second water trap,and finally into the mass spectrometer. The standard deviation ofrepeated measurements of homogeneous material (NBS 18, n ¼ 12)
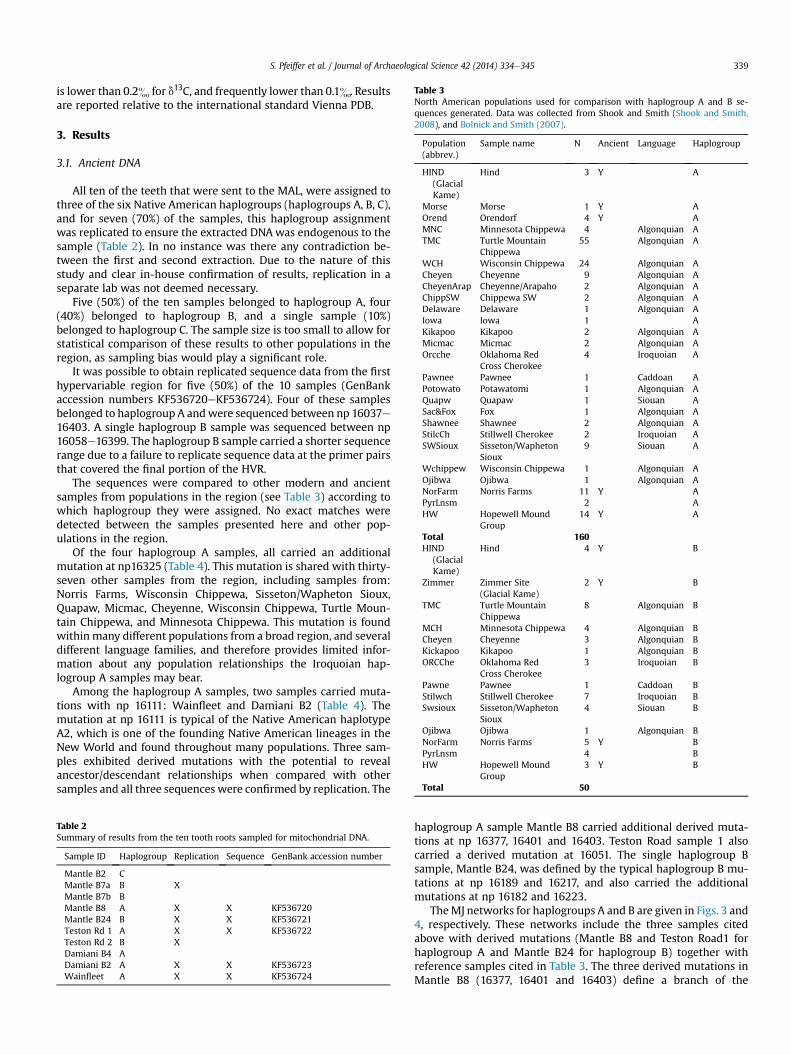
Table 3North American populations used for comparison with haplogroup A and B se-quences generated. Data was collected from Shook and Smith (Shook and Smith,2008), and Bolnick and Smith (2007).
Population(abbrev.)
Sample name N Ancient Language Haplogroup
HIND(GlacialKame)
Hind 3 Y A
Morse Morse 1 Y AOrend Orendorf 4 Y AMNC Minnesota Chippewa 4 Algonquian ATMC Turtle Mountain
Chippewa55 Algonquian A
WCH Wisconsin Chippewa 24 Algonquian ACheyen Cheyenne 9 Algonquian ACheyenArap Cheyenne/Arapaho 2 Algonquian AChippSW Chippewa SW 2 Algonquian ADelaware Delaware 1 Algonquian AIowa Iowa 1 AKikapoo Kikapoo 2 Algonquian AMicmac Micmac 2 Algonquian AOrcche Oklahoma Red
Cross Cherokee4 Iroquoian A
Pawnee Pawnee 1 Caddoan APotowato Potawatomi 1 Algonquian AQuapw Quapaw 1 Siouan ASac&Fox Fox 1 Algonquian AShawnee Shawnee 2 Algonquian AStilcCh Stillwell Cherokee 2 Iroquoian ASWSioux Sisseton/Wapheton
Sioux9 Siouan A
Wchippew Wisconsin Chippewa 1 Algonquian AOjibwa Ojibwa 1 Algonquian ANorFarm Norris Farms 11 Y APyrLnsm 2 AHW Hopewell Mound
Group14 Y A
Total 160HIND
(GlacialKame)
Hind 4 Y B
Zimmer Zimmer Site(Glacial Kame)
2 Y B
TMC Turtle MountainChippewa
8 Algonquian B
MCH Minnesota Chippewa 4 Algonquian BCheyen Cheyenne 3 Algonquian BKickapoo Kikapoo 1 Algonquian BORCChe Oklahoma Red
Cross Cherokee3 Iroquoian B
Pawne Pawnee 1 Caddoan BStilwch Stillwell Cherokee 7 Iroquoian BSwsioux Sisseton/Wapheton
Sioux4 Siouan B
Ojibwa Ojibwa 1 Algonquian BNorFarm Norris Farms 5 Y BPyrLnsm 4 BHW Hopewell Mound
Group3 Y B
Total 50
S. Pfeiffer et al. / Journal of Archaeological Science 42 (2014) 334e345 339
is lower than 0.2& for d13C, and frequently lower than 0.1&. Resultsare reported relative to the international standard Vienna PDB.
3. Results
3.1. Ancient DNA
All ten of the teeth that were sent to the MAL, were assigned tothree of the six Native American haplogroups (haplogroups A, B, C),and for seven (70%) of the samples, this haplogroup assignmentwas replicated to ensure the extracted DNAwas endogenous to thesample (Table 2). In no instance was there any contradiction be-tween the first and second extraction. Due to the nature of thisstudy and clear in-house confirmation of results, replication in aseparate lab was not deemed necessary.
Five (50%) of the ten samples belonged to haplogroup A, four(40%) belonged to haplogroup B, and a single sample (10%)belonged to haplogroup C. The sample size is too small to allow forstatistical comparison of these results to other populations in theregion, as sampling bias would play a significant role.
It was possible to obtain replicated sequence data from the firsthypervariable region for five (50%) of the 10 samples (GenBankaccession numbers KF536720eKF536724). Four of these samplesbelonged to haplogroup A andwere sequenced between np 16037e16403. A single haplogroup B sample was sequenced between np16058e16399. The haplogroup B sample carried a shorter sequencerange due to a failure to replicate sequence data at the primer pairsthat covered the final portion of the HVR.
The sequences were compared to other modern and ancientsamples from populations in the region (see Table 3) according towhich haplogroup they were assigned. No exact matches weredetected between the samples presented here and other pop-ulations in the region.
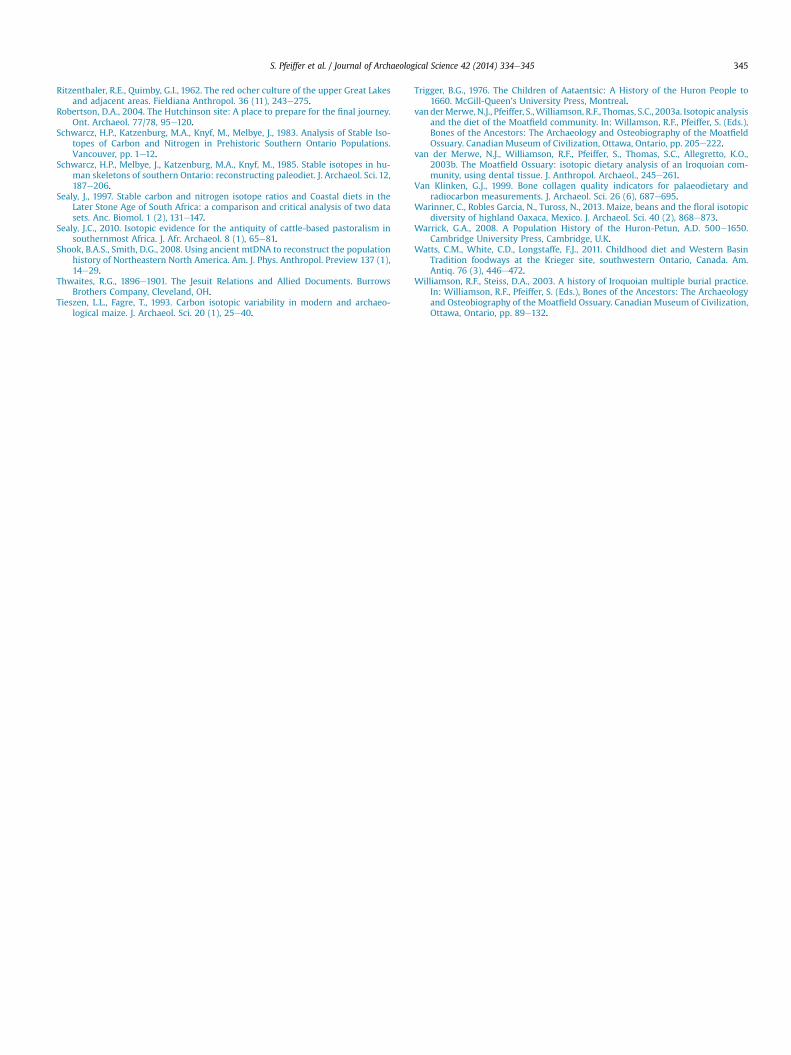
Of the four haplogroup A samples, all carried an additionalmutation at np16325 (Table 4). This mutation is shared with thirty-seven other samples from the region, including samples from:Norris Farms, Wisconsin Chippewa, Sisseton/Wapheton Sioux,Quapaw, Micmac, Cheyenne, Wisconsin Chippewa, Turtle Moun-tain Chippewa, and Minnesota Chippewa. This mutation is foundwithin many different populations from a broad region, and severaldifferent language families, and therefore provides limited infor-mation about any population relationships the Iroquoian hap-logroup A samples may bear.
Among the haplogroup A samples, two samples carried muta-tions with np 16111: Wainfleet and Damiani B2 (Table 4). Themutation at np 16111 is typical of the Native American haplotypeA2, which is one of the founding Native American lineages in theNew World and found throughout many populations. Three sam-ples exhibited derived mutations with the potential to revealancestor/descendant relationships when compared with othersamples and all three sequences were confirmed by replication. The
Table 2Summary of results from the ten tooth roots sampled for mitochondrial DNA.
Sample ID Haplogroup Replication Sequence GenBank accession number
Mantle B2 CMantle B7a B XMantle B7b BMantle B8 A X X KF536720Mantle B24 B X X KF536721Teston Rd 1 A X X KF536722Teston Rd 2 B XDamiani B4 ADamiani B2 A X X KF536723Wainfleet A X X KF536724
haplogroup A sample Mantle B8 carried additional derived muta-tions at np 16377, 16401 and 16403. Teston Road sample 1 alsocarried a derived mutation at 16051. The single haplogroup Bsample, Mantle B24, was defined by the typical haplogroup B mu-tations at np 16189 and 16217, and also carried the additionalmutations at np 16182 and 16223.
TheMJ networks for haplogroups A and B are given in Figs. 3 and4, respectively. These networks include the three samples citedabove with derived mutations (Mantle B8 and Teston Road1 forhaplogroup A and Mantle B24 for haplogroup B) together withreference samples cited in Table 3. The three derived mutations inMantle B8 (16377, 16401 and 16403) define a branch of the
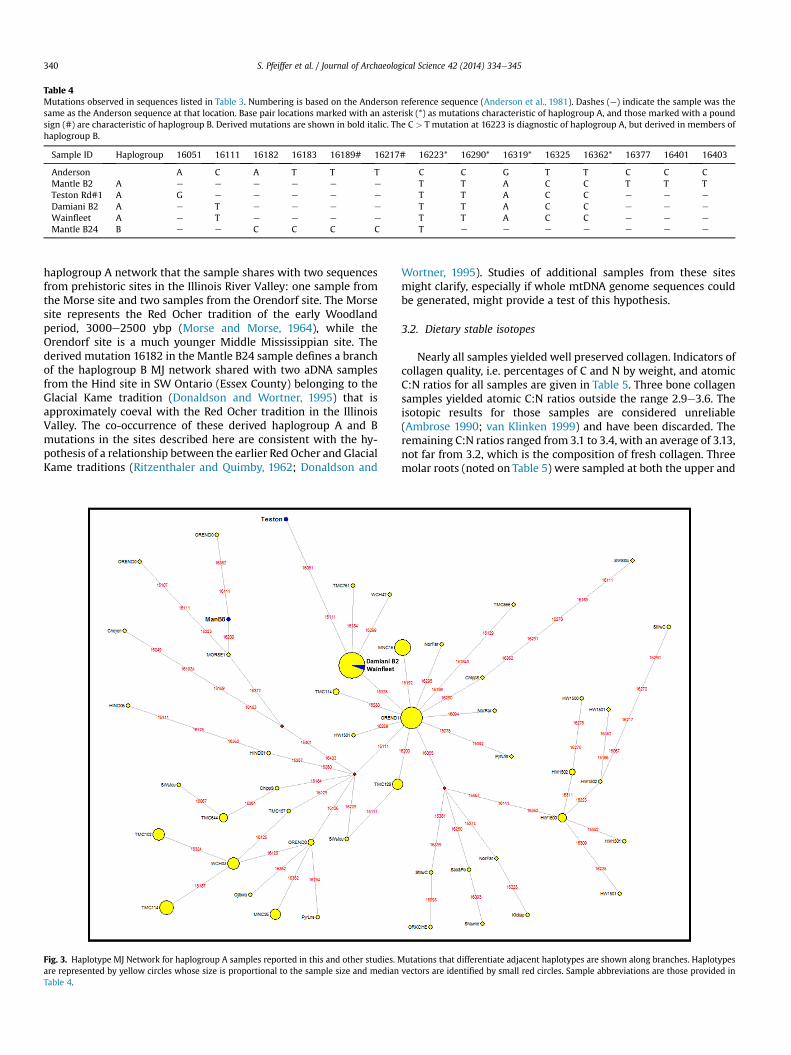
Table 4Mutations observed in sequences listed in Table 3. Numbering is based on the Anderson reference sequence (Anderson et al., 1981). Dashes (e) indicate the sample was thesame as the Anderson sequence at that location. Base pair locations marked with an asterisk (*) as mutations characteristic of haplogroup A, and those marked with a poundsign (#) are characteristic of haplogroup B. Derived mutations are shown in bold italic. The C > T mutation at 16223 is diagnostic of haplogroup A, but derived in members ofhaplogroup B.
Sample ID Haplogroup 16051 16111 16182 16183 16189# 16217# 16223* 16290* 16319* 16325 16362* 16377 16401 16403
Anderson A C A T T T C C G T T C C CMantle B2 A e e e e e e T T A C C T T TTeston Rd#1 A G e e e e e T T A C C e e e
Damiani B2 A e T e e e e T T A C C e e e
Wainfleet A e T e e e e T T A C C e e e
Mantle B24 B e e C C C C T e e e e e e e
S. Pfeiffer et al. / Journal of Archaeological Science 42 (2014) 334e345340
haplogroup A network that the sample shares with two sequencesfrom prehistoric sites in the Illinois River Valley: one sample fromthe Morse site and two samples from the Orendorf site. The Morsesite represents the Red Ocher tradition of the early Woodlandperiod, 3000e2500 ybp (Morse and Morse, 1964), while theOrendorf site is a much younger Middle Mississippian site. Thederived mutation 16182 in the Mantle B24 sample defines a branchof the haplogroup B MJ network shared with two aDNA samplesfrom the Hind site in SW Ontario (Essex County) belonging to theGlacial Kame tradition (Donaldson and Wortner, 1995) that isapproximately coeval with the Red Ocher tradition in the IllinoisValley. The co-occurrence of these derived haplogroup A and Bmutations in the sites described here are consistent with the hy-pothesis of a relationship between the earlier Red Ocher and GlacialKame traditions (Ritzenthaler and Quimby, 1962; Donaldson and
Fig. 3. Haplotype MJ Network for haplogroup A samples reported in this and other studies. Mare represented by yellow circles whose size is proportional to the sample size and medianTable 4.
Wortner, 1995). Studies of additional samples from these sitesmight clarify, especially if whole mtDNA genome sequences couldbe generated, might provide a test of this hypothesis.
3.2. Dietary stable isotopes
Nearly all samples yielded well preserved collagen. Indicators ofcollagen quality, i.e. percentages of C and N by weight, and atomicC:N ratios for all samples are given in Table 5. Three bone collagensamples yielded atomic C:N ratios outside the range 2.9e3.6. Theisotopic results for those samples are considered unreliable(Ambrose 1990; van Klinken 1999) and have been discarded. Theremaining C:N ratios ranged from 3.1 to 3.4, with an average of 3.13,not far from 3.2, which is the composition of fresh collagen. Threemolar roots (noted on Table 5) were sampled at both the upper and
utations that differentiate adjacent haplotypes are shown along branches. Haplotypesvectors are identified by small red circles. Sample abbreviations are those provided in
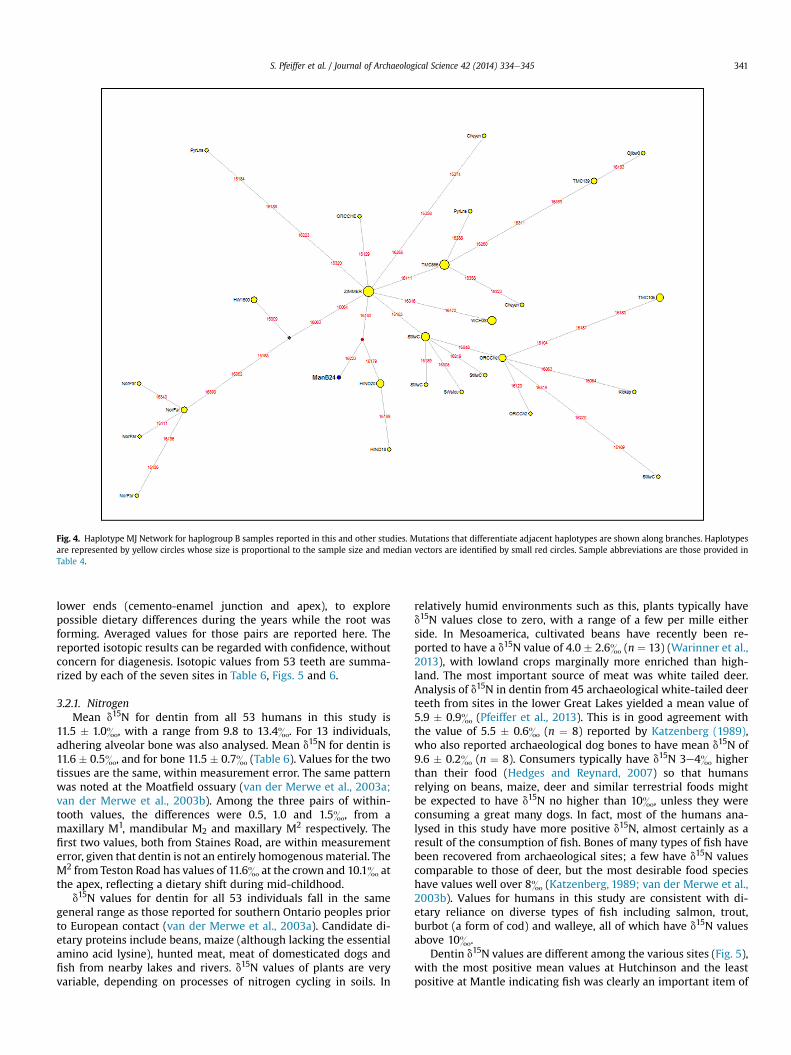
Fig. 4. Haplotype MJ Network for haplogroup B samples reported in this and other studies. Mutations that differentiate adjacent haplotypes are shown along branches. Haplotypesare represented by yellow circles whose size is proportional to the sample size and median vectors are identified by small red circles. Sample abbreviations are those provided inTable 4.
S. Pfeiffer et al. / Journal of Archaeological Science 42 (2014) 334e345 341
lower ends (cemento-enamel junction and apex), to explorepossible dietary differences during the years while the root wasforming. Averaged values for those pairs are reported here. Thereported isotopic results can be regarded with confidence, withoutconcern for diagenesis. Isotopic values from 53 teeth are summa-rized by each of the seven sites in Table 6, Figs. 5 and 6.
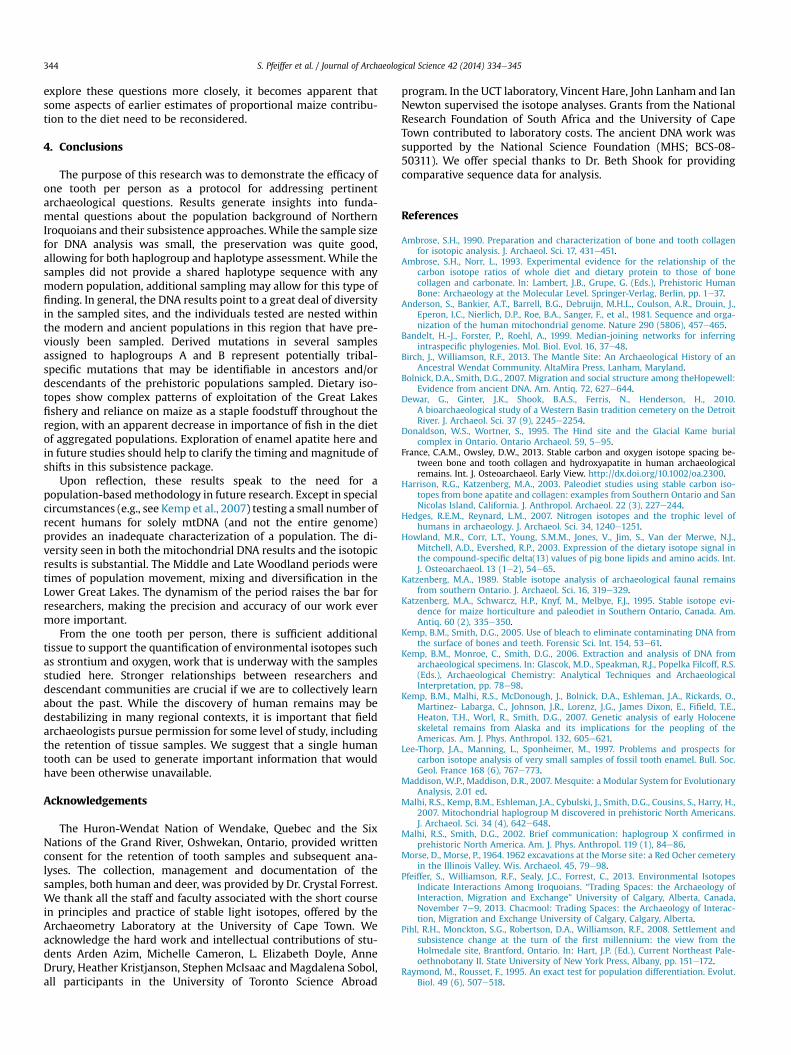
3.2.1. NitrogenMean d15N for dentin from all 53 humans in this study is
11.5 � 1.0&, with a range from 9.8 to 13.4&. For 13 individuals,adhering alveolar bone was also analysed. Mean d15N for dentin is11.6 � 0.5&, and for bone 11.5 � 0.7& (Table 6). Values for the twotissues are the same, within measurement error. The same patternwas noted at the Moatfield ossuary (van der Merwe et al., 2003a;van der Merwe et al., 2003b). Among the three pairs of within-tooth values, the differences were 0.5, 1.0 and 1.5&, from amaxillary M1, mandibular M2 and maxillary M2 respectively. Thefirst two values, both from Staines Road, are within measurementerror, given that dentin is not an entirely homogenousmaterial. TheM2 from Teston Road has values of 11.6& at the crown and 10.1& atthe apex, reflecting a dietary shift during mid-childhood.
d15N values for dentin for all 53 individuals fall in the samegeneral range as those reported for southern Ontario peoples priorto European contact (van der Merwe et al., 2003a). Candidate di-etary proteins include beans, maize (although lacking the essentialamino acid lysine), hunted meat, meat of domesticated dogs andfish from nearby lakes and rivers. d15N values of plants are veryvariable, depending on processes of nitrogen cycling in soils. In
relatively humid environments such as this, plants typically haved15N values close to zero, with a range of a few per mille eitherside. In Mesoamerica, cultivated beans have recently been re-ported to have a d15N value of 4.0 � 2.6& (n ¼ 13) (Warinner et al.,2013), with lowland crops marginally more enriched than high-land. The most important source of meat was white tailed deer.Analysis of d15N in dentin from 45 archaeological white-tailed deerteeth from sites in the lower Great Lakes yielded a mean value of5.9 � 0.9& (Pfeiffer et al., 2013). This is in good agreement withthe value of 5.5 � 0.6& (n ¼ 8) reported by Katzenberg (1989),who also reported archaeological dog bones to have mean d15N of9.6 � 0.2& (n ¼ 8). Consumers typically have d15N 3e4& higherthan their food (Hedges and Reynard, 2007) so that humansrelying on beans, maize, deer and similar terrestrial foods mightbe expected to have d15N no higher than 10&, unless they wereconsuming a great many dogs. In fact, most of the humans ana-lysed in this study have more positive d15N, almost certainly as aresult of the consumption of fish. Bones of many types of fish havebeen recovered from archaeological sites; a few have d15N valuescomparable to those of deer, but the most desirable food specieshave values well over 8& (Katzenberg, 1989; van der Merwe et al.,2003b). Values for humans in this study are consistent with di-etary reliance on diverse types of fish including salmon, trout,burbot (a form of cod) and walleye, all of which have d15N valuesabove 10&.
Dentin d15N values are different among the various sites (Fig. 5),with the most positive mean values at Hutchinson and the leastpositive at Mantle indicating fish was clearly an important item of

Table 5Isotope values and collagen quality indicators for all tooth enamel, dentin and bone samples in this study. Values for dentin fromUCT 13680, 13687 and 13694 are the means oftwo samples of tissue from the cementeenamel junction and the tip of the root.
Site Name Identifier Tooth type UCT no. d13C d15N wt %C wt % N C/N C/N mtDNA
Tooth/Bone Enamel Dentin Bone Dentin Bone Dentin Bone Dentin Bone Dentin Bone
Mantle-cemetery B8 L mand M1 13660 �4.3 �13.1 10.6 43.5 15.9 3.2 XMantle-cemetery B2 L max M1 13661 �4.6 �10.8 10.6 41.8 15.3 3.2 XMantle-cemetery B24 R max M1 13662 �3.4 �10.6 10.4 35.5 13.0 3.2 XMantle-cemetery B7a R max M1 13663 �2.7 �11.6 9.9 42.6 14.8 3.4 XMantle-cemetery B7b R mand PM2 13664 �5.4 �12.7 12.1 44.2 16.3 3.2 XMantle-village 435-180 surface L max M1 13665 �5.7 �9.8 10.2 42.9 16.0 3.1Mantle-village 465-155 layer 1 R mand M1 13666 �3.3 �9.9 10.4 41.8 15.6 3.1Mantle-village 435-180 Q5, fill L max M2 13667 �2.9 �9.1 11.1 41.7 15.6 3.1Mantle-village 485-240 trench L max C 13668 �7.4 �10 10.5 42.4 15.6 3.2Mantle-village 495-129 fill L mand PM2 13669 �3.2 �11.6 10.7 42.9 15.4 3.3Mantle-village 522-141 charcoal L max M1 13670 �3.9 �9.5 9.8 42.6 15.5 3.2Mantle-village 335-160 fill R max PM1 13671 �2.7 �8.8 10.5 41.9 15.5 3.2Mantle-village 465-155 Q4,
layer 1R mand M3 13672 �3 �10.7 10.6 28.7 10.7 3.1
Mantle-village 500-165 fill R max M3 13673 �2.4 �11.2 11.5 41.5 15.1 3.2Mantle-village 499-133 fill R mand M1 13674 �3.2 �9.2 10 41.6 15.3 3.2Staines Sample 1 R max M2 13675/13724 �5.7 �9.7 �11.9 12 12 42.6 43.1 15.5 14.8 3.2 3.4Staines Sample 2 R max M1 13676/13725 �6.2 �11.3 12.6 43.8 9.4 15.7 2.7 3.3 4.1Staines Sample 3 R mand M1 13677/13726 �5.9 �10.7 �11.9 11.8 12 41.6 41.6 15.0 14.6 3.2 3.3Staines Sample 4 R max M1 13678/13727 �3 �9.2 �12.5 10.9 12.8 41.1 36.3 15.0 12.9 3.2 3.3Staines Sample 5 R mand M1 13679 �1.9 �11.3 12 42.1 15.4 3.2Staines Sample 6 L max M1 13680 �2.1 �11.4 12.3 43.2 15.7 3.2Staines Sample 7 L mand M1 13681/13728 �3.2 �10.9 �14.1 11.3 10.6 42.2 42.0 15.6 14.8 3.2 3.3Staines Sample 8 R mand M1 13682 �3.1 �11.9 12.7 41.8 15.3 3.2Staines Sample 9 R mand M2 13683 �2.9 �13.4 11.6 43.1 15.4 3.3Staines Sample 10 R max M1 13684 �4.5 �10.2 11.5 43.0 15.5 3.2Staines Sample 11 L mand M1 13685 �3.8 �10.5 11.4 28.1 10.0 3.3Staines Sample 12 R max M1 13686 �5.9 �11.4 12.9 43.3 15.8 3.2Staines Sample 13 R mand M2 13687 �4 �9.6 11.3 36.8 13.4 3.2Staines Sample 14 R max M1 13688 �3.4 �13.2 11.7 43.5 15.8 3.2Staines Sample 15 R max M1 13689 �3.9 �12 12.5 43.0 15.7 3.2Teston Sample 1 L max M2 13690 �3.9 �9.8 11.2 41.8 15.5 3.2 XTeston Sample 2 R max M2 13691 �3.7 �10.6 10.9 45.0 16.5 3.2 XTeston Sample 3 L max M1 13692/13716 �4.1 �11.7 �11.9 11.6 11 42.1 23.2 15.2 8.1 3.2 3.4Teston Sample 4 L max M1 13693/13717 �5 �9.9 10.4 23.0 4.6 8.6 1.2 3.1 4.3Teston Sample 5 R max M2 13694/13718 �2.1 �11.3 �12.5 10.9 11.8 42.6 24.4 15.8 8.6 3.2 3.3Teston Sample 6 L max M1 13695/13719 �2.1 �11 �12 12.4 11.6 39.2 41.8 13.9 15.1 3.3 3.2Teston Sample 7 L max M1 13696/13720 �4.2 �11.5 �12.5 11.6 10.7 43.2 25.0 16.0 8.8 3.2 3.3Teston Sample 8 L max M1 13697/13721 �5.4 �11.6 11.9 11 11.3 46.3 32.0 16.5 11.5 3.3 3.2Teston Sample 9 L max M1 13698/13722 �2.2 �11 9.8 42.5 5.2 15.1 1.3 3.3 4.6Teston Sample 10 L max M2 13699/13723 �4.6 �11.4 �11.8 10.9 10.9 35.5 35.0 13.2 12.6 3.2 3.2Hidden Spring B1 L mand M1 13700/13714 �3.9 �11.4 �13.3 12.5 11.9 42.1 31.0 15.6 10.5 3.2 3.4Hidden Spring B2a L max M3 13701 �3.3 �10.7 12.3 42.6 15.7 3.2Hidden Spring B2b R mand dm2 13702 �3 �12.8 10.8 42.1 14.4 3.4Hidden Spring B3a L mand M1 13703 �4.8 �11.9 12.2 43.2 16.2 3.1Hidden Spring B3b L max M2 13704/13713 �2.2 �10.7 �13 11.6 11.8 43.0 34.4 15.8 12.1 3.2 3.3Damiani B2 L max M2 13705 �2.9 �9.7 12 42.8 15.6 3.2 XDamiani B4 R max dm1 13706 �3.8 �11.9 12.2 41.5 13.9 3.5 XHutchinson B1 L max M3 13707 �2.8 �11.4 12.4 41.1 15.2 3.2Hutchinson B2 R max M3 13708 �5.2 �10.5 13.8 35.4 13.2 3.1Hutchinson B2a R max M2 13709/13715 �3.3 �10.5 �12.2 12 10.4 42.8 19.2 15.7 6.5 3.2 3.4Hutchinson F88 L mand M2 13710 �3.1 �11.6 13.4 42.1 15.7 3.1Hutchinson F92 R max M3 13711 �2.5 �13.4 13.2 43.2 15.5 3.3Wainfleet Sample 1 R max M1 13712 �3.5 �9.4 11.5 34.8 12.6 3.2 X
S. Pfeiffer et al. / Journal of Archaeological Science 42 (2014) 334e345342
diet at Hutchinson but may not have been so at Mantle. This is apattern consistent with the quantities of fish bone recovered fromregional pre-coalescent period sites (AD 1300e1450) compared tolater coalescent or post-coalescent sites (Birch and Williamson,2013:104). Pre-coalescent sites in the same drainage as Mantlehave significant percentages of fish bone in their faunal assem-blages ranging from 33% to 50%. Similarly aged sites in the Don andRouge River drainage systems to the west have 50e60% represen-tation of fish. The fourteenth-century Robb site in the Rouge Riversystem, near to the Hutchison and Staines Road sites, and possiblyone of the contributing populations to the Staines Road ossuary,had an even higher representation of 70% fish. Fish represented 8%and 14% of the animal bone from the large, coalescent Draper andParsons sites respectively and only 6% at Mantle. While there are
many taphonomic factors that might affect the survival and re-covery of fish bone, these percentages for the coalescent and post-coalescent Mantle sites are consistent with these isotopic data andsuggest that fishing was not as important an activity as it had beenin pre-coalescent times. This was perhaps because considerablymore effort was needed to grow sufficient maize to feed expandingand aggregated populations as well as to hunt deer, not just formeat but also for the thousands of deerskins necessary to clothecoalescent and post-coalescent populations (Birch andWilliamson,2013:111e118). Moreover, Mantle and its successor villages weresituated at greater distances from Lake Ontario than earlier sites.Substantially more effort would have been needed to acquire andtransport large quantities of processed lake fish northward alongnon-navigable waterways.
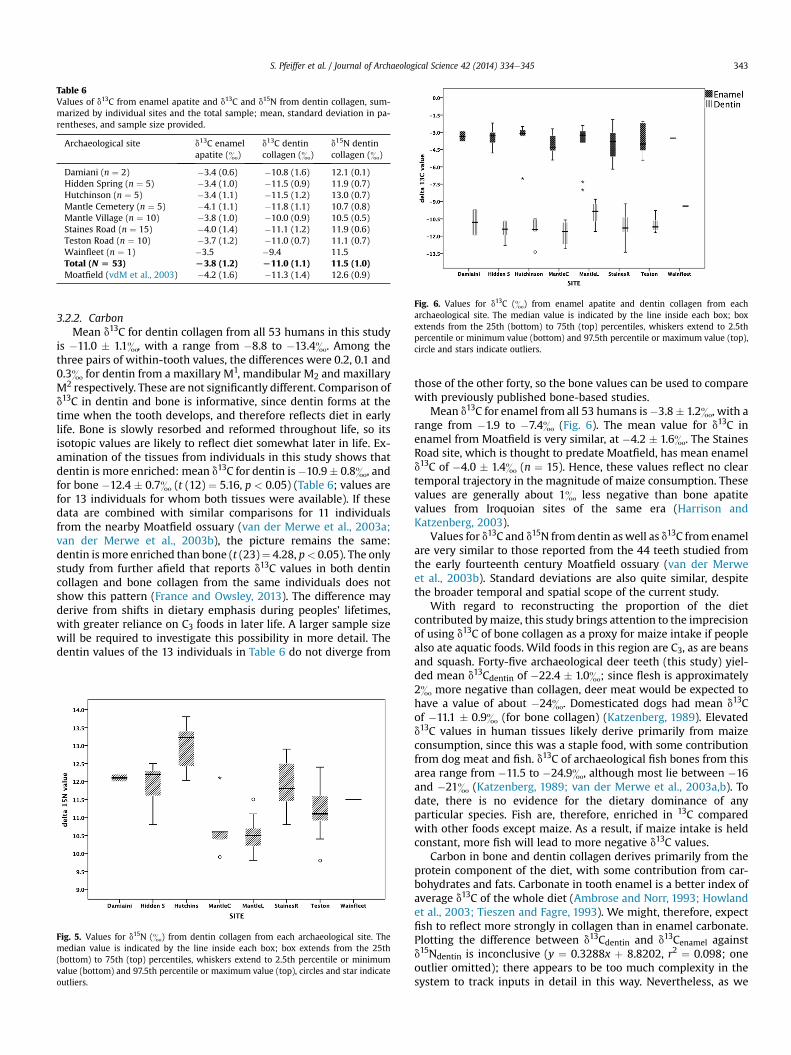
Table 6Values of d13C from enamel apatite and d13C and d15N from dentin collagen, sum-marized by individual sites and the total sample; mean, standard deviation in pa-rentheses, and sample size provided.
Archaeological site d13C enamelapatite (&)
d13C dentincollagen (&)
d15N dentincollagen (&)
Damiani (n ¼ 2) �3.4 (0.6) �10.8 (1.6) 12.1 (0.1)Hidden Spring (n ¼ 5) �3.4 (1.0) �11.5 (0.9) 11.9 (0.7)Hutchinson (n ¼ 5) �3.4 (1.1) �11.5 (1.2) 13.0 (0.7)Mantle Cemetery (n ¼ 5) �4.1 (1.1) �11.8 (1.1) 10.7 (0.8)Mantle Village (n ¼ 10) �3.8 (1.0) �10.0 (0.9) 10.5 (0.5)Staines Road (n ¼ 15) �4.0 (1.4) �11.1 (1.2) 11.9 (0.6)Teston Road (n ¼ 10) �3.7 (1.2) �11.0 (0.7) 11.1 (0.7)Wainfleet (n ¼ 1) �3.5 �9.4 11.5Total (N [ 53) L3.8 (1.2) L11.0 (1.1) 11.5 (1.0)Moatfield (vdM et al., 2003) �4.2 (1.6) �11.3 (1.4) 12.6 (0.9)
Fig. 6. Values for d13C (&) from enamel apatite and dentin collagen from eacharchaeological site. The median value is indicated by the line inside each box; boxextends from the 25th (bottom) to 75th (top) percentiles, whiskers extend to 2.5thpercentile or minimum value (bottom) and 97.5th percentile or maximum value (top),circle and stars indicate outliers.
S. Pfeiffer et al. / Journal of Archaeological Science 42 (2014) 334e345 343
3.2.2. CarbonMean d13C for dentin collagen from all 53 humans in this study
is �11.0 � 1.1&, with a range from �8.8 to �13.4&. Among thethree pairs of within-tooth values, the differences were 0.2, 0.1 and0.3& for dentin from a maxillary M1, mandibular M2 and maxillaryM2 respectively. These are not significantly different. Comparison ofd13C in dentin and bone is informative, since dentin forms at thetime when the tooth develops, and therefore reflects diet in earlylife. Bone is slowly resorbed and reformed throughout life, so itsisotopic values are likely to reflect diet somewhat later in life. Ex-amination of the tissues from individuals in this study shows thatdentin is more enriched: mean d13C for dentin is�10.9� 0.8&, andfor bone �12.4 � 0.7& (t (12) ¼ 5.16, p < 0.05) (Table 6; values arefor 13 individuals for whom both tissues were available). If thesedata are combined with similar comparisons for 11 individualsfrom the nearby Moatfield ossuary (van der Merwe et al., 2003a;van der Merwe et al., 2003b), the picture remains the same:dentin is more enriched than bone (t (23)¼ 4.28, p< 0.05). The onlystudy from further afield that reports d13C values in both dentincollagen and bone collagen from the same individuals does notshow this pattern (France and Owsley, 2013). The difference mayderive from shifts in dietary emphasis during peoples’ lifetimes,with greater reliance on C3 foods in later life. A larger sample sizewill be required to investigate this possibility in more detail. Thedentin values of the 13 individuals in Table 6 do not diverge from
Fig. 5. Values for d15N (&) from dentin collagen from each archaeological site. Themedian value is indicated by the line inside each box; box extends from the 25th(bottom) to 75th (top) percentiles, whiskers extend to 2.5th percentile or minimumvalue (bottom) and 97.5th percentile or maximum value (top), circles and star indicateoutliers.
those of the other forty, so the bone values can be used to comparewith previously published bone-based studies.
Mean d13C for enamel from all 53 humans is�3.8� 1.2&, with arange from �1.9 to �7.4& (Fig. 6). The mean value for d13C inenamel from Moatfield is very similar, at �4.2 � 1.6&. The StainesRoad site, which is thought to predate Moatfield, has mean enameld13C of �4.0 � 1.4& (n ¼ 15). Hence, these values reflect no cleartemporal trajectory in the magnitude of maize consumption. Thesevalues are generally about 1& less negative than bone apatitevalues from Iroquoian sites of the same era (Harrison andKatzenberg, 2003).
Values for d13C and d15N fromdentin as well as d13C from enamelare very similar to those reported from the 44 teeth studied fromthe early fourteenth century Moatfield ossuary (van der Merweet al., 2003b). Standard deviations are also quite similar, despitethe broader temporal and spatial scope of the current study.
With regard to reconstructing the proportion of the dietcontributed bymaize, this study brings attention to the imprecisionof using d13C of bone collagen as a proxy for maize intake if peoplealso ate aquatic foods. Wild foods in this region are C3, as are beansand squash. Forty-five archaeological deer teeth (this study) yiel-ded mean d13Cdentin of �22.4 � 1.0&; since flesh is approximately2& more negative than collagen, deer meat would be expected tohave a value of about �24&. Domesticated dogs had mean d13Cof �11.1 � 0.9& (for bone collagen) (Katzenberg, 1989). Elevatedd13C values in human tissues likely derive primarily from maizeconsumption, since this was a staple food, with some contributionfrom dog meat and fish. d13C of archaeological fish bones from thisarea range from �11.5 to �24.9&, although most lie between �16and �21& (Katzenberg, 1989; van der Merwe et al., 2003a,b). Todate, there is no evidence for the dietary dominance of anyparticular species. Fish are, therefore, enriched in 13C comparedwith other foods except maize. As a result, if maize intake is heldconstant, more fish will lead to more negative d13C values.
Carbon in bone and dentin collagen derives primarily from theprotein component of the diet, with some contribution from car-bohydrates and fats. Carbonate in tooth enamel is a better index ofaverage d13C of the whole diet (Ambrose and Norr, 1993; Howlandet al., 2003; Tieszen and Fagre, 1993). We might, therefore, expectfish to reflect more strongly in collagen than in enamel carbonate.Plotting the difference between d13Cdentin and d13Cenamel againstd15Ndentin is inconclusive (y ¼ 0.3288x þ 8.8202, r2 ¼ 0.098; oneoutlier omitted); there appears to be too much complexity in thesystem to track inputs in detail in this way. Nevertheless, as we
S. Pfeiffer et al. / Journal of Archaeological Science 42 (2014) 334e345344
explore these questions more closely, it becomes apparent thatsome aspects of earlier estimates of proportional maize contribu-tion to the diet need to be reconsidered.
4. Conclusions
The purpose of this research was to demonstrate the efficacy ofone tooth per person as a protocol for addressing pertinentarchaeological questions. Results generate insights into funda-mental questions about the population background of NorthernIroquoians and their subsistence approaches. While the sample sizefor DNA analysis was small, the preservation was quite good,allowing for both haplogroup and haplotype assessment. While thesamples did not provide a shared haplotype sequence with anymodern population, additional sampling may allow for this type offinding. In general, the DNA results point to a great deal of diversityin the sampled sites, and the individuals tested are nested withinthe modern and ancient populations in this region that have pre-viously been sampled. Derived mutations in several samplesassigned to haplogroups A and B represent potentially tribal-specific mutations that may be identifiable in ancestors and/ordescendants of the prehistoric populations sampled. Dietary iso-topes show complex patterns of exploitation of the Great Lakesfishery and reliance on maize as a staple foodstuff throughout theregion, with an apparent decrease in importance of fish in the dietof aggregated populations. Exploration of enamel apatite here andin future studies should help to clarify the timing and magnitude ofshifts in this subsistence package.
Upon reflection, these results speak to the need for apopulation-basedmethodology in future research. Except in specialcircumstances (e.g., see Kemp et al., 2007) testing a small number ofrecent humans for solely mtDNA (and not the entire genome)provides an inadequate characterization of a population. The di-versity seen in both the mitochondrial DNA results and the isotopicresults is substantial. The Middle and Late Woodland periods weretimes of population movement, mixing and diversification in theLower Great Lakes. The dynamism of the period raises the bar forresearchers, making the precision and accuracy of our work evermore important.
From the one tooth per person, there is sufficient additionaltissue to support the quantification of environmental isotopes suchas strontium and oxygen, work that is underway with the samplesstudied here. Stronger relationships between researchers anddescendant communities are crucial if we are to collectively learnabout the past. While the discovery of human remains may bedestabilizing in many regional contexts, it is important that fieldarchaeologists pursue permission for some level of study, includingthe retention of tissue samples. We suggest that a single humantooth can be used to generate important information that wouldhave been otherwise unavailable.
Acknowledgements
The Huron-Wendat Nation of Wendake, Quebec and the SixNations of the Grand River, Oshwekan, Ontario, provided writtenconsent for the retention of tooth samples and subsequent ana-lyses. The collection, management and documentation of thesamples, both human and deer, was provided by Dr. Crystal Forrest.We thank all the staff and faculty associated with the short coursein principles and practice of stable light isotopes, offered by theArchaeometry Laboratory at the University of Cape Town. Weacknowledge the hard work and intellectual contributions of stu-dents Arden Azim, Michelle Cameron, L. Elizabeth Doyle, AnneDrury, Heather Kristjanson, Stephen McIsaac and Magdalena Sobol,all participants in the University of Toronto Science Abroad
program. In the UCT laboratory, Vincent Hare, John Lanham and IanNewton supervised the isotope analyses. Grants from the NationalResearch Foundation of South Africa and the University of CapeTown contributed to laboratory costs. The ancient DNA work wassupported by the National Science Foundation (MHS; BCS-08-50311). We offer special thanks to Dr. Beth Shook for providingcomparative sequence data for analysis.
References
Ambrose, S.H., 1990. Preparation and characterization of bone and tooth collagenfor isotopic analysis. J. Archaeol. Sci. 17, 431e451.
Ambrose, S.H., Norr, L., 1993. Experimental evidence for the relationship of thecarbon isotope ratios of whole diet and dietary protein to those of bonecollagen and carbonate. In: Lambert, J.B., Grupe, G. (Eds.), Prehistoric HumanBone: Archaeology at the Molecular Level. Springer-Verlag, Berlin, pp. 1e37.
Anderson, S., Bankier, A.T., Barrell, B.G., Debruijn, M.H.L., Coulson, A.R., Drouin, J.,Eperon, I.C., Nierlich, D.P., Roe, B.A., Sanger, F., et al., 1981. Sequence and orga-nization of the human mitochondrial genome. Nature 290 (5806), 457e465.
Bandelt, H.-J., Forster, P., Roehl, A., 1999. Median-joining networks for inferringintraspecific phylogenies. Mol. Biol. Evol. 16, 37e48.
Birch, J., Williamson, R.F., 2013. The Mantle Site: An Archaeological History of anAncestral Wendat Community. AltaMira Press, Lanham, Maryland.
Bolnick, D.A., Smith, D.G., 2007. Migration and social structure among theHopewell:Evidence from ancient DNA. Am. Antiq. 72, 627e644.
Dewar, G., Ginter, J.K., Shook, B.A.S., Ferris, N., Henderson, H., 2010.A bioarchaeological study of a Western Basin tradition cemetery on the DetroitRiver. J. Archaeol. Sci. 37 (9), 2245e2254.
Donaldson, W.S., Wortner, S., 1995. The Hind site and the Glacial Kame burialcomplex in Ontario. Ontario Archaeol. 59, 5e95.
France, C.A.M., Owsley, D.W., 2013. Stable carbon and oxygen isotope spacing be-tween bone and tooth collagen and hydroxyapatite in human archaeologicalremains. Int. J. Osteoarchaeol. Early View. http://dx.doi.org/10.1002/oa.2300.
Harrison, R.G., Katzenberg, M.A., 2003. Paleodiet studies using stable carbon iso-topes from bone apatite and collagen: examples from Southern Ontario and SanNicolas Island, California. J. Anthropol. Archaeol. 22 (3), 227e244.
Hedges, R.E.M., Reynard, L.M., 2007. Nitrogen isotopes and the trophic level ofhumans in archaeology. J. Archaeol. Sci. 34, 1240e1251.
Howland, M.R., Corr, L.T., Young, S.M.M., Jones, V., Jim, S., Van der Merwe, N.J.,Mitchell, A.D., Evershed, R.P., 2003. Expression of the dietary isotope signal inthe compound-specific delta(13) values of pig bone lipids and amino acids. Int.J. Osteoarchaeol. 13 (1e2), 54e65.
Katzenberg, M.A., 1989. Stable isotope analysis of archaeological faunal remainsfrom southern Ontario. J. Archaeol. Sci. 16, 319e329.
Katzenberg, M.A., Schwarcz, H.P., Knyf, M., Melbye, F.J., 1995. Stable isotope evi-dence for maize horticulture and paleodiet in Southern Ontario, Canada. Am.Antiq. 60 (2), 335e350.
Kemp, B.M., Smith, D.G., 2005. Use of bleach to eliminate contaminating DNA fromthe surface of bones and teeth. Forensic Sci. Int. 154, 53e61.
Kemp, B.M., Monroe, C., Smith, D.G., 2006. Extraction and analysis of DNA fromarchaeological specimens. In: Glascok, M.D., Speakman, R.J., Popelka Filcoff, R.S.(Eds.), Archaeological Chemistry: Analytical Techniques and ArchaeologicalInterpretation, pp. 78e98.
Kemp, B.M., Malhi, R.S., McDonough, J., Bolnick, D.A., Eshleman, J.A., Rickards, O.,Martinez- Labarga, C., Johnson, J.R., Lorenz, J.G., James Dixon, E., Fifield, T.E.,Heaton, T.H., Worl, R., Smith, D.G., 2007. Genetic analysis of early Holoceneskeletal remains from Alaska and its implications for the peopling of theAmericas. Am. J. Phys. Anthropol. 132, 605e621.
Lee-Thorp, J.A., Manning, L., Sponheimer, M., 1997. Problems and prospects forcarbon isotope analysis of very small samples of fossil tooth enamel. Bull. Soc.Geol. France 168 (6), 767e773.
Maddison, W.P., Maddison, D.R., 2007. Mesquite: a Modular System for EvolutionaryAnalysis, 2.01 ed.
Malhi, R.S., Kemp, B.M., Eshleman, J.A., Cybulski, J., Smith, D.G., Cousins, S., Harry, H.,2007. Mitochondrial haplogroup M discovered in prehistoric North Americans.J. Archaeol. Sci. 34 (4), 642e648.
Malhi, R.S., Smith, D.G., 2002. Brief communication: haplogroup X confirmed inprehistoric North America. Am. J. Phys. Anthropol. 119 (1), 84e86.
Morse, D., Morse, P., 1964. 1962 excavations at the Morse site: a Red Ocher cemeteryin the Illinois Valley. Wis. Archaeol. 45, 79e98.
Pfeiffer, S., Williamson, R.F., Sealy, J.C., Forrest, C., 2013. Environmental IsotopesIndicate Interactions Among Iroquoians. “Trading Spaces: the Archaeology ofInteraction, Migration and Exchange” University of Calgary, Alberta, Canada,November 7e9, 2013. Chacmool: Trading Spaces: the Archaeology of Interac-tion, Migration and Exchange University of Calgary, Calgary, Alberta.
Pihl, R.H., Monckton, S.G., Robertson, D.A., Williamson, R.F., 2008. Settlement andsubsistence change at the turn of the first millennium: the view from theHolmedale site, Brantford, Ontario. In: Hart, J.P. (Ed.), Current Northeast Pale-oethnobotany II. State University of New York Press, Albany, pp. 151e172.
Raymond, M., Rousset, F., 1995. An exact test for population differentiation. Evolut.Biol. 49 (6), 507e518.
S. Pfeiffer et al. / Journal of Archaeological Science 42 (2014) 334e345 345
Ritzenthaler, R.E., Quimby, G.I., 1962. The red ocher culture of the upper Great Lakesand adjacent areas. Fieldiana Anthropol. 36 (11), 243e275.
Robertson, D.A., 2004. The Hutchinson site: A place to prepare for the final journey.Ont. Archaeol. 77/78, 95e120.
Schwarcz, H.P., Katzenburg, M.A., Knyf, M., Melbye, J., 1983. Analysis of Stable Iso-topes of Carbon and Nitrogen in Prehistoric Southern Ontario Populations.Vancouver, pp. 1e12.
Schwarcz, H.P., Melbye, J., Katzenburg, M.A., Knyf, M., 1985. Stable isotopes in hu-man skeletons of southern Ontario: reconstructing paleodiet. J. Archaeol. Sci. 12,187e206.
Sealy, J., 1997. Stable carbon and nitrogen isotope ratios and Coastal diets in theLater Stone Age of South Africa: a comparison and critical analysis of two datasets. Anc. Biomol. 1 (2), 131e147.
Sealy, J.C., 2010. Isotopic evidence for the antiquity of cattle-based pastoralism insouthernmost Africa. J. Afr. Archaeol. 8 (1), 65e81.
Shook, B.A.S., Smith, D.G., 2008. Using ancient mtDNA to reconstruct the populationhistory of Northeastern North America. Am. J. Phys. Anthropol. Preview 137 (1),14e29.
Thwaites, R.G., 1896e1901. The Jesuit Relations and Allied Documents. BurrowsBrothers Company, Cleveland, OH.
Tieszen, L.L., Fagre, T., 1993. Carbon isotopic variability in modern and archaeo-logical maize. J. Archaeol. Sci. 20 (1), 25e40.
Trigger, B.G., 1976. The Children of Aataentsic: A History of the Huron People to1660. McGill-Queen’s University Press, Montreal.
vanderMerwe,N.J., Pfeiffer, S.,Williamson, R.F., Thomas, S.C., 2003a. Isotopic analysisand the diet of the Moatfield community. In: Willamson, R.F., Pfeiffer, S. (Eds.),Bones of the Ancestors: The Archaeology and Osteobiography of the MoatfieldOssuary. Canadian Museum of Civilization, Ottawa, Ontario, pp. 205e222.
van der Merwe, N.J., Williamson, R.F., Pfeiffer, S., Thomas, S.C., Allegretto, K.O.,2003b. The Moatfield Ossuary: isotopic dietary analysis of an Iroquoian com-munity, using dental tissue. J. Anthropol. Archaeol., 245e261.
Van Klinken, G.J., 1999. Bone collagen quality indicators for palaeodietary andradiocarbon measurements. J. Archaeol. Sci. 26 (6), 687e695.
Warinner, C., Robles Garcia, N., Tuross, N., 2013. Maize, beans and the floral isotopicdiversity of highland Oaxaca, Mexico. J. Archaeol. Sci. 40 (2), 868e873.
Warrick, G.A., 2008. A Population History of the Huron-Petun, A.D. 500e1650.Cambridge University Press, Cambridge, U.K.
Watts, C.M., White, C.D., Longstaffe, F.J., 2011. Childhood diet and Western BasinTradition foodways at the Krieger site, southwestern Ontario, Canada. Am.Antiq. 76 (3), 446e472.
Williamson, R.F., Steiss, D.A., 2003. A history of Iroquoian multiple burial practice.In: Williamson, R.F., Pfeiffer, S. (Eds.), Bones of the Ancestors: The Archaeologyand Osteobiography of the Moatfield Ossuary. Canadian Museum of Civilization,Ottawa, Ontario, pp. 89e132.