Embed Size (px)
Citation preview

October 2016
Hannes Niederhauser, CEO
Richard Neuwirth, CFO
S&T AG Company Presentation

S&T AG in a Nutshell
2
HU
CZ
SI
SK
RS
CH
RU
RO
PL
AT
ME
MD
MK
HR
DE
BG
AL
Regional IT service provider
2300 Employees
Eastern Europe, DACH - 19 Countries
IoT is a fast growing market : in 2020 more
than 25 billion devices will be connected
IoT is vulnerable to cyberattacks and
needs protection
S&T develops matching solutions and
security appliances
With EUR 468,2 Mio. Revenues and an EBITDA of EUR 28,4 Mio. in 2015,
S&T is a leading IT services company with own IoT technology and products operating in DACH and Eastern Europe
S&T offers vertical IoT solutions for
Industrial
Infotainment
Smart Energy
Medical
Highlights 2016
3
Revenue H1/2016 (H1/2015): +4% EUR 196,4 Mio. (EUR 188,2 Mio.)
EBITDA H1/2016 (H1/2015): +21% EUR 13,1 Mio. (EUR 10,8 Mio.)
10% capital increase by Foxconn (subject to approval of Austrian Takeover
Commission), ~ EUR 44 Mio. cash inflow
Acquisition of 29,9% in Kontron (EUR 59,9 Mio); no tender offer planned
Sept 2016: S&T AG added to TecDAX; Market Cap: ~ EUR 400 Mio.
4 years growth path of share price: 38% CAGR per year
Continuous increase of dividend: 2013 6ct; 2014 7ct; 2015 8ct; 2016 >8ct
Focus on Profit Improvement
Increased Shareholder Focus
Leading IoT alliance with
Foxconn and Kontron with more
than 1 Bn. Revenues in 2018

S&T Current Business Model
4
IoT Technology Products
Security appliances for the „Internet of Things“
2015: EUR 133 Mio. @ 12% EBITDA
2016fc: ~ EUR 155 Mio - Av growth > 20% p.a.
Smart Energy
2015:
EUR 83 Mio. @ 57% GM
2015:
EUR 51 Mio. @ 42% GM
Medical
Infotainment
Industrial
IT Services
Cloud services and security focus
2015: EUR 335 Mio. @ 4% EBITDA
2016fc: ~ EUR 330 Mio – Av growth ~ 5% p.a.
DACH Region
East Europe 2015:
EUR 264 Mio. @ 27% GM
DACH 2015:
EUR 70 Mio. @ 24% GM

S&T Business Model 2018 after Kontron merger
5
IoT / Industry 4.0 Products
Smart EnergyMedical
Infotainmen
t
Industrial
2018:
EUR 350 Mio.
@ 10% EBITDA
2018:
EUR 90 Mio.
@ 8% EBITDA
Similar customer base between S&T and Kontron in IoT -> easy integration up the value chain with S&T software
IT Services
DACH RegionEastern Europe
2018:
EUR 285 Mio.
@ 6% EBITDA
2018:
EUR 105 Mio.
@ 6% EBITDA
Services DACHServices EE
Embedded Systems
2018:
EUR 90 Mio.
@ 9% EBITDA
Canada
2018:
EUR 80 Mio.
@ 7% EBITDA
USA
Communications Avionics

S&T - no longer a boring business
6
Revenue by Business Line (Left) and Consolidated Income % from Appliances (Right)
While beginning as an IT supplier, 75% of Consolidated Income will come from own technologies in 2018
0%
10%
20%
30%
40%
50%
60%
70%
80%
90%
100%
0
200
400
600
800
1000
1200
2009 2010 2011 2012 2013 2014 2015 2016 2018
Products Security/IoT Smart Energy Embedded Systems Services EE Services DACH Appliances % of net profit
begin focusing on
proprietary tech
Partial
consolidation
S&T Services
Product biz
converted to
Services DACH
Smart energy
biz acquiredKontron
mergedNES USA &
Maxdata
sold

Value Chain: Ennoconn/Kontron/S&T
7
Foxconn/Ennoconn
Hardware Engineering
Production
Financing (deep pockets USD 21Bn. Cash)
Kontron
Installed customer base for Cross Selling
Basic Embedded Systems
The old embedded hardware market will suffer (like PC). Industry 4.0 requires integration of machines into IT infrastructure
(machines produce huge data amounts) Ennoconn/S&T/Kontron will release new product category of industry 4.0
„appliances“ directly connected to IT infrastructure/cloud.
S&T
Application Software
IoT head end Systems - Cloud
GM
Manufacturing
Boards Systems
Appliances
IT Integration &
Outsourcing
0%
20%
40%
60%
80%
Embedded Hardware
Embedded Software
Embedded Cloud
Kontron - back to profits in Q1/Q2 2017
8
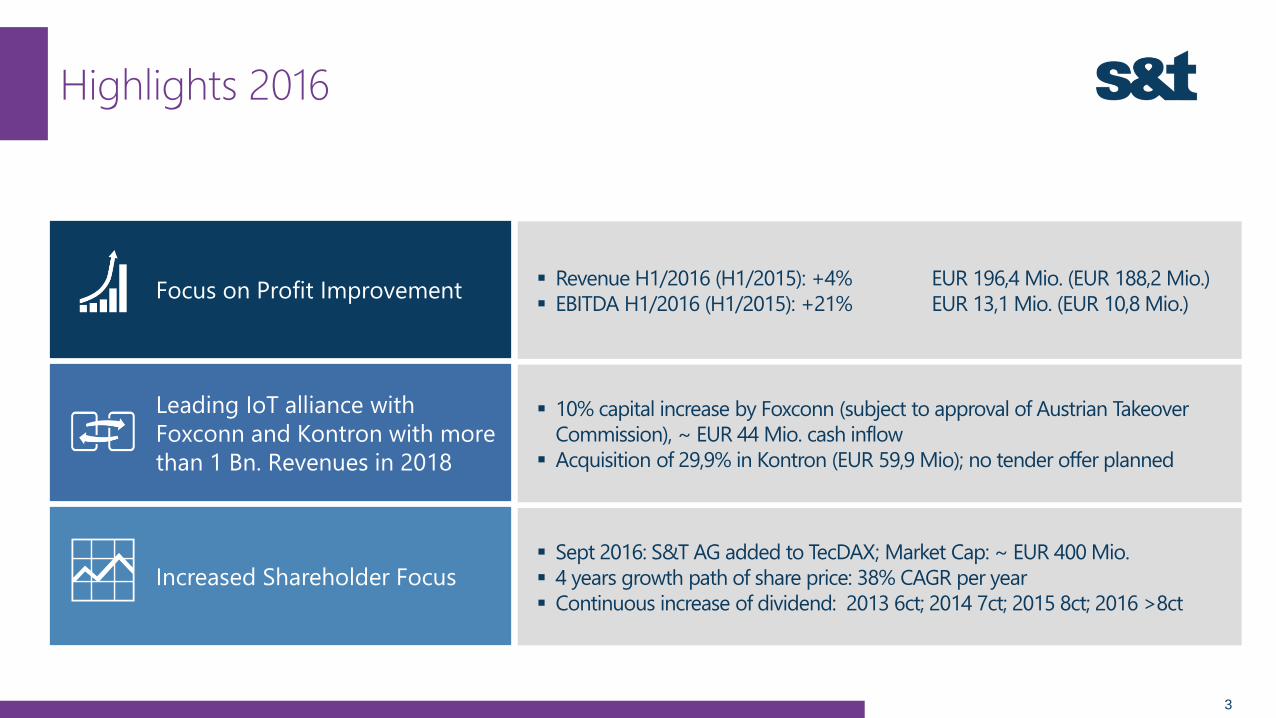
P&L (in EUR Mio.) H1/16 H2/16 2017
Revenues 180 170 350
Gross Margin 41 (23%) 43 (25%) 101 (29%)
OPEX -65 -56 -95
EBIT -25 -13 6
Write offs -61 -30 0
1 No fast revenues growth expected
Currently: weak order entry
Forecast: H2/17 back to growth based on new joint products
2 Focus on fast improvement of Gross Margin
H1/2016: included EUR 4 Mio. “one offs”
2017: 29% GM (+4%), add Software to Kontron products
2018: 32% GM (+3%), asianize products, include more SW
3 OPEX
Reduce inflated G/A cost
Re-size overhead to current business need
4 Restructuring and Write-offs
EUR 30 Mio. expected for 2016 (non cash)
No more burden in 2017
5 Liquidity
Capital increase ~ 20% by S&T conditional to „Sanierungsprivileg“
Reopen EUR 50 Mio. credit line in December asap after cap. increase
Experience and high success rate in turnaround
Kontron 2000
Gericom 2008
S&T (old) 2011
Add value – not only cost cutting mentality
Former K. subs RT Soft/Ubi successfully integrated
Merger between S&T and Kontron after turn around (6 - 12 months)

S&T Gross Margin Improvement Strategy
9
Focus on hype areas IoT, Industry 4.0 and Smart Energy
Grow Revenues in Technology segments to 60% of total revenues
High Ebitdas > 10% = driver for S&T profits
Improve
Services/Product mix
Add more own
technology revenue
to product mix
Add embedded
software to Kontron
product portfolio
Improve Gross Margin from 25% to 29% (2017) - 35% long term
Asianize designs and reduce production cost 3% mid term
Increase Services DACH GM: 23% (2015) to 29% (2017)
Maxdata sold, invest in Raiffeisen IT (private cloud, closing April 17)
Focus Services to implementation of IoT -> target 30% GM
EUR 26 Mio. unprofitable business sold in 2016 -> results 2017 in +2% higher GM
Mid-term target 40% Gross Margin
13%
Technology
Services
30%
Technology
Services
60%
Technology
Services
>50% of Profits
from Technology
Revenue
2013
Revenue
2015
Revenue
2018p

Security Appliances: driving profit
10
A solid and recurring base business with significant upside via new IoT applications
Third party hardware
Third party software Niche IoT
applications
S&T offers appliances dedicated to
special vertical markets
Appliance = „black box“ (HW+SW)
offering Security for machines (IoT)
Appliances require long term
maintenance contracts
Strong customers: Siemens, Novomatic,
ÖBB, tipp3, Bosch
H1/2016Security
AppliancesS&T Group
Gross Margin 53,7% 34,8%
EBITDA Margin 13,6% 6,7%
Customized “black box” solution
45% recurring / 3-year contracts
Microsoft Gold Partner Since 2010; channel
partner

IoT: add continuously new markets/applications
11
IoT = next hype in IT/Internet
25 Bn. machines added to 4 Bn. PCs
S&T adjusts security to applications in vertical end markets
S&T offers security solutions to IoT (e.g. robots need protection)
Telecom and Defense: convert to IoT Appliances in Step 2
Connected Devices (Billions)
IndustrialInfotainmentMedical Smart Energy Telecom Defense
Appliances: Security Know-how, Integration into IT Infrastructure and Cloud

Smart Energy: new field of growth
12
H1/16 vs H1/15: Revenues reduced to EUR 19,4 Mio., EBITDA increased from -0,5m (-3%) to 2,1m (10,7%)
NES Corp. USA divested -> reduce EUR 14 Mio. unprofitable business
Pioneer in smart energy – 4,5 Mio. installations
Smart Grids optimize the generation, distribution and usage of energy
80% smart grids required by EU law until 2019, subsidies for East Europe
EUR 40 Bn. TAM within the EU (>200 Mio. pieces) – 12% are done
Amortizing fast: reduce theft, reduce reading cost, efficient energy usage
Russia: electrical and gas grids, 400 engineers = SW development center
S&T USPs: End-to-end supplier, integration of Smart Energy into IT
Q1/16 Focus to Europe and Software (divest NES Corp USA)
Price pressure in meter HW -> profits in implementation and Software

S&T´s Engineering Competencies
13
Applied engineering – no basic R&D
Niche applications for vertical markets
Focus on „adding value“ to existing business
Focus: IoT Security
and Smart Energy
Incubator division to
extend technology
portfolio
Incubator (S&T Tech): Acquire 2 technology start-ups pa
Several subsidized security projects (>EUR 2 Mio. p.a.)
Choose from 4000 leading Foxconn computer designs p.a.
Focus 250 Kontron Engineers on Embedded Systems
~800 R&D
engineers
~1.150
engineers
for services
~450
others
S&T Employee Qualification
IoT Security Smart Energy
Appliances for IoT machines Various firewalls for niche applications Big data software solution supporting
management of complex energy grids
Cooperation
Foxconn/Kontron
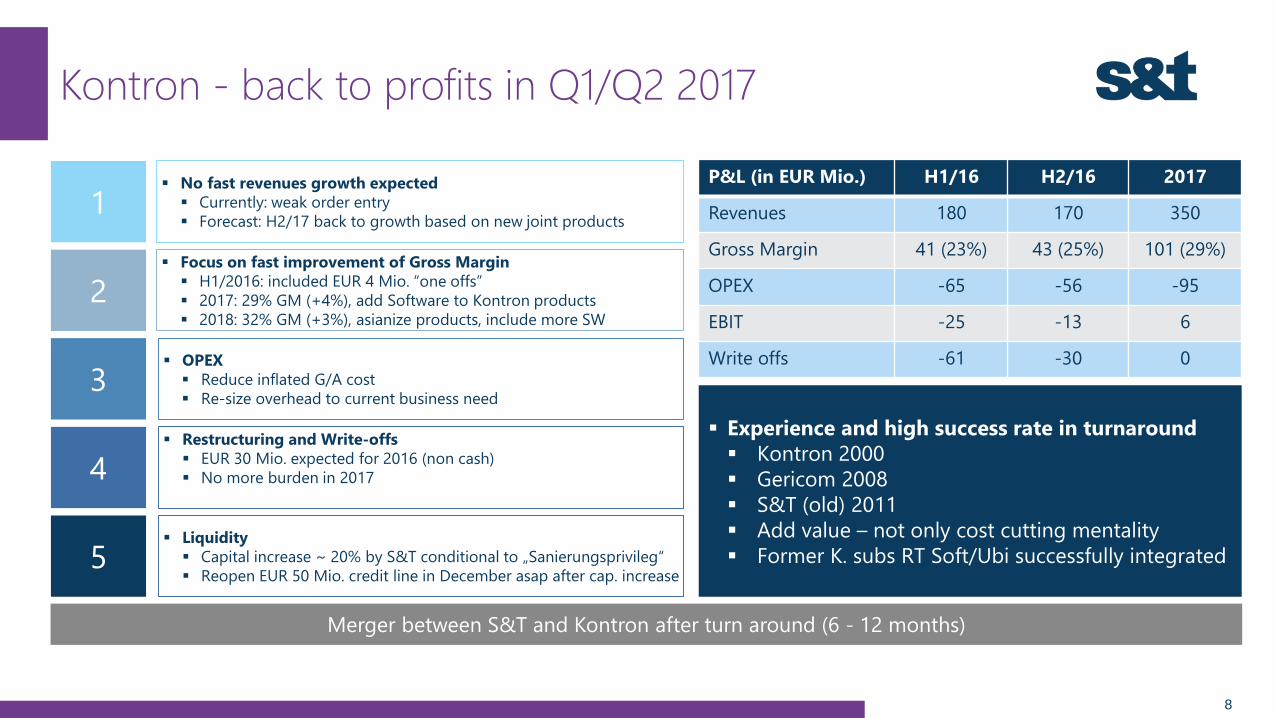
Services: covering DACH + Eastern Europe
14
Focus on security applications, Steel Cloud ISO 27001
Cross-selling of Appliance/Smart Grid Technology
Technology + Cloud
focus
Cost efficiency program installed to increase EBITDA
Market leader with > 3% share, 50% recurring revenues
(contracts 2-4 years)
Leverage Eastern Europe costs to win in DACH
Gross Margin improvement program to 27% (2015: 23%)Services DACH
Market leading IT services business with technology niches and unique geographic coverage
S&T covers 19 countries with > 20 years of market presence
Single point of contact for international customers
DACH
21%
Eastern
Europe
79%
Service Revenue
Split 2015
Services Eastern
Europe – back to
growth
Service USPs

Long Term Trend (in EUR Mio.)
15
339,0 338,0
386,0
468,0
188,2 196,4
2012 2013 2014 2015 H1/2015 H1/2016
9,4
11,9
14,0
17,6
6,0 6,6
2012 2013 2014 2015 H1/2015 H1/2016
REVENUES
Backlog EUR Mio. 12/12 12/13 12/14 12/15 06/16
Project Pipeline 266 308 644 701 867
Scheduled Orders 86 97 157 181 199
Significant growth in all key parameters
Revenue Consolidated Income

*) including HQ-costs
Split by Segments H1 (in EUR Mio.)
16
2,2
3,8
1,7
4,9
Services *) IoT Technologies
40,6
28,4
41,2
27,2
Services IoT Technologies
133,5
54,7
137,5
58,9
Services IoT Technologies
4,8
6,05,6
7,5
Services IoT Technologies
Revenue 2015 vs. 2016 Gross Margin 2015 vs. 2016
EBITDA 2015 vs. 2016 Consolidated Income 2015 vs. 2016

S&T Key Figures
17
2015 H1/2015 H1/2016
Revenues (EUR Mio.) 468,2 188,2 196,4
Gross Margin (EUR Mio.)
(in %)
158,8
33,9
69,0
36,6
68,4
34,8
EBITDA (EUR Mio.)
(in %)
28,4
6,1
10,8
5,7
13,1
6,7
EBIT (EUR Mio.) 20,6 7,1 8,9
EBIT before PPA amortization (EUR Mio.) 24,1 9,1 10,7
EBITDA Interest Coverage Ratio 9,5 7,5 8,3
Total Debt / Capital 0,3 0,3 0,4
Net Cash (EUR Mio.) 9,4 -10,9 -23,1
Working Capital (EUR Mio.) 45,1 57,3 60,1
Equity Ratio 32% 36% 35%
Operating Cashflow (EUR Mio.) 26,6 -1,1 -6,0
Employees 2.352 2.267 2.367

S&T Group Balance Sheet (in EUR Mio.)
18
30.06.2016 31.12.2015 30.06.2016 31.12.2015
EQUITY 102,2 102,2
NON-CURRENT ASSETS 117,6 106,9 NON-CURRENT LIABILITIES 66,5 49,9
Fixed assets 101,5 91,0 Long-term loans and borrowings 40,4 28,1
Other assets 16,1 15,9 Other non-current liabilities 26,1 21,8
CURRENT ASSETS 176,1 212,1 CURRENT LIABILITIES 125,0 166,9
Inventories 28,8 28,7 Trade accounts payable 54,0 70,1
Trade accounts receivable 85,2 86,4 Short-term borrowings 16,8 22,9
Cash and cash equivalents 34,0 60,3 Other current liabilities 54,2 73,9
Other assets 28,1 36,7
Assets 293,7 319,1 Liabilities & equity 293,7 319,1
Equity Ratio 35% 32%
Net Cash -23,1 9,4
Working Capital 60,1 45,1

The S&T Share
19
Free Float
70,1%as of Hannes
Niederhauser
2,5%
Foxconn
29,9%
Shares: 48,3 Mio. shares
Price (October 24, 2016): EUR 9,41
EPS (2015): 36 cent
EPS w/o PPA amortization (2015): 40 cent (80% rollout in 4 years)
October 2016: 15% drop in share price (Kontron transaction seen risky, Foxconn chances neglected)
Shareholder Structure
(after Foxconn Investment)
S&T outperformed TecDAX
Dividend (2016): 8 cent (2015: 7 cent)
Market Cap: ~ EUR 454 Mio.
Liquidity last 90 days: > 100 Mio.. EUR
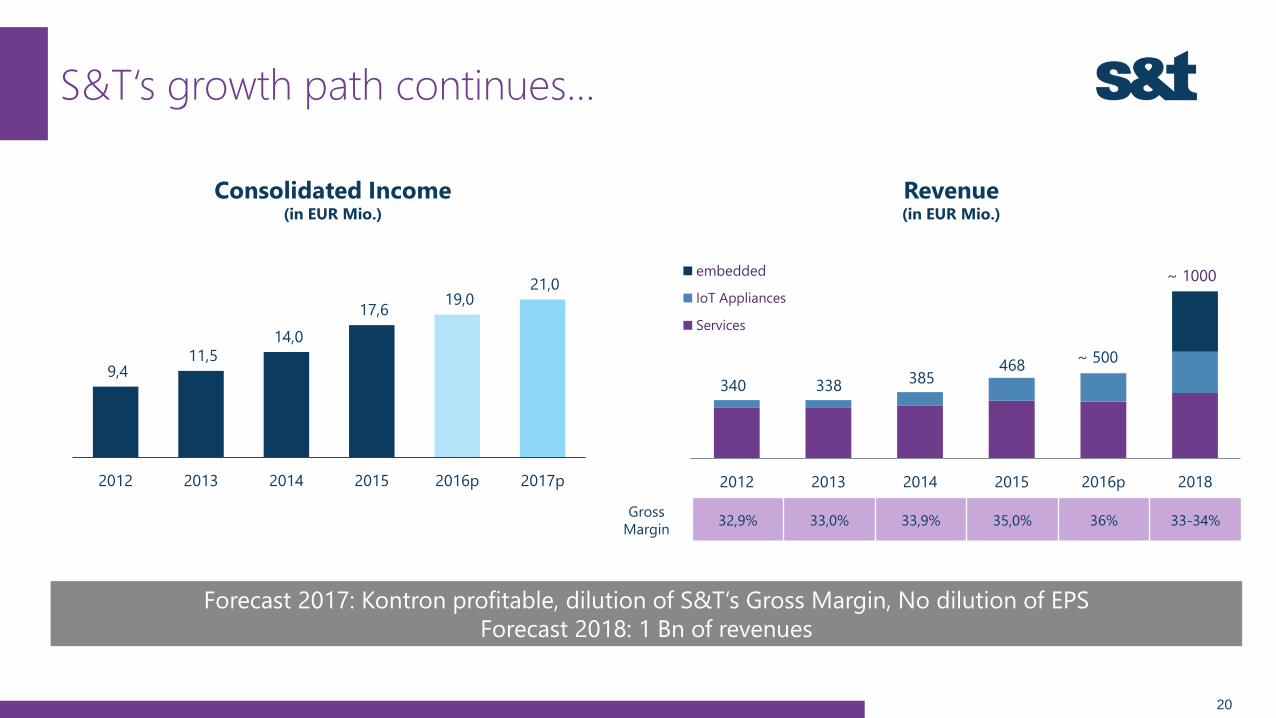
S&T‘s growth path continues…
20
Revenue(in EUR Mio.)
Consolidated Income(in EUR Mio.)
9,4 11,5
14,0
17,6 19,0
21,0
2012 2013 2014 2015 2016p 2017p 2012 2013 2014 2015 2016p 2018
embedded
IoT Appliances
Services
340 338385
~ 500468
Gross
Margin32,9% 33,0% 33,9% 35,0% 36% 33-34%
~ 1000
Forecast 2017: Kontron profitable, dilution of S&T‘s Gross Margin, No dilution of EPS
Forecast 2018: 1 Bn of revenues

Summary
21
Partnership
S&T/Kontron/Ennoconn
Cost efficient engineering
Hype in IoT Security Opportunities
Growing backlog by 10% and
pipeline by 23% in H1/2016
Entering TecDax in Sept 2016
Foundation of Foxconn and
Kontron alliance for IoT hype
Achievements
2016
Kontron integration delayed
Russian economy slows down
Fail of Foxconn cooperationRisks
Proceed GM Improvement
Strategy (mid term: 40%)
Integration of Kontron
Winning leadership in IoT
Industry 4.0 MarketNext Targets

This document includes 'forward-looking statements'. Forward-looking statements are all statements, which do not describe facts of the past, but containing the words "believe", "estimate",
"expect", "anticipate", "assume", "plan", "intend", "could", and words of similar meaning. These forward-looking statements are subject to inherent risks and uncertainties since they relate to
future events and are based on current assumptions and estimates of S&T AG, which might not occur at all or occur not as assumed. They therefore do not constitute a guarantee for the
occurrence of future results or performances of S&T AG. The actual financial position and the actual results of S&T AG, as well as the overall economic development and the regulatory
environment may differ materially from the expectations, which are assumed explicitly or implicitly in the forward-looking statements and do not comply to them. Analysts and investors, and
any other person or entity that may need to take decisions, or prepare or release opinions about the shares / securities issued by S&T AG are cautioned not to place undue reliance on those
forward-looking statements, which speak only as of the date of this document. Past performance cannot be relied upon as a guide to future performance.
Except as required by applicable law, S&T AG undertakes no obligation to revise these forward-looking statements to reflect events and circumstances after the date of this presentation,
including, without limitation, changes in S&T’s business or strategy or to reflect the occurrence of unanticipated events. The financial information and opinions contained in this document are
unaudited and are subject to change without notice. This document contains summarized information or information that has not been audited. In this sense, this information is subject to,
and must be read in conjunction with, all other publicly available information, including if it is necessary, any fuller disclosure document published by S&T AG. None of the Company, its
subsidiaries or affiliates or by any of its officers, directors, employees, advisors, representatives or agents shall be liable whatsoever for any loss however arising, directly or indirectly, from any
use of this document its content or otherwise arising in connection with this document.
This document or any of the information contained herein do not constitute, form part of or shall be construed as an offer or invitation to purchase, subscribe, sale or exchange, nor a request
for an offer of purchase, subscription, sale or exchange of shares / rities of S&T AG, or any advice or recommendation with respect to such shares / securities. This document or a part of it
shall not form the basis of or relied upon in connection with any contract or commitment whatsoever.
This document does not constitute an offer to purchase securities in the United States, Canada, Australia, South Africa and Japan. Securities, including the bond of S&T AG may not be sold or
offered for sale within the United States or to or for the account of / in favour of US citizens (as defined in Regulation S under the U.S. Securities Act of 1933 in the current version (the
"Securities Act") unless they are registered under the regulations of the Securities Act or unless they are subject to an exemption from registration. Neither S&T AG nor any other person
intend to register the offer or a part thereof in the United States or to make a public offer of the securities in the United States.
Disclaimer
22