Embed Size (px)
DESCRIPTION
SSRS 2008 R2 as presented by DataSite at BI data platform on 30/05/2010 at Dan Hotel, Tel Aviv, Israel
Citation preview
SSRS with SQL SERVER 2008 R2
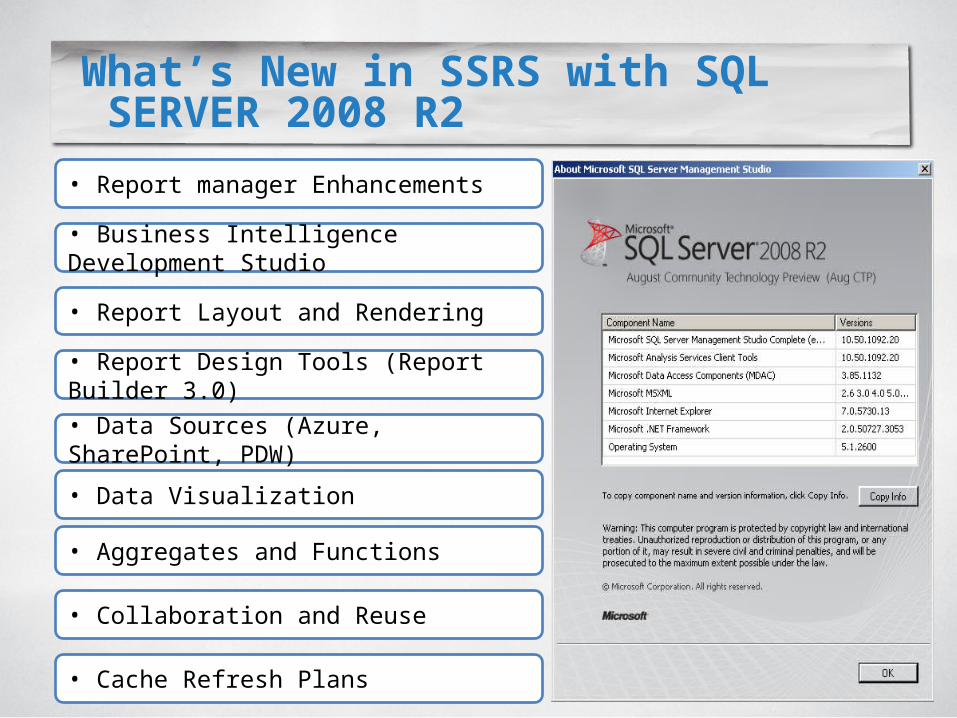
What’s New in SSRS with SQL SERVER 2008 R2
• Data Visualization
• Report Layout and Rendering
• Aggregates and Functions
• Report Design Tools (Report Builder 3.0)
• Cache Refresh Plans
• Report manager Enhancements
• Collaboration and Reuse
• Business Intelligence Development Studio
• Data Sources (Azure, SharePoint, PDW)
Report manager Enhancements
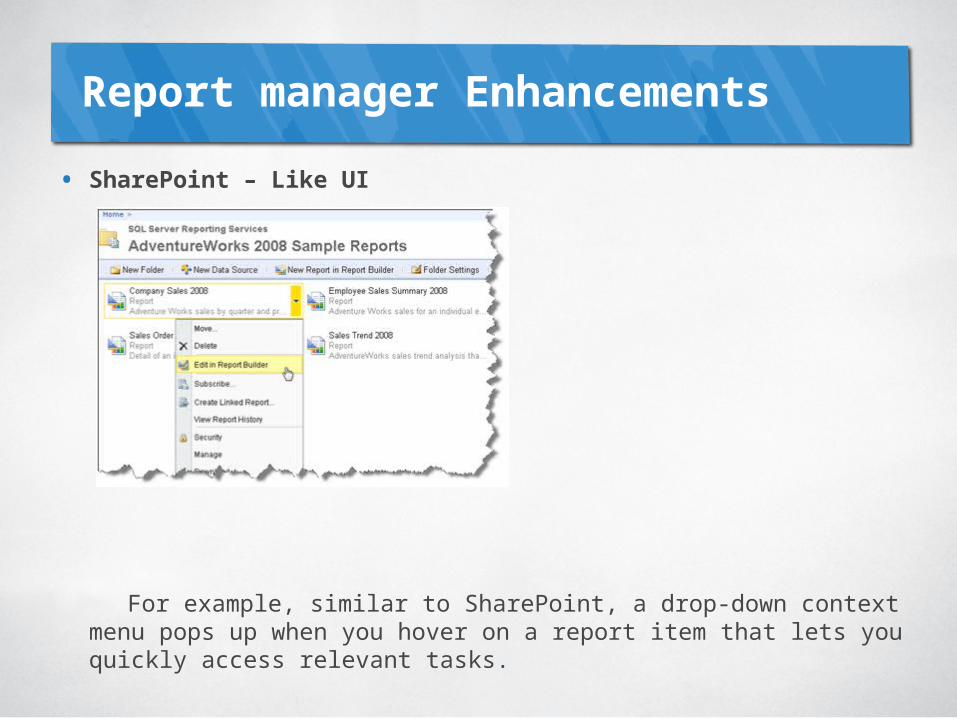
• SharePoint – Like UI
For example, similar to SharePoint, a drop-down context menu pops up when you hover on a report item that lets you quickly access relevant tasks.
Report manager Enhancements
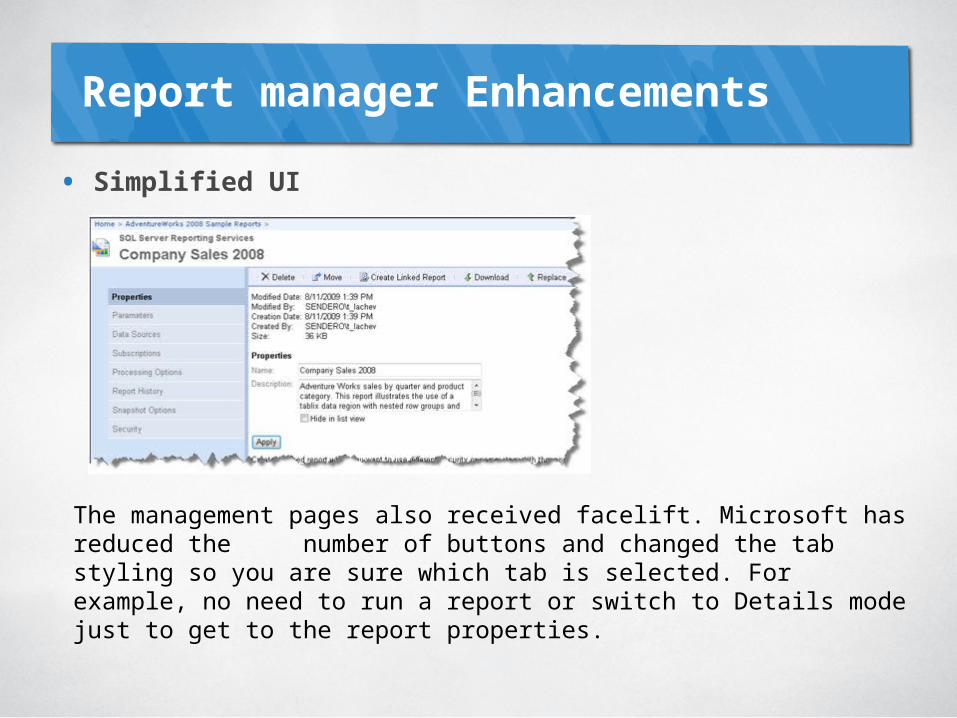
• Simplified UI
The management pages also received facelift. Microsoft has reduced the number of buttons and changed the tab styling so you are sure which tab is selected. For example, no need to run a report or switch to Details mode just to get to the report properties.
Report manager Enhancements
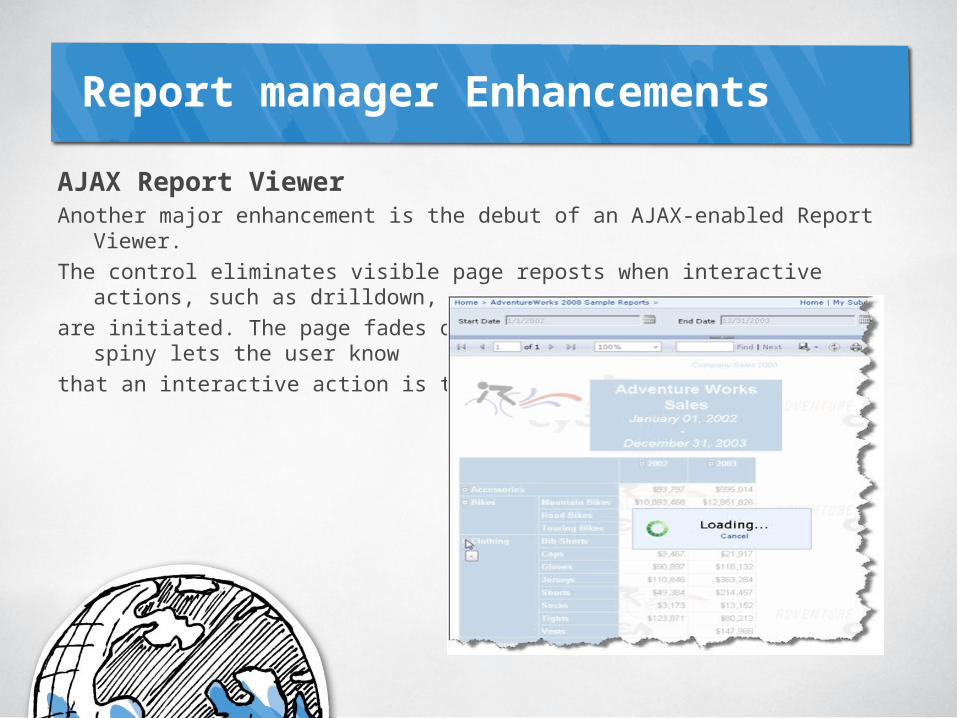
AJAX Report Viewer Another major enhancement is the debut of an AJAX-enabled Report Viewer. The control eliminates visible page reposts when interactive actions, such as
drilldown, are initiated. The page fades out but it stays in place and a spiny lets the user
know that an interactive action is taking place.
Business Intelligence Development Studio
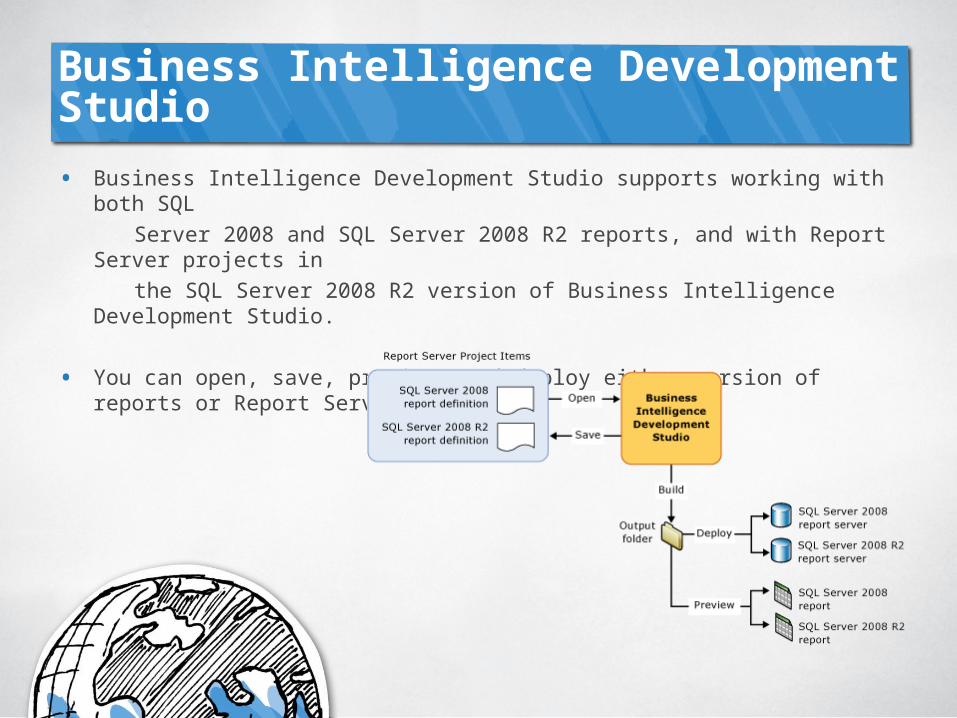
• Business Intelligence Development Studio supports working with both SQL Server 2008 and SQL Server 2008 R2 reports, and with Report Server
projects in the SQL Server 2008 R2 version of Business Intelligence Development
Studio.
• You can open, save, preview, and deploy either version of reports or Report Server projects.
Report Layout and Rendering
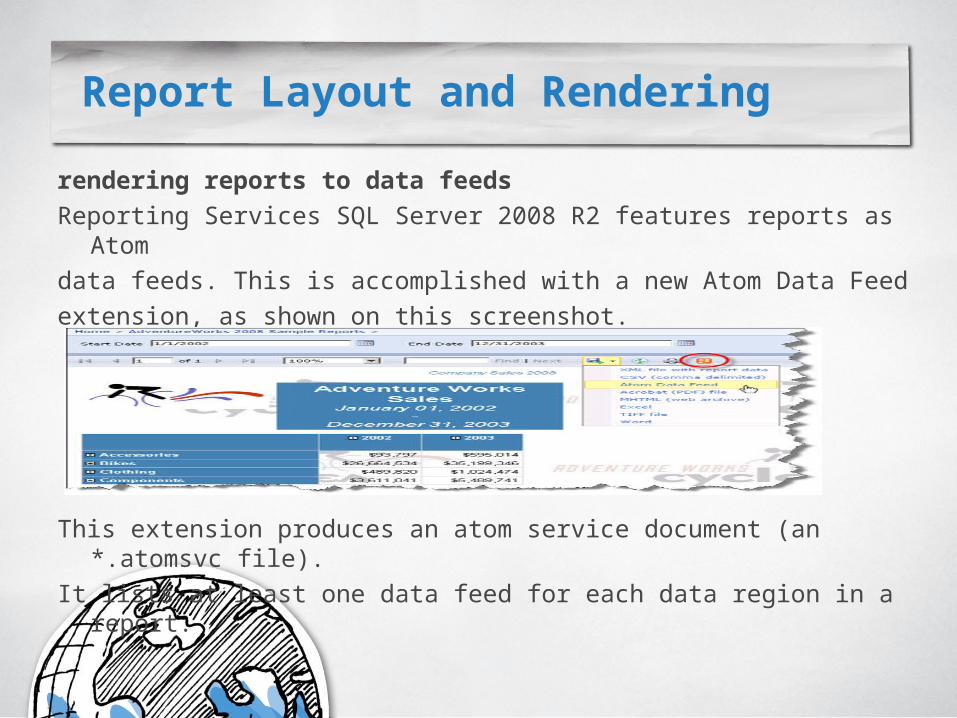
rendering reports to data feeds Reporting Services SQL Server 2008 R2 features reports as
Atom data feeds. This is accomplished with a new Atom Data Feed extension, as shown on this screenshot.
This extension produces an atom service document (an *.atomsvc file).
It lists at least one data feed for each data region in a report.
Report Layout and Rendering
Reports as Data Feeds
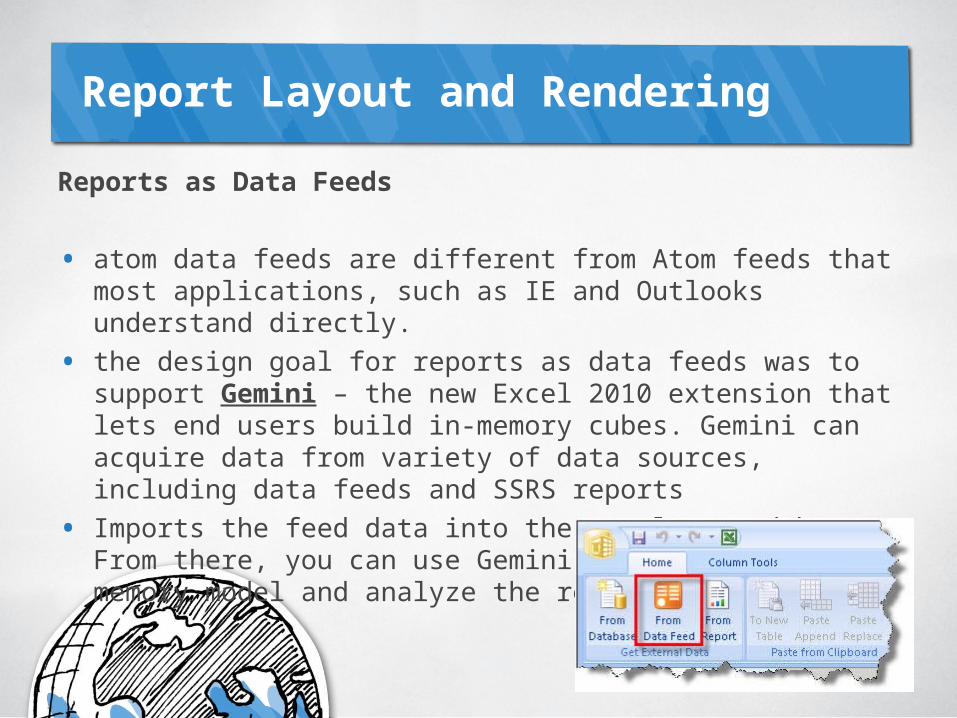
• atom data feeds are different from Atom feeds that most applications, such as IE and Outlooks understand directly.
• the design goal for reports as data feeds was to support Gemini – the new Excel 2010 extension that lets end users build in-memory cubes. Gemini can acquire data from variety of data sources, including data feeds and SSRS reports
• Imports the feed data into the Excel spreadsheet. From there, you can use Gemini to build the in-memory model and analyze the report data.
Report Layout and Rendering
Naming Excel Worksheet Tabs
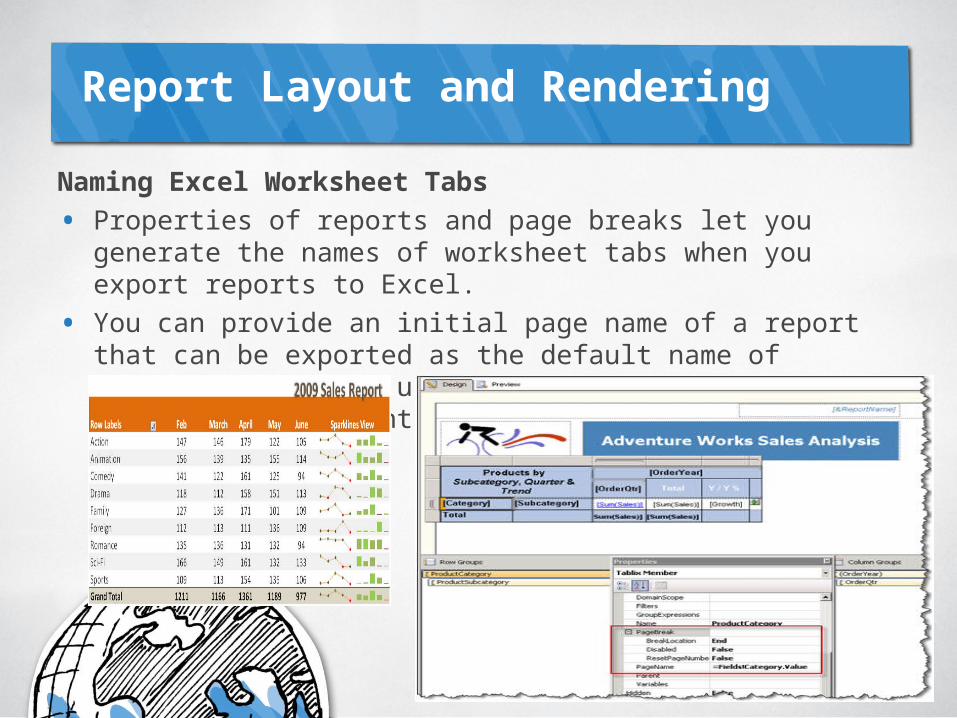
• Properties of reports and page breaks let you generate the names of worksheet tabs when you export reports to Excel.
• You can provide an initial page name of a report that can be exported as the default name of worksheet tabs, or use page breaks and page names to provide different names for each worksheet tab.
Report Layout and Rendering
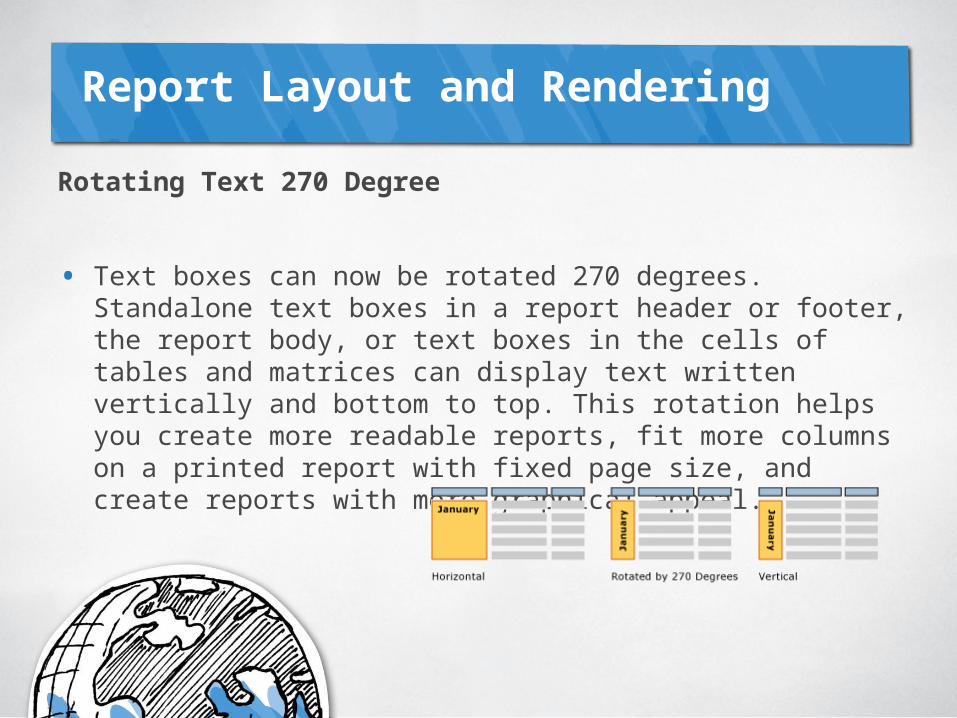
Rotating Text 270 Degree
• Text boxes can now be rotated 270 degrees. Standalone text boxes in a report header or footer, the report body, or text boxes in the cells of tables and matrices can display text written vertically and bottom to top. This rotation helps you create more readable reports, fit more columns on a printed report with fixed page size, and create reports with more graphical appeal.
Report Design Tools
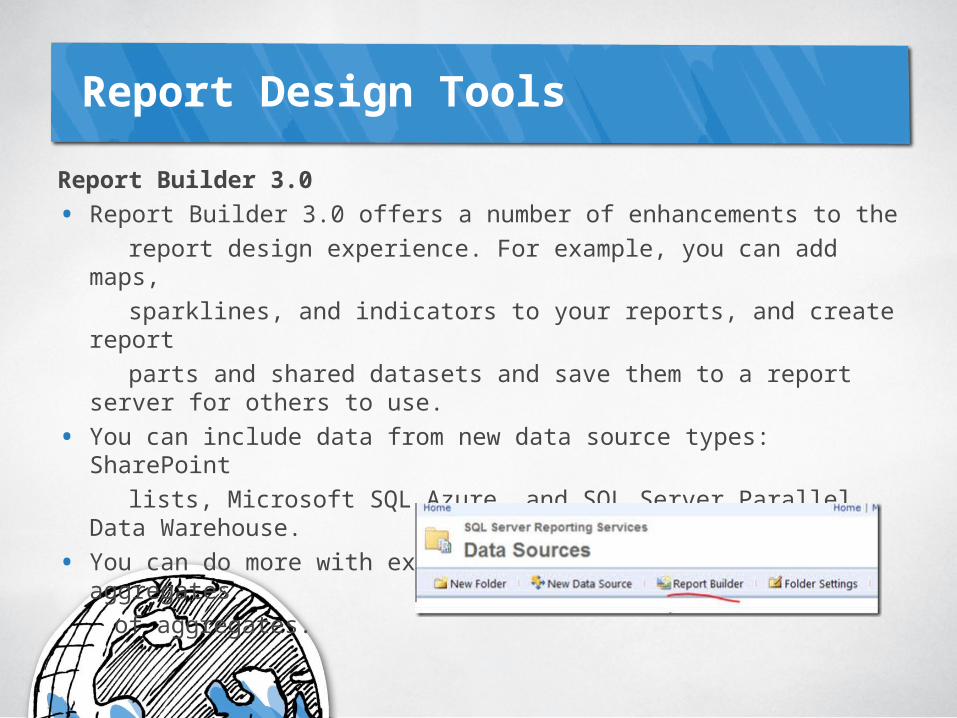
Report Builder 3.0
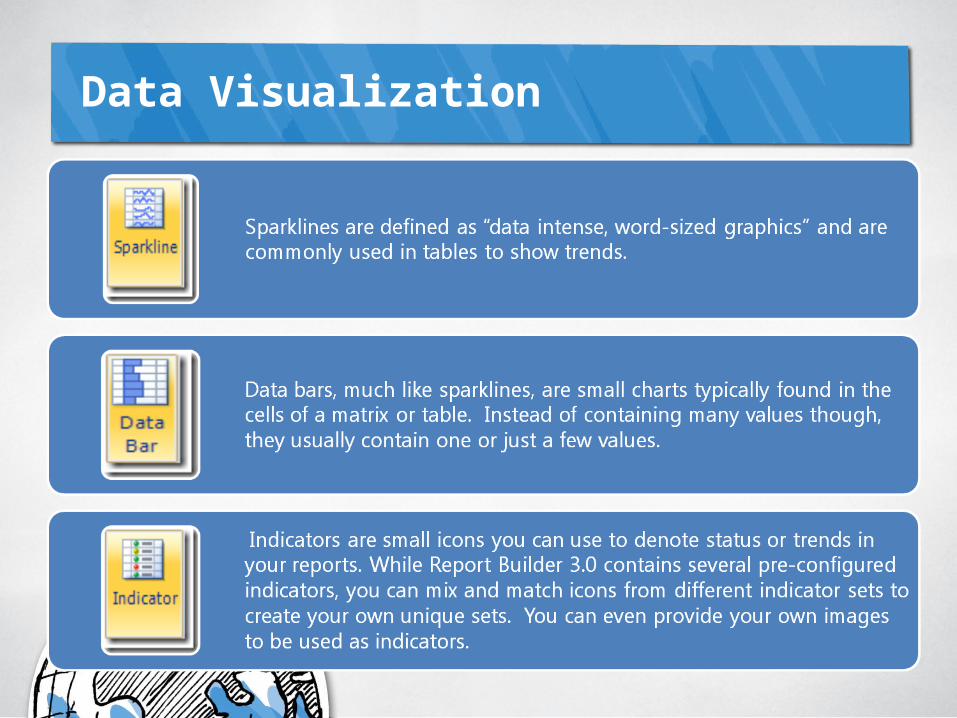
• Report Builder 3.0 offers a number of enhancements to the report design experience. For example, you can add maps, sparklines, and indicators to your reports, and create report parts and shared datasets and save them to a report server
for others to use.
• You can include data from new data source types: SharePoint
lists, Microsoft SQL Azure, and SQL Server Parallel Data Warehouse.
• You can do more with expressions, including calculate aggregates
of aggregates.
Report Design Tools
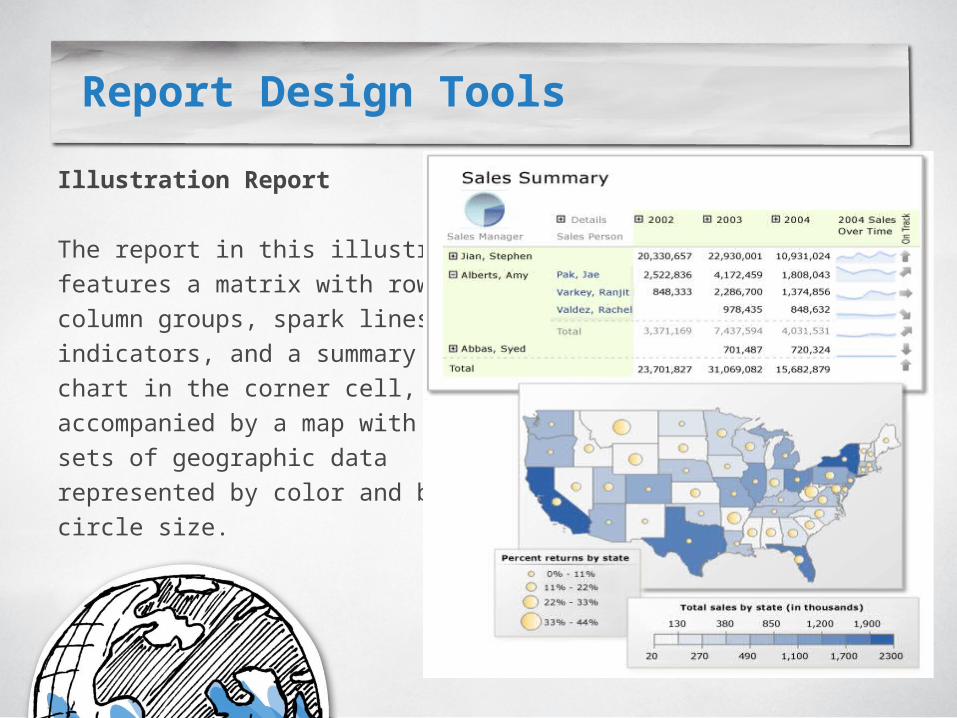
Illustration Report
The report in this illustration features a matrix with row and column groups, spark lines, indicators, and a summary pie chart in the corner cell, accompanied by a map with two sets of geographic data represented by color and by circle size.
Data Sources
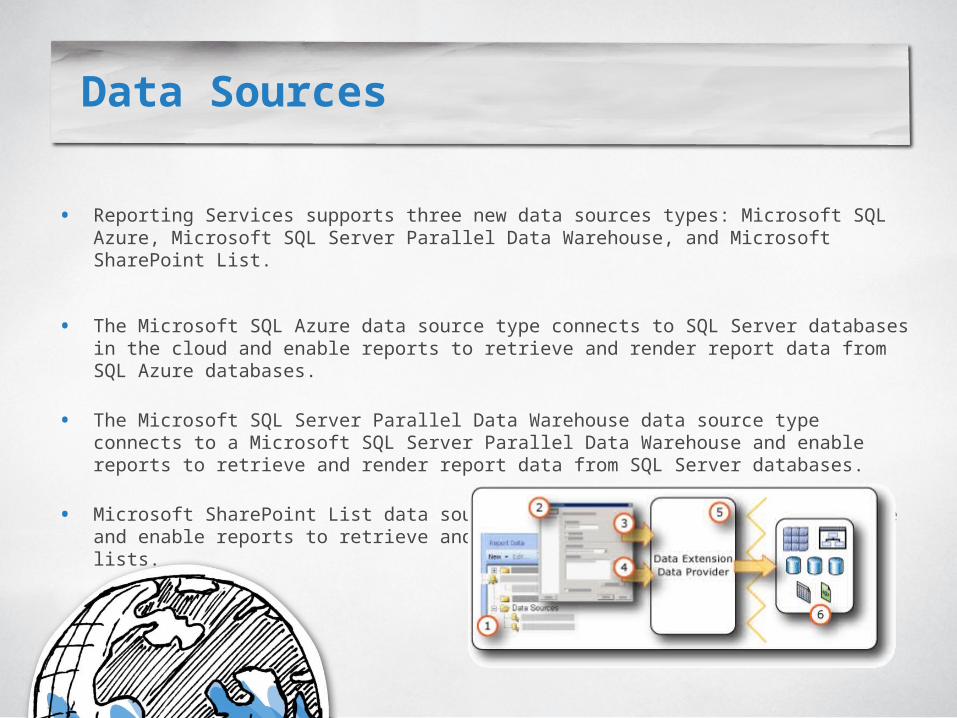
• Reporting Services supports three new data sources types: Microsoft SQL Azure, Microsoft SQL Server Parallel Data Warehouse, and Microsoft SharePoint List.
• The Microsoft SQL Azure data source type connects to SQL Server databases in the cloud and enable reports to retrieve and render report data from SQL Azure databases.
• The Microsoft SQL Server Parallel Data Warehouse data source type connects to a Microsoft SQL Server Parallel Data Warehouse and enable reports to retrieve and render report data from SQL Server databases.
• Microsoft SharePoint List data source type connects to a SharePoint site and enable reports to retrieve and render report data from SharePoint lists.
Data Visualization
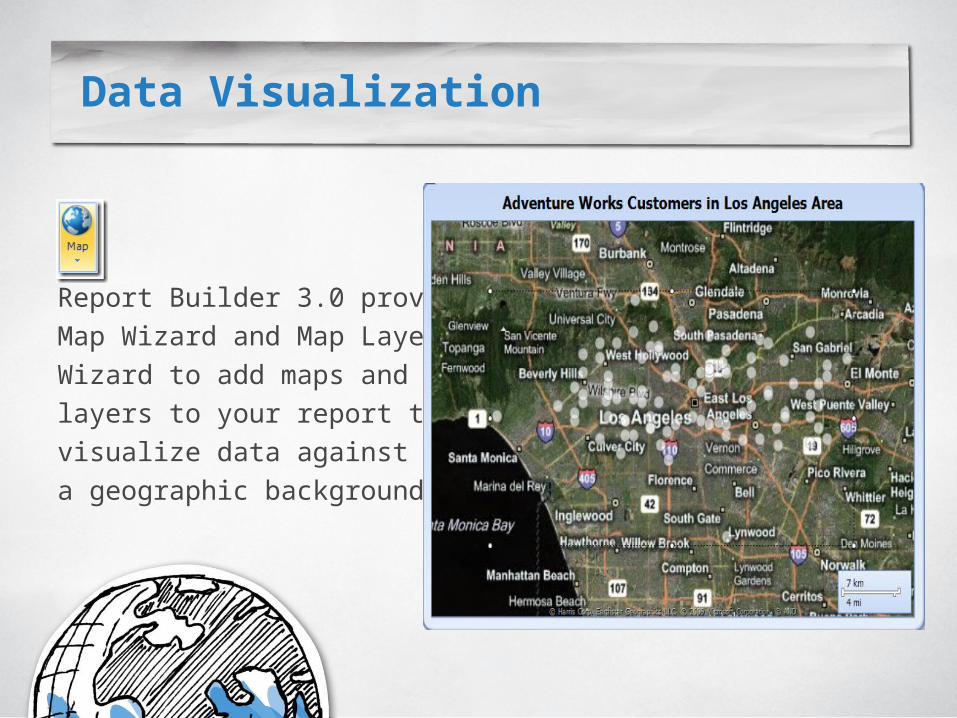
Report Builder 3.0 provides a Map Wizard and Map Layer Wizard to add maps and map layers to your report to help visualize data against a geographic background.
Data Visualization
• A map layer displays map elements based on spatial data from a map in the Map Gallery, from a SQL Server query that returns SQL Server spatial data, or from an Environmental Systems Research Institute, Inc. (ESRI) shape file.
• You can also add a background that displays Bing map tiles.
• After you relate map elements with report data, you can specify rules for the map elements on each layer that control color, size or width.
Data Visualization
Aggregates and Lookup Functions
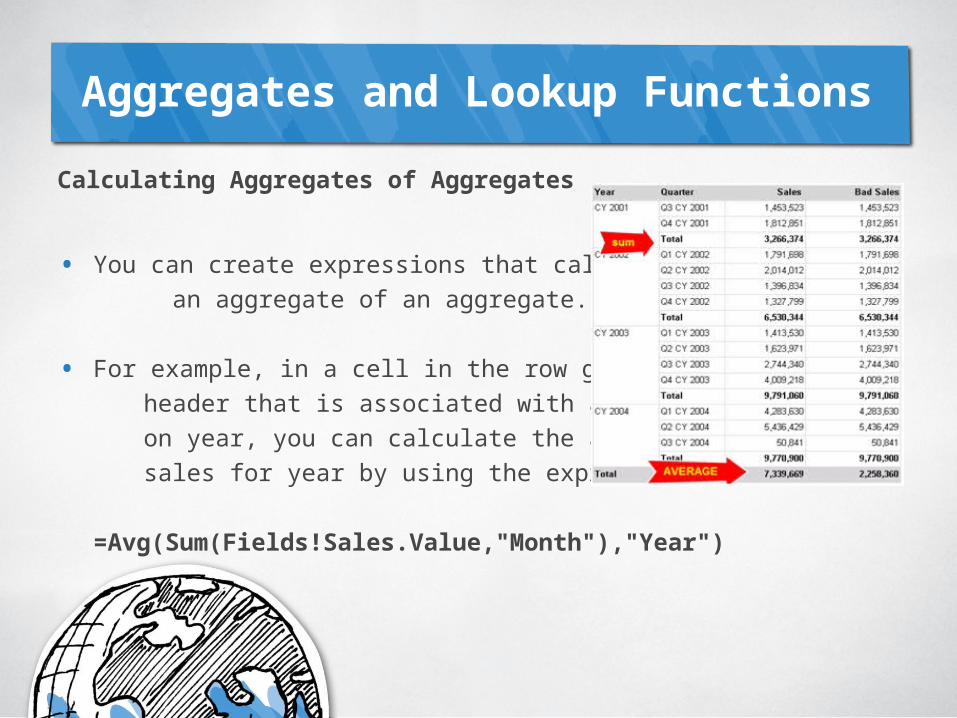
Calculating Aggregates of Aggregates
• You can create expressions that calculate an aggregate of an aggregate.
• For example, in a cell in the row group header that is associated with a group based on year, you can calculate the average monthly sales for year by using the expression:
=Avg(Sum(Fields!Sales.Value,"Month"),"Year")
Aggregates and Lookup Functions
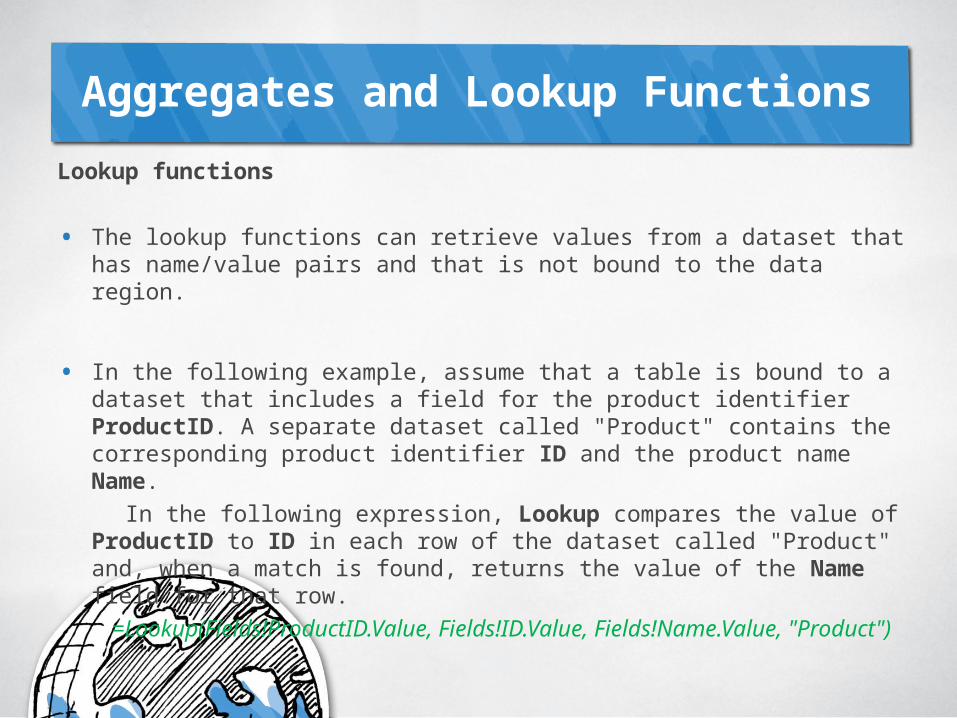
Lookup functions
• The lookup functions can retrieve values from a dataset that has name/value pairs and that is not bound to the data region.
• In the following example, assume that a table is bound to a dataset that includes a field for the product identifier ProductID. A separate dataset called "Product" contains the corresponding product identifier ID and the product name Name.
In the following expression, Lookup compares the value of ProductID to ID in each row of the dataset called "Product" and, when a match is found, returns the value of the Name field for that row.
=Lookup(Fields!ProductID.Value, Fields!ID.Value, Fields!Name.Value, "Product")
Collaboration and Reuse
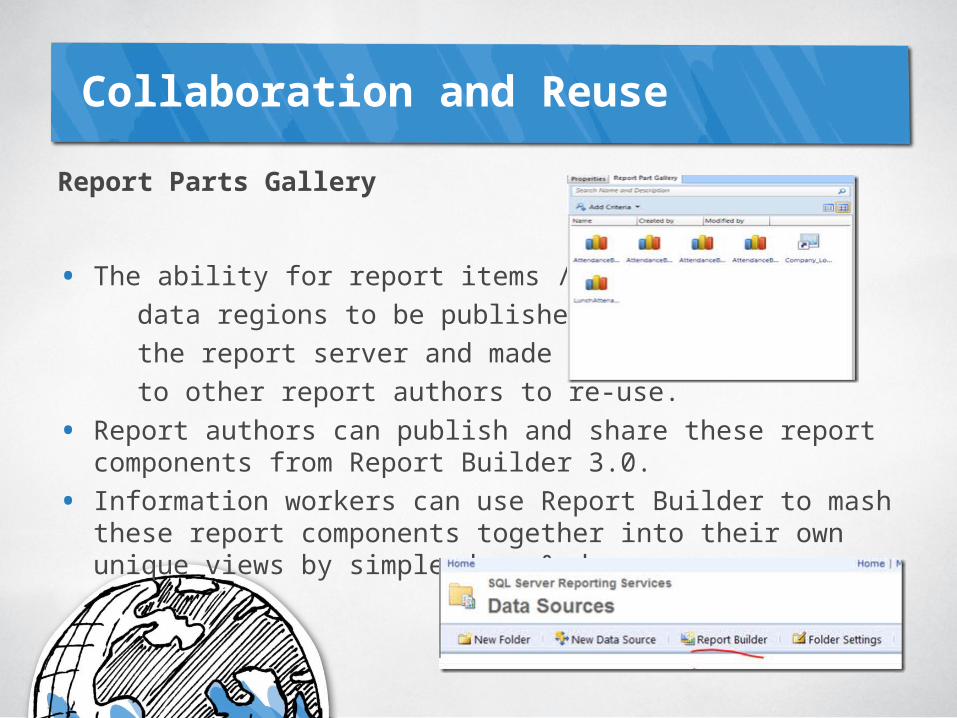
Report Parts Gallery
• The ability for report items / data regions to be published to the report server and made available to other report authors to re-use.
• Report authors can publish and share these report components from Report Builder 3.0.
• Information workers can use Report Builder to mash these report components together into their own unique views by simple drag & drop.
Collaboration and Reuse
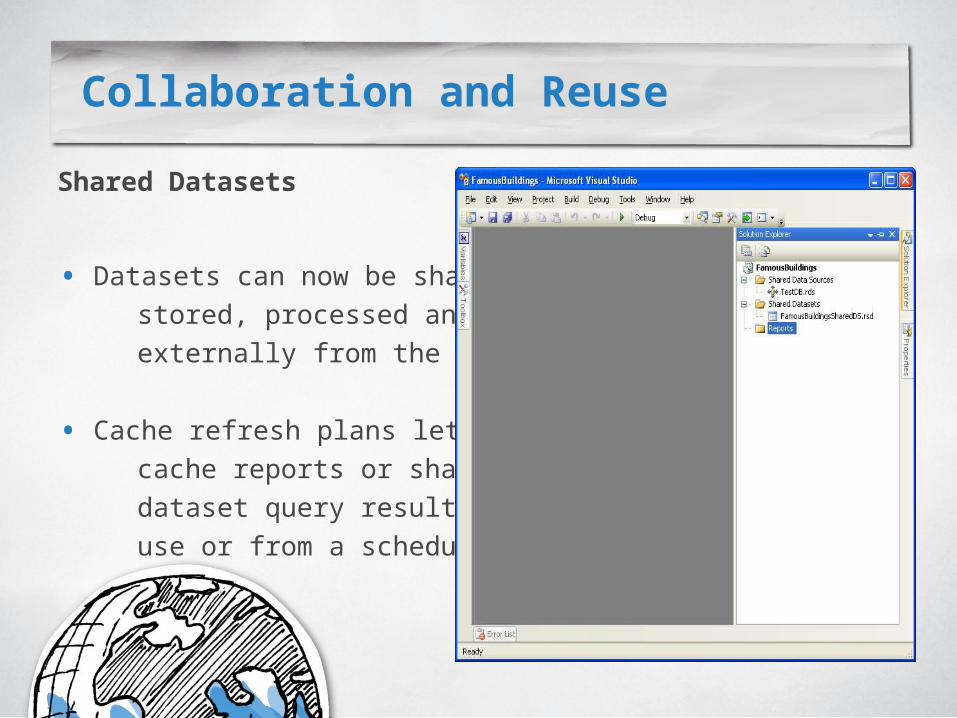
Shared Datasets
• Datasets can now be shared, stored, processed and cached externally from the report.
• Cache refresh plans let you cache reports or shared dataset query results on first use or from a schedule.
Collaboration and Reuse
Advantages of using Shared Datasets
1) The first and biggest advantage is reusability. Shared datasets can be used by multiple reports, and embedded datasets are limited to the scope of report in which it is defined.
2) As multiple reports are using the same dataset definition, this makes the definition more centralized and easier to maintain. Changing the definition of the dataset at a single location would cascade changes to all the reports using this dataset. This is an advantage, but it should be used with caution.
3) By separating the dataset element from the definition of the report, it becomes easy to individually configure datasets on a broad level. When datasets are consumed in reports, they can be tuned as per the needs of report like selection of fields can be modified, more filter parameters can be added, datasets can be cached separately from the report etc..
Cache Refresh Plans
• Cache refresh plans let you cache reports or shared dataset query results on first use or from a schedule. You can
schedule the cache by using an item-specific schedule or a shared
schedule.
• By creating cache refresh plans for commonly used parameter combinations, you can help improve data retrieval and report viewing response times.
• In previous releases, scheduled caching was achieved by using the NULL delivery provider. By using cache refresh plans, you can manage and schedule report caching separately from report subscriptions.
SharePoint Integrated Mode
What's New (Reporting Services in SharePoint Integrated Mode)
• Support for Multiple SharePoint Zones - In previous releases of Reporting Services, report server items were available from only the default SharePoint zone, which restricted the ability to access such items from other SharePoint zones. In this latest release of Reporting Services, you can use the alternate access mapping functionality in your SharePoint environment to access report server items from one or more of the following SharePoint zones: default, Internet, intranet, extranet, or custom. This is useful when you have a SharePoint environment that can be accessed by users from multiple zones. For example, your SharePoint site might be available to users from the Internet and an intranet. By using alternate access mapping, you can ensure that users from the Internet and intranet zones can access the same report server items from your SharePoint site.
SharePoint Integrated Mode
• Support for SharePoint User Token – Reporting Services introduced a new server interface calledIRSSetUserToken. When this
interface is implemented, the report server calls the UserToken Set property on this interface and
passes the SharePoint user token to the data extension. If you have data stored in a SharePoint
site, you can use the SharePoint user token to connect to a SharePoint site by using the
SharePoint Object Model, and then retrieve data from the site by using SharePoint credentials.
• Scripting with the rs utility – The rs utility now supports servers configured in SharePoint integrated mode. Use this
utility to automate deployment and administration tasks.
• Easier configuration – The new add-in makes it easier to configure SharePoint server for integration to a Reporting Services report server with a reduced number of steps from the previous add-in.
• Getting Data from a SharePoint List – Your can now use data from a SharePoint list as a data source to for reports. There is a
new Microsoft SharePoint List and query experience to allow you to easily bring SharePoint list information into your report.
SharePoint Integrated Mode
• Local Mode - Reports from Microsoft Access 2010 and the new Reporting Services SharePoint list
data extension can run locally from the SharePoint document library, without a connection to a SQL Server reporting services report server.
• Additional language and character support – The Reporting Services related user interface within SharePoint now supports 37 languages, Right to Left character sets with Hebrew and Arabic, and complex text layout with Thai. This support includes the report viewer web part as well as document library menus and user interface controls.
• Links directly use Document Libraries – When working with reports on a SharePoint server integrated with reporting services, subscriptions and drill-through links will now work directly with the linked resources in the document library itself.
• HTTP requests – An HTTP redirector which listens for requests from clients like report builder to the SharePoint web front end and will re-direct the requests to the report server