Embed Size (px)
Citation preview
Diversity 2015, 7, 360-384; doi:10.3390/d7040360
diversity ISSN 1424-2818
www.mdpi.com/journal/diversity
Article
SSR Markers for Trichoderma virens: Their Evaluation and Application to Identify and Quantify Root-Endophytic Strains
Joerg Geistlinger 1,†,*, Jessica Zwanzig 1,2,†, Sophie Heckendorff 3,† and Ingo Schellenberg 1,3
1 Institute of Bioanalytical Sciences (IBAS), Anhalt University of Applied Sciences,
Strenzfelder Allee 28, Bernburg 06406, Germany; E-Mails: [email protected] (J.Z.);
[email protected] (I.S.) 2 Department of Applied Biosciences and Process Engineering, Anhalt University of Applied Sciences,
Bernburger Straße 55, Köthen 06366, Germany 3 INSTAND e.V., Society for Promoting Quality Assurance in Medical Laboratories e.V., Ubierstr. 20,
Düsseldorf 40223, Germany; E-Mail: [email protected]
† These authors contributed equally to this work.
* Author to whom correspondence should be addressed; E-Mail: [email protected];
Tel.: +49-3471-355-1265; Fax: +49-3471-355-1189.
Academic Editor: Michael Wink
Received: 2 September 2015 / Accepted: 19 October 2015 / Published: 03 November 2015
Abstract: Using biological fertilizers and pesticides based on beneficial soil microbes in
order to reduce mineral fertilizers and chemical pesticides in conventional agriculture is still
a matter of debate. In this regard, a European research project seeks to elucidate the role of
root-endophytic fungi and to develop molecular tools to trace and quantify these fungi in the
rhizosphere and root tissue. To do this, the draft genome sequence of the biocontrol fungus
Trichoderma virens (T. virens) was screened for simple sequence repeats (SSRs) and primers
were developed for 12 distinct loci. Primers were evaluated using a global collection of ten
isolates where an average of 7.42 alleles per locus was detected. Nei’s standard genetic
distance ranged from 0.18 to 0.27 among the isolates, and the grand mean of haploid diversity
in AMOVA analysis was 0.693 ± 0.019. Roots of tomato plants were inoculated with
different strains and harvested six weeks later. Subsequent PCR amplification identified
root-endophytic strains and co-colonization of roots by different strains. Markers were
applied to qPCR to quantify T. virens strains in root tissue and to determine their identity
using allele-specific melting curve analysis. Thus, the root-endophytic lifestyle of T. virens was
OPEN ACCESS
Diversity 2015, 7 361
confirmed, strains in roots were quantified and simultaneous colonization of roots by
different strains was observed.
Keywords: Hypocrea virens; simple sequence repeat; microsatellite; molecular marker;
fragment analysis; root endophyte; biocontrol; strain identification; qPCR; monitoring
1. Introduction
DNA sequencing of the ITS1, 5.8S and ITS2 region identified the ascomycete Hypocrea virens
(Chaverri, Samuels and Steward) as the teleomorph of Trichoderma virens (Miller, Giddens and Foster)
Arx [1–3]. By further analyzing the newly identified H. virens isolate and comparing its ITS barcode
with four different reference strains of the anamorph T. virens, both types were found to be
indistinguishable [1]. T. virens is well known under its common name Gliocladium virens Mill. and is
also referred to as Gliocladium flavofuscum Mill. or Trichoderma flavofuscum Mill. The genus
Hypocrea/Trichoderma consists of about 200 species described by molecular data [4]. In molecular
studies for the reconstruction of phylogenetic relationships based on RNA polymerase II subunit b (rpb2)
and translation elongation factor 1 alpha (tef1) [5] as well as on ITS sequences of the rDNA repeat [6],
T. virens shows a distinct grouping in the resulting phylogenetic trees. Tree positions are supported by
high bootstrap values and are localized between sections Longibrachiatum/Pachybasium and within
section Pachybasium B, respectively, with T. crassum Bisset being the closest relative in both cases.
From these data, it can be concluded that T. virens is a well-defined species that can certainly be
identified by molecular taxonomy approaches.
Trichoderma spp. have attracted growing interest due to their economic value and are widely used in
several branches of the industry. A key aspect is the production of diverse extracellular enzymes. Enzyme
preparations and living strains of Trichoderma are products that are commonly used in agricultural
biotechnology. Living strains are utilized for bioremediation of contaminated agricultural land and
T. asperellum Samuels H15 has demonstrated that it is able to degrade polycyclic aromatic hydrocarbons
(PAHs) in soils [7], T. viride Pers. strain NFCCI-2745 has the capability of decomposing phenolic
pollutants in soil [8] and the T. viride strain FRP3 has the ability to biodegrade glyphosate and to be
potentially useful in areas where this herbicide is extensively used [9]. In agricultural crop production
and plant protection, living strains, mainly of T. harzianum Rifai, T. virens, T. atroviride Karst, T. koningii
Oudem, T. hamatum Bonord and T. asperellum, are placed close to the root system in greenhouse and
field crops. Strains of these species have been identified as avirulent plant symbionts that enter root cells
and have been characterized as root endophytes that form intracellular structures [10] which are assumed
to be responsible for substrate exchange and molecular crosstalk. Penetration of the root system by
Trichoderma frequently causes elevated resistance levels in their host plants via salicylate and jasmonate
induced pathways [11]. Further positive effects of the root connected hyphal network include a delay in
drought symptoms, enhanced root growth and nutrient uptake. Therefore they are often used as so-called
biofertilizers or biostimulants and are available on the market as formulated spore-inoculum products.
In natural ecosystems, Trichoderma species have been recognized as common and persistent members
of the soil microbiome and rhizosphere microbial communities [12].
Diversity 2015, 7 362
Mycoparasitism is a common feature among Trichoderma spp. but is only rarely reported in other
families of the fungi [13,14]. The antagonistic mode of primarily T. virens, T. harzianum and
T. asperellum against other fungi and particularly soil-borne plant pathogenic fungi is exploited by the
development of biocontrol agents and biological control strategies in integrated plant protection.
Trichoderma biocontrol products are well established on the market and available as spore-inocula.
Numerous reports exist about inhibition of prominent fungal plant pathogens by Trichoderma spp.,
among these, Rhizoctonia solani Kühn, Fusarium solani Mart. and Sclerotinia sclerotiorium de Bary [15];
Fusarium culmorum Sm. and Fusarium graminearum Schwabe [16]; and Alternaria altanata Kreissl.,
Botrytis cinerea Pers. and Fusarium spp. [17]. The mode of action in terms of direct interaction is based
on a mycotrophic lifestyle including the production of hydrolytic cell wall degrading enzymes like
chitinase and ß-1-3 glucanase [18] as well as biocidal substances [19]. Trichoderma spp. actively attack
other fungi by coiling around their hyphae releasing the above-mentioned substances and feeding on the
parasitized mycelia, which often leads to de-vitalization of the prey fungus. This sometimes also causes
negative impact in the commercial production of culinary fungi like Agaricus bisporus Lange and
Pleurotus ostreatus Krumm. There are even isolates that are effective against members of the Oomycota
through direct interaction [20] or by triggering defense reactions in their host plants [21].
The estimation of root colonization efficiencies of different Trichoderma strains, their ability to
induce systemic resistance in host plants and their capability of inhibiting plant pathogenic fungi in the
rhizosphere under field conditions requires precise re-identification to track and trace strains experimentally
released to the root system. In this context, diagnostic molecular markers are a prerequisite for studying
plant-microbe interaction, the persistence of released strains in the rhizosphere and their impact on
rhizosphere microbial communities. Despite the fact that three complete genome sequences (T. reesei
Simmons, T. virens and T. atroviride) are available on the ISTH webpage (www.isth.info/links.php,
International Subcommission on Trichoderma and Hypocrea Taxonomy) genomic data have not yet
been intensively exploited for the development of locus-specific molecular markers. Reports about this
marker type are sparse in Trichoderma spp. and comprise solely the development of sequence
characterized amplified regions (SCAR markers) obtained from sequence data of cloned random
amplified polymorphic DNA (RAPD) fragments [22,23]. The vast majority of studies on discriminating
the strains of Trichoderma species are based on anonymous markers like (universally primed) UP-PCR,
RAPDs or restriction fragment length polymorphisms (RFLPs) [24–26]. The anonymous approach also
holds true for Trichoderma microsatellite studies, where ISSRs (inter simple sequence repeat) and
RAMS (random amplified microsatellites) have been used so far [27,28]. To our knowledge, no
sequence-tagged microsatellite site (STMS) markers based on PCR amplification of unique SSR loci [29]
are currently available for Trichoderma spp. Therefore, the invaluable genomic information of T. virens
was exploited to develop a set of SSR markers that is capable of identifying strains in root tissue,
rhizosphere soil and environmental samples. Moreover, markers were tested for their potential use in
real-time PCR applications to estimate and quantify root colonization efficiencies of certain strains and
combinations of strains. Furthermore, transferability of the markers to other Trichoderma species, in
particular to Trichoderma harzianum, was evaluated.
Diversity 2015, 7 363
2. Experimental Section
2.1. Screening of Databases and Primer Design
The T. virens genome sequence was accessed via the ISTH website by clicking on the links button
and going to the genome portal of the Department of Energy Joint Genome Institute [30]. In total, 93
scaffolds ranging from 4.407 bp (scaffold 7) to 3,456,807 bp (scaffold 6) were available and downloaded,
of which scaffold 7 was by far the smallest. The majority of the scaffolds were larger than 20 kb and 43
were larger than 50 kb. Roughly 9 scaffolds were at least 1.7 Mb in length and covered half of the
genome. The total genome size was 39 Mb containing 12,427 structurally and functionally annotated
genes. Further information is available on the homepage of the U.S. Department of Energy’s Joint
Genome Institute. All scaffolds (in FASTA format) were loaded into the BioEdit Sequence Editor (Ibis
Biosciences: Carlsbad, CA, USA) by using the select/slide mode. This made it possible to search for all
scaffolds in one go. Screening the genome for microsatellite motifs was based on published data about
existing motifs that were detected in T. virens by ISSR and RAMS analysis [31,32]. Microsatellite loci
sufficiently flanked by unique sequences were selected for primer design using the Primer3
software [33] with parameter settings that included the GC-clamp option and an allowance for primer
annealing at approximately 60 °C. The primer sequences obtained were searched in the genome of T.
virens to avoid multiple annealing sites. After that, about half of the developed primers (Table 1)
displayed clear single-band PCR amplification products on agarose gels, while in some cases stuttering
bands became visible on PAA gels when the same primers were used.
2.2. Fungal Strains
In order to evaluate the variability at the selected microsatellite loci, a set of T. virens isolates of
geographically diverse origin (Table 2) was obtained from the CBS-KWAS (Centraalbureau
Schimmelcultures–Koninklijke Nederlandse Academie van Wetenschappen) Fungal Biodiversity Centre
(Utrecht, The Netherlands). The cultures were grown according to the supplier’s recommendations and the
DNA was isolated from liquid cultures as described below. The molecular fingerprints of the CBS
isolates obtained were compared to a local strain of T. virens, which was isolated from maize roots in
August 2012. Briefly, the roots of a healthy Zea mays L. plant from a maize field in Central Germany
(silty loam loess chernozem, pH 7.2–7.5, 2.5%–3.0% humus, 80 m a.s.l., 51°80′ N, 11°73′ E, 511 mm
average annual precipitation, 9.7 °C average annual temperature) were obtained by carefully removing
residual soil and selecting fine roots (1–2 mm in diameter). The roots were thoroughly washed with
sterile water and cleaned with a soft brush to remove any remaining soil. The cleaned roots were
submerged in 3% Na-hypochlorite for 5 min, rinsed with sterile water, cut into pieces (approximately
1.5 cm long) and placed on a Petri dish containing potato dextrose agar (PDA, 1.5%, pH 5.8).
Outgrowing mycelia were transferred to fresh plates and grown at room temperature until sporulation.
A 20 µL spore suspension was taken, diluted 100-fold and 10–100 µL were plated on fresh PDA. One
colony originating from a single spore was selected and the mycelium cultivated further. Agar blocks
(approximately 5 mm × 5 mm × 5 mm) were excised from actively growing mycelium and stored at
−80 °C in a solution containing 50% glycerol, 25% culture medium and 25% distilled water. A liquid
culture was prepared and DNA isolated as described below. The ITS region of the nuclear rDNA was

Diversity 2015, 7 364
amplified using the primers ITS1F [34] and ITS4 [35] and the resulting PCR fragment directly sequenced
following the Sanger method. An online homology search was carried out in the NCBI GenBank
nucleotide database by means of the algorithm BLASTn and results confirmed the identity of the isolate,
which was then designated as Trichoderma virens strain Maize9B.
In order to test for cross-species amplification the primers derived from the T. virens genome were
applied to genomic DNA of a commercially available T. harzianum isolate, notably strain T22
(Koppert B.V.: Berkel en Rodenrijs, The Netherlands).
2.3. Culture Conditions
Conserved fungal cultures were retrieved from −80 °C stocks by thawing the tubes on ice, removing
one agar block, rinsing it with sterile water to wash off residual glycerol and placing it on a Petri dish
containing potato dextrose agar (1.5%, pH 5.8). Plates were incubated at 20 °C in a 12/12 h day/night
cycle. Outgrowing mycelia from the agar blocks were either left until sporulation to harvest spores for
root inoculation or—after 4 to 5 days of growth—small agar blocks were taken from the actively growing
front of the mycelium and placed in Erlenmeyer flasks containing 50 mL potato dextrose bouillon (pH
5.8). Cultures were incubated on a rotary shaker (120 rpm) under the same conditions as above and
mycelia for DNA isolation were harvested after 2 to 3 days by filtration.
2.4. Plant Material and Root Inoculation
All root inoculation experiments were performed with tomato plants Solanum lycopersicum L. cv.
MOBIL (Breeding Company: ZKI, Zöldségtermesztési Kutató Intézet, Kecskemét, Hungary). This
variety is a robust cultivar frequently used in Hungary for field production of tomatoes.
Well sporulated plates of T. virens were covered with a layer of 25 mM MgSO4 solution, left to rest
for 20 min and then gently stirred with a glass rod to obtain a dark green spore suspension which was
transferred to fresh tubes. Spore concentrations were determined using an Abbe-Zeiss counting cell
chamber and spore concentrations adjusted to 5 × 10⁷ spores/mL by either diluting or centrifuging
the suspension.
Tomato seeds were germinated in Fruhstorfer Soil Type P (Hawita-Group: Vechta, Germany) and
seedlings (10 to 12 cm in height) were transferred to 2.5 L planting pots containing 2 kg (dry weight) of
local natural farmland topsoil as described above for the maize field in Central Germany. Before
transplanting, the soil was pre-wetted, a planting hole opened in the pots, and 2.5 × 10⁴ spores/g substrate
pipetted into the holes (1 mL of the stock solution). Seedlings were carefully removed from the
germination soil and transplanted into the prepared planting cavity. In the case of co-inoculation with
two different T. virens strains half of the amount of each isolate was pipetted into the same planting
cavity to reach the same spore concentration as single inoculations (2 × 0.5 mL stock solution from each
isolate). Inoculated seedlings were grown under semi-controlled greenhouse conditions. Pots were
watered on demand from the trivet, temperatures ranged from 18 to 26 °C with a day/night cycle of
10/14 h at an illumination intensity of 20,000 Lux. Roots were harvested 42 days after inoculation and
the DNA was immediately isolated as described below.
Diversity 2015, 7 365
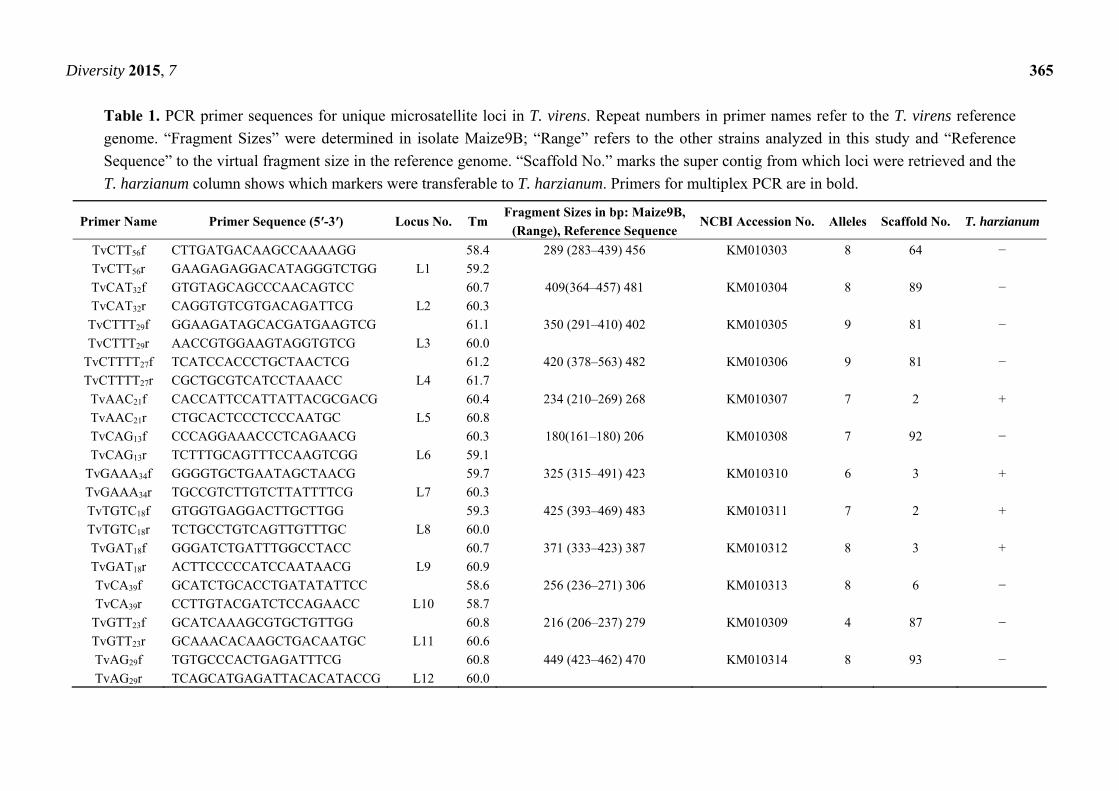
Table 1. PCR primer sequences for unique microsatellite loci in T. virens. Repeat numbers in primer names refer to the T. virens reference
genome. “Fragment Sizes” were determined in isolate Maize9B; “Range” refers to the other strains analyzed in this study and “Reference
Sequence” to the virtual fragment size in the reference genome. “Scaffold No.” marks the super contig from which loci were retrieved and the
T. harzianum column shows which markers were transferable to T. harzianum. Primers for multiplex PCR are in bold.
Primer Name Primer Sequence (5′-3′) Locus No. Tm Fragment Sizes in bp: Maize9B,
(Range), Reference Sequence NCBI Accession No. Alleles Scaffold No. T. harzianum
TvCTT56f CTTGATGACAAGCCAAAAGG 58.4 289 (283–439) 456 KM010303 8 64 −
TvCTT56r GAAGAGAGGACATAGGGTCTGG L1 59.2
TvCAT32f GTGTAGCAGCCCAACAGTCC 60.7 409(364–457) 481 KM010304 8 89 −
TvCAT32r CAGGTGTCGTGACAGATTCG L2 60.3
TvCTTT29f GGAAGATAGCACGATGAAGTCG 61.1 350 (291–410) 402 KM010305 9 81 −
TvCTTT29r AACCGTGGAAGTAGGTGTCG L3 60.0
TvCTTTT27f TCATCCACCCTGCTAACTCG 61.2 420 (378–563) 482 KM010306 9 81 −
TvCTTTT27r CGCTGCGTCATCCTAAACC L4 61.7
TvAAC21f CACCATTCCATTATTACGCGACG 60.4 234 (210–269) 268 KM010307 7 2 +
TvAAC21r CTGCACTCCCTCCCAATGC L5 60.8
TvCAG13f CCCAGGAAACCCTCAGAACG 60.3 180(161–180) 206 KM010308 7 92 −
TvCAG13r TCTTTGCAGTTTCCAAGTCGG L6 59.1
TvGAAA34f GGGGTGCTGAATAGCTAACG 59.7 325 (315–491) 423 KM010310 6 3 +
TvGAAA34r TGCCGTCTTGTCTTATTTTCG L7 60.3
TvTGTC18f GTGGTGAGGACTTGCTTGG 59.3 425 (393–469) 483 KM010311 7 2 +
TvTGTC18r TCTGCCTGTCAGTTGTTTGC L8 60.0
TvGAT18f GGGATCTGATTTGGCCTACC 60.7 371 (333–423) 387 KM010312 8 3 +
TvGAT18r ACTTCCCCCATCCAATAACG L9 60.9
TvCA39f GCATCTGCACCTGATATATTCC 58.6 256 (236–271) 306 KM010313 8 6 −
TvCA39r CCTTGTACGATCTCCAGAACC L10 58.7
TvGTT23f GCATCAAAGCGTGCTGTTGG 60.8 216 (206–237) 279 KM010309 4 87 −
TvGTT23r GCAAACACAAGCTGACAATGC L11 60.6
TvAG29f TGTGCCCACTGAGATTTCG 60.8 449 (423–462) 470 KM010314 8 93 −
TvAG29r TCAGCATGAGATTACACATACCG L12 60.0
Diversity 2015, 7 366
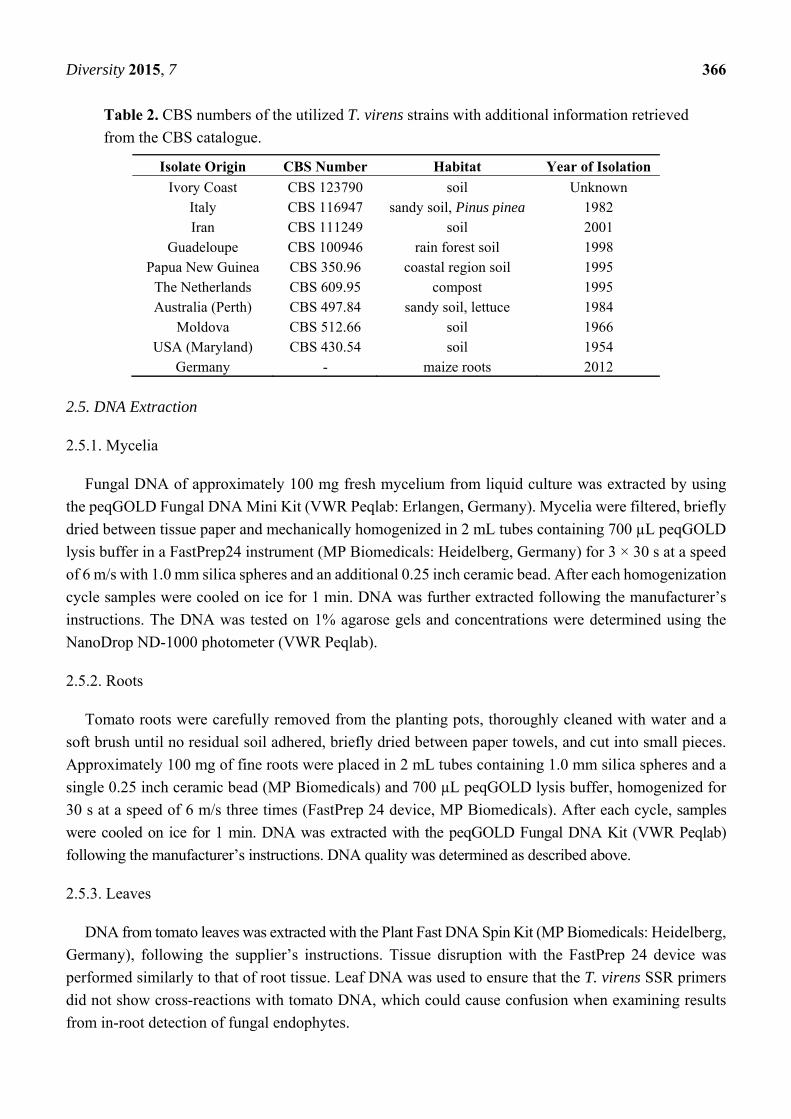
Table 2. CBS numbers of the utilized T. virens strains with additional information retrieved
from the CBS catalogue.
Isolate Origin CBS Number Habitat Year of Isolation
Ivory Coast CBS 123790 soil Unknown Italy CBS 116947 sandy soil, Pinus pinea 1982 Iran CBS 111249 soil 2001
Guadeloupe CBS 100946 rain forest soil 1998 Papua New Guinea CBS 350.96 coastal region soil 1995
The Netherlands CBS 609.95 compost 1995 Australia (Perth) CBS 497.84 sandy soil, lettuce 1984
Moldova CBS 512.66 soil 1966 USA (Maryland) CBS 430.54 soil 1954
Germany - maize roots 2012
2.5. DNA Extraction
2.5.1. Mycelia
Fungal DNA of approximately 100 mg fresh mycelium from liquid culture was extracted by using
the peqGOLD Fungal DNA Mini Kit (VWR Peqlab: Erlangen, Germany). Mycelia were filtered, briefly
dried between tissue paper and mechanically homogenized in 2 mL tubes containing 700 µL peqGOLD
lysis buffer in a FastPrep24 instrument (MP Biomedicals: Heidelberg, Germany) for 3 × 30 s at a speed
of 6 m/s with 1.0 mm silica spheres and an additional 0.25 inch ceramic bead. After each homogenization
cycle samples were cooled on ice for 1 min. DNA was further extracted following the manufacturer’s
instructions. The DNA was tested on 1% agarose gels and concentrations were determined using the
NanoDrop ND-1000 photometer (VWR Peqlab).
2.5.2. Roots
Tomato roots were carefully removed from the planting pots, thoroughly cleaned with water and a
soft brush until no residual soil adhered, briefly dried between paper towels, and cut into small pieces.
Approximately 100 mg of fine roots were placed in 2 mL tubes containing 1.0 mm silica spheres and a
single 0.25 inch ceramic bead (MP Biomedicals) and 700 µL peqGOLD lysis buffer, homogenized for
30 s at a speed of 6 m/s three times (FastPrep 24 device, MP Biomedicals). After each cycle, samples
were cooled on ice for 1 min. DNA was extracted with the peqGOLD Fungal DNA Kit (VWR Peqlab)
following the manufacturer’s instructions. DNA quality was determined as described above.
2.5.3. Leaves
DNA from tomato leaves was extracted with the Plant Fast DNA Spin Kit (MP Biomedicals: Heidelberg,
Germany), following the supplier’s instructions. Tissue disruption with the FastPrep 24 device was
performed similarly to that of root tissue. Leaf DNA was used to ensure that the T. virens SSR primers
did not show cross-reactions with tomato DNA, which could cause confusion when examining results
from in-root detection of fungal endophytes.
Diversity 2015, 7 367
2.6. PCR Conditions
2.6.1. Touchdown PCR
PCR was carried out in 20 µL volumes containing 10 ng of extracted DNA, 0.5 µM of each primer
and 2× Phusion High-Fidelity PCR Master Mix (Thermo Scientific: Schwerte, Germany). Microsatellite
amplification was performed in a thermal cycler (Labcycler, SensoQuest: Göttingen, Germany) with the
following thermal profile: initial denaturation at 96 °C for 3 min, 9 cycles consisting of 95 °C for 20 s,
64 °C for 25 s (−0.5 °C per cycle), 72 °C for 30 s, followed by 31 cycles consisting of 95 °C for 20 s,
60 °C for 25 s, and 72 °C for 30 s. A final elongation step at 72 °C for 5 min completed the protocol.
2.6.2. Multiplex PCR
For multiplex PCR the primer pairs TvCTTTT27, TvGAAA34 and TvCAG13 (0.5 µM each) were used
in a single PCR. PCR conditions and thermal profile conformed to touchdown PCR conditions.
2.6.3. In-Root Detection of Fungal DNA
In-root detection of endophytic T. virens strains was performed with primer pairs TvGAAA34 and
TvCTT56, respectively. PCR conditions and thermal profile were identical to touchdown PCR, except
that 50 ng of total root DNA was used for specific amplification of the fungal DNA fraction.
2.6.4. Real-Time PCR
Real-time PCR was performed using a PikoReal 96 real-time PCR system (Biozym: Hessisch Oldendorf,
Germany). PCR reactions consisted of 0.5 µM forward and reverse primers (TvGAAA34 and TvCTT56,
respectively), 2× Phusion High-Fidelity PCR Master Mix, 1× SybrGreen I Nucleic Acid Stain (Lonza:
Basel, Switzerland), and a dilution series of DNA with a total volume of 20 µL. The following thermal
profile was used: initial denaturation at 96 °C for 3 min, 37 cycles consisting of 95 °C for 20 s, 60 °C for
25 s, and 72 °C for 30 s. After amplification, a melting curve was created by increasing the temperature
from 60 °C to 95 °C in 0.2 °C steps. The results were analyzed using the PikoRealTM 2.2 software.
2.7. Electrophoresis
2.7.1. Agarose Gels
PCR products from microsatellite amplification were checked on 3% agarose gels containing 2.5 µL
Roti-GelStain/50 mL 1× TAE buffer (Carl Roth: Karlsruhe, Germany). Electrophoresis was performed at 6
V/cm for approximately 45 min. Then the gels were documented under UV light (Genius Bio Imaging
System, Syngene: Cambridge, UK).
2.7.2. Polyacrylamide (PAA) Gels
5% Mini-Protean TBE precast PAA gels (Bio-Rad: Munich, Germany) were used to analyze small
molecular weight differences caused by variable microsatellite repeats. Electrophoresis was conducted
Diversity 2015, 7 368
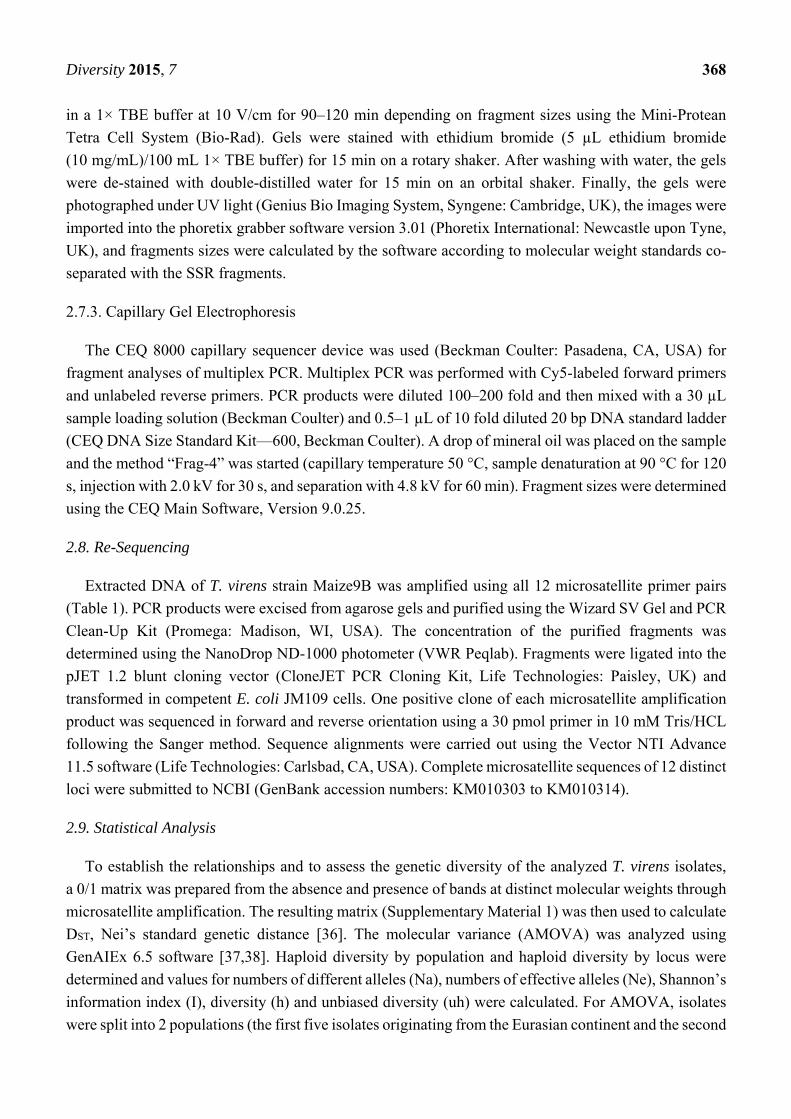
in a 1× TBE buffer at 10 V/cm for 90–120 min depending on fragment sizes using the Mini-Protean
Tetra Cell System (Bio-Rad). Gels were stained with ethidium bromide (5 µL ethidium bromide
(10 mg/mL)/100 mL 1× TBE buffer) for 15 min on a rotary shaker. After washing with water, the gels
were de-stained with double-distilled water for 15 min on an orbital shaker. Finally, the gels were
photographed under UV light (Genius Bio Imaging System, Syngene: Cambridge, UK), the images were
imported into the phoretix grabber software version 3.01 (Phoretix International: Newcastle upon Tyne,
UK), and fragments sizes were calculated by the software according to molecular weight standards co-
separated with the SSR fragments.
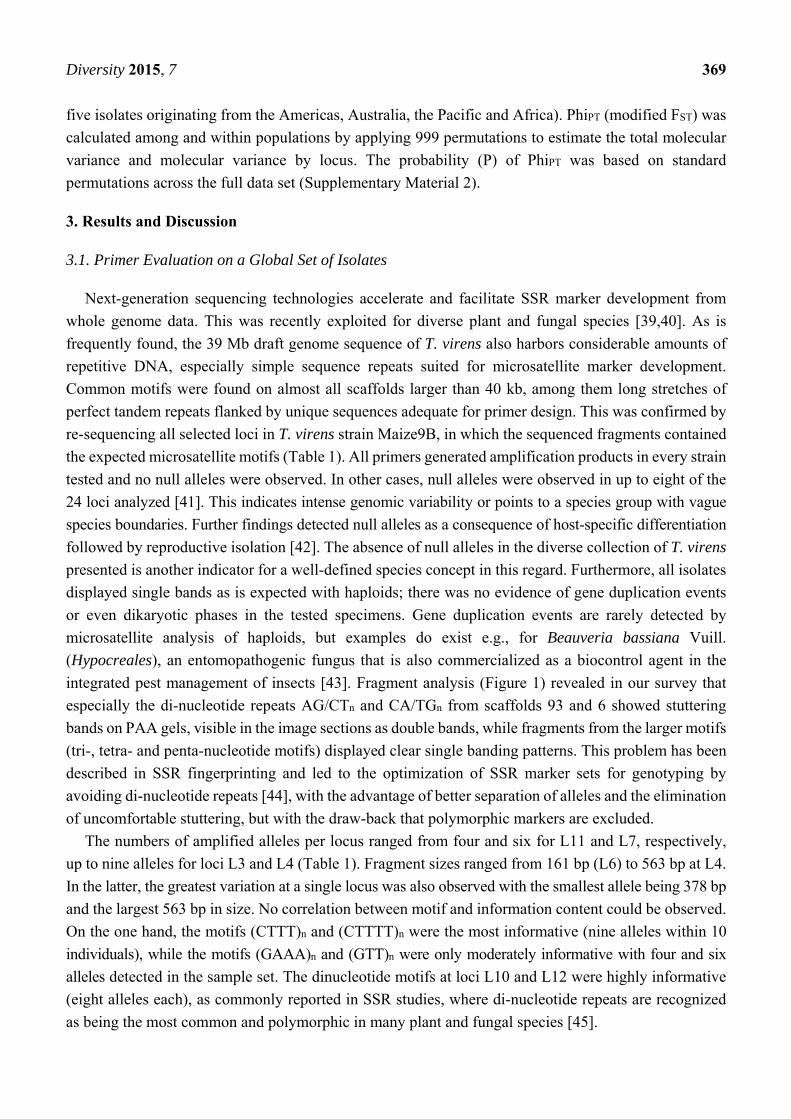
2.7.3. Capillary Gel Electrophoresis
The CEQ 8000 capillary sequencer device was used (Beckman Coulter: Pasadena, CA, USA) for
fragment analyses of multiplex PCR. Multiplex PCR was performed with Cy5-labeled forward primers
and unlabeled reverse primers. PCR products were diluted 100–200 fold and then mixed with a 30 µL
sample loading solution (Beckman Coulter) and 0.5–1 µL of 10 fold diluted 20 bp DNA standard ladder
(CEQ DNA Size Standard Kit—600, Beckman Coulter). A drop of mineral oil was placed on the sample
and the method “Frag-4” was started (capillary temperature 50 °C, sample denaturation at 90 °C for 120
s, injection with 2.0 kV for 30 s, and separation with 4.8 kV for 60 min). Fragment sizes were determined
using the CEQ Main Software, Version 9.0.25.
2.8. Re-Sequencing
Extracted DNA of T. virens strain Maize9B was amplified using all 12 microsatellite primer pairs
(Table 1). PCR products were excised from agarose gels and purified using the Wizard SV Gel and PCR
Clean-Up Kit (Promega: Madison, WI, USA). The concentration of the purified fragments was
determined using the NanoDrop ND-1000 photometer (VWR Peqlab). Fragments were ligated into the
pJET 1.2 blunt cloning vector (CloneJET PCR Cloning Kit, Life Technologies: Paisley, UK) and
transformed in competent E. coli JM109 cells. One positive clone of each microsatellite amplification
product was sequenced in forward and reverse orientation using a 30 pmol primer in 10 mM Tris/HCL
following the Sanger method. Sequence alignments were carried out using the Vector NTI Advance
11.5 software (Life Technologies: Carlsbad, CA, USA). Complete microsatellite sequences of 12 distinct
loci were submitted to NCBI (GenBank accession numbers: KM010303 to KM010314).
2.9. Statistical Analysis
To establish the relationships and to assess the genetic diversity of the analyzed T. virens isolates,
a 0/1 matrix was prepared from the absence and presence of bands at distinct molecular weights through
microsatellite amplification. The resulting matrix (Supplementary Material 1) was then used to calculate
DST, Nei’s standard genetic distance [36]. The molecular variance (AMOVA) was analyzed using
GenAIEx 6.5 software [37,38]. Haploid diversity by population and haploid diversity by locus were
determined and values for numbers of different alleles (Na), numbers of effective alleles (Ne), Shannon’s
information index (I), diversity (h) and unbiased diversity (uh) were calculated. For AMOVA, isolates
were split into 2 populations (the first five isolates originating from the Eurasian continent and the second
Diversity 2015, 7 369
five isolates originating from the Americas, Australia, the Pacific and Africa). PhiPT (modified FST) was
calculated among and within populations by applying 999 permutations to estimate the total molecular
variance and molecular variance by locus. The probability (P) of PhiPT was based on standard
permutations across the full data set (Supplementary Material 2).
3. Results and Discussion
3.1. Primer Evaluation on a Global Set of Isolates
Next-generation sequencing technologies accelerate and facilitate SSR marker development from
whole genome data. This was recently exploited for diverse plant and fungal species [39,40]. As is
frequently found, the 39 Mb draft genome sequence of T. virens also harbors considerable amounts of
repetitive DNA, especially simple sequence repeats suited for microsatellite marker development.
Common motifs were found on almost all scaffolds larger than 40 kb, among them long stretches of
perfect tandem repeats flanked by unique sequences adequate for primer design. This was confirmed by
re-sequencing all selected loci in T. virens strain Maize9B, in which the sequenced fragments contained
the expected microsatellite motifs (Table 1). All primers generated amplification products in every strain
tested and no null alleles were observed. In other cases, null alleles were observed in up to eight of the
24 loci analyzed [41]. This indicates intense genomic variability or points to a species group with vague
species boundaries. Further findings detected null alleles as a consequence of host-specific differentiation
followed by reproductive isolation [42]. The absence of null alleles in the diverse collection of T. virens
presented is another indicator for a well-defined species concept in this regard. Furthermore, all isolates
displayed single bands as is expected with haploids; there was no evidence of gene duplication events
or even dikaryotic phases in the tested specimens. Gene duplication events are rarely detected by
microsatellite analysis of haploids, but examples do exist e.g., for Beauveria bassiana Vuill.
(Hypocreales), an entomopathogenic fungus that is also commercialized as a biocontrol agent in the
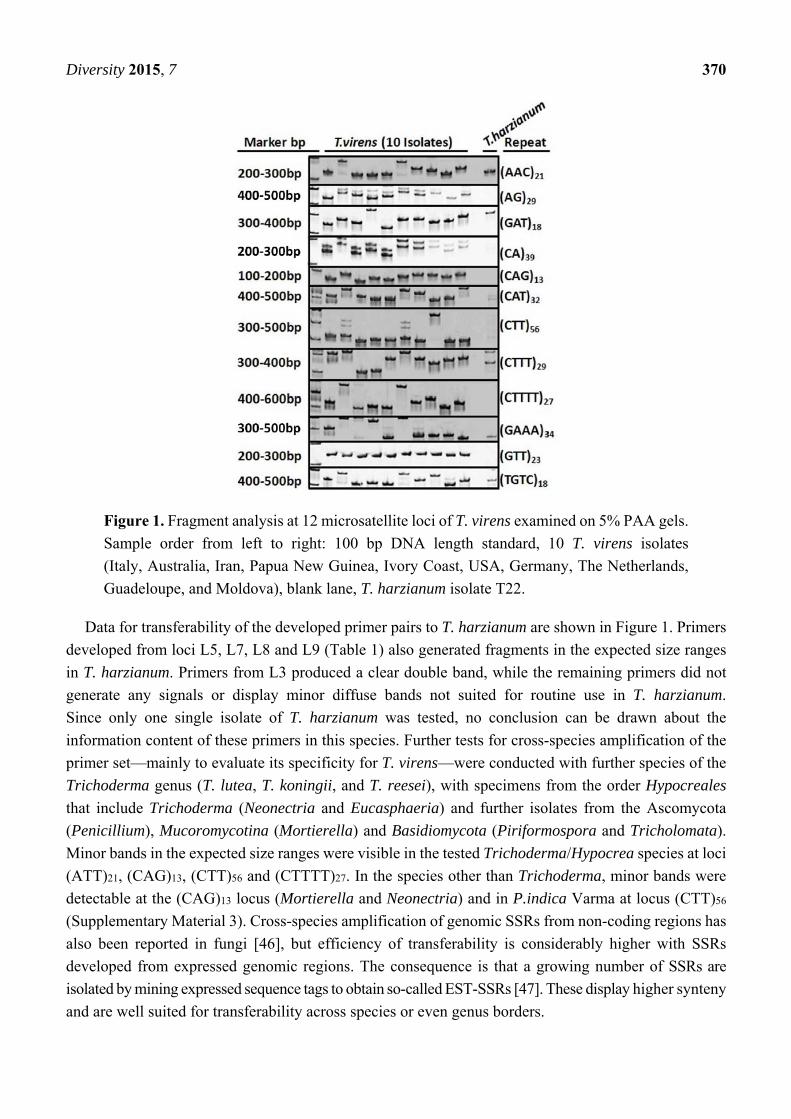
integrated pest management of insects [43]. Fragment analysis (Figure 1) revealed in our survey that
especially the di-nucleotide repeats AG/CTn and CA/TGn from scaffolds 93 and 6 showed stuttering
bands on PAA gels, visible in the image sections as double bands, while fragments from the larger motifs
(tri-, tetra- and penta-nucleotide motifs) displayed clear single banding patterns. This problem has been
described in SSR fingerprinting and led to the optimization of SSR marker sets for genotyping by
avoiding di-nucleotide repeats [44], with the advantage of better separation of alleles and the elimination
of uncomfortable stuttering, but with the draw-back that polymorphic markers are excluded.
The numbers of amplified alleles per locus ranged from four and six for L11 and L7, respectively,
up to nine alleles for loci L3 and L4 (Table 1). Fragment sizes ranged from 161 bp (L6) to 563 bp at L4.
In the latter, the greatest variation at a single locus was also observed with the smallest allele being 378 bp
and the largest 563 bp in size. No correlation between motif and information content could be observed.
On the one hand, the motifs (CTTT)n and (CTTTT)n were the most informative (nine alleles within 10
individuals), while the motifs (GAAA)n and (GTT)n were only moderately informative with four and six
alleles detected in the sample set. The dinucleotide motifs at loci L10 and L12 were highly informative
(eight alleles each), as commonly reported in SSR studies, where di-nucleotide repeats are recognized
as being the most common and polymorphic in many plant and fungal species [45].
Diversity 2015, 7 370
Figure 1. Fragment analysis at 12 microsatellite loci of T. virens examined on 5% PAA gels.
Sample order from left to right: 100 bp DNA length standard, 10 T. virens isolates
(Italy, Australia, Iran, Papua New Guinea, Ivory Coast, USA, Germany, The Netherlands,
Guadeloupe, and Moldova), blank lane, T. harzianum isolate T22.
Data for transferability of the developed primer pairs to T. harzianum are shown in Figure 1. Primers
developed from loci L5, L7, L8 and L9 (Table 1) also generated fragments in the expected size ranges
in T. harzianum. Primers from L3 produced a clear double band, while the remaining primers did not
generate any signals or display minor diffuse bands not suited for routine use in T. harzianum.
Since only one single isolate of T. harzianum was tested, no conclusion can be drawn about the
information content of these primers in this species. Further tests for cross-species amplification of the
primer set—mainly to evaluate its specificity for T. virens—were conducted with further species of the
Trichoderma genus (T. lutea, T. koningii, and T. reesei), with specimens from the order Hypocreales
that include Trichoderma (Neonectria and Eucasphaeria) and further isolates from the Ascomycota
(Penicillium), Mucoromycotina (Mortierella) and Basidiomycota (Piriformospora and Tricholomata).
Minor bands in the expected size ranges were visible in the tested Trichoderma/Hypocrea species at loci
(ATT)21, (CAG)13, (CTT)56 and (CTTTT)27. In the species other than Trichoderma, minor bands were
detectable at the (CAG)13 locus (Mortierella and Neonectria) and in P.indica Varma at locus (CTT)56
(Supplementary Material 3). Cross-species amplification of genomic SSRs from non-coding regions has
also been reported in fungi [46], but efficiency of transferability is considerably higher with SSRs
developed from expressed genomic regions. The consequence is that a growing number of SSRs are
isolated by mining expressed sequence tags to obtain so-called EST-SSRs [47]. These display higher synteny
and are well suited for transferability across species or even genus borders.
Diversity 2015, 7 371
No considerable bands were observed in control PCRs solely containing leaf DNA from tomato
Solanum lycopersicum L. cv. MOBIL. This indicates that there are no foreseeable difficulties in verifying
root colonization of endophytic T. virens strains in this tomato variety.
3.2. Data Analysis
Nei’s genetic distance was calculated from 89 SSR alleles (average 7.42 alleles per locus) converted
into a 0/1 matrix (Supplementary Material 1). Calculations revealed that isolates from the USA and
Australia differed in only eight closely related alleles, as estimated from the fragment sizes. This is
contrary to expectations due to the wide geographical separation (Maryland, USA and Western
Australia) and over 30 years of diverging sampling times (Table 2). Since both isolates were obtained
from the same strain collection, a mislabeling cannot be excluded. DNA fingerprinting techniques are
frequently used to verify strain and germplasm collections and successfully discover mislabeling or
identify duplicates [48]. Pairwise genetic distances within the T. virens set ranged from 0.18 to 0.27
(Table 3), with the least genetic distance between the isolates from the USA and Australia (0.18).
AMOVA results indicated low regional differentiation in the sample set. Based on 68 best differentiable
alleles (Supplementary Material 2) and by dividing the sample set into two populations (five isolates
from the Eurasian continent and five isolates from the rest of the world) analysis revealed that most
molecular variance occurred within (96.92%), rather than between, populations (3.08%). This is quite a
common observation in ubiquitously existing species and especially in sexually reproducing fungi with
airborne ascospores [49,50]. Differentiation between populations in our study was detected at only four
of the twelve loci (Table 1; L5, L6, L7 and L10) ranging between 2% and 15%.
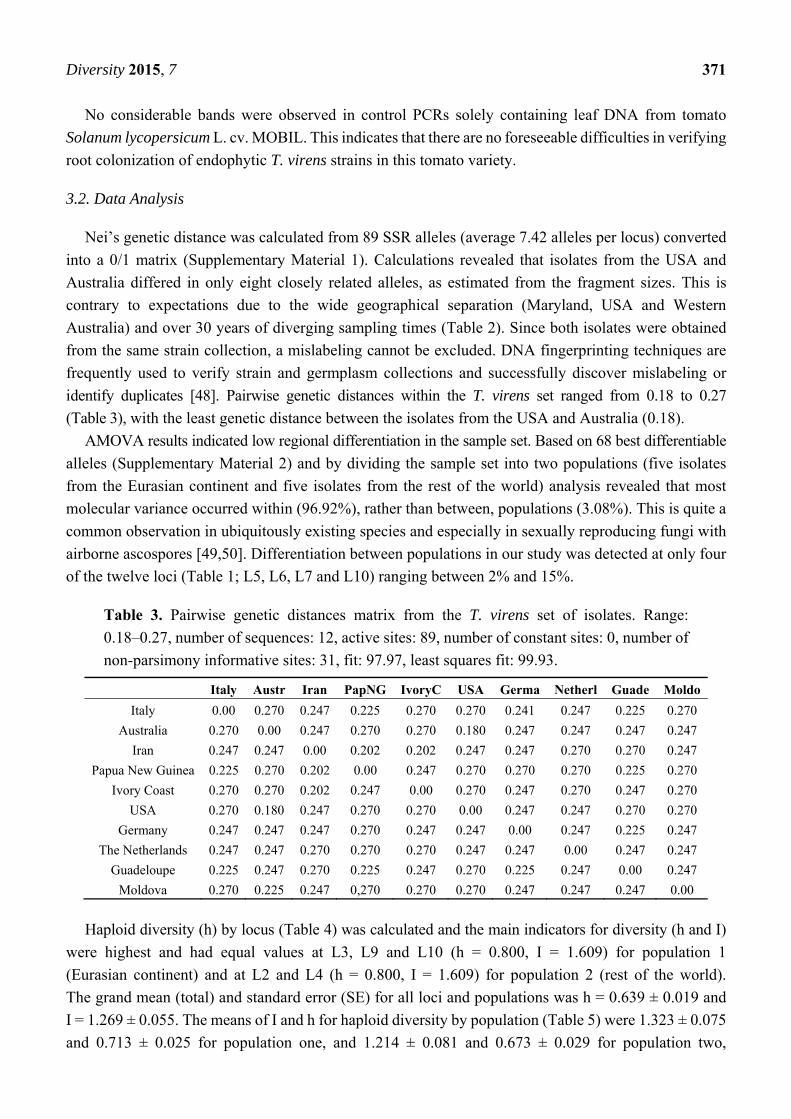
Table 3. Pairwise genetic distances matrix from the T. virens set of isolates. Range:
0.18–0.27, number of sequences: 12, active sites: 89, number of constant sites: 0, number of
non-parsimony informative sites: 31, fit: 97.97, least squares fit: 99.93.
Italy Austr Iran PapNG IvoryC USA Germa Netherl Guade Moldo
Italy 0.00 0.270 0.247 0.225 0.270 0.270 0.241 0.247 0.225 0.270
Australia 0.270 0.00 0.247 0.270 0.270 0.180 0.247 0.247 0.247 0.247
Iran 0.247 0.247 0.00 0.202 0.202 0.247 0.247 0.270 0.270 0.247
Papua New Guinea 0.225 0.270 0.202 0.00 0.247 0.270 0.270 0.270 0.225 0.270
Ivory Coast 0.270 0.270 0.202 0.247 0.00 0.270 0.247 0.270 0.247 0.270
USA 0.270 0.180 0.247 0.270 0.270 0.00 0.247 0.247 0.270 0.270
Germany 0.247 0.247 0.247 0.270 0.247 0.247 0.00 0.247 0.225 0.247
The Netherlands 0.247 0.247 0.270 0.270 0.270 0.247 0.247 0.00 0.247 0.247
Guadeloupe 0.225 0.247 0.270 0.225 0.247 0.270 0.225 0.247 0.00 0.247
Moldova 0.270 0.225 0.247 0,270 0.270 0.270 0.247 0.247 0.247 0.00
Haploid diversity (h) by locus (Table 4) was calculated and the main indicators for diversity (h and I)
were highest and had equal values at L3, L9 and L10 (h = 0.800, I = 1.609) for population 1
(Eurasian continent) and at L2 and L4 (h = 0.800, I = 1.609) for population 2 (rest of the world).
The grand mean (total) and standard error (SE) for all loci and populations was h = 0.639 ± 0.019 and
I = 1.269 ± 0.055. The means of I and h for haploid diversity by population (Table 5) were 1.323 ± 0.075
and 0.713 ± 0.025 for population one, and 1.214 ± 0.081 and 0.673 ± 0.029 for population two,
Diversity 2015, 7 372
respectively. This indicates that the isolates from the Eurasian continent were more diverse than the
isolates from population 2. Based on the mean for all loci and populations, loci L3 and L4 were the most
informative with h = 0.760 ± 0.04 and I = 1.471 ± 0.139. This is also indicated by the high values for Na
and Ne at L3 and L4, where Ne (4.286 ± 0.714) approximated Na (4.5 ± 0.5, Table 4). Haploid diversity
values in a range of approximately 0.75 account for high genetic diversity in the T. virens collection,
although in some cases h-values higher than 0.9 were found, for instance in a large collection of
Aspergillus flavus Link strains (87 isolates) that were checked at 29 EST-SSR loci with up to 24 alleles
per locus and h-values as high as 0.91 [51].
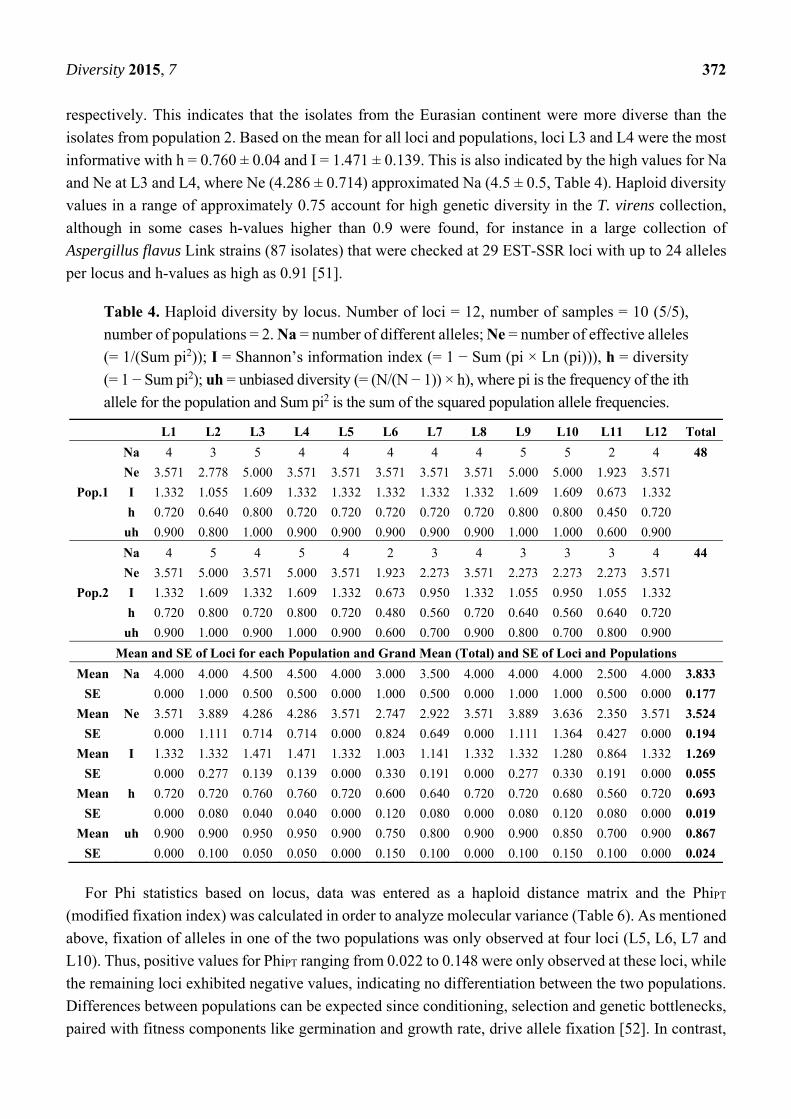
Table 4. Haploid diversity by locus. Number of loci = 12, number of samples = 10 (5/5),
number of populations = 2. Na = number of different alleles; Ne = number of effective alleles
(= 1/(Sum pi2)); I = Shannon’s information index (= 1 − Sum (pi × Ln (pi))), h = diversity
(= 1 − Sum pi2); uh = unbiased diversity (= (N/(N − 1)) × h), where pi is the frequency of the ith
allele for the population and Sum pi2 is the sum of the squared population allele frequencies.
L1 L2 L3 L4 L5 L6 L7 L8 L9 L10 L11 L12 Total
Pop.1
Na 4 3 5 4 4 4 4 4 5 5 2 4 48
Ne 3.571 2.778 5.000 3.571 3.571 3.571 3.571 3.571 5.000 5.000 1.923 3.571
I 1.332 1.055 1.609 1.332 1.332 1.332 1.332 1.332 1.609 1.609 0.673 1.332
h 0.720 0.640 0.800 0.720 0.720 0.720 0.720 0.720 0.800 0.800 0.450 0.720
uh 0.900 0.800 1.000 0.900 0.900 0.900 0.900 0.900 1.000 1.000 0.600 0.900
Pop.2
Na 4 5 4 5 4 2 3 4 3 3 3 4 44
Ne 3.571 5.000 3.571 5.000 3.571 1.923 2.273 3.571 2.273 2.273 2.273 3.571
I 1.332 1.609 1.332 1.609 1.332 0.673 0.950 1.332 1.055 0.950 1.055 1.332
h 0.720 0.800 0.720 0.800 0.720 0.480 0.560 0.720 0.640 0.560 0.640 0.720
uh 0.900 1.000 0.900 1.000 0.900 0.600 0.700 0.900 0.800 0.700 0.800 0.900
Mean and SE of Loci for each Population and Grand Mean (Total) and SE of Loci and Populations
Mean Na 4.000 4.000 4.500 4.500 4.000 3.000 3.500 4.000 4.000 4.000 2.500 4.000 3.833
SE 0.000 1.000 0.500 0.500 0.000 1.000 0.500 0.000 1.000 1.000 0.500 0.000 0.177
Mean Ne 3.571 3.889 4.286 4.286 3.571 2.747 2.922 3.571 3.889 3.636 2.350 3.571 3.524
SE 0.000 1.111 0.714 0.714 0.000 0.824 0.649 0.000 1.111 1.364 0.427 0.000 0.194
Mean I 1.332 1.332 1.471 1.471 1.332 1.003 1.141 1.332 1.332 1.280 0.864 1.332 1.269
SE 0.000 0.277 0.139 0.139 0.000 0.330 0.191 0.000 0.277 0.330 0.191 0.000 0.055
Mean h 0.720 0.720 0.760 0.760 0.720 0.600 0.640 0.720 0.720 0.680 0.560 0.720 0.693
SE 0.000 0.080 0.040 0.040 0.000 0.120 0.080 0.000 0.080 0.120 0.080 0.000 0.019
Mean uh 0.900 0.900 0.950 0.950 0.900 0.750 0.800 0.900 0.900 0.850 0.700 0.900 0.867
SE 0.000 0.100 0.050 0.050 0.000 0.150 0.100 0.000 0.100 0.150 0.100 0.000 0.024
For Phi statistics based on locus, data was entered as a haploid distance matrix and the PhiPT
(modified fixation index) was calculated in order to analyze molecular variance (Table 6). As mentioned
above, fixation of alleles in one of the two populations was only observed at four loci (L5, L6, L7 and
L10). Thus, positive values for PhiPT ranging from 0.022 to 0.148 were only observed at these loci, while
the remaining loci exhibited negative values, indicating no differentiation between the two populations.
Differences between populations can be expected since conditioning, selection and genetic bottlenecks,
paired with fitness components like germination and growth rate, drive allele fixation [52]. In contrast,
Diversity 2015, 7 373
fluctuation of spores in a global meta-population (e.g., transport of goods in a globalized world) leads to
repetitive founder effects that counteract selection, decrease fixation probability and influence time to
fixation, where distribution and re-distribution of spores acts as a regional mixing force [53]. This is
congruent with the conclusion that most genetic variance in this study was detected within, rather than
between, populations. Nevertheless, values for probability of PhiPT ranged from 0.129 to 1.0 and,
consequently, were not significant at the p < 0.05 level. This is most probably due to the small sample
size and the rather artificial division of the sample set into two populations. Significant results are
achieved, especially in large sample sets, that were collected following a strict sampling strategy [54],
while non-significant results are mainly restricted to studies where only small sample sets were available
or short geographic distances were examined [55,56]. Although we are aware of the small sample size,
we are convinced that a marker survey on a diverse set of isolates provides initial insights into the
feasibility of markers and the possibility of detecting polymorphisms and, thus, genetic diversity within
the species T. virens.
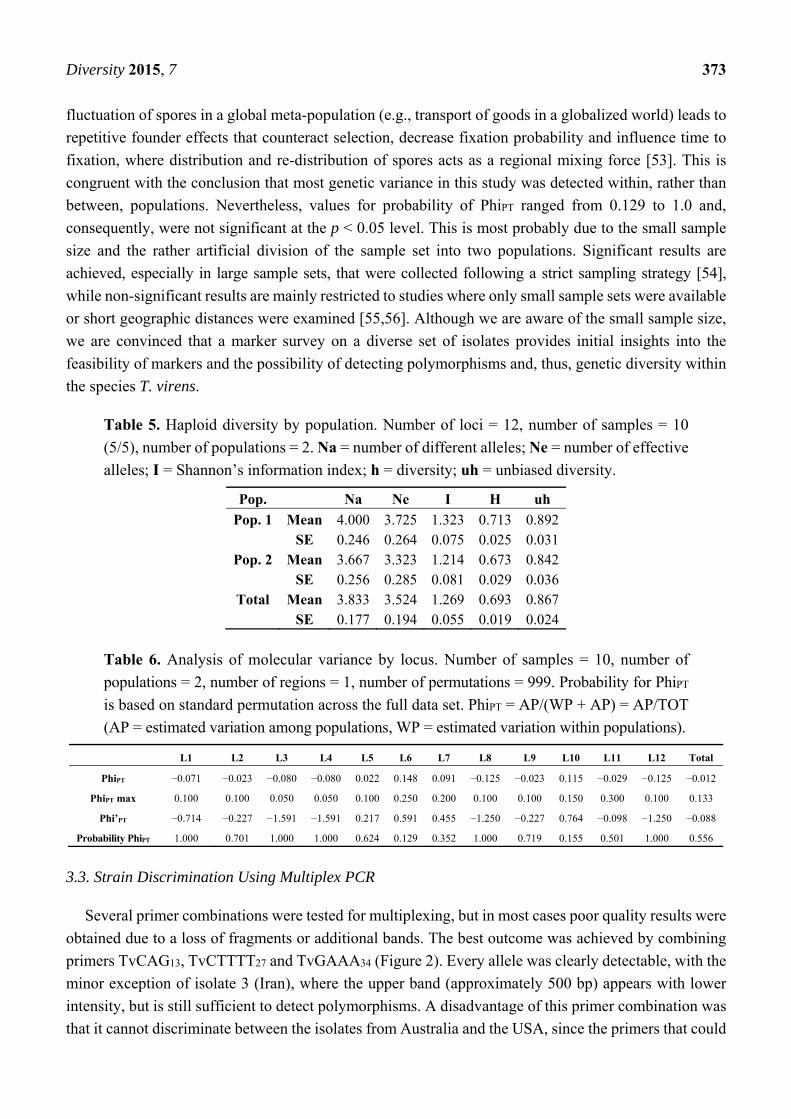
Table 5. Haploid diversity by population. Number of loci = 12, number of samples = 10
(5/5), number of populations = 2. Na = number of different alleles; Ne = number of effective
alleles; I = Shannon’s information index; h = diversity; uh = unbiased diversity.
Pop. Na Ne I H uh
Pop. 1 Mean 4.000 3.725 1.323 0.713 0.892 SE 0.246 0.264 0.075 0.025 0.031
Pop. 2 Mean 3.667 3.323 1.214 0.673 0.842 SE 0.256 0.285 0.081 0.029 0.036
Total Mean 3.833 3.524 1.269 0.693 0.867 SE 0.177 0.194 0.055 0.019 0.024
Table 6. Analysis of molecular variance by locus. Number of samples = 10, number of
populations = 2, number of regions = 1, number of permutations = 999. Probability for PhiPT
is based on standard permutation across the full data set. PhiPT = AP/(WP + AP) = AP/TOT
(AP = estimated variation among populations, WP = estimated variation within populations).
L1 L2 L3 L4 L5 L6 L7 L8 L9 L10 L11 L12 Total
PhiPT −0.071 −0.023 −0.080 −0.080 0.022 0.148 0.091 −0.125 −0.023 0.115 −0.029 −0.125 −0.012
PhiPT max 0.100 0.100 0.050 0.050 0.100 0.250 0.200 0.100 0.100 0.150 0.300 0.100 0.133
Phi’PT −0.714 −0.227 −1.591 −1.591 0.217 0.591 0.455 −1.250 −0.227 0.764 −0.098 −1.250 −0.088
Probability PhiPT 1.000 0.701 1.000 1.000 0.624 0.129 0.352 1.000 0.719 0.155 0.501 1.000 0.556
3.3. Strain Discrimination Using Multiplex PCR
Several primer combinations were tested for multiplexing, but in most cases poor quality results were
obtained due to a loss of fragments or additional bands. The best outcome was achieved by combining
primers TvCAG13, TvCTTTT27 and TvGAAA34 (Figure 2). Every allele was clearly detectable, with the
minor exception of isolate 3 (Iran), where the upper band (approximately 500 bp) appears with lower
intensity, but is still sufficient to detect polymorphisms. A disadvantage of this primer combination was
that it cannot discriminate between the isolates from Australia and the USA, since the primers that could
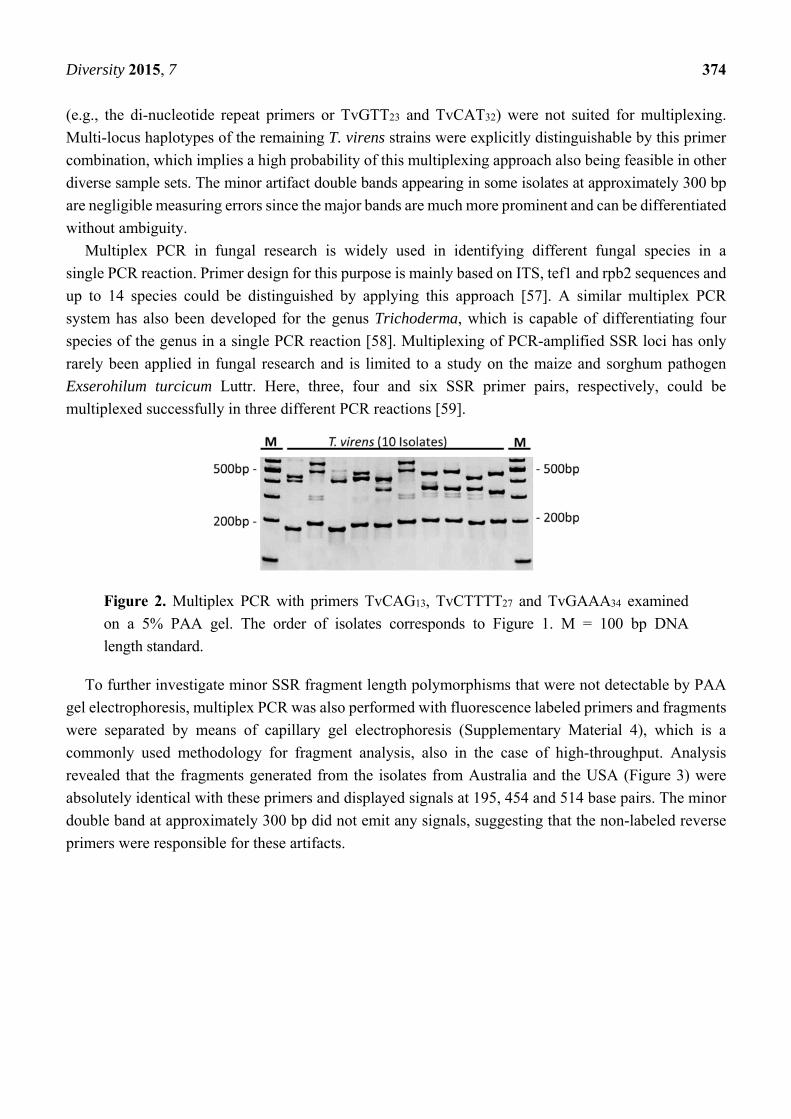
Diversity 2015, 7 374
(e.g., the di-nucleotide repeat primers or TvGTT23 and TvCAT32) were not suited for multiplexing.
Multi-locus haplotypes of the remaining T. virens strains were explicitly distinguishable by this primer
combination, which implies a high probability of this multiplexing approach also being feasible in other
diverse sample sets. The minor artifact double bands appearing in some isolates at approximately 300 bp
are negligible measuring errors since the major bands are much more prominent and can be differentiated
without ambiguity.
Multiplex PCR in fungal research is widely used in identifying different fungal species in a
single PCR reaction. Primer design for this purpose is mainly based on ITS, tef1 and rpb2 sequences and
up to 14 species could be distinguished by applying this approach [57]. A similar multiplex PCR
system has also been developed for the genus Trichoderma, which is capable of differentiating four
species of the genus in a single PCR reaction [58]. Multiplexing of PCR-amplified SSR loci has only
rarely been applied in fungal research and is limited to a study on the maize and sorghum pathogen
Exserohilum turcicum Luttr. Here, three, four and six SSR primer pairs, respectively, could be
multiplexed successfully in three different PCR reactions [59].
Figure 2. Multiplex PCR with primers TvCAG13, TvCTTTT27 and TvGAAA34 examined
on a 5% PAA gel. The order of isolates corresponds to Figure 1. M = 100 bp DNA
length standard.
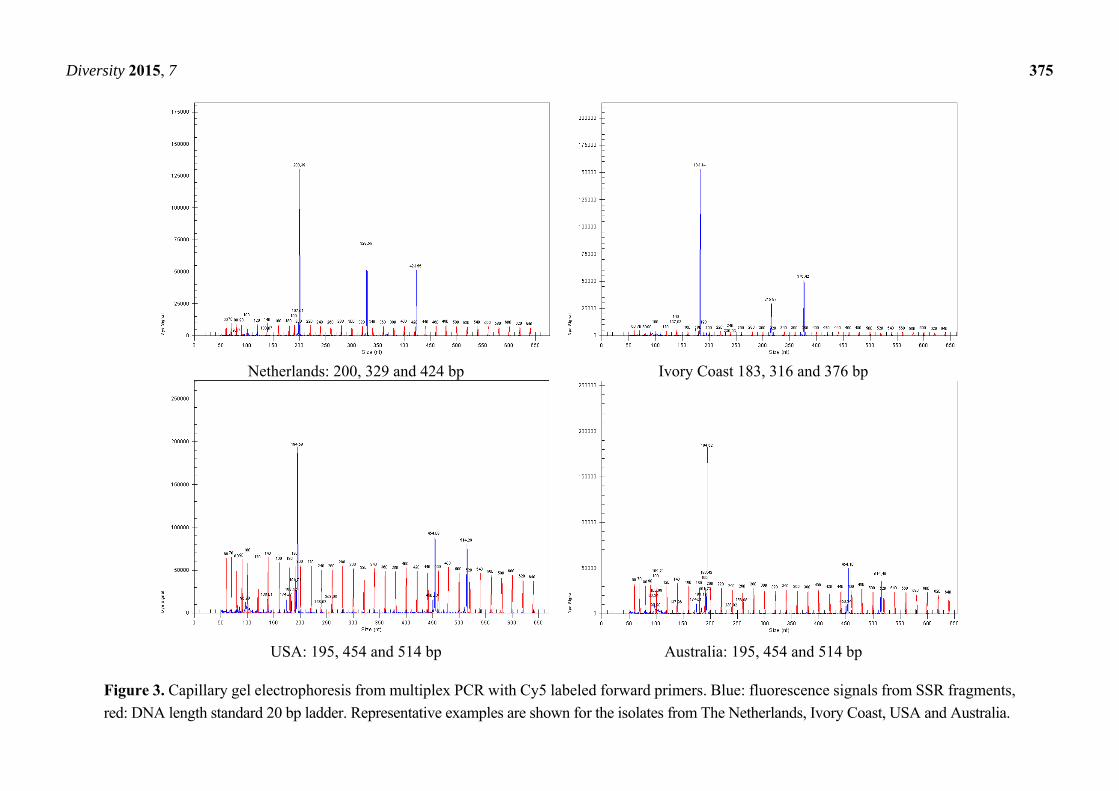
To further investigate minor SSR fragment length polymorphisms that were not detectable by PAA
gel electrophoresis, multiplex PCR was also performed with fluorescence labeled primers and fragments
were separated by means of capillary gel electrophoresis (Supplementary Material 4), which is a
commonly used methodology for fragment analysis, also in the case of high-throughput. Analysis
revealed that the fragments generated from the isolates from Australia and the USA (Figure 3) were
absolutely identical with these primers and displayed signals at 195, 454 and 514 base pairs. The minor
double band at approximately 300 bp did not emit any signals, suggesting that the non-labeled reverse
primers were responsible for these artifacts.
Diversity 2015, 7 375
Netherlands: 200, 329 and 424 bp Ivory Coast 183, 316 and 376 bp
USA: 195, 454 and 514 bp Australia: 195, 454 and 514 bp
Figure 3. Capillary gel electrophoresis from multiplex PCR with Cy5 labeled forward primers. Blue: fluorescence signals from SSR fragments,
red: DNA length standard 20 bp ladder. Representative examples are shown for the isolates from The Netherlands, Ivory Coast, USA and Australia.

Diversity 2015, 7 376
3.4. Parallel In-Root Detection of Endophytic T. virens Strains
In order to test the applicability of the developed markers in tracing the endophytic strains of
T. virens in root tissue and—even more importantly—in the in-root tracing of different strains according
to the molecular weight of their SSR fragments, single tomato plants were grown in pots containing
non-sterilized field soil, cultivated in the greenhouse, inoculated with different strains and
double-inoculated with two distinct strains as described above. Roots were harvested 42 days after
inoculation. Tomato plants showed healthy growth and no evidence of pathogenic effects or additional
stress. Strains for inoculation were chosen according to the fragment sizes they generated with certain
markers. Suitable combinations were found with the isolates from Germany and Australia and detected
with markers TvCTT56 and TvGAAA34. These two markers displayed a small molecular weight
difference in the two isolates at the CTT/AAGn locus and a larger difference at the GAAA/TTTCn locus,
as seen in Figure 4. As tested in advance, no signal was detectable by using pure tomato DNA.
Consequently, from tomato root DNA, no cross-reaction with the T. virens primers occurred from the
host plant. For inoculated roots the best results were obtained at the CTT/AAGn locus where single
inoculations and double inoculations generated clear bands. This revealed that both strains are able to
simultaneously enter root tissue of a single plant and suggests that neither interdependent inhibition
among the two fungi [60] nor effective defense reactions, enhanced local resistance possibly mediated
by H2O2, nor reactive oxygen species occur from the host plant [61].
Figure 4. 5% PAA gel with samples from single and double root inoculation.
Marker A = TvCTT56; marker B = TvGAAA34; strain A = Australia; strain B = Germany,
M = DNA length standard 100 bp ladder. Dual root colonization by both strains could be
confirmed in the middle lanes.
Up-to-date studies on co-colonization of plant roots are restricted to reports about dual colonization
by different fungal species or by fungal and bacterial species, e.g., dark septate endophyte (DSE) fungi
and ectomycorrhizal fungi in trees [62], DSE fungi and arbuscular mycorrhizal (AM) fungi in
Medicago sativa L. [63], Piriformospora indica and Trichoderma harzianum in Piper nigrum L. [64],
AM and DSE fungi in grasses [65] and the fungus Acremonium strictum Gams and bacterium
Diversity 2015, 7 377
Acinetobacter sp. in the Asteraceae species [66]. To the best of our knowledge, this is the first report on
the detection of dual root colonization by different strains of the same fungal species as characterized by
their molecular fingerprint.
Detailed analysis of the gel indicates a clear-cut result for marker (CTT)56, where no additional bands
were observed at all. Marker (GAAA)34 produced some extra minor bands in the inoculated root samples
with the major bands clearly distinguishable. Single inoculation results appear as expected with both
markers and strains, while with double inoculation, bands from the Australian isolate appear to be less
intensive than the bands from the German isolate. This was observed in the case of both markers. Taking
this as a semi-quantitative result, root colonization efficiency seems to be higher in the German than in
the Australian isolate.
3.5. Determination of Strain-Specific Root Colonization Efficiencies by Quantitative PCR
To further investigate the root colonization abilities of the two isolates primer pairs, TvGAAA34 and
TvCTT56 were applied to a qPCR Sybr Green assay with the same root DNA as above. In a test
(performed as duplicates) including dilution series with pure fungus DNA from the isolates from
Australia and Germany (R2-values ranged from 0.9963 to 0.9997) differences in the amounts of the
fungal DNA fractions could be detected in the root samples (Supplementary Material 5). The utilization
of qPCR Sybr Green assays to quantify root endophytes with SSR primers has been demonstrated before
using the Alternaria brassicicola Schwein./Alternaria brassicae Sacc. system [67]. In the present study,
single inoculation with the isolate from Germany yielded 0.027 and 0.032 pg fungal DNA per ng root
DNA in a repeated determination, while the isolate from Australia yielded only 0.0091 and 0.0092 pg/ng
root DNA with single inoculation. This confirmed the semi-quantitative results from conventional PCR
and PAA gel electrophoresis (Figure 4). The results from double inoculation yielded 0.012 and 0.014 pg
fungal DNA per ng root DNA in the repeat determination, which points to a slightly complementary
inhibiting effect since approximately 0.019 pg/ng would have been expected in the case of equal
colonization behavior as in single inoculations.
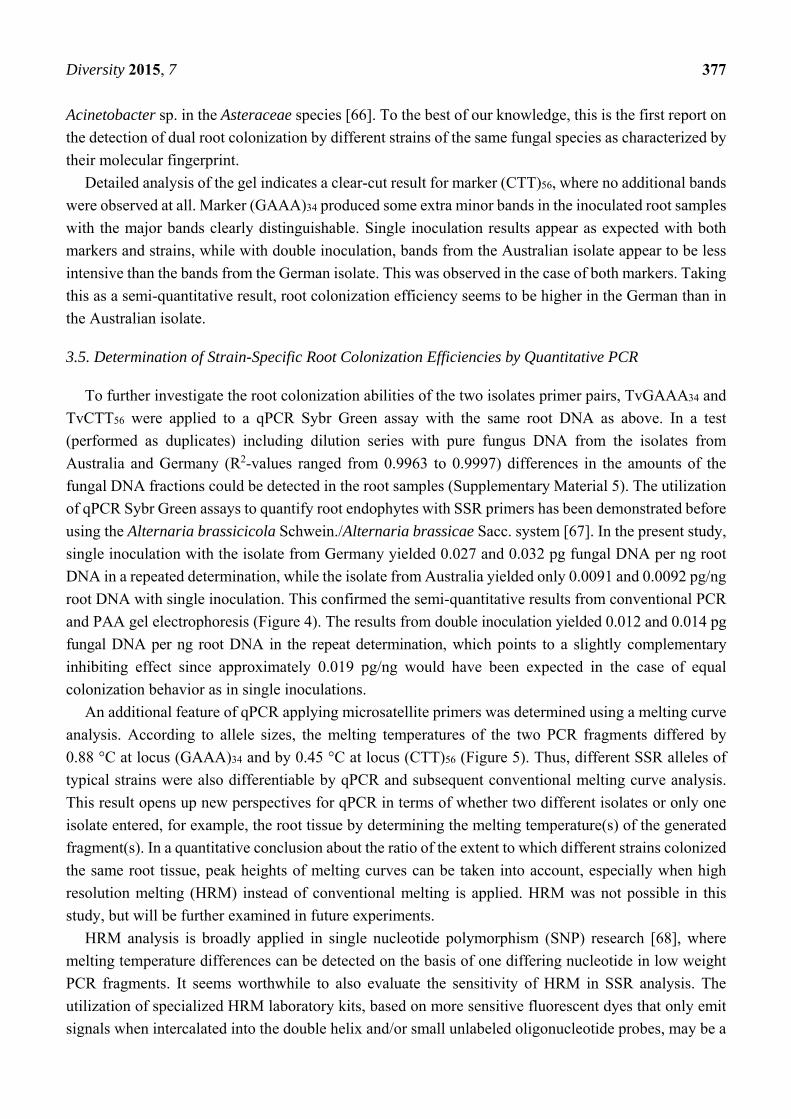
An additional feature of qPCR applying microsatellite primers was determined using a melting curve
analysis. According to allele sizes, the melting temperatures of the two PCR fragments differed by
0.88 °C at locus (GAAA)34 and by 0.45 °C at locus (CTT)56 (Figure 5). Thus, different SSR alleles of
typical strains were also differentiable by qPCR and subsequent conventional melting curve analysis.
This result opens up new perspectives for qPCR in terms of whether two different isolates or only one
isolate entered, for example, the root tissue by determining the melting temperature(s) of the generated
fragment(s). In a quantitative conclusion about the ratio of the extent to which different strains colonized
the same root tissue, peak heights of melting curves can be taken into account, especially when high
resolution melting (HRM) instead of conventional melting is applied. HRM was not possible in this
study, but will be further examined in future experiments.
HRM analysis is broadly applied in single nucleotide polymorphism (SNP) research [68], where
melting temperature differences can be detected on the basis of one differing nucleotide in low weight
PCR fragments. It seems worthwhile to also evaluate the sensitivity of HRM in SSR analysis. The
utilization of specialized HRM laboratory kits, based on more sensitive fluorescent dyes that only emit
signals when intercalated into the double helix and/or small unlabeled oligonucleotide probes, may be a
Diversity 2015, 7 378
future option to optimize HRM analysis in microsatellite marker detection. An avenue for the quantification
of dual or multiple colonization events in analyzed tissues was provided by Capper et al., 2015 [69], who
introduced quantitative high resolution melting (qHRM). This new method enabled them to determine
SNP allele frequencies in pooled samples along with two or more individuals of known genotype as
reference material. Similarly, this approach should also be suitable for quantifying or at least revealing
the proportion of different SSR alleles in a background of host DNA.
Figure 5. Allele-specific melting curve analysis. The different allele sizes at marker
(GAAA)34 (upper panel) in isolates from Germany (325 bp) and Australia (491 bp) resulted
in different melting temperatures of the fragments (differences 0.88 °C and 166 bp). Similarly,
this was also observed at the (CTT)56 locus, where the melting temperature difference was
0.45 °C and the fragment size difference was only 12 base pairs ((lower panel) Australia
301 bp and Germany 289 bp).

Diversity 2015, 7 379
4. Conclusions
From the results of this study, it can be concluded that T. virens is a well-defined species that harbors
moderate to high genetic diversity and exhibits a root-endophytic lifestyle with no negative
consequences for the host plant tomato. Single strains of T. virens may enter the root system and different
strains are able to contemporarily enter root tissue of a single tomato plant as demonstrated in a pot
experiment with non-sterilized field soil. Co-colonization events can be monitored with the developed
SSR markers and conventional PCR—including multiplex PCR—followed by agarose, polyacrylamide
or capillary gel electrophoresis. Markers are also suitable for use in quantitative PCR and are competent
to accurately quantify the portion of fungal T. virens DNA in total root DNA and, by these means,
discriminate between varying root colonization efficiencies of different strains. The developed SSR
markers provide a new molecular diagnostic tool to trace and quantify different strains in the
environment and also monitor their dispersal in host plants. Furthermore, we demonstrated that dual or
multiple root colonization events caused by different T. virens strains can also be analyzed by qPCR and
subsequent melting curve analysis. The qPCR part of the experiment reveals the total amount of T. virens
DNA in the roots (as shown in this study), while allele-specific melting curve analysis has the potential
of being able to unveil the presence of different alleles originating from different fungal isolates in the
roots. In our experiments, conventional melting curve analysis was not sensitive enough to differentiate
between fungal allele sizes in a tomato context, but was able to discriminate between allele sizes in pure
fungus DNA. A future perspective would be the application of qHRM to quantify different alleles and
to reveal the proportion of different alleles present in root tissue. Thus, it appears possible to circumvent
laborious combinations of conventional and quantitative PCR and to draw the same amount of
information from a single qPCR/qHRM experiment.
Supplementary Materials
Supplementary materials can be accessed at: http://www.mdpi.com/1424-2818/7/4/360/s1.
Acknowledgments
The research leading to these results has received funding from the European Community’s Seventh
Framework Programme (FP7/2007-2013) under grant agreement No. 312117 (BIOFECTOR) and from
the Federal Ministry of Agriculture and the Environment, Saxony-Anhalt, Germany, support code A03/2013.
Author Contributions
The manuscript was written by Joerg Geistlinger, the experiments were performed by Jessica Zwanzig,
the statistical analysis was conducted by Sophie Heckendorff, and the experimental concept was
developed by Ingo Schellenberg.
Conflicts of Interest
The authors declare no conflict of interest.
Diversity 2015, 7 380
References
1. Chaverri, P.; Samuels, G.J.; Stewart, E.L. Hypocrea. virens sp. nov., the teleomorph of
Trichoderma. virens. Mycologia 2001, 95, 1113–1124.
2. Miller, J.H.; Giddens, J.E.; Foster, A.A. A survey of the fungi of forest and cultivated soils in
Georgia. Mycologia 1957, 49, 779–808.
3. Von Arx, J.A. Plant pathogenic fungi. Nova Hedwig. Beih. 1987, 87, 1–288.
4. Atanasova, L.; Druzhinina, I.S.; Jaklitsch, W.M. Two hundred Trichoderma species recognized
based on molecular phylogeny. In Trichoderma: Biology and Applications, 2nd ed.; Mukherjee, P.K.,
Sigh, U.S., Horwitz, B.A., Schmoll, M., Mukherjee, M., Eds.; CABI of Nosworthy Way:
Wallingford, UK, 2013; pp. 10–26.
5. Jaklitsch, W.M. European species of Hypocrea. Part 1. The green-spored species. Stud. Mycol.
2009, 63, 1–91.
6. Druzhinina, I.S.; Kopchinskiy, A.G.; Komon, M.; Bissett, J.; Szakacs, G.; Kubicek, C.P. An
oligonucleotide barcode for species identification in Trichoderma and Hypocrea. Fungal Genet.
Biol. 2005, 42, 813–828.
7. Zafra, G.; Moreno-Montano, A.; Absalon, A.E.; Cortes-Espinosa, D.V. Degradation of polycyclic
aromatic hydrocarbons in soil by a tolerant strain of Trichoderma asperellum. Environ. Sci. Pollut.
Res. Int. 2015, 22, 1034–1042.
8. Divya, L.M.; Prasanth, G.K.; Sadasivan, C. Potential of the salt-tolerant laccase-producing strain
Trichoderma viride Pers. NFCCI-2745 from an estuary in the bioremediation of phenol-polluted
environments. J. Basic Microbiol. 2014, 54, 542–547.
9. Arfarita, N.; Imai, T.; Kanno, A.; Yarimizu, T.; Xiaofeng, S.; Jie, W.; Higuchi, T.; Akada, R.
The potential use of Trichoderma viride strain FRP3 in biodegradation of the herbicide glyphosate.
Biotechnol. Biotechnol. Equip. 2013, 27, 3518–3521.
10. Hoyos-Carvajal, L.; Orduz, S.; Bisset, J. Growth stimulation in bean (Phaseolus vulgaris L.) by
Trichoderma. Biol. Control 2009, 51, 409–416.
11. Harman, G.E.; Howell, C.R.; Viterbo, A.; Chet, I.; Lorito, M. Trichoderma Species—opportunistic,
avirulent plant symbionts. Nat. Rev. Microbiol. 2004, 2, 43–56.
12. Blaszczyk, L.; Popiel, D.; Chelkowski, J.; Koczyk, G.; Samuels, G.J.; Sobieralski, K.; Siwulski, M.
Species diversity of Trichoderma in Poland. J. Appl. Genet. 2011, 52, 233–243.
13. Gauthier, N.W.; Maruthachalam, K.; Subbarao, K.V.; Brown, M.; Xiao, Y.; Robertson, C.L.;
Schneider, R.W. Mycoparasitism of Phakopsora pachyrhizi, the soybean rust pathogen, by
Simplicillium lanosoniveum. Biol. Control 2014, 76, 87–94.
14. Zeng, L.-M.; Zhang, J.; Han, Y.-C.; Wu, M.; Jiang, D.-H.; Chen, W.; Li, G.-Q. Degradation of
oxalic acid by the mycoparasite Coniothyrium minitans plays an important role in interacting with
Sclerotinia sclerotiorum. Environ. Microbiol. 2014, 16, 2591–2610.
15. Qualhato, T.F.; Lopes, F.A.C.; Steindorff, A.S.; Brandao, R.S.; Jesuino, R.S.A.; Ulhoa, C.J.
Mycoparasitism study of Trichoderma species against three phytopathogenic fungi: Evaluation of
antagonism and hydrolytic enzyme production. Biotechnol. Lett. 2013, 35, 1461–1468.
Diversity 2015, 7 381
16. Matarese, F.; Sarrocco, S.; Gruber, S.; Seidl-Seiboth, V.; Vannacci, G. Biocontrol of Fusarium head
blight: Interactions between Trichoderma and mycotoxigenic Fusarium. Microbiology 2012, 158,
98–106.
17. Mulaw, T.B.; Druzhinina, I.; Kubicek, C.P.; Atanasova, L. Novel endophytic Trichoderma spp.
isolated from healthy Coffea arabica roots are capable of controlling coffee tracheomycosis.
Diversity 2013, 5, 750–766.
18. Yang, P. Pathogenic fungi induce the expression of Trichoderma asperellum cell wall degrading
enzymes in the process of mycoparasitism. Adv. Mater. Res. 2014, 937, 282–285.
19. Shi, M.; Chen, L.; Wang, X.-W.; Zhang, T.; Zhao, P.-B.; Song, X.-Y.; Sun, C.-Y.; Chen, X.-L.;
Zhou, B.-C.; Zhang, Y.-Z. Antimicrobial peptaibols from Trichoderma pseudokoningii induce
programmed cell death in plant fungal pathogens. Microbiology 2012, 158, 166–175.
20. Mbarga, J.B.; Begoude, B.A.D.; Ambang, Z.; Meboma, M.; Kuate, J.; Schiffers, B.; Ewbank, W.;
Dedieu, L.; Ten Hoopen, G.M. A new oil-based formulation of Trichoderma asperellum for the
biological control of cacao black pot disease caused by Phytophthora megakarya. Biol. Control
2014, 77, 15–22.
21. Perazzolli, M.; Moretto, M.; Fontana, P.; Ferrarini, A.; Velasco, R.; Moser, C.; Delledonne, M.;
Pertot, I. Downy mildew resistance induced by Trichoderma harzianum T39 in susceptible
grapevines partially mimics transcriptional changes of resistant genotypes. BMC Genomics 2012,
13, 660–679.
22. Feng, X.M.; Johnsson Holmberg, A.-I.; Sundh, I.; Ricard, T.; Melin, P. Specific SCAR markers and
a multiplex real-time PCR for quantification of two Trichoderma biocontrol strains in
environmental samples. BioControl 2011, 56, 903–913.
23. Naeimi, S.; Kocsube, S.; Antal, Z.; Okhovvat, S.M.; Javan-Nikkhah, M.; Vagvölgyi, C.; Kredics, L.
Strain-specific SCAR markers for the detection of Trichoderma harzianum AS12–2, a biological
control agent against Rhizoctonia solani, the causal agent of rice sheath blight. Acta Biol. Hung.
2011, 62, 73–84.
24. Hernandez, A.; Jimenez, M.; Arcia, A.; Ulacio, D.; Mendez, N. Molecular characterization of
12 isolates of Trichoderma spp. using RAPD and rDNA-ITS. Bioagro 2013, 25, 167–174.
25. Devi, S.S.; Sreenivasulu, Y.; Saritha, S.; Kumar, M.R.; Kumar, K.P.; Sudhakar, P. Molecular
diversity of native Trichoderma isolates against Fusarium oxysporum f. sp. lycopersici (Sacc.), a causal
agent of Fusarium wilt in tomato (Lycopersicon esculentum Mill.). Arch. Phytopathol. Plant Prot.
2012, 45, 686–698.
26. Lubeck, M.; Bulat, S.; Alekhina, I.; Lieckfeldt, E. Delineation of species within the Trichoderma
viride/atroviride/koningii complex by UP-PCR cross-blot hybridization. FEMS Biol. Lett. 2004,
237, 255–260.
27. Shahid, M.; Srivastava, M.; Kumar, V.; Singh, A.; Pandey, S. Genetic determination of potential
Trichoderma. species using ISSR (microsatellite) marker in Uttar Pradesh, India. J. Microb.
Biochem. Technol. 2014, 6, 174–178.
28. Siddiquee, S.; Tan, S.G.; Yusuf, U.K.; Fatihah, N.H.N.; Hasan, M.M. Characterization of Malaysian
Trichoderma isolates using random amplified microsatellites. Mol. Biol. Rep. 2012, 39, 715–722.
Diversity 2015, 7 382
29. Geistlinger, J.; Weising, K.; Winter, P.; Kahl, G. Locus-specific microsatellite markers for the
fungal chickpea pathogen Didymella rabiei (anamorph Ascochyta rabiei). Mol. Ecol. 2000, 9,
1939–1941.
30. Nordberg, H.; Cantor, M.; Dusheyko, S.; Hua, S.; Poliakov, A.; Shabalov, I.; Smirnova, T.;
Grigoriev, I.V.; Dubchak, I. The genome portal of the Department of Energy Joint Genome Institute:
2014 updates. Nucleic Acids Res. 2014, 42, 26–31.
31. Bahkali, A.H.; Abd-Elsalam, K.A.; Guo, J.-R.; Khiyami, M.A.; Verreet, J.-A. Characterization of
novel di-, tri-, and tetranucleotide microsatellite primers suitable for genotyping various plant
pathogenic fungi with special emphasis on fusaria and Mycospherella graminicola. Int. J. Mol. Sci.
2012, 13, 2951–2964.
32. Consolo, V.F.; Monaco, C.I.; Cordo, C.A.; Salerno, G.L. Characterization of novel Trichoderma
spp. isolates as a search for effective biocontrollers of fungal diseases of economically important
crops in Argentina. World J. Microbiol. Biotechnol. 2012, 28, 1389–1398.
33. Rozen, S.; Skaletsky, H. Primer3 on the WWW for general users and for biologist programmers.
Methods Mol. Biol. 2000, 132, 365–386.
34. Gardes, M.; Bruns, T.D. ITS primers with enhanced specificity for basidiomycetes—Application to
the identification of mycorrhizae and rusts. Mol. Ecol. 1993, 2, 113–118.
35. White, T.M.; Bruns, T.; Lee, S.; Taylor, J. Amplification and direct sequencing of fungal ribosomal
RNA for phylogenetics. In PCR Protocols: A Guide to Methods and Applications, 1st ed.; Innis,
M.A., Gelfand, D.H., Sninsky, J.J., White, T.J., Eds.; Academic Press: San Diego, CA, USA. 1990;
pp. 315–321.
36. Nei, M. Genetic distance between populations. Am. Nat. 1972, 106, 283–291.
37. Peakall, R.; Smouse, P,E. GenAlEx 6: Genetic analysis in Excel. Population genetic software for
teaching and research. Mol. Ecol. Notes 2006, 6, 288–295.
38. Peakall, R.; Smouse, P.E. GenAlEx 6.5: Genetic analysis in Excel. Population genetic software for
teaching and research—An update. Bioinformatics 2012, 28, 2537–2539.
39. Simpson, M.C.; Wilken, M.; Coetzee, M.P.A.; Wingfield, M.J.; Wingfield, B.D. Analysis of
microsatellite markers in the genome of the plant pathogen Ceratocystis fimbriata. Fungal Biol.
2013, 117, 545–555.
40. Gilmore, G.S.; Bassil, N.V.; Barney, D.L.; Knaus, B.J.; Hummer, K.E. Short-read DNA sequencing
yields microsatellite markers for Rheum. J. Am. Soc. Hortic. Sci. 2014, 139, 22–29.
41. Anderson, S.J.; Stone, C.L.; Posada-Buitrago, M.L.; Boore, J.L.; Neelam, B.A.; Stephens, R.M.;
Luster, D.G.; Frederick, R.D.; Pedley, K.F. Development of simple sequence repeat markers for the
soybean rust fungus, Phakopsora pachyrhizi. Mol. Ecol. Resour. 2008, 8, 1310–1312.
42. Bucheli, E.; Gautschi, B.; Shykoff, J.A. Host-specific differentiation in the anther smut fungus
Microbotryum violaceum as revealed by microsatellites. J. Evolut. Biol. 2000, 13, 188–198.
43. Reineke, A.; Bischoff-Schaefer, M.; Rondot, Y.; Galidevara, S.; Hirsch, J.; Devi, K.U.
Microsatellite markers to monitor a commercialized isolate of the entomopathogenic fungus
Beauveria bassiana in different environments: Technical validation and first applications.
Biol. Control 2014, 70, 1–8.
Diversity 2015, 7 383
44. Cipriani, G.; Marrazzo, M.T.; di Gaspero, G.; Pfeiffer, A.; Morgante, M.; Testolin, R. A set of
microsatellite markers with long core repeat optimized for grape (Vitis spp.) genotyping.
BMC Plant Biol. 2008, 8, 127, doi:10.1186/1471-2229-8-127.
45. Schoebel, C.N.; Jung, E.; Prospero, S. Development of new polymorphic microsatellite markers for
three closely related Phytophthora species using 454-pyrosequencing and their potential
applications. Phytopathology 2013, 103, 1020–1027.
46. Prospero, S.; Jung, E.; Tsykun, T.; Rigling, D. Eight microsatellite markers for Armillaria cepistipes
and their transferability to other Armillaria species. Eur. J. Plant Pathol. 2010, 127, 165–170.
47. Dillon, N.L.; Innes, D.J.; Bally, I.S.E.; Wright, C.L.; Devitt, L.C.; Dietzgen, R.G. Expressed
sequence tag-simple sequence repeat (EST-SSR) marker resources for diversity analysis of mango
(Magnifera indica L.). Diversity 2014, 6, 72–87.
48. Sehic, J.; Garkava-Gustavsson, L.; Fernandez-Fernandez, F.; Nyboom, H. Genetic diversity in a
collection of European pears (Pyrus communis) cultivars determined with SSR markers chosen by
ECPGR. Sci. Hortic. 2012, 145, 39–45.
49. Bouajila, A.; Zoghlami, N.; Murad, S.; Baum, M.; Ghorbel, A.; Nazari, K. Genetic differentiation
in Pyrenophora teres f. teres populations from Syria and Tunisia as assessed by AFLP markers.
Lett. Appl. Microbiol. 2013, 56, 389–400.
50. Urbanelli, S.; della Rosa, V.; Fanelli, C.; Fabbri, A.A.; Reverberi, M. Genetic diversity and
population structure of the Italian fungi belonging to the taxa Pleurotus eryngii and P. ferulae.
Heredity 2013, 90, 253–259.
51. Wang, X.; Wadl, P.A.; Wood-Jones, A.; Windham, G.; Trigiano, R.N.; Scruggs, M.; Pilgrim, C.;
Baird, R. Characterization of expressed sequence tag-derived simple sequence repeat markers for
Aspergillus flavus: Emphasis on variability of isolates from the southern United States.
Mycopathologia 2012, 174, 371–382.
52. Zhao, L.; Lascoux, M.; Overall, A.D.J.; Waxman, D. The characteristic trajectory of a fixing allele:
A consequence of fictitious selection that arises from conditioning. Genetics 2013, 195, 993–1006.
53. Aguilée, R.; Claessen, D.; Lambert, A. Allele fixation in a dynamic meta-population: Founder
effects vs. refuge effects. Theor. Popul. Biol. 2009, 76, 105–117.
54. Boose, D.; Harrison, S.; Clement, S.; Meyer, S. Population genetic structure of the seed pathogen
Pyrenophora semeniperda on Bromus tectorum in western North America. Mycologia 2011, 103,
85–93.
55. Saldamondo, C.I.; Velez-Arango, A.M. Host plant association and genetic differentiation of corn
and rice strains of Spodoptera. frugiperda in Colombia. Neotropical. Entomology 2010, 39,
921–929.
56. Dong, Z.; Lui, Z.; Lui, D. Genetic characterization of the scyphozoan jellyfish Aurelia spp. in
Chinese coastal waters using mitochondrial markers. Biochem. Syst. Ecol. 2015, 60, 15–23.
57. Gordon, M.; van Norman, K. Molecular monitoring of protected fungi: Mycelium persistence in
soil after timber harvest. Fungal Ecol. 2014, 9, 34–42.
58. Prabhakaran, N.; Promeeladevi, T.; Sathiyabama, M.; Kamil, D. Multiplex PCR for detection and
differentiation of diverse Trichoderma species. Ann. Microbiol. 2015, 65, 1591–1595.
Diversity 2015, 7 384
59. Haasbrock, M.P.; Craven, M.; Barnes, I.; Crampton, B.G. Microsatellite and mating type primers
for the maize and sorghum pathogen Exserohilum turcicum. Aust. Plant Pathol. 2014, 43,
577–581.
60. Ohsumi, K.; Watanabe, M.; Fujie, A. AS2077715 is a selective inhibitor of fungal mitochondrial
cytochrome BC 1 complex. J. Antibiot. 2014, 67, 713–716.
61. Su, Z.-Z.; Mao, L.-J.; Li, N.; Feng, X.-X.; Yuan, Z.-L.; Wang, L.-W.; Lin, F.-C.; Zhang, C.-L.
Evidence for biotrophic lifestyle and biocontrol potential of dark septate endophyte Harpophora
oryzae to rice blast disease. PLoS ONE 2013, doi:10.1371/journal p one 0061332.
62. Reininger, V.; Sieber, T.N. Mitigation of antagonistic effects on plant growth due to root
co-colonization by dark septate endophytes and ectomycorrhiza. Environ. Microbiol. Rep. 2013, 5,
892–898.
63. Saravesi, K.; Ruotsalainen, A.L.; Cahill, J.F. Contrasting impacts of defoliation on root colonization
by arbuscular mycorrhizal fungi and dark septate endophyte fungi of Medicago sativa. Mycorrhiza
2014, 24, 239–245.
64. Anith, K.N.; Faseela, K.M.; Archana, P.A.; Prathapan, K.D. Compatibility of Piriformospora indica
and Trichoderma harzianum as dual inoculants in black pepper (Piper nigrum L.). Symbiosis 2011,
55, 11–17.
65. Sathiyadash, K.; Muthukumar, T.; Uma, E. Arbuscular mycorrhizal and dark septate endophyte
fungal associations in South Indian grasses. Symbiosis 2010, 52, 21–32.
66. Wang, X.-M.; Yang, B.; Wang, H.-W.; Yang, T.; Ren, C.-G.; Zheng, H.-L.; Dai, C.-C.
Consequences of antagonistic interactions between endophytic fungus and bacterium on plant
growth and defense responses in Atractylodes lancea. J. Basic Microbiol. 2015, 55, 659–670.
67. Singh, R.; Kumar, S.; Kashyap, P.L.; Srivastava, A.K.; Mishra, S.; Sharma, A.K. Identification and
characterization of microsatellite from Alternaria brassicicola to access cross-species
transferability and utility as a diagnostic marker. Mol. Biotechnol. 2014, 56, 1049–1059.
68. Dong, Y.; Shi, S.; Bao, Y.; Yao, H.; Jing, Y.; Lin, Z. Development of 90 EST-SNP markers in blood
clam (Tegillarca granosa) using high resolution melting (HRM). Conserv. Genet. Resour. 2015, 7,
309–314.
69. Capper, R.L.; Jin, Y.K.; Lundgren, P.B.; Peplow, L.M.; Matz, M.V.; van Oppen, M.J.H.
Quantitative high resolution melting: Two methods to determine SNP allele frequencies from
pooled samples. BMC Genet. 2015, 16, 62–75.
© 2015 by the authors; licensee MDPI, Basel, Switzerland. This article is an open access article
distributed under the terms and conditions of the Creative Commons Attribution license
(http://creativecommons.org/licenses/by/4.0/).