Embed Size (px)
Citation preview

1
SSIP JANUARY – MARCH 2020
MATHEMATICAL LITERACY
PARTICIPANT GUIDE
2
© COPYRIGHT
This work is protected by the Copyright Act 98 of 1978. No part of this work may be reproduced or
transmitted in any form or by any means, electronic or mechanical, including photocopying, recording
or by any information storage and retrieval system, without permission in writing from Matthew
Goniwe School of Leadership and Governance.
Whilst every effort has been made to ensure that the information published in this work is accurate,
Matthew Goniwe School of Leadership and Governance takes no responsibility for any loss or damage
suffered by any person as a result of the reliance upon the information contained therein.

3
TABLE OF CONTENTS
NO. PREAMBLE PAGE
A Foreword 3
B Purpose 3
C SSIP Aims/goals 4
D SSIP Objectives 4
E Learning Assumed to be in place 4
F Target Audience 4
G Notional Hours 5
H Course Design and Assessment Strategy 5
I Course outline/Map 5
J Table of Icons 6
K Table of Acronyms and Abbreviations 7
L Term ATP 7
M Course Timetable 10
Module 1: Finance Part One 11
Unit 1 Financial Documents; Taxation and Tariffs 13
Unit 2 Income and Expenditure; Profit and Loss; Break Even Points 22
Module 2: Data Handling 29
Unit 1 Developing Questions; Collecting Data and Classifying Data 33
Unit 2 Summarising Data; Representing Data; Interpreting Data and
Analysing Data
38
Unit 3 Measuring Weight 49
A. FOREWORD
This document is the result of the Just in Time Secondary School Intervention Programme (JIT SSIP)
which is an intervention programme for FET teachers in the Gauteng Department Education (GDE) in
collaboration with Matthew Goniwe School of Leadership and Governance (MGSLG).
B. PURPOSE
The purpose of this programme is professional development of FET teachers who are currently
teaching in the school FET phase of the education system. The programme is aligned to the strategic
goals of the GDE which focuses on improving the teaching and learning practice in the most

4
classrooms through capacitation of teachers on Content, Pedagogy, and Assessment and ICT
integration.
C. SSIP AIMS/GOALS
The SSIP programme aims at professional development for Grade 10-12 teachers in the application of
effective teaching and reflective practice to improve learner performance on the identified Grade 12
examinable topics. The overall goal for SSIP is to provide teachers with professional expertise, tools
and skills to spot student learning difficulties and decide on the course of action.
SSIP came about as result of the diagnostic needs that are identified through the end of the year NSC
examination student learning data. In response to this design and development of teaching resources
are developed to train teachers on the learner needs.
The four interconnected outcomes that drive the professional development activities for SSIP are:
• Enhancing Teachers knowledge: deep understanding of subject matter knowledge and students ideas on the content
• Enhancing quality teaching and assessment for learning: effective instructional approaches that teachers may use to ensure improved understanding by most learners.
• Developing ICT integration skills :Use of ICT to improve teaching and learning
• Building professional learning communities: allow teachers to start collaborating and form professional networks in non-formal settings in context of their schools
D. SSIP OBJECTIVES
By the end of the workshop teachers should be able to:
• have mastered and understood all aspects related to Finance Part 1 and Data Handling within
the FET Mathematical Curriculum
• utilise ICT integration and encourage interactive lessons in teaching and learning
E. LEARNING ASSUMED TO BE IN PLACE
Participants are qualified teachers with a qualification in teaching at NQF 4 or above and teaching Mathematical Literacy.
F. TARGET AUDIENCE
Teachers who were identified through the 2019 NSC results, diagnostics report, and needs analyses
of the teacher in the Integrated Quality Management System (IQMS) who teaching Mathematical
Literacy in target schools. The course is aimed at professional development to improve learner
performance in Mathematics Literacy.

5
G. NOTIONAL HOURS:
The time required to successful completion has been allocated as follows:
Contact face to face session 17, 5 hours
Pre Test 1 hour
Day 2 : Content Practice and Demonstration 10,5 hours
Day 3: Content Practice and Demonstration 5 hours
Post Test 1 hour
H. COURSE DESIGN AND ASSESSMENT STRATEGY
• The envisaged course focuses on two modules with at least two units each viz.
o Module 1: Finance Part One
o Module 2: Data Handling
• Teachers will be subjected to the variety of content knowledge, formative activities to
consolidate the content learnt, Pre-test at the beginning of each workshop session to further
verify content gaps and post-test in the last session.
• Pre-Post Test data will be used to monitor what learning has taken place in the 3 days of the
session and workshop activities will also be used to support participant on subject matter
knowledge
I. COURSE OUTLINE/ MAP
Module 1 : Finance Part One
Objectives/Outcomes Units
At the end of this module you will
be able to:
• Work with Financial
documents relating to
personal/household/work
place/business
• Work with tariff systems
• Identify and perform
calculations involving
income, expenditure, profit
and loss values
• Determine and work with
break-even analysis
Unit 1: Financial document, Taxation and Tariff systems
At the end of this Unit, you should be able to:
• Financial documents relating to
personal/household/work place/business
• Income Tax, Value Added Tax, UIF and Personal Income
Tax
• Tariff systems
Unit 2:
Income, Expenditure, Profit, Loss and Break Even Analysis
At the end of this Unit, you should be able to:
• Identify and perform calculations involving
income, expenditure, profit and loss values.
• Determine break-even values

6
Module 2: Data Handling Graphs
Objectives/Outcomes Units
At the end of this module you will
be able to:
• Develop investigative questions
• Collect data using appropriate instruments and methods
• Summarise data collected
• Organise and represent data
• Interpret and discuss data
Unit 1:
developing questions; collecting data and classifying data
At the end of this Unit, you should be able to:
• Develop questions
• Collect data
• Classify data
Unit 2:
summarizing data; representing data; interpreting data and
analysing data
At the end of this Unit, you should be able to:
• Summarising data
• Representing data
• Interpreting data
• Analysing data
Unit 3: Measuring Weight
At the end of this Unit, you should be able to:
• Determine the weight/mass using appropriate measuring
instrument
• Use recorded weight/mass data together with recorded
length/height data to calculate Body Mass Index values
and determine weight status for adults
• Calculate values using a formula involving mass/weight
J. TABLE OF ICONS TO BE USED IN THIS MANUAL
Discussion
Group ACTIVITY
Individual ACTIVITY
Study Tips
Notes
Ice Breaker

7
Time
Tools
K. TABLE OF ACRONYMS AND ABBREVIATIONS
Acronym Definition
ATP Annual Teaching Plan
CAPS Curriculum and Assessment Policy Statement
ICT Information and Communication Technology
LP Lesson Plan
FG Facilitator’s Guide
NPPPPR National Policy Pertaining to Programme and Promotion requirements
PG Participant Guide
FS Fact Sheet
PPT PowerPoint Presentation
TPACK Technological, Pedagogical, Content and Knowledge
TS Training Session
L. TERM ANNUAL TEACHING PLAN
DATE CONTENT CONTEXT
15/01 – 17/01 1. CONVERSIONS
• Conversion factors and tables
• Metric to imperial and vice versa
• oC to oF and vice versa
2. TIME
• Time Tables,
• Transport (Bus, Train, Taxi)
• Production e.g. building a house
• Tide
Complex projects in familiar and
unfamiliar context.
Examples:
• Determine quantities of
materials needed to build an
RDP house.
Planning a trip between two
places
20/01 –24/01 3. FINANCIAL DOCUMENTS:
• Loans
• Tax forms
Loans:
• loan agreements (term of
loan; interest rate)
• Bank statements: Showing
interest rate and monthly
repayment changes

8
Tax:
• Tax deduction tables; Tax rate
tables; IRP5 forms; Employee
income tax forms
27/01– 31/01
03/02– 07/02
4. TAXATION
• Taxable income
• personal income tax,
• taxable & non-taxable income,
• rebates and UIF
Two methods are promoted for this
type of calculation:
• dividing the “VAT inclusive” value by
1,15
• identifying the “VAT inclusive” value
as being 115% and working out the
“value excluding VAT” as 100%.
10/02 – 14/02
5. TARIFF SYSTEMS: (Compare 2 or
more)
• Tables
• Graphs
Formulae
• Subsistence farming
• Electricity tariff systems
• Telephone tariff systems
• Rental options (e.g. photo
copiers, machinery, etc.)
17/02 – 21/02
6. INCOME, EXPENDITURES,
PROFIT/LOSS
• large organisations and
fundraising projects
7. COST PRICE & SELLING PRICE:
• Cost of producing/
manufacturing
• Appropriate selling price
• Percentage profit
8. BREAK-EVEN ANALYSIS:
determine break-even values from
formulae and graphs
• Running a small business
24/02 – 28/02
9. DEVELOPING QUESTIONS:
• National and global issues
10. COLLECTING DATA:
• Develop and use data collection
instruments
11. CLASSIFYING & ORGANISING DATA:
• sort numerical and categorical
data using categories and class
intervals
tallies and frequency tables
Develop and use an appropriate
form/instrument for collecting
multiple sets (Grade 12) of data,
including
• National and global issues
Collect data on problems being
investigated relating to the national
and global issues (Grade 12).
Classify collected data as:
• categorical data (e.g. male/female;
type of car)
• numerical data, further classified as
discrete data (e.g. number of people;
number of cars) and continuous data
Sort collected numerical data
according to more than two
categories (Grade 12).

9
02/03 – 06/03
12. SUMMARISING DATA:
• quartiles
• inter-quartile range
• calculate and analyse measures
of central tendency and spread
• percentiles
Quartiles and IQR values in
conjunction with box-and-whisker
diagrams
• percentiles (interpretation only)
09/03 – 13/03
13. REPRESENTING DATA:
• pie charts
• histograms and bar graphs
• line and broken line graphs
• scatter plots
box and whiskers
In Grade 12, owing to the large and
complex nature of the data dealt with
in relation to national and/or global
issues, it is expected that more
complex estimation will
be required
14. INTERPRET AND ANALYSE DATA:
• identify and describe trends
• identify and describe sources of
bias
• answer questions under
investigation
• identify and describe any
misleading representations and
data summaries
Compare different representations of
multiple sets of data and explain
differences.
Investigate situations in which
summarized and/or represented data
is interpreted in different ways.
AND ASSESSMENT POLICY
STATEMENT (CAPS
16/03 – 20/03
15. MEASUREMENT
• Mass(weight)
(cost of a product)
• BMI
(formulae for BMI = kg/m²)
• Interpreting charts
• Growth charts
• BMI charts

10
M. COURSE TIMETABLE
Day 1
TIME ACTIVITY
15:30 – 16:30 Arrival
16:00 – 17:00 Plenary Session: Opening and Welcome
17:00 – 18:00 TS 1: Pre Test
18:00 – 19:30 Supper
DAY 2
TIME ACTIVITY
06:30 – 08:00 Breakfast
08:00 – 10:30 TS 2: Module 1 – Unit 1
10:30 – 11:00 Tea Break
11:00 – 13:00 TS 3: Module 1 – Unit 1
13:00 – 14:00 Lunch
14:00 – 15:30 TS 4: Module 2 – Unit 1
15:30 – 17:00 TS 5: Module 2 – Unit 1
17:00 – 18:30 TS 6: Module 2 – Unit 2
19:00 – 20:30 Supper
DAY 3
TIME ACTIVITY
06:30 – 08:00 Breakfast
08:00 – 10:30 TS 7: Module 2 – Unit 3
10:30 – 11:00 Tea Break
11:00 – 12:00 TS 8: Module 2 – Unit 3
12:00 – 13:00 TS 11: Post Test
Closing Session and Remarks:
13:00 – 14:00 Lunch

11
MODULE 1: FINANCE PART ONE
INTRODUCTION
In this module you will look at the concept of finance with specific focus on Financial Documents,
Taxation, Tariff Systems, Income/Expenditure, Cost Price/Selling Price and Break Even Analysis.
OVERVIEW
In this topic, you will work with complex projects in familiar and unfamiliar contexts
SPECIFIC OBJECTIVES
At the end of this module you will be able to:
• Work with Financial documents relating to personal/household/work place/business
• Work with tariff systems
• Identify and perform calculations involving income, expenditure, profit and loss
values
• Determine and work with break-even analysis
GLOSSARY OF TERMS
Account A record of income and expenditure.
Balance This is the difference between debits and credits.
Bank statement
The details of all the transactions made from one bank account in a given time period.
Break-even point
Break-even point is where the business is at an activity level (doing business) at which total cost = total sales, i.e. you have made enough income to cover the costs. At the break-even point, you are making neither a profit nor a loss; from that point on you will be making a profit with each sale (until new costs are incurred).
Consumption rate
The rate at which a commodity, such as water, electricity or fuel, is consumed.
Cost-effective Best value for money.
Cost price This is the amount that it costs per unit to either manufacture or purchase an item or to prepare for a service that will be delivered. This amount is pure cost, no mark-up or profit has been added yet.
Cost rate The price of a product per mass, volume, length or time unit.
Credit This is an entry in an account that shows a payment made into the account.
Credit balance The amount in the account is your own.
Credit card A credit card is a service bank product that allows you to buy goods and pay for them at the end of the month.
Credit limit The maximum amount you can spend on your credit card.
Debit When someone or an organisation takes money out of your account. An entry in an account showing a payment made from an account.
Debit balance The amount owed to a lender or seller.
Debit order It is an arrangement whereby you give permission to a third party to withdraw money from bank account on a regular basis.
Deposit A payment made into a bank account.
Disposable income
Income that is left over after all payments have been made.
Expenditure An amount of money that is spent on something.

12
Fixed deposit A single deposit invested for a fixed period at a fixed interest rate.
Fixed expenses
These are amounts that must be paid every month and which stay the same, like rent, school fees and transport costs.
Fund A source of money.
Gross income The total amount of all an individual’s income before deductions.
Invoice A comprehensive document that details all the work done or items sold, and what costs are due.
Loan A loan is an agreed sum of money that is lent by a bank or moneylender (e.g. personal loan or home loan).
Luxury item or service
An item or service that is not essential for daily life, but which makes life easier or more convenient.
Net pay The amount an employee “takes home” after income tax has been deducted.
Overdraft An overdraft is an arrangement you make with the bank that allows you to draw more money than there is in your account.
PAYE (abbr.) Pay as you earn: tax taken off your earnings by your employer and sent to the South African Revenue Service before you are paid (the balance).
Remittance slip
A piece of paper that accompanies a payment and contains the most important details of the transaction.
Salary An amount of money paid for the work you do. (This is normally paid monthly.)
Selling price This is the price at which something is offered for sale.
Statement A summary of transactions (debits and credits, or payments and receipts) made on an account.
Tariff The rate charged for a service rendered, e.g. import duties, water consumption cost, etc.
Tax A compulsory levy imposed on citizen’s earnings or purchases to fund the activities of government.
Taxable A service, purchase or item or earning that has tax applied to it.
Tax invoice Printed record of what was bought, what it cost, what was taxable, the tax amount, method of payment, amount tendered, and change due, if any.
Trillion One-million-million (one followed by twelve zeros).
UIF (abbr.) Unemployment Insurance Fund: A government-run insurance fund which employers and employees contribute to, so that when employees are retrenched they can collect some earnings (a portion).
Variable expenses
Expenses that change over time or from one week/month to the next. These are things that you usually pay or buy each month, but the amount changes e.g. telephone and electricity costs.
VAT Value Added Tax (VAT) is a tax that is levied at 14% (currently in South Africa) on most goods and services, as well as on the importation of goods and services into South Africa.
VAT exclusive price
The price before VAT is added.
VAT inclusive price
The price after VAT is added.
Wages A wage is an amount of money paid to an employee normally based on a fixed number of hours worked per week.
Withdrawal Money taken out of a bank account.
Zero rated VAT items
These are goods that are exempt from VAT. Groceries that are basic foodstuffs are zero-rated in South Africa, e.g. brown bread, milk, mielie meal, samp, rice, etc..

13
CONTENT
You will study this module through the following units
Unit 1 FINANCIAL DOCUMENT, TAXATION AND TARIFF SYSTEMS
Unit 2 INCOME, EXPENDITURE, PROFIT, LOSS AND BREAK EVEN ANALYSIS
UNIT 1: FINANCIAL DOCUMENT, TAXATION AND TARIFF SYSTEMS
INTRODUCTION
In this unit you will focus on:
• Financial documents relating to personal/household/work place/business
• Income Tax, Value Added Tax, UIF and Personal Income Tax
• Tariff systems
LEARNING OUTCOME
At the end of this Unit, you should be able to:
• Work with VAT in the context of purchases, slips and bills
• Work with UIF in the context of payslips
• Work with payslips, income tax brackets and income tax formulae, tax deductions
LESSON NOTES
1.1.1. Financial documents
• Financial documents include shopping documents and business documents
• Any time that you go shopping, you should receive a till slip which shows what you have
bought
• It is also proof that you have paid for the goods listed.
• For some items these should be kept for guarantee purposes.
• Many shops also allow you return goods as long as you have the till slip.
• There are many different household bills or accounts. For example:
✓ municipal bills
✓ telephone bills
✓ clothing accounts
✓ TV license, M-Net or DSTV
✓ hire purchase agreements
✓ car payments
✓ bond statements
✓ A till slips etc.

14
Activity 1.1.1 (Adapted from NSC Nov P1 2019)
Instructions
• You should form groups of 4 – 5
• Duration: 15 minutes
• Refer to the questions provided
• Task 1: Answer all the questions
Task 2: Allocate marks for each question
Task 3: Identify the taxonomy levels for each questions
• These questions are intended to prompt you to consolidate the unit and possible ways in
which this section can be taught
• Report Back and Discussion
Resources: Training manual, Note pad, Pen and Calculator
Extract below shows Mr Daniels’ monthly municipality statement including the residential water
and sewer tariff tables. Use the extract and answer the questions that follow:

15
a) Write down the market value in words b) Calculate the VAT amount for the sewer monthly charge on a stand larger than 2000m2 c) Determine the value of A d) Use the stepped residential water tariff table to calculate the value of B, the total amount
for water usage.
1.1.2. Value Added Tax (VAT)
• an indirect tax on the consumption of goods and services in the economy
• Revenue is raised for government by requiring certain businesses to register and to charge
VAT on the supply of goods and services.
• VAT is presently levied at the standard rate of 15% on the supply of most goods and services
and on the importation of goods.
• There is a limited range of goods and services which are subject to VAT at the zero rate
• For example: Mr Smit bought goods for his shop and he paid a total of R12 345,67.
If all the goods included VAT, how much was the cost excluding VAT
Answer: R12 345,67 ÷ 115% = R10735,37
1.1.3. Income Tax
• Income tax is the money paid to government from wages to pay for schools, hospitals,
infrastructure etc.
• The amount of tax depends on:
✓ how much you earns
✓ your age
✓ whether you are a member of retirement annuity
• For example: The employee and employer each contribute 1% to UIF based on the total
remuneration of the employee. Calculate the monthly amount paid to the fund if the gross
salary of the employee is R12 3 456,78 per annum.
Answer: 2% × R12 3 456,78 = R2469,14 pa
Per month = R2469,14 ÷ 12 = R205,76

16
1.1.4. Calculating Personal Income Tax
Rebates
Primary Rebate R14 220
Secondary (Persons 65 and older) R7 794
Tertiary (Persons 75 and older) R2 601
Tax Thresholds
The tax thresholds at which liability for normal tax commences
Persons under 65 R79 000
Persons of 65 - 74 years R122 300
Age 75 and older R136 750
Medical Aid Tax Credits
Main member R310
First dependant R310
Each additional dependant R209
Tax rates (year of assessment ending 28 February 2020)
Taxable Income Rates of tax
0 - 195 850 18 % of taxable income
195 851 - 305 850 35 253 + 26% of taxable income above 195 850
305 851 - 423 300 63 853 + 31% of taxable income above 305 850
423 301 - 555 600 100 263 + 36% of taxable income above 423 300
555 601 - 708 310 147 891 + 39% of taxable income above 555 600
708 311 - 1 500 000 207 448 + 41% of taxable income above 708 310
1 500 001 and above 532 041 + 45% of taxable income above 1 500 000

17
1.1.5. Tax deductions:
• UIF: Unemployment Insurance Fund: A government-run insurance fund which employers and employees
contribute, so that when employees are retrenched they can collect some earnings (a portion) .The
employee contributes 1% and the employer contributes 1% of basic salary.
• Pension fund: It is a fund established by an employer to facilitate and organize the investment of
employees' retirement funds contributed by the employer and employees.
• Other deductions like medical aid contribution, insurance policies, maintenance, house payment, car
payment, etc.
• PAYE: abbr.) Pay as you earn: tax taken off your earnings by your employer and sent to the South African
Revenue Service before you are paid (the balance).
• Net salary: The amount an employee “takes home” after income tax has been deducted.
• For example: Determine the tax that a teacher , age 41, a member of GEMS, will pay per annum if his taxable income is R312 000 per annum for tax year 2020.
• Answer: He will pay R63 853 + 31% of taxable income above 305 850
Amount over R305 850 = R312 000 – R305 850 = R6150
R6150 × 31% = R1906,50
Total tax before rebates = R63 853 + R1906,50 = R65 759,50
Since he is under 65, he gets only the primary rebate
Rebate = R14 220
Total Tax Payable = R65 759,50 – R14 220 = R51 539, 50 pa
Steps for calculating income tax
Step 1 Calculate taxable income • Determine the annual income • Multiply the monthly salary by 12 to make it the annual salary and add extra benefits • If taxable income is given, then there is no need for step 1, 2 and 3.
Step 2 Calculate non-taxable income
• UIF: Calculate 1% of the basic salary. • Pension fund: It is calculated by multiplying 7.5% by the basic salary, unless the
structure of provident fund is stated. Two types of pension fund: GEPF for government employees and provident fund for non-governmental institutions.
• Donations: Is a gift given by legal persons, typically for charitable purposes and/or to benefit a cause and is considered when calculating non-taxable income. The gift has to be given to an organisation that is registered under section 18A.

18
(A donation will be exempted if the total value of donations for a year of assessment does not exceed:
• Casual gifts by companies and trusts: R10 000 • Donations by individuals: R100 000).
Child support payments received, as the tax is deducted from payer’s income.
Step 3 • Calculating the taxable income by subtracting non-taxable income from the total income,
• Tax • Taxable income: Income remaining after the non-taxable income has been subtracted
and is used to calculate the payable income tax. Or income that has tax applied to it.
Income tax: It is the amount of money one must pay to the South African Revenue Services (SARS) for earning an income.
Step 4 • Tax threshold: The income level at which a person begins paying income taxes: • Check if the person qualifies to pay tax by using the tax threshold.
• The people earning lower than the tax threshold do not pay tax
Step 5 • Identify the correct tax bracket, write down the correct rate and calculate payable tax before the rebates and medical credits could be subtracted, USING BODMAS
• BODMAS is an acronym for Brackets, Orders, Division, Multiplication, Addition and Subtractions and determines the order of operations.
• Rewrite the correct tax bracket • Substitute the annual taxable in the formula on the amount above….. • Write the simplified value before adding it to the value given in the formula • Write the final answer before the subtraction of rebates and medical credits.
Step 6 Subtract the rebates and medical credits from the value calculated in step 5. Rebate:
• Is the tax relief according to age categories ; it is deducted after annual tax has been calculated
• The older the citizen, the higher the rebate
• People younger than 65 get the primary rebate only ( compulsory rebate to every citizen)
• People above 65 qualify for both primary and secondary rebate
• People above 75 qualify for qualify for primary, secondary and tertiary rebate(the highest rebate)
• Identify the correct rebate

19
1.1.6. Medical tax credit
• Medical credit: Is the fixed monthly medical rebate aimed at relieving personal tax; irrespective of the
income
• The more the number of dependents the higher the medical tax credit; the person’s tax bracket is not
considered.
• The medical credit depends on the number of dependents.
• Identify the number of members in the medical aid
• The medical credit allocated to the first dependent equals to that of the main member; there after the
medical credits of the remaining dependent is the same for every additional member. First means being
before all others with respect to time or order. i.e. anyone can be the 1st dependent, including
wife/husband, depending on the order in which the dependents are captured.
• Calculate the annual medical credits as they are given as monthly values on the tax table. This will
depend on the number of months the tax payer had contributed to the medical aid.
Activity 1.1.1 (Adapted from NSC Nov P2 2019)
Instructions
• You should form groups of 4 – 5
• Duration: 15 minutes
• Refer to the questions provided
• Task 1: Answer all the questions
Task 2: Allocate marks for each question
Task 3: Identify the taxonomy levels for each questions
• These questions are intended to prompt you to consolidate the unit and possible ways in which
this section can be taught
• Report Back and Discussion
• Resources: Training manual, Note pad, Pen and Calculator
The tax table below shows the tax rates for individuals for the 2018/2029 tax year. John
(68 years old) received a taxable income of R2 045 364 for the 2018/2019 tax year. He
paid a monthly contribution towards a medical scheme for himself and his wife.
Use the information above and tax table provided below to answer the questions kthat follow:
a) Calculate John’s total medical scheme tax rebate for the year.
b) Hence, calculate the amount of income tax he had to pay for the 2018/2019 tax year.

20
TAX RATES FOR INDIVIDUALS
2018/2019 TAX YEAR (1 MARCH 2018 – 28 FEBRUARY 2019)
The tax table 1 for the tax year March 2019 to February 2020
Taxable Income Rates of tax
0 - 195 850 18 % of taxable income
195 851 - 305 850 35 253 + 26% of taxable income above 195 850
305 851 - 423 300 63 853 + 31% of taxable income above 305 850
423 301 - 555 600 100 263 + 36% of taxable income above 423 300
555 601 - 708 310 147 891 + 39% of taxable income above 555 600
708 311 - 1 500 000 207 448 + 41% of taxable income above 708 310
1 500 001 and above 532 041 + 45% of taxable income above 1 500 000
Rebates
Primary Rebate R14 067
Secondary (Persons 65 and older) R7 713
Tertiary (Persons 75 and older) R2 574
Medical Aid Tax Credits
Main member R310
First dependant R310
Each additional dependant R209
21
1.1.7. Type of tariffs:
✓ Telephone tariffs (e.g. cell phone and fixed line)
✓ Municipal tariffs (e.g. electricity; water; sewage)
✓ Transport tariffs (e.g. bus, taxi and train tariffs)
✓ Bank fees.
• Telephone tariffs differ from one network to another one. The rates are charged either per minute
or per second. Promotional tariffs are different, this includes various packages which promotes
calling the same network. The rates are different during peak hours and off-peak hours.
• Electricity tariffs are charged per unit used. It also depends on the peak and off peak hours. The
rates of metered electricity and prepaid are different. Free units are given.
• Water tariffs are charged per kilolitre used, there are free kilolitres given and there after different
rates are charged. The more water you use, the higher the cost.
• Transport tariffs depend on the rates charged by service provider. Distance is used to charge the
tariffs. Regular users are discounted. Distance chart may be used to determine the cost if the rates
are charged per kilometre.
Activity 1.1.2 Instructions
• You should form groups of 4 – 5
• Duration: 15 minutes
• Refer to the questions provided
• Task 1: Answer all the questions
Task 2: Allocate marks for each question
Task 3: Identify the taxonomy levels for each questions
• These questions are intended to prompt you to consolidate the unit and possible ways in
which this section can be taught
• Report Back and Discussion
• Resources: Training manual, Note pad, Pen and Calculator
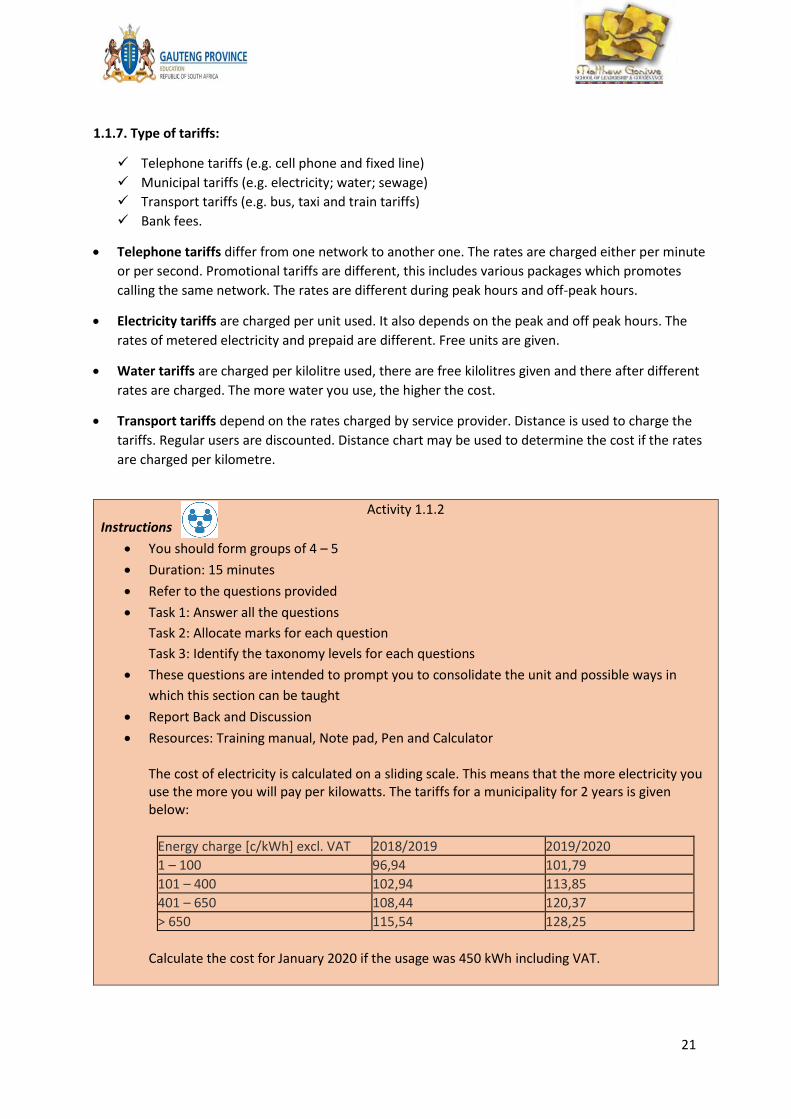
The cost of electricity is calculated on a sliding scale. This means that the more electricity you use the more you will pay per kilowatts. The tariffs for a municipality for 2 years is given below:
Energy charge [c/kWh] excl. VAT 2018/2019 2019/2020
1 – 100 96,94 101,79
101 – 400 102,94 113,85
401 – 650 108,44 120,37
> 650 115,54 128,25
Calculate the cost for January 2020 if the usage was 450 kWh including VAT.
22
Activity 1.1.3 (Adapted from NSC May/June P1 2018)
Instructions
• You should form groups of 4 – 5
• Duration: 15 minutes
• Refer to the questions provided
• Task 1: Answer all the questions
Task 2: Allocate marks for each question
Task 3: Identify the taxonomy levels for each questions
• These questions are intended to prompt you to consolidate the unit and possible ways in
which this section can be taught
• Report Back and Discussion
• Resources: Training manual, Note pad, Pen and Calculator
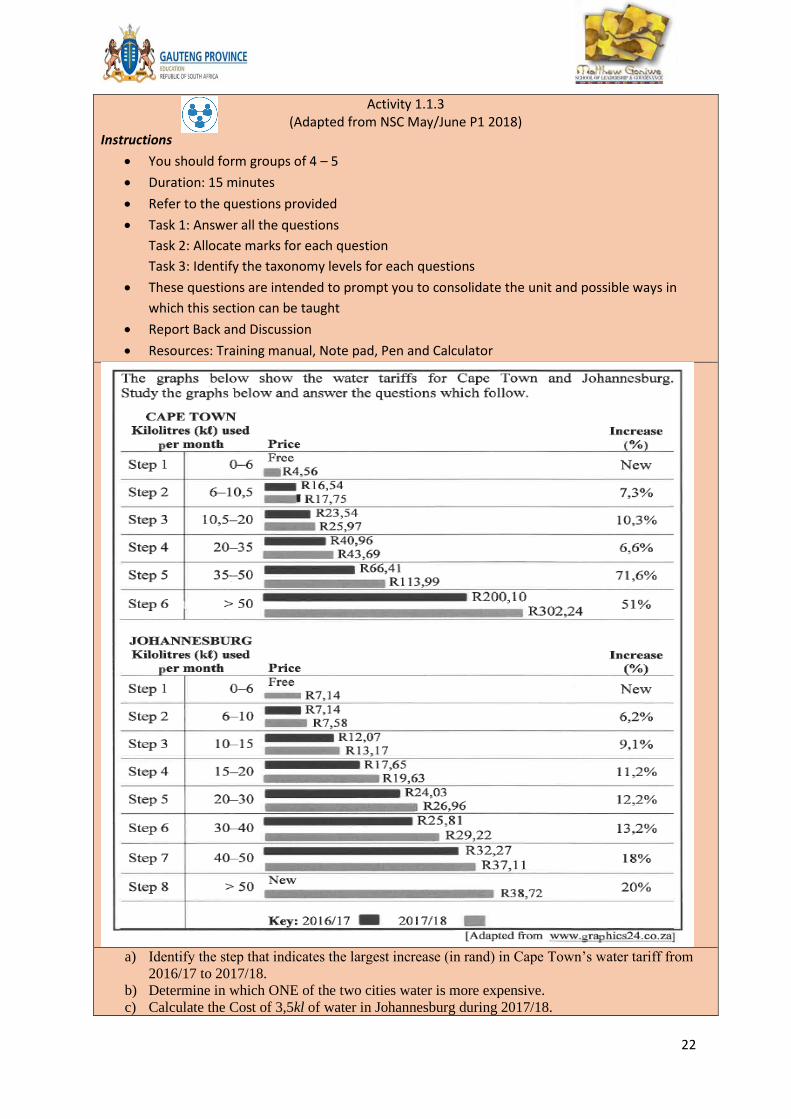
a) Identify the step that indicates the largest increase (in rand) in Cape Town’s water tariff from
2016/17 to 2017/18.
b) Determine in which ONE of the two cities water is more expensive.
c) Calculate the Cost of 3,5kl of water in Johannesburg during 2017/18.

23
Activity 1.1.4
(Adapted from NSC Nov P2 2018) Instructions
• You should form groups of 4 – 5
• Duration: 15 minutes
• Refer to the questions provided
• Task 1: Answer all the questions
Task 2: Allocate marks for each question
Task 3: Identify the taxonomy levels for each questions
• These questions are intended to prompt you to consolidate the unit and possible ways in
which this section can be taught
• Report Back and Discussion
Resources: Training manual, Note pad, Pen and Calculator
Mike plans to purchase a bakkie. He received the following quotation from a car dealer on the 28
February 2019
Use the information above to answer the questions that follow: a) Calculate (rounded off to ONE decimal place) the percentage discount given on the bakkie’s selling
price, excluding VAT. b) Show how the amount of R166 561,76 was calculated. c) Give ONE reason why customers would prefer to install the accessories (extras), as shown in the
quotation. d) VAT in South Africa increased to 15% with effect from 1 April 2018.
The following shows how the dealer calculated the new increased VAT incorrectly:

24
Identify the mistake the dealer has made in calculating the new selling price. Hence, calculate the new selling price, including 15% VAT (excluding accessories and other charges)
UNIT 2: INCOME, EXPENDITURE, PROFIT, LOSS AND BREAK EVEN ANALYSIS
INTRODUCTION
In this unit you will focus on Selling price, Cost price, Income, Expenditure and Break even analysis
LEARNING OUTCOME
At the end of this Unit, you should be able to:
• Identify and perform calculations involving income, expenditure, profit and loss
values.
• Determine break-even values
LESSON NOTES
2.1.1. Cost price and Selling price
• For a business to make money it needs to sell goods or services for more than it cost.
• The cost price is how much the item cost the business.
• The selling price is how much the business gets for the item.
• A business may offer the customer a discount on items. This means that the customer will pay less than the selling price for the item.
• The profit a company makes is determined by the difference between the selling and cost price. If the selling price is less than the cost price, the company will make a loss.
• For example: A clothing shop paid R123 for a trouser and sold them at R177 each. Calculate the percentage profit that the clothing shop made on the sale of the shirts. Answer: Profit = R177 – R123 = R54
% profit = 54
123× 100 = 43,9%
25
2.1.2. Income and Expenditure
• Profit means making more money than you spend.
• Profit is calculated by taking the difference between its income and expenditure.
• However, the costs involved before you can sell the product is also important.
• The cost may include more than just the purchase or production cost of an item. A retailer may buy products and then ship them to a warehouse where they have to be prepared for sale. All these steps add to the cost of an item.
• The costs may be divided into variable and fixed expenses.
• Fixed expenses:
✓ Costs that remain constant over time
✓ For example: rent, salaries, security, insurance, rates and taxes, etc.
• Variable expenses:
✓ Depend on the production level, as the production volume goes up, so will the costs
✓ For example: commissions, material costs, water and electricity, petrol etc.
• Income may also be divided into fixed and variable
• Fixed Income
✓ Fixed income is money that is definite on a monthly basis.
✓ For example: salary received monthly
• Variable income
✓ Variable income changes from month to month and is
✓ It is irregular and often unexpected
✓ For example: royalties, dividends
• Profit Margin
✓ Profit margin is the percentage of the final selling price that is profit.
✓ Profit = Selling price – cost price
✓ to calculate profit margin we use the formula:
✓ The profit margin is a better indication of how well a product or company is doing.
✓ For example: Consider the following 2 scenarios to establish a better company:
➢ A company A has an income of R1 400 000 and costs of R600 000.
➢ A company B has an income of R200 000 and costs of R50 000.

26
2.1.3. Break Even Analysis
• a financial tool which helps you to determine at what stage a company or product, will be
profitable.
• For example
The graphs showing the toy making business income and expenses is given below: A toy
making business may below:
a) Determine the income if 30 toys are sold
b) How many toys must be made and sold to break even?

27
Activity 1.2.1 (Adapted from NSC May/June P1 2018)
Instructions
• You should form groups of 4 – 5
• Duration: 15 minutes
• Refer to the questions provided
• Task 1: Answer all the questions
Task 2: Allocate marks for each question
Task 3: Identify the taxonomy levels for each questions
• These questions are intended to prompt you to consolidate the unit and possible ways in which
this section can be taught
• Report Back and Discussion
• Resources: Training manual, Note pad, Pen and Calculator
Note: All prices exclude 15% VAT a) Calculate the cost price of Clock A, excluding VAT. b) Write down the time on clock B, using the 24-hour format if it represrents the time in the evening. c) Calculate the total profit made if all four clocks are sold.
28
Activity 1.2.2
(Adapted from NSC May/June P1 2019) Instructions
• You should form groups of 4 – 5
• Duration: 15 minutes
• Refer to the questions provided
• Task 1: Answer all the questions
Task 2: Allocate marks for each question
Task 3: Identify the taxonomy levels for each questions
• These questions are intended to prompt you to consolidate the unit and possible ways in which
this section can be taught
• Report Back and Discussion
• Resources: Training manual, Note pad, Pen and Calculator
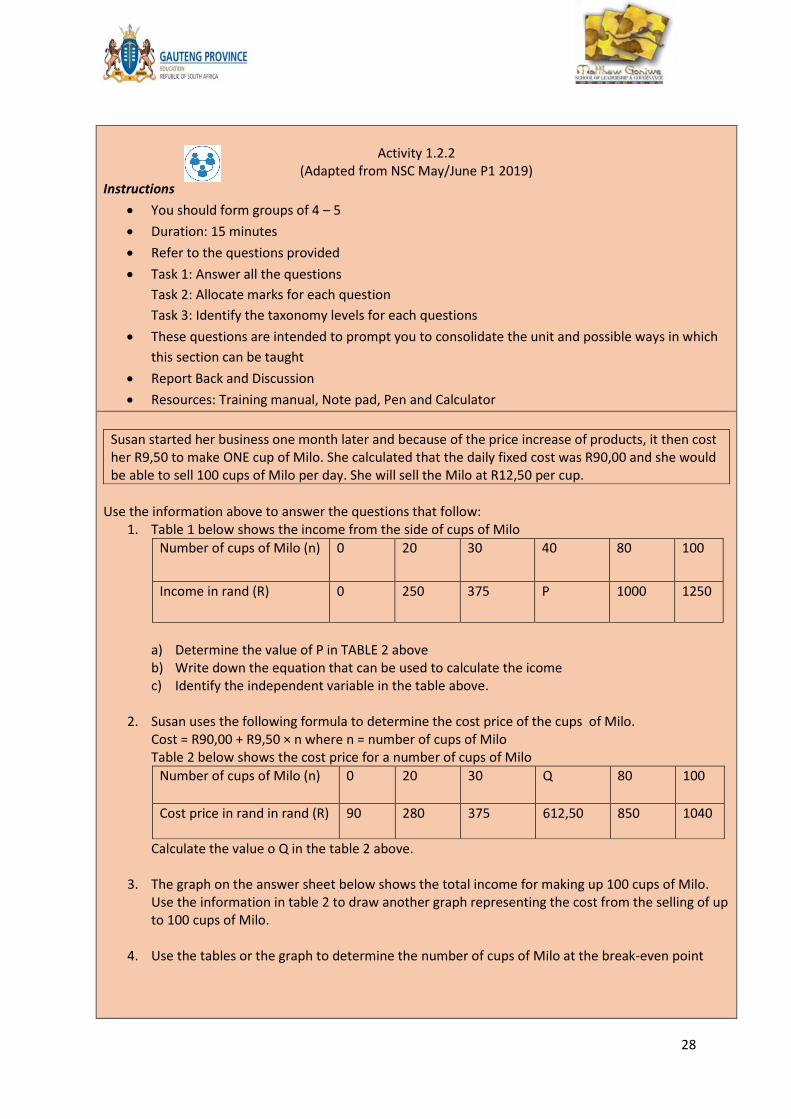
Susan started her business one month later and because of the price increase of products, it then cost her R9,50 to make ONE cup of Milo. She calculated that the daily fixed cost was R90,00 and she would be able to sell 100 cups of Milo per day. She will sell the Milo at R12,50 per cup.
Use the information above to answer the questions that follow:
1. Table 1 below shows the income from the side of cups of Milo
Number of cups of Milo (n) 0 20 30 40 80 100
Income in rand (R) 0 250 375 P 1000 1250
a) Determine the value of P in TABLE 2 above b) Write down the equation that can be used to calculate the icome c) Identify the independent variable in the table above.
2. Susan uses the following formula to determine the cost price of the cups of Milo.
Cost = R90,00 + R9,50 × n where n = number of cups of Milo Table 2 below shows the cost price for a number of cups of Milo
Number of cups of Milo (n) 0 20 30 Q 80 100
Cost price in rand in rand (R) 90 280 375 612,50 850 1040
Calculate the value o Q in the table 2 above.
3. The graph on the answer sheet below shows the total income for making up 100 cups of Milo. Use the information in table 2 to draw another graph representing the cost from the selling of up to 100 cups of Milo.
4. Use the tables or the graph to determine the number of cups of Milo at the break-even point

29

30
ACTIVITY 1.2.3
Individual Work (20 Minutes)
Instructions
• Individual activity
• Duration: 10 minutes
• This activity is intended to advance ICT skills that can be used in the classroom
• Task : Download and save a video lesson on Break Even Analysis
• Report Back and Discussion
• Resources: Training manual, Laptop and Wi-fi
RESOURCES FOR MODULE
• NSC Exam 2018 Diagnostic Report
• www.google.co.za/shopping/product/catalogue
SUMMARY
In this module, participants:
• Worked with Financial documents relating to personal/household/work place/business
• Worked with tariff systems
• Identified and performed calculations involving income, expenditure, profit and loss
values
• Determined and worked with break-even analysis
REFLECTION
• Learners should be afforded opportunities to define terms in their own words, as part of assessment to ensure conceptual understanding.
• Teachers must provide learners with opportunities to extract information from tables as often as possible.
• Teachers should give learners sufficient exercises on how to substitute correct values from tables (correct columns) into a given formula.
• Teachers should encourage candidates to use the LOLT always during the lessons. Scenarios should be discussed and critically analysed during lessons to give learners the opportunity to think critically and develop analytical and problem-solving skills.
END OF MODULE 1

31
MODULE 2: DATA HANDLING
INTRODUCTION
In this module you will look at the concept of Data Handling with specific focus on Developing
questions; Collecting data; Classifying data; Organising Data; Summarising Data; Representing data;
Interpreting data and Analysing data.
OVERVIEW
In this topic, you will work with complex projects in familiar and unfamiliar contexts
SPECIFIC OBJECTIVES
At the end of this module you will be able to:
• Develop investigative questions
• Collect data using appropriate instruments and methods
• Summarise data collected
• Organise and represent data
• Interpret and discuss data
GLOSSARY OF TERMS
TERMS MEANING
Bar graph 900 graph using bars to show frequencies (horizontal and vertical graph), the
vertical heights of a set of bars of equal breath represent the values of the
dependant variable in a data set.
Box-and-whisker
plot
Diagram that statisticians use to show the distribution of data along a number line
divided into quartiles.
Classify Identify the type or class.
Continuous data Numerical data (measurements like weight or age)
Data Information, series of observations, measurements, facts; collection and recording
of information for statistical investigation.
Data collection
sheet
Two-column table showing what is observed and how many times it was observed;
items of information.
Discrete Separate; distinct; opposite of continuous.
Discrete data Numerical data (fixed numbers like size of family); data that can have only certain
values (quantities that can be counted, usually whole numbers)
Equivalent Quantities that have the same value.
Frequency table Table showing frequencies in organised form; table summarising the frequencies
of all the data values in a data set.
Group Put into classes, sort, arrange, organise.

32
Histogram 900 graph using adjacent bars to show frequencies of either continuous numerical
data or discrete numerical data with many different values; areas of rectangles
(continues; no gaps between them) show frequency of classes of data (breadth 5
class; height 5 frequency)
Horizontal bar
graph
900 bar graph using horizontal bars to compare or rank items like household sizes
in a block of flats.
Interview Record data by talking to someone face to face or over the telephone.
Investigate Examine; look into; study.
Mean Average of the values in a data set; 5 sum of all the observed values divided by
the number of observations.
Mean [of a set of
data]
Average; sum of all data values divided by the number of data values.
Measures of central
tendency
Numbers that tell more about the balance (middle values) in a data set (mode;
median; mean)
Measures of spread Numbers that tell how far data values in a data set lie apart; spread of numerical
data set (range, quartiles, percentiles)
Median Middle value in an ordered data set.
Median [of a set of
data]
Value that cuts an ordered data set in half.
Mode Value or values appearing most often in a data set.
Mode of a set of
data
Most common data value in a data set.
Observation Recording of data by watching someone or something closely.
Outliers Data value that lies an abnormal distance from the other data values in the data
set.
Population Entire source of data involved in an investigation; all the subjects included in a
study or survey in order to draw conclusions about that population as a whole.
Quartiles The values that divide a list of numbers into four equal parts
Questionnaire List of questions that can be used to collect data.
Range [of a data
set]
Difference between the highest and lowest values in a data set.
Related [data sets] Linked; connected.
Represent[data] Draw; graph
Representative
sample
Sample likely to give results similar to those obtained from studying the whole
population.
Sample Subset (small group) chosen from the population to represent the population.
33
Sampling Choosing a representative sample
Sort Put, organise into categories.
Survey Collect data from a group of people or objects.
Survey [biased] Survey containing factors that produce answers that do not represent a truthful
picture of the situation.
Variable A quantity that can take different values in a situation.
Vertical bar graph 900 bar graph using vertical bars to show change over time at discrete times like
absentees per day for three weeks.
CONTENT
You will study this module through the following units
UNIT 1 DEVELOPING QUESTIONS; COLLECTING DATA AND CLASSIFYING DATA
UNIT 2 SUMMARIZING DATA; REPRESENTING DATA; INTERPRETING DATA AND ANALYSING DATA
UNIT 3 MEASUREMENT: MEASURING WEIGHT
UNIT 1: DEVELOPING QUESTIONS; COLLECTING DATA AND CLASSIFYING DATA
INTRODUCTION
In this unit you will look at the concept of:
• Developing questions
• Collecting data
• Classifying data
LEARNING OUTCOME
At the end of this Unit, you should be able to:
• Develop questions that require the collection of data
• Use appropriate instrument to collect data
• Classify the collected data as categorical or numerical
• Organise the collected data using tallies and frequency tables

34
LESSON NOTES
2.1. DATA HANDLING
• Data handling: Is a process of collecting data, classifying, organising, summarising, analysing, representing and interpreting data.
• Data refers to the information, a series of observations, measurements, facts; collecting
and recording information for purposes of statistical investigation.
• Qualitative versus Quantitative Data can be qualitative or quantitative.
✓ Qualitative data is descriptive information (it describes something) ✓ Quantitative data is numerical information (numbers)
Data
Qualitative Quantitative
Discrete Continuous
✓ Quantitative data can also be discrete or continuous:
✓ Discrete data can only take certain values
✓ Continuous data can take any value (within a range)
• Data is limited to contexts related to the personal lives of learners, wider social issues and national and global issues.
• These are scenario involving daily life, workplace and business environment, social, national and global issues.
• The statistical process is made up of inter-connected stages:
Steps of statistical processes:
✓ Developing questions ✓ Collecting data ✓ Classifying and Organising data ✓ Summarising data ✓ Representing data ✓ Interpreting and Analysing data
35
• It is important that learners understand the inter-connectedness of the statistical process and that these processes are taught and assessed at related stages.
2.1.1. Developing Questions:
• A statistical question is one that can be answered by collecting data where there are single, double and multiple sets of data that contains multiple categories.
• Examples: ✓ Single sets of data: working with different test scores categorised into mark categories for an
entire class; test and exam results; height and weight of data of learners in a class; number of learners in each grade; data on telephone call time and duration.
✓ Double sets of data: working with different test scores categorised into mark categories and organised according to gender; vehicle statistics of shoppers at a shopping centre; sport results statistics for provincial and national sport events; data on housing; water and electricity facilities for a small community.
✓ Multiple sets of data: national and provincial (health, education, road accident, population) statistics; complex values that is always expressed in millions or large data values containing decimal values
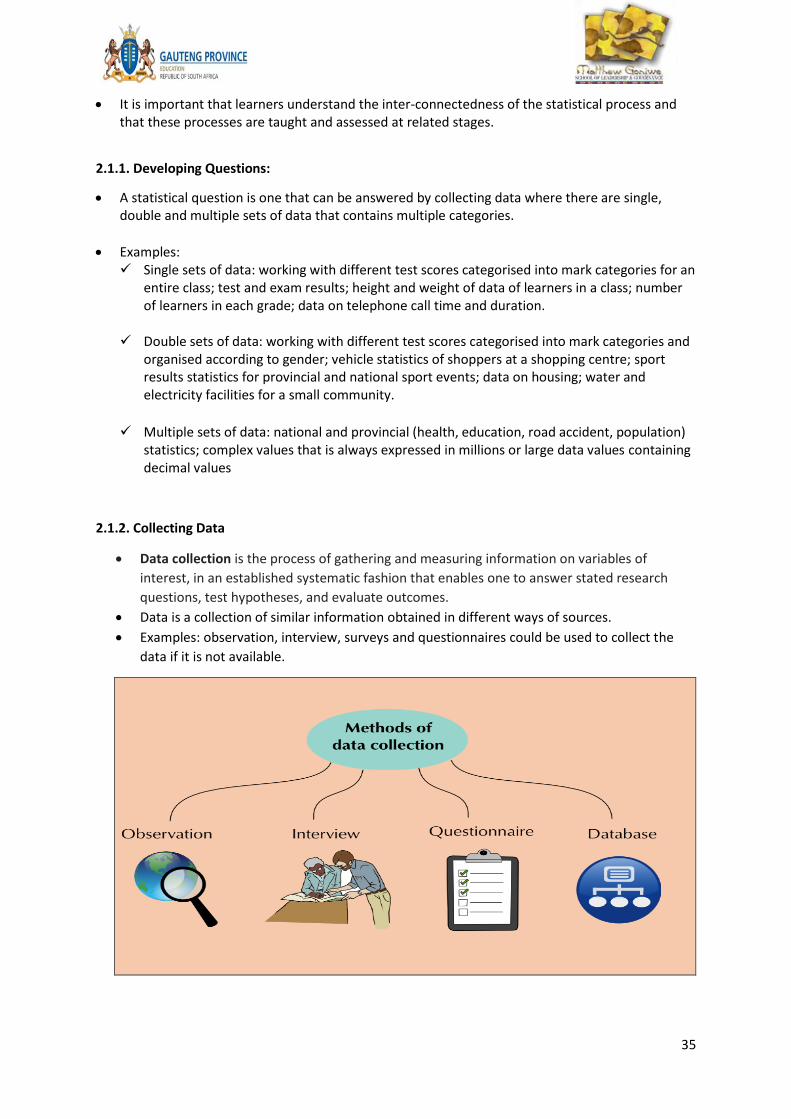
2.1.2. Collecting Data
• Data collection is the process of gathering and measuring information on variables of
interest, in an established systematic fashion that enables one to answer stated research
questions, test hypotheses, and evaluate outcomes.
• Data is a collection of similar information obtained in different ways of sources.
• Examples: observation, interview, surveys and questionnaires could be used to collect the
data if it is not available.

36
2.1.3. Classifying and Organising Data
• Data collected in original form is called raw data.
• Data can be classified into two types: ✓ Categorical data: Qualitative data, usually collected through observation and is
descriptive. E.g. colour, texture, etc. ✓ Numerical data: Quantitative data consisting of numerical values.
• There are 2 types of numerical data: ✓ Discreet data :
- It is data based on counts, it is data that can be associated with a specific value. - Bar graph represents discreet data only
✓ Continuous data: - Data representing series of values or values grouped into categories. - Histogram represents continuous data.
• A frequency distribution is the organisation of raw data in table form, using classes and frequencies.
• The data can be placed in categories and organized in categorical frequency distributions.
• Example:
Data collected can be grouped using intervals, frequency tables and tallies.
• A survey can be used to gather information about a group. Often, a part of the group, called a
sample, is chosen to represent the whole group or population.
• A sample must represent the population fairly. In a random sample, each person in the
population has an equal chance of being chosen.
• A statistic is biased if it is calculated in such a way that it is systematically different from the
population parameter being estimated eg when certain individuals are being more likely to be
selected than others.
• An estimator or decision rule with zero bias is called unbiased.
• Analysing information involves identifying and describing trends(patterns in data represented in
tables/graphs and explain what the data indicates about the question/problem for which the
data was collected.

37
ACTIVITY 2.1.1 Instructions
• You should form groups of 4 – 5
• Duration: 15 minutes
• Refer to the questions provided
• Task 1: Answer all the questions Task 2: Allocate marks for each question Task 3: Identify the taxonomy levels for each questions
• These questions are intended to prompt you to consolidate the unit and possible ways in which this section can be taught
• Report Back and Discussion
• Resources: Training manual, Note pad, Pen and Calculator
• Use the topics below to answer the following questions: a) Develop an investigative question and 3 sub-questions. b) Identify the method and instrument you would use to collect the following
data. c) Indicate whether you would use the population or sample d) If you use a sample, what demographic factors would you control?
• Population of South Africa, per province, gender and population group for 2016
• The distance (in km) that the learners from exhibition high school walked from home to school daily.
• The marks of Mathematical Literacy top achievers in Matric for the year 2019.
• The annual salaries ( in Rands ) of the top 9 highest paying jobs in South Africa
• The distribution of deaths by province and the province of usual residence of the deceased.
• Number of children receiving foster care and child support care grants for 2016/2017 and 2017/2018.
e) Choose 1 topic from the given ones and download the data. Use tally tables to organise the data.

38
UNIT 2: SUMMARIZING DATA; REPRESENTING DATA; INTERPRETING DATA AND ANALYSING DATA
INTRODUCTION
In this unit you will look at the concept of:
• Summarising data
• Representing data
• Interpreting data
• Analysing data
LEARNING OUTCOME
At the end of this Unit, you should be able to:
• Summarise the collected data using measures of central tendency and measures of spread
• Analyse the collected data presented in the graphs
• Represent the collected data using appropriate graphs
• Read the collected data from the graphs
LESSON NOTES
2.2.1. Summarising Data
• Collected data can be summarised by using the following measures of central tendency and spread. ✓ Summarise single sets (personal lives) of collected data. ✓ Summarise and compare two sets (wider community) and multiple sets (national and global
issues) of collected data using the following measures of central tendency and spread.
• Measure of central tendency

39
• Measure of spread/dispersion
• Example 1:

40
• Example 2:
• Box and Whisker Plot
✓ The box and whisker plot is a diagram showing statistical distribution of a data set.
✓ Learners are only expected to interpret not draw, they should be able to locate
minimum, maximum, median and quartile values
(the five number summary on the plot)
✓ Box and whisker plots as graphical representation of quartiles:
• Diagram 1

41
• Diagram 2
• Diagram 3
• Percentiles
Student Growth Percentile (SGP) Characteristics Percentiles express the percentage of students that fall below a certain score SGPs are reported between 1 and 99.

42
2.2.2. Representing and Interpreting Data
• Data can be represented through the use of graphs. Different graphs displaying the
same data can convey different messages, so selecting the graph that best
represents the data is important.
• Examples of bar graph, histogram, line graph and pie chart
NB: Learners are not expected to draw a pie chart but must be able to interpret
and read values.
• Bar graph versus Histogram

43
• Problem solving
• Problem solving

44
Activity 2.2.1
(Adapted from NSC May/June P1 2019 and NSC Nov 2019) Instructions
• You should form groups of 4 – 5
• Duration: 15 minutes
• Refer to the questions provided
• Task 1: Answer all the questions
Task 2: Allocate marks for each question
Task 3: Identify the taxonomy levels for each questions
• These questions are intended to prompt you to consolidate the unit and possible ways in which
this section can be taught
• Report Back and Discussion
Resources: Training manual, Note pad, Pen and Calculator
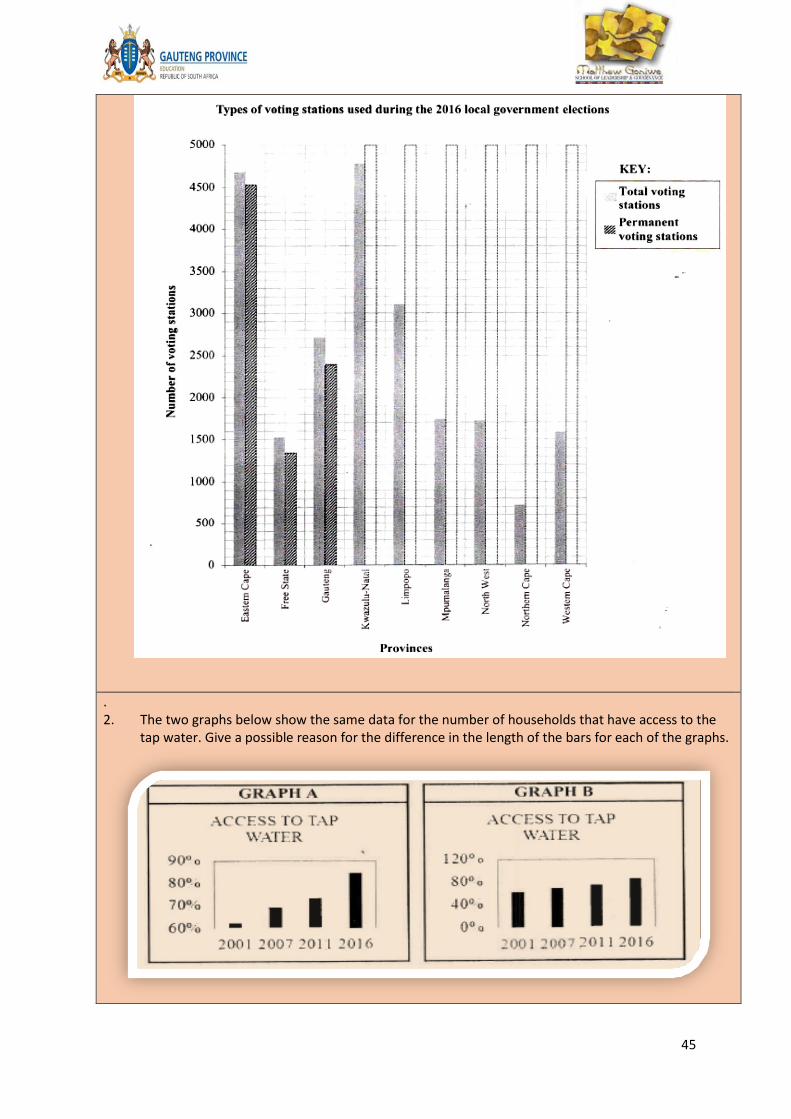
The table below shows the types of voting stations (VSs) used during the 2016 local government elections
in South Africa.
PROVINCE VSs PERMANENT TEMPORARY MOBILE
EC 4 699 4535 161 3
FS 1 531 1342 189 0
GP 2 716 2389 327 0
KZN 4 792 4647 133 12
LP 3 111 2966 145 0
MP 1 744 1650 82 12
NW 1 723 1605 115 3
NC 710 684 26 0
WC 1 586 1534 50 2
TOTAL 22 612 21352 1228 32
1.
a) Name a type of instrument used to collect this data.
b) State the province which has the most voting stations.
c) Determine the mean number of voting stations (VSs) in South Africa.
d) Write down the modal number of mobile voting stations in South Africa
e) Determibe the total number of temporary VSs as a percentage of the total number of VSs in South
Africa.
f) Show how the value of 145 was calculated.
g) The bar graph on the answer sheet below shows the total number of voting stations.
On the same Answer Sheet, the first three bars are drawn showing the permanent voting stations.
Fill in the remaining bar graphs showing the permanent voting stations.
45
. 2. The two graphs below show the same data for the number of households that have access to the
tap water. Give a possible reason for the difference in the length of the bars for each of the graphs.

46
Activity 2.2.2 (Adapted from NSC May/June P2 2019)
Instructions
• You should form groups of 4 – 5
• Duration: 15 minutes
• Refer to the questions provided
• Task 1: Answer all the questions
Task 2: Allocate marks for each question
Task 3: Identify the taxonomy levels for each questions
• These questions are intended to prompt you to consolidate the unit and possible ways in which this
section can be taught
• Report Back and Discussion
• Resources: Training manual, Note pad, Pen and Calculator
Matuli, Bianca and Khotso wrote some practice tests at their school. Their percentage marks are given in the
table below.
Note:
• Bianca’s median percentage mark is 60%
• Matuli’s mean percentage mark is 62,5%
• Khotso’s median percentage mark and range are both 60% and marks are ordered
1. Use the information above to answer the questions that follow:
a) Calculate Matuli’s median percentage mark.
b) Calculate Bianca’s mean percentage mark
c) The box and whisker diagram below represents the spread of Khotso’s percentage marks
d)
Determine the missing value C, the lower quartile mark, if Khotso’s interquartile range (IQR) is 16.
e) Bianca stated that Matuli performed better than she did in the practice tests.
Give TWO possible reasons to support Bianca’s statement.

47
ACTIVITY 2.2.3
Individual Work (20 Minutes)
Instructions
• Individual activity
• Duration: 10 minutes
• This activity is intended to advance ICT skills that can be used in the classroom
• Task : Download and save a video lesson on Box and Whisker Plot
• Report Back and Discussion
• Resources: Training manual, Laptop and Wi-fi
Activity 2.2.4 (Adapted from NSC Nov P2 2019)
Instructions
• You should form groups of 4 – 5
• Duration: 20 minutes
• Refer to the questions provided
• Task 1: Answer all the questions
Task 2: Allocate marks for each question
Task 3: Identify the taxonomy levels for each questions
• These questions are intended to prompt you to consolidate the unit and possible ways in which
this section can be taught
• Report Back and Discussion
• Resources: Training manual, Note pad, Pen and Calculato
48
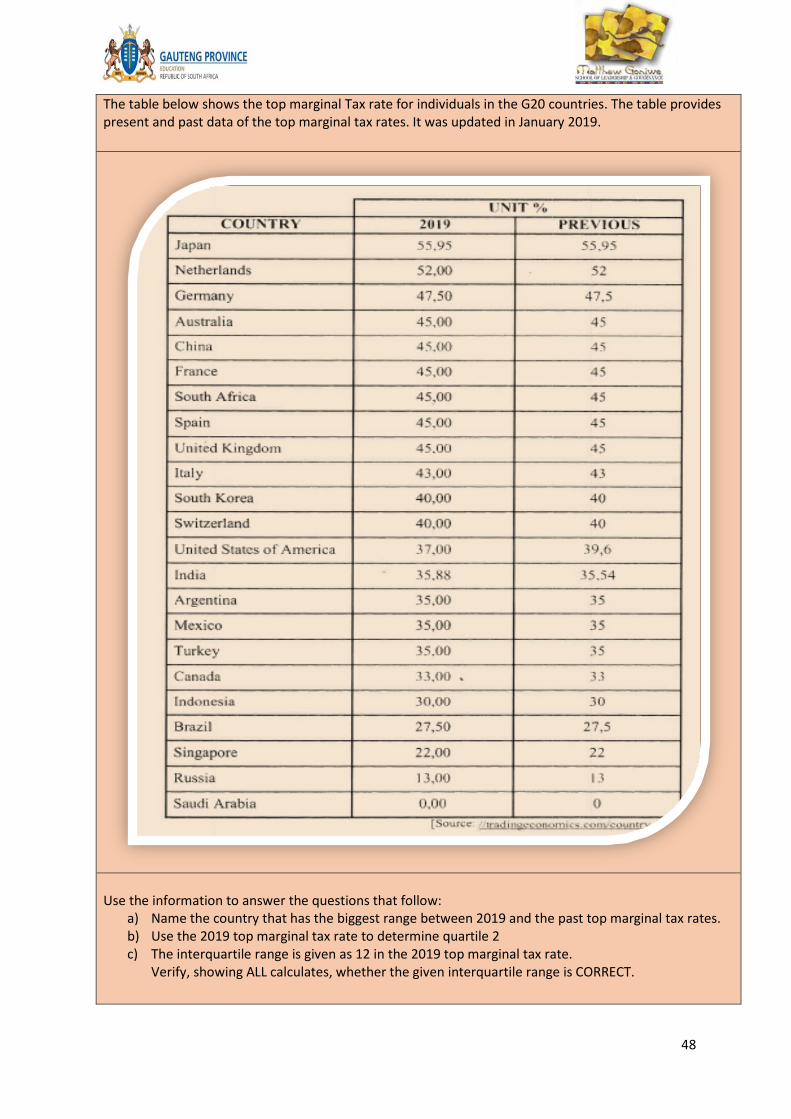
The table below shows the top marginal Tax rate for individuals in the G20 countries. The table provides present and past data of the top marginal tax rates. It was updated in January 2019.
Use the information to answer the questions that follow:
a) Name the country that has the biggest range between 2019 and the past top marginal tax rates. b) Use the 2019 top marginal tax rate to determine quartile 2 c) The interquartile range is given as 12 in the 2019 top marginal tax rate.
Verify, showing ALL calculates, whether the given interquartile range is CORRECT.

49
UNIT 3: MEASUREMENT: MEASURING WEIGHT
INTRODUCTION
In this unit you will look at the concept of:
• Body Mass Index (BMI)
• Growth Chat
LEARNING OUTCOME
At the end of this Unit, you should be able to:
• Determine the weight/mass using appropriate measuring instrument
• Use recorded weight/mass data together with recorded length/height data to calculate Body
Mass Index values and determine weight status for adults
• Calculate values using a formula involving mass/weight
GLOSSARY OF TERMS
Body mass index
(BMI)
A number calculated from an adult’s weight and height, expressed in units of
kg/m2
Growth charts Graphs consisting of a series of percentile curves that show the distribution of
the growth measurements of children.
Mass/Weight Mass/Weight is an indication of how heavy an object is.
LESSON NOTES 2.3.1. Body mass Index
• Obesity means being grossly overweight
• One of the measures used to calculate whether a person is healthy or not is called the Body Mass Index (BMI).
• The Body Mass Index (BMI), estimates the ideal weight of a person based on its size and weight.
• The Body Mass Index is valid for an adults between 18 – 65 years
• The World Health Organisation (WHO) defines this body mass index as the standard for measuring the risks associated with adults who are overweight.
• A high BMI is associated with increased risk of death.
• The risk of death increases the more overweight a person is for adults for cancer or other diseases.
• BMI is, however, much more reliable.
• It´s the result of a calculation between your weight and height, and gives you the possible risks to your health.
• Body mass index is defined as the individual's body mass divided by the square of their height.

50
• BMI can also be determined using a BMI chart, which displays BMI as a function of weight
(horizontal axis) and height (vertical axis) using contour lines for different values of BMI or colours for different BMI categories.

51
Activity 2.3.1 (Adapted from NSC May/June P1 2019)
Instructions
• You should form groups of 4 – 5
• Duration: 15 minutes
• Refer to the questions provided
• Task 1: Answer all the questions
Task 2: Allocate marks for each question
Task 3: Identify the taxonomy levels for each questions
• These questions are intended to prompt you to consolidate the unit and possible ways in which
this section can be taught
• Report Back and Discussion
• Resources: Training manual, Note pad, Pen and Calculator
Use the information above to answer the questions that follow: a) Determine if a 37 year old man with a WHR of 0,95 has a moderate or a high risk of obesity b) A 50 year old man has the following measurements:
Waist = 105 cm; hip = 92 cm, Calculate this man’s WHR. c) A woman with a waist of 72 cm has a WHR equal to 0,7826 and is classified as a moderate risk.
I. State the possible age group of this woman II. Calculate the woman’s hip measurement. Round off your answer to the nearest cm.

52
ACTIVITY 2.3.2
Instructions
• Individual activity
• Duration: 20 minutes
• Refer to the questions provided
• Task 1: Answer the questions
Task 2: Identify the taxonomy levels for each question
Task 3: Show mark allocation
• These questions are intended to prompt you to consolidate the unit and possible ways in
which this section can be taught
Report Back and Discussion
Gladys is studying to become a doctor. She uses the body mass index table to check the health
status of her patients so that she can advise them accordingly.
BMI range and Health Status
BMI Range Health Status
20 < BMI <25 Health weight
25 < BMI < 30 Overweight
BMI > 30 Obese
Below is the information of patients gathered by Gladys
Name Heights in cm Weight in kg BMI
Basani 157 71 28,8
Edith 162 58 22,1
Lerato 173 75 25,1
Lufuno 167 76 27,3
Petrus 182 85 25,7
Willem 178 70 22,1
Zane 172 A 26,0
Yvonne B 94 30,3
Use the tables above to answer the questions that follow:

53
1. Calculate the missing value A, to the nearest kg. You may use the BMI formula.
2. List people from the table with overweight range.
3. Determine the modal BMI.
4. Calculate the missing value B, if the mean height is 170,875cm
5. Calculate the range of the height
6. Gladys states that the interquartile range of the BMI is 8,1kg/m2. Verify, showing ALL
calculations, whether her statement is valid. You may use the IQR formula
ACTIVITY 2.3.3
Instructions
• Individual activity
• Duration: 10 minutes
• Refer to the questions provided
• Task 1: Develop possible questions based on the resources
• Task 2: Identify the taxonomy level
Task 3: Show mark allocation
• These questions are intended to prompt you to consolidate the unit and possible ways in
which this section can be taught
• Report Back and Discussion
BMI-FOR-AGE PERCENTILE RANGE WEIGHT STATUS
< 5th percentile Underweight
5th to <85th percentile Healthy
85th to < 95th percentile Risk of overweight
≥ 95th percentile Overweight

54

55
ACTIVITY 2.3.4
Instructions
• Individual activity
• Duration: 15 minutes
• Refer to the questions provided
• Task 1: Answer the questions
Task 2: Show mark allocation
Task 3: Identify the taxonomy level
• These questions are intended to prompt you to consolidate the unit and possible ways in
which this section can be taught
• Report Back and Discussion
• Sandra started walking to get fit and stay in shape. She recorded her times and distances by
using the Endomondo app on her smartphone. Dates and starting times of the practicing
session are also recorded. Her statistics for November and December is shown on the table
below.
Study the data given below to answer the questions that follow.
1. How far did Sandra walk in December 2017?
2. Calculate the total time that Sandra walked in November.
3. How far did Sandra walk on the 22 December 2017?
4. What time did Sandra finish her walking on 26 December 2017?
5. Sandra’s Height is 160 cm and her weight is 80 kg. She claimed that her BMI will be less than
30 kg/m2. Verify her claim

56
ACTIVITY 4.1.4. Group Discussion (15 Minutes)
Instructions
• Youshould form groups of 4 – 5
• Refer to the questions provided
• Task 1: Answer the questions and allocate marks or indicate where marks are allocated.
Task 2: Identify the taxonomy levels for each question
• These questions are intended to prompt youto consolidate the unit and possible ways in
which this section can be taught
• Report Back and Discussion
• Resources: Training manual, Note pad, Pen and Calculator
The family joined a fitness competition in the hotel they logged in. The youmust have a BMI of
normal weight.
BMI MEANING PERCENTILE POSITION ON GROWTH CHART
Below 18,5 Underweight (UW) Less than 5th percentile
18,5 – 24,9 Normal Weight (NW) ≥ 5th percentile and < 85th percentile
25 –29,9 Overweight (OW) ≥ 85th and < 95th percentile
30 and above Obese (OB) ≥ 95th percentile
The following information was recorded from the participants:
Participant A B C D E F G H I
Height (m) 1.69 1.53 1.50 1.54 1.67 1.52 1.35 1.53 1.79
Mass(kg) 68 46 73 60 67 57 43 40 62
Weight
status
NW NW OB OW NW OW NW UW NW
1. Justify by calculation that participant H is underweight. You may use BMIU formula.
2. Which youmet the criteria for competing?
3. What is the range of the mass of the youwho did not qualif
ACTIVITY 2.3.5
Instructions
• You should form groups of 4 – 5
• Duration: 15 minutes
• Refer to the questions provided
• Task 1: Answer the questions and allocate marks or indicate where marks are allocated.
Task 2: Identify the taxonomy levels for each question
• These questions are intended to prompt you to consolidate the unit and possible ways in
which this section can be taught
• Report Back and Discussion
• Resources: Training manual, Note pad, Pen and Calculator
The family joined a fitness competition in the hotel they logged in. They must have a BMI of
normal weight.
BMI MEANING PERCENTILE POSITION ON GROWTH CHART
Below 18,5 Underweight (UW) Less than 5th percentile
18,5 – 24,9 Normal Weight (NW) ≥ 5th percentile and < 85th percentile
25 –29,9 Overweight (OW) ≥ 85th and < 95th percentile
30 and above Obese (OB) ≥ 95th percentile
The following information was recorded from the participants:
Participant A B C D E F G H I
Height (m) 1.69 1.53 1.50 1.54 1.67 1.52 1.35 1.53 1.79
Mass(kg) 68 46 73 60 67 57 43 40 62
Weight status NW NW OB OW NW OW NW UW NW
1. Justify by calculation that participant H is underweight. You may use BMIU formula.
2. Which participants met the criteria for competing?
3. What is the range of the mass of the participants who did not qualify?
4. Show that the median of the height of qualifying participants is 1,67m
5. Show that the median of the height of qualifying participants is 1,67m
6. What do you think may be the reason people become overweight? Give two reasons

57
LESSON NOTES 2.3.2. GROWTH CHARTS
• Percentiles are measures of spread which divide the data into 100 equal portions. This is
used to analyse the spread of large sets of data like data collected by census. The data is
then divided into 100 portions and the report is given as a percentage.
• The value at the 5th
percentile implies that 5% of values lie below 5th
percentile and 95%
of the values lie above the 5th
percentile.
• The value at quartile 1 implies that 25% of the values lie below 25th
percentile and 75% of
the values lie above the 25th
percentile.
• The concept of the percentiles is used when the data is large. This concept will be used in
growth charts. The curve on the growth chart represents the percentile values of the
collected data from different age groups .E.g. height, length, weight, circumference of the
head.
• The growth chart is used to compare the BMI of an individual versus the one of their age
group. This is also used to determine the health status of individuals.
• 3 types of questions should be covered:
✓ Reading information from the chart
✓ Understanding significance of the curve
✓ Understanding significance of positioning on the chart

58
ACTIVITY 2.3.6.
Individual Work (20 Minutes)
Instructions
• Individual activity
• Refer to the questions provided
• Task 1: Answer the questions
Task 2: Show mark allocation
• These questions are intended to prompt youto consolidate the unit and possible ways in
which this section can be taught
• Report Back and Discussion
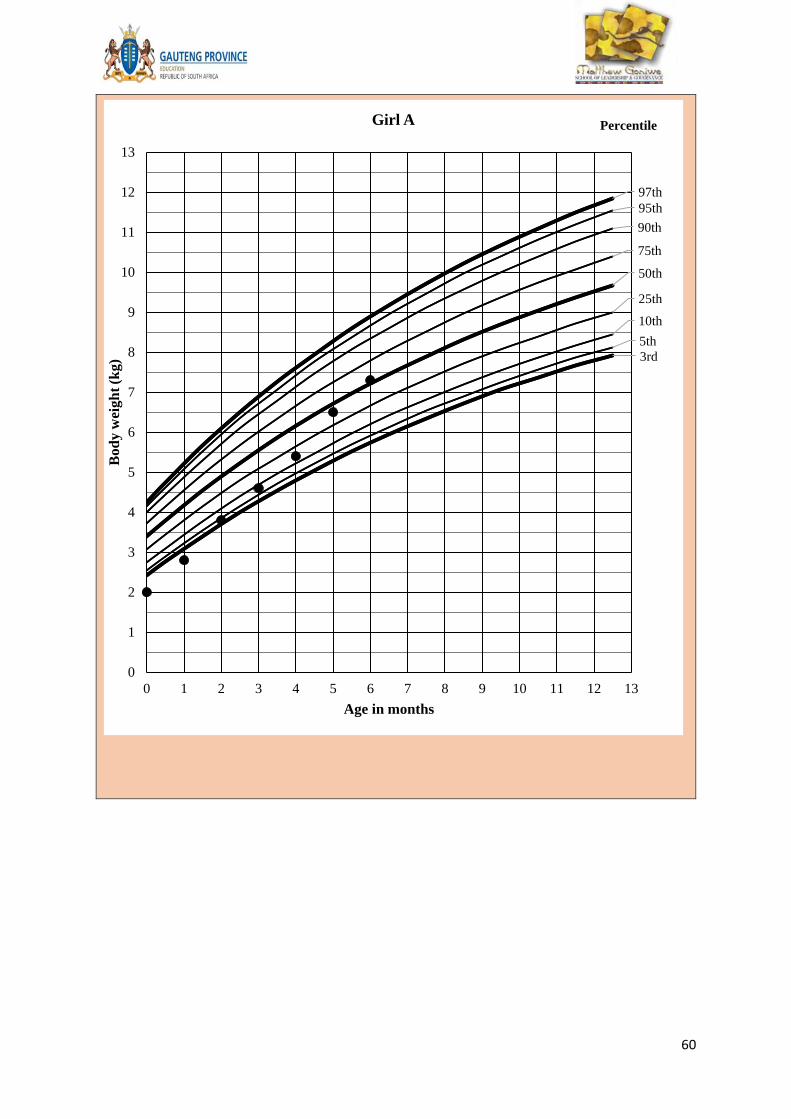
Mrs Dubula gave birth to triplets. The weight of the triplets over the first 6 months are given in
the table below along with the growth charts for Girl A and the boy on ANNEXURE C.
TABLE 6: GROWTH RATE OF TRIPLETS
Girl A Boy Girl B
Weight in kg
Birth 2,0 2,1 2,0
Month 1 2,8 2,8 2,4
Month 2 3,8 4,5 3,7
Month 3 4,6 5,3 4,4
Month 4 5,4 6,5 5,5
59
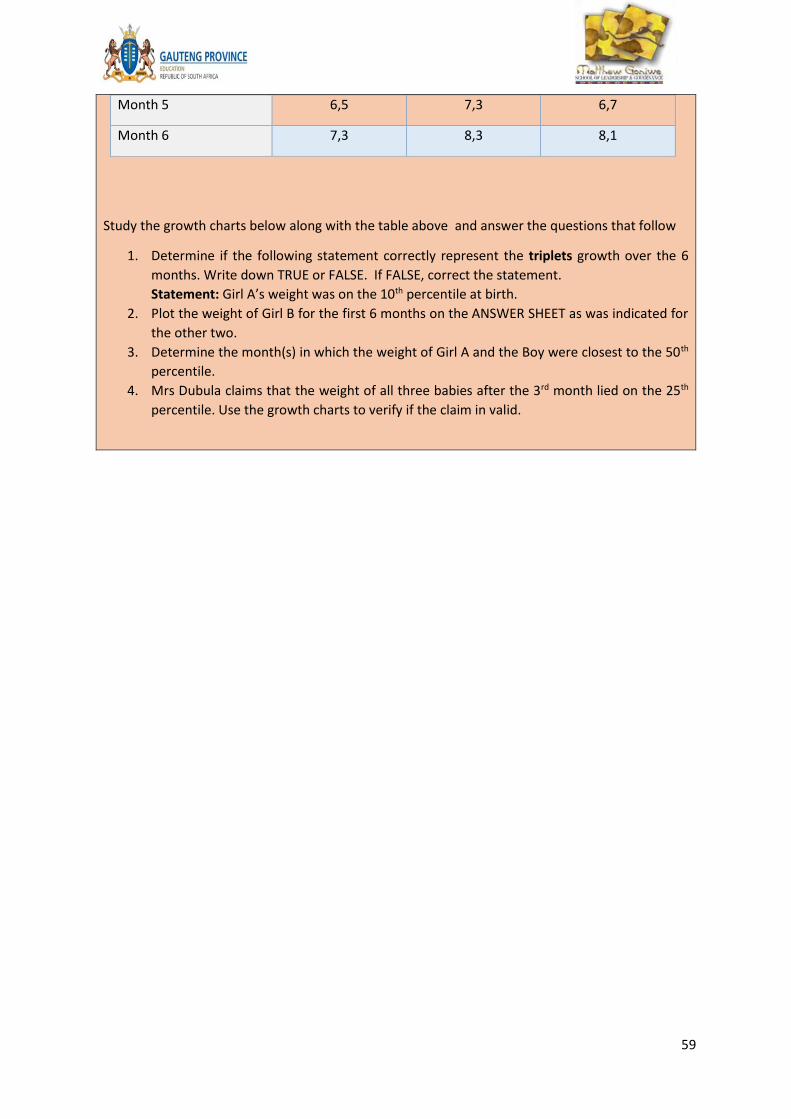
Month 5 6,5 7,3 6,7
Month 6 7,3 8,3 8,1
Study the growth charts below along with the table above and answer the questions that follow
1. Determine if the following statement correctly represent the triplets growth over the 6
months. Write down TRUE or FALSE. If FALSE, correct the statement.
Statement: Girl A’s weight was on the 10th percentile at birth.
2. Plot the weight of Girl B for the first 6 months on the ANSWER SHEET as was indicated for
the other two.
3. Determine the month(s) in which the weight of Girl A and the Boy were closest to the 50th
percentile.
4. Mrs Dubula claims that the weight of all three babies after the 3rd month lied on the 25th
percentile. Use the growth charts to verify if the claim in valid.
60
3rd
5th
10th
25th
50th
75th
90th
95th
97th
0
1
2
3
4
5
6
7
8
9
10
11
12
13
0 1 2 3 4 5 6 7 8 9 10 11 12 13
Bod
y w
eig
ht
(kg
)
Age in months
Girl A Percentile

61
3rd
5th
10th
25th
50th
75th
90th
95th
97th
0
1
2
3
4
5
6
7
8
9
10
11
12
13
0 1 2 3 4 5 6 7 8 9 10 11 12 13
Bod
y w
eigh
t (k
g)
Age in months
BoyPercentiles:
62
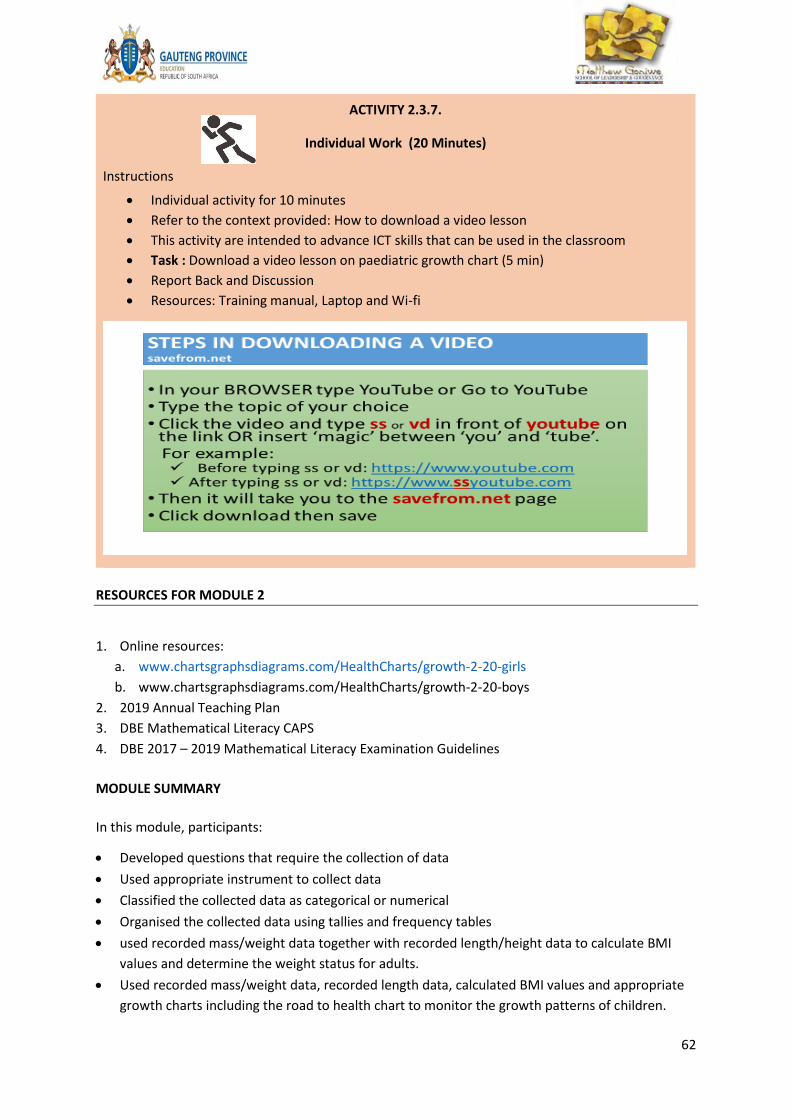
ACTIVITY 2.3.7.
Individual Work (20 Minutes)
Instructions
• Individual activity for 10 minutes
• Refer to the context provided: How to download a video lesson
• This activity are intended to advance ICT skills that can be used in the classroom
• Task : Download a video lesson on paediatric growth chart (5 min)
• Report Back and Discussion
• Resources: Training manual, Laptop and Wi-fi
RESOURCES FOR MODULE 2
1. Online resources:
a. www.chartsgraphsdiagrams.com/HealthCharts/growth-2-20-girls
b. www.chartsgraphsdiagrams.com/HealthCharts/growth-2-20-boys
2. 2019 Annual Teaching Plan
3. DBE Mathematical Literacy CAPS
4. DBE 2017 – 2019 Mathematical Literacy Examination Guidelines
MODULE SUMMARY
In this module, participants:
• Developed questions that require the collection of data
• Used appropriate instrument to collect data
• Classified the collected data as categorical or numerical
• Organised the collected data using tallies and frequency tables
• used recorded mass/weight data together with recorded length/height data to calculate BMI
values and determine the weight status for adults.
• Used recorded mass/weight data, recorded length data, calculated BMI values and appropriate
growth charts including the road to health chart to monitor the growth patterns of children.

63
RESOURCES FOR MODULE 2
• Mathematical Literacy NSC Exam 2018 Diagnostic Report
• Statistics SA reports
• DBE question papers
• Provincial question papers
SUMMARY
In this module, you:
• Represented and interpreted box and whisker plots, pie charts, bar, histogram, line graphs
and scatter plot
• Determined trends in the data and use these to answer questions and make predictions
based on the data
• Read and analyse information from the graph.
REFLECTION
• A careful reading of tables/graphs is a crucial skill in solving mathematical problems. Teachers
should give learners enough opportunities, during contact time, to practise and develop this
skill.
• Teachers must incorporate large numbers in their lessons, across all topics in Mathematical
Literacy. It is advisable that every assessment (formal or informal) task should involve a problem
on big numbers so that learners can familiarise themselves with them.
• Learners should be taught how a trend should be described.
• Teachers should teach learners first to make sense of the information before attempting the
questions.
END OF MODULE 3
CONCLUSION
This is the end of the e-SSIP training and hopefully, it was informative and fruitfully. You have been
equipped with the Term 3 subject content and ICT skills. You have been provided with the teaching
tips on how to approach each sub-topic or content simplification. All of the above mentioned skills
will enable you to manage and enhance teaching, learning and assessment in the classroom
effectively. Please share the knowledge gained with other colleagues within your PLCs.
REFERENCES USED
1. DBE NSC Question Papers, 2014 – 2019
2. GDE Preliminary Question Papers, 2018/19
3. Mathematical Literacy CAPS
4. Other Provinces Preliminary Question Papers, 2018/19
5. 2017 – 19 Examination Guidelines
6. 2019 GDE ATP
END OF THE COURSE MANUAL