Embed Size (px)
Citation preview
Mathematical Literacy Assessment Design: A Dimensionality Analysis of
Programme for International Student Assessment (PISA) Mathematics Framework
Adem Ekmekci Rice University
Ph.D. from The University of Texas at Austin
August 5th, 2013


PISA
• Programme for International Student Assessment
• Assesses 15-year-olders’ knowledge and competencies in mathematics, science, and reading
• OECD – Organisation for Economic Co-operation and Development
• Every 3 years starting in the year 2000 with reading as the main domain
3

Content
Quantity
Space & Shape
Change & Relationship
Uncertainty
Process (Competency Clusters)
Context (Situations)
Personal Educational / Occupational
Public Scientific
4
PISA Math Framework

The Purpose • To investigate the extent to which the
multidimensional nature of PISA’s mathematical literacy (ML) is reflected on the actual items.
• To investigate the extent to which the unidimensionality assumption is reflected on the actual items.
• To monitor the stability of these correspondence between PISA ML framework and the actual items over the three implementation cycles: 2003, 2006, 2009.
5

Dimensionality,Analysis,of,PISA,
Mathematics,Items,,(2003,,2006,,&,2009)
PISA%%Mathematics%
Items%2003,%2006,%&%
2009
PISA’s%Framework%
for%%Mathematics
IRT?based%Psychometric%Methods
Observation Interpretation
Cognition
6
NRC (2001)
O"I$Linkage
C"O$Linkage C?I,Linkage
Conceptual Framework

Participants
• About 200K students from 30 OECD countries for each of 2003, 2006, and 2009 cycles.
• Simple random sampling: 17,000 respondents • Student weights to ensure accurate
representation of PISA population.
7
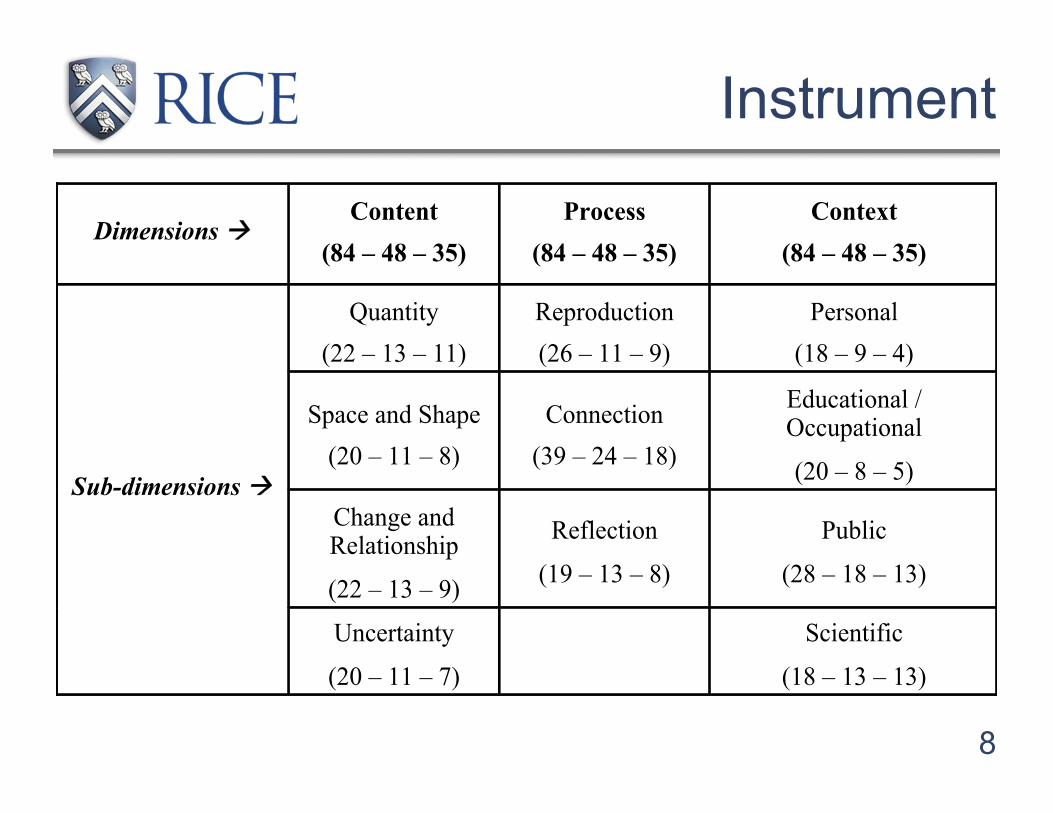
Dimensions ! Content
(84 – 48 – 35)
Process
(84 – 48 – 35)
Context
(84 – 48 – 35)
Sub-dimensions !
Quantity (22 – 13 – 11)
Reproduction (26 – 11 – 9)
Personal (18 – 9 – 4)
Space and Shape (20 – 11 – 8)
Connection (39 – 24 – 18)
Educational / Occupational
(20 – 8 – 5)
Change and Relationship
(22 – 13 – 9)
Reflection
(19 – 13 – 8)
Public
(28 – 18 – 13)
Uncertainty
(20 – 11 – 7) Scientific
(18 – 13 – 13)
Instrument
8
Structural Equation Modeling
• Confirmatory Factor Analytic (CFA) methods were employed.
Models: • One unidimensional model • Three 1-level models (Content, Process,
Context) • Three 2-level models (Content, Process,
Context)
9

10
Models
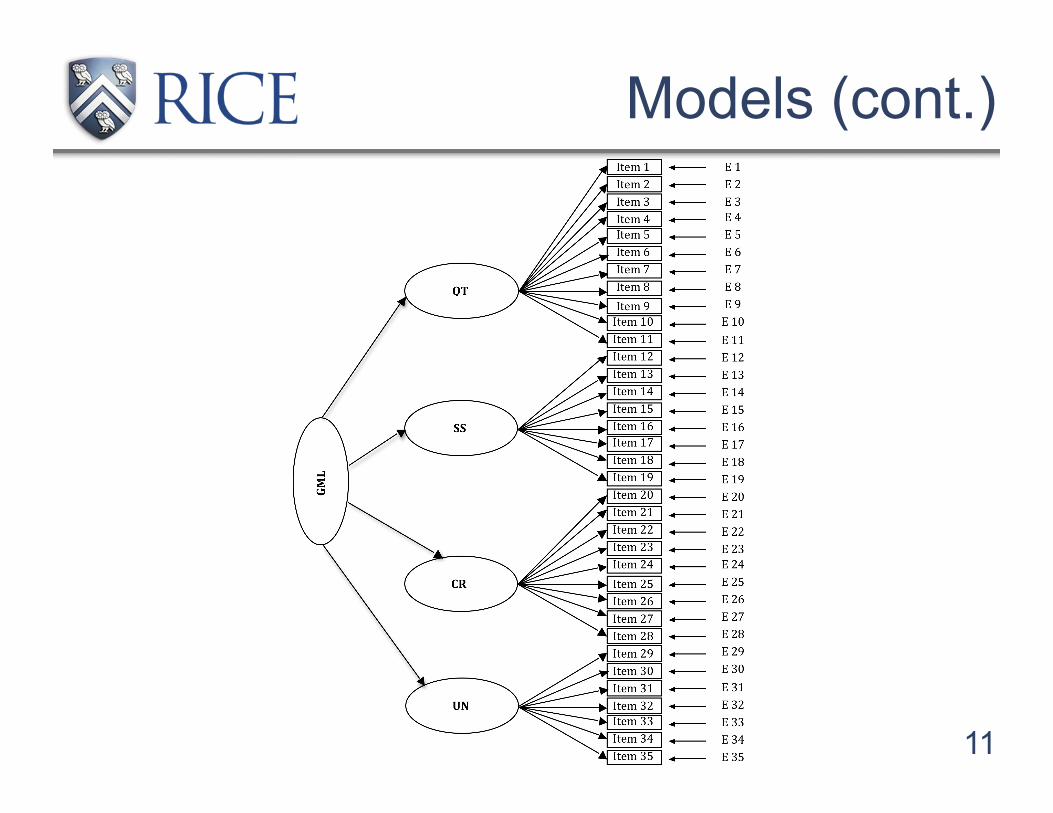
11
Models (cont.)

Research Questions
• What is the correspondence between the dimensional structure of the PISA mathematics items and PISA’s ML framework in terms of the content, process, and context dimensions?
• What is the best representation for the dimensional structure of the PISA mathematics items for implementation cycles 2003, 2006, and 2009?
• How does the dimensional structure of the PISA mathematics items change over time?
12
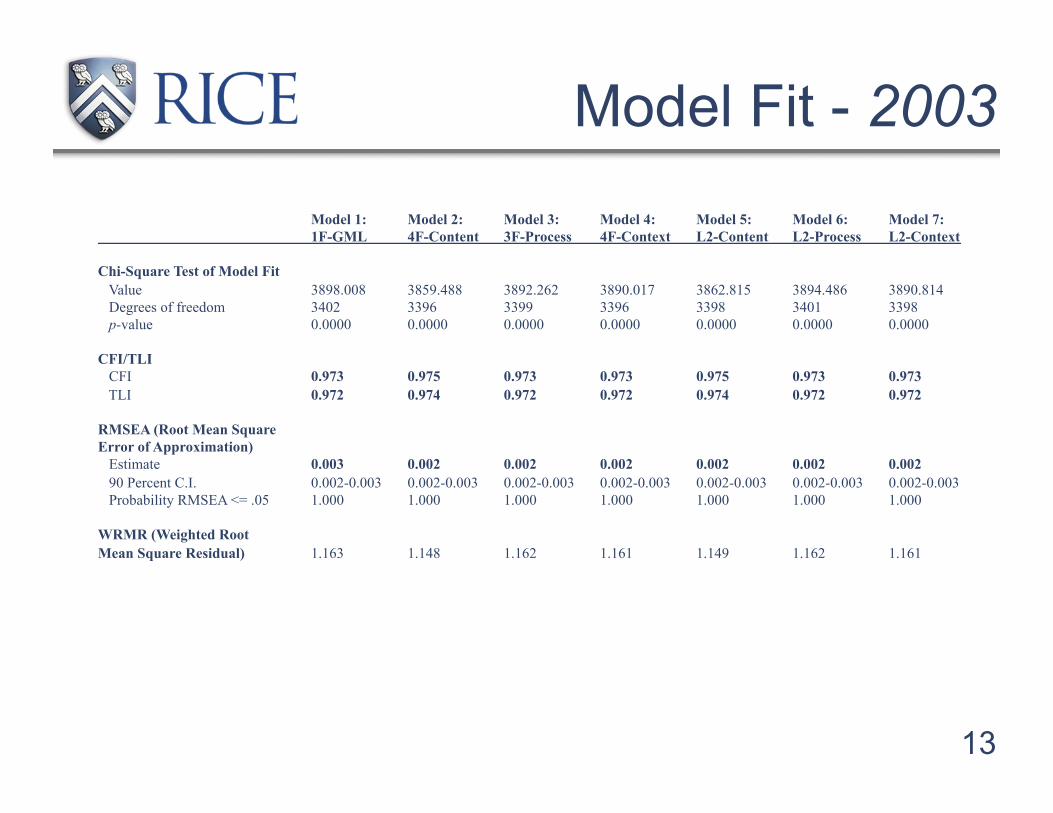
Model Fit - 2003
13
Model 1: Model 2: Model 3: Model 4: Model 5: Model 6: Model 7: 1F-GML 4F-Content 3F-Process 4F-Context L2-Content L2-Process L2-Context
Chi-Square Test of Model Fit Value 3898.008 3859.488 3892.262 3890.017 3862.815 3894.486 3890.814 Degrees of freedom 3402 3396 3399 3396 3398 3401 3398 p-value 0.0000 0.0000 0.0000 0.0000 0.0000 0.0000 0.0000
CFI/TLI CFI 0.973 0.975 0.973 0.973 0.975 0.973 0.973 TLI 0.972 0.974 0.972 0.972 0.974 0.972 0.972
RMSEA (Root Mean Square Error of Approximation) Estimate 0.003 0.002 0.002 0.002 0.002 0.002 0.002 90 Percent C.I. 0.002-0.003 0.002-0.003 0.002-0.003 0.002-0.003 0.002-0.003 0.002-0.003 0.002-0.003 Probability RMSEA <= .05 1.000 1.000 1.000 1.000 1.000 1.000 1.000
WRMR (Weighted Root Mean Square Residual) 1.163 1.148 1.162 1.161 1.149 1.162 1.161

Indi
vidu
al p
aram
eter
s
2003
14

Model Comparisons – 2003
15
Content 2-Level > 1-Level > 1F-GML
Process
1F-GML > 2-Level > 1-Level
Context 1F-GML > 2-Level > 1-Level

2006 & 2009 Results • Only slight changes in the model fit indices • Slight changes in the individual item
parameters • Evidence for multidimensionality and
unidimensionality • Stability across cycles
16

Conclusions
• There is evidence for both unidimensionality and multidimensionality
• Stronger evidence for unidimensionality • Multidimensional nature of ML as described in
the theoretical framework is not well-reflected in the mathematics items
• Weak connection between the cognition and interpretation components of PISA assessment design (NRC, 2001)
17
• Multidimensional representation seems to be reflected better for content
• Multidimensional representation is not well reflected for the process and context dimensions
• Again, evidence for both unidimensionality and multidimensionality
• Consistency in individual item parameters across different models – all constructs could be behaving as one unifying construct.
18
Conclusions (cont.)

Stability across cycles in both • Model-fits and model comparisons • Individual parameter estimates
19
Conclusions (cont.)

Discussion • One of the most robust tools to assess
dimensionality • Well-developed and respected assessment
design • Somewhat ambiguous results • Strict vs. Essential unidimensionality (Stout,
1990; Tate, 2002) • Need qualitative analysis of interesting items
(not released)
20

Discussion (cont.)
• New psychometric models that allows assessing ML in a multidimensional way
• New ML frameworks that would incorporate other aspects of ML as documented in the literature such as social and democratic perspectives.
21

THANK YOU
VERY MUCH!!!
22