Embed Size (px)
Citation preview

Ž .Lithos 46 1999 773–802
Sr and O isotope constraints on source and crustal contaminationin the high-K calc-alkaline and shoshonitic neogene volcanic
rocks of SE Spain
R. Benito a,), J. Lopez-Ruiz a, J.M. Cebria a, J. Hertogen b, M. Doblas a,´ ´R. Oyarzun c, D. Demaiffe d
a ( )Departamento de Geologia, Museo Nacional de Ciencias Naturales CSIC , Jose Gutierrez Abascal 2, 28006 Madrid, Spain´b Fysico-Chemische Geologie, UniÕersiteit LeuÕen, 3001 LeuÕen, Belgium
c Departamento de Cristalografıa y Mineralogıa, UniÕersidad Complutense de Madrid, 28040 Madrid, Spain´ ´d Laboratoire de Geochimie Isotopique et Geodynamique Chimique, UniÕersite Libre de Bruxelles, 1050 Brussels, Belgium´ ´ ´
Received 17 September 1997; accepted 27 November 1998
Abstract
Ž . Ž . Ž .The Neogene volcanic province of SE Spain NVPS is characterized by calc-alkaline CA , high-K calc-alkaline KCA ,Ž . Ž . Ž .shoshonitic SH , ultrapotassic UP , and alkaline basaltic AB volcanic series. All these series, except the AB, have high
LILErLREE, LILErHFSE and BrBe ratios and high but variable Sr, Pb and O isotope compositions. The KCA and SHlavas contain metapelitic xenoliths whose mineralogical and chemical composition are typical of anatectic restites. Thegeochemical characteristics of CA, KCA, SH and UP series suggest that they originated from the lithospheric mantle,previously contaminated by fluids derived from pelagic sediments. Additionally, the presence of restite xenoliths in the KCAand SH lavas indicates some sort of interaction between the mantle-derived magmas and the continental crust. Trace elementand isotope modeling for the KCA and SH lavas and the restites, point towards the existence of two mixing stages. Duringthe first stage, the lithospheric mantle was contaminated by 1–5% of fluids derived from pelagic sediments, which produced
Ž . 87 86a fertile source heterogeneously enriched in incompatible elements particularly LILE and LREE , as well as in Srr Sr,without significant modifications of the d
18O values. In the second stage, the primary melts derived from this metasomatizedmantle, which inherited the enrichment in LILE, LREE and 87Srr86Sr, interacted with crustal liquids from the BeticPaleozoic basement during their ascent towards the surface. This mixing process caused an increase in d
18O values and, to alesser extent, in 87Srr86Sr ratios. However, the incompatible trace elements abundances only change slightly, even for highmixing rates, due to their similar concentrations in both components. We suggest the following geodynamic scenario to
Ž .account for the global evolution of this area: 1 a Late Cretaceous to Oligocene subduction scheme during which mantleŽ .metasomatism took place, shortly followed by Upper Oligocene to Lower Miocene continental collision, and 2 a Middle to
) Corresponding author. Fax: q34-91-5644-740; E-mail: [email protected]
0024-4937r99r$ - see front matter q 1999 Elsevier Science B.V. All rights reserved.Ž .PII: S0024-4937 99 00003-1

( )R. Benito et al.rLithos 46 1999 773–802774
Upper Miocene extensional event triggering partial melting of the previously metasomatized mantle and the extrusion of theCA and associated magmas. q 1999 Elsevier Science B.V. All rights reserved.
Keywords: Neogene volcanic province of SE Spain; High-K calc-alkaline rock; Shoshonitic rock; Mantle metasomatism;Crustal contamination
1. Introduction
The Neogene volcanic province of SE SpainŽ .NVPS lies along the eastern domain of the BeticRanges, an orogenic edifice built during a series of
Žcompressional episodes Cretaceous to Upper.Oligocene–Lower Miocene leading to nappe stack-
ing and low- to high-grade metamorphism. Theplate-tectonic evolution of this realm indicates a longand complex history involving subduction of oceaniccrust during Cretaceous to Oligocene time, followedby continental collision and subsequent slab detach-ment under the Iberian plate in Oligocene timeŽ .Vissers and van der Wal, 1993 . During Middle toUpper Miocene times, the Betics underwent exten-sional collapse through low-angle detachment sys-
Ž .tems involving the rapid unroofing )3 kmrMa ofmetamorphic core complexes and the extrusion ofthe NVPS volcanics in a Basin- and Range-type
Žtectonic scenario Doblas and Oyarzun, 1989; Loner-gan and Mange-Rajetsky, 1993; Oyarzun et al.,
.1995 .The NVPS comprises the following series: calc-
Ž . Ž .alkaline CA , high-K calc-alkaline KCA ,Ž . Ž .shoshonitic SH , ultrapotassic UP , and alkali
Ž . Ž .basalts AB Fig. 1 . The first four series wereextruded during Langhian–Messinian, in a time spanof 9 Ma, beginning with the CA series in the SE
Ž .coastal area of Cabo de Gata 15 to 7 Ma , followedŽinland by the KCA El Hoyazo, Mazarron and Mar´
. ŽMenor and the SH ones Vera, Mazarron and Carta-´. Ž .gena 12 to 6 Ma , and finally, the UP series in
Vera, Mazarron and the northern sector of the´Ž . Žprovince 8 to 6 Ma Bellon and Brousse, 1977;
Nobel et al., 1981; Bellon et al., 1983; Di Battistini.et al., 1987 . After a gap of 2 Ma, the AB extruded
during a second volcanic event. This magmatism isnot genetically linked to the previous series and willnot be considered here.
The NVPS displays several characteristics whichset it apart from comparable volcanic zones associ-
Ž .ated with active margins: 1 a whole magmatic suiteranging from CA to UP developed within a narrow
Ž . Ž .area ;150=25 km ; 2 the plate tectonic settingdid not include coeval subduction of oceanic litho-
Ž .sphere; 3 the volcanics have Sr, Nd, Pb and Oisotopic ratios higher than those typical of active
Ž .margins, and 4 most of the NVPS volcanism devel-Žoped on a relatively thin continental crust ;20
.km . These unusual conditions call for a new ap-proach regarding the geochemical and geodynamicmodeling of the NVPS.
Previous models have explained the NVPS interms of anatectic melting of metamorphic rocksŽ .Zeck, 1968, 1970; Munksgaard, 1984 , mantle
Žmetasomatism with sediment-derived fluids Nelsonet al., 1986; Lopez-Ruiz and Wasserman, 1991; Nel-´
.son, 1992 , and magma mixing or assimilation ofŽ .crustal rocks Bellon et al., 1983; Zeck, 1992 . How-
ever, none of these hypotheses can satisfactorilyaccount for the special petrological and geochemicalfeatures exhibited by the KCA and SH rocks whichare characterized by the ubiquitous presence ofmetapelitic xenoliths as well as xenocrysts formedby disaggregation of former inclusions. These char-acteristics suggest that in addition to the sourcecontamination processes—already proposed for thewhole of the NVPS lavas—the KCA and SH mag-mas have also suffered some interaction with theoverlying continental crust at shallow levels.
Here, we summarize the main petrological andgeochemical characteristics of the Neogene lavasfrom the NVPS and the metapelitic xenoliths en-trained within the KCA and SH lavas. We thendiscuss the genesis of the KCA and SH volcanismbased on geochemical and geodynamic constraints.
2. Analytical methods
ŽMajor elements Si, Ti, Al, total Fe, Mn, Mg, Ca,.K and P were analyzed by wavelength dispersive

( )R. Benito et al.rLithos 46 1999 773–802 775
Ž .Fig. 1. Sketch of the Neogene volcanic province of SE Spain NVPS . The dotted lines mark the limit of the zones in which the calc-alkalineŽ . Ž . Ž .I , high-K calc-alkaline and shoshonitic II and ultrapotassic III lavas predominate.

( )R. Benito et al.rLithos 46 1999 773–802776
Ž .X-ray fluorescence XRF spectrometry, carried outon an automated Philips PW-1410r20 system, withCr and W X-ray tubes, at the Museo Nacional de
Ž .Ciencias Naturales of Madrid Spain . Analyses wereperformed using fused glass discs. Undiluted pressedrock powder pellets were used to determine V, Ni,Cu, Rb, Sr, Y, Zr, Nb, Ba and Pb. Natural rockpowders were used as standards in each case. TheFeO content was analyzed by manganometric titra-tion. The iron content of the xenoliths was analyzed
Ž U .as total Fe Fe O . Atomic absorption flame spec-2 3Ž .trometry Perkin-Elmer-2320 was used to analyze
Na and Li over dry digestion with HNO qHClO3 4
qHF and HCl extraction. This same digestion wasused for determination of Be, analyzed by induc-tively coupled plasma-atomic emission spectroscopyŽ .Thermo Jarrell Ash, ICAP-61 at the Instituto Tec-
Ž .nologico Geominero de Espana Madrid . B was´ ˜determined also on ICAP-61 over closed digestionwith HClO qHFqHCl. F was analyzed by col-4
orimetry at this last centre.Concentrations of Sc, Cr, Co, rare earth elements
Ž .REE , Hf, Ta, Pb, Th and U were determined byŽ .instrumental neutron activation analysis INAA at
Ž .the University of Leuven Belgium . The analyseswere performed relative to a secondary basalt stan-dard which has been repeatedly calibrated against theBCR-1 reference rock. The experimental errors wereof the order of 2%.
Isotopic composition of Sr have been measuredby mass spectrometry on double Re filament with aFinnigan MAT-260 mass spectrometer of the Bel-
Žgian Centre of Geochronology University of Brus-.sels . Whole-rock samples were dissolved in a HF–
HNO mixture. Strontium was separated by conven-3
tional cation exchange techniques. 87Srr86Sr ratiosare normalized to 86Srr88Srs0.1194. An average87Srr86Sr value of 0.710235"0.000026 is obtainedfor the NBS-987 standard.
For oxygen isotope measurements, the oxygenwas extracted from the whole-rock samples follow-ing the general procedure of Clayton and MayedaŽ .1963 , by reaction with BrF and converted to CO5 2
for mass spectrometric analysis. O isotopic ratioswere measured on a Finnigan MAT-251 spectrome-
Ž .ter at the U.S. Geological Survey at Denver USA .The isotopic data are reported in the conventionald-notation, where d
18 O is the relative difference in
isotopic ratio between a sample and SMOW, ex-pressed in parts per thousand. The internal standardused is the NBS-28 reference sample with has ad
18 O value of q9.6‰. The experimental precisionof single determinations is of the order of "0.2‰.
3. Petrology and geochemistry of the lavas
The Neogene volcanism of SE Spain has beenŽstudied in detail by several authors e.g., Lopez-Ruiz´
and Rodrıguez Badiola, 1980; Molin, 1980; Munks-´gaard, 1984; Nixon et al., 1984, Nelson et al., 1986;Venturelli et al., 1984, 1988, 1991, 1993; Toscani etal., 1990, 1995; Lopez-Ruiz and Wasserman, 1991;´Zeck, 1992; Benito, 1993; Salvioli and Venturelli,
.1996 . The general features of this volcanism, aswell as detailed petrological and mineralogical de-
Žscriptions of these rocks including the criteria fol-.lowed for their classification , can be found in the
above mentioned works and in a more comprehen-sive way in Lopez-Ruiz and Rodrıguez Badiola´ ´Ž .1980 . In the following sections, only a brief outlineof the petrology and geochemistry of the four seriesis presented.
3.1. Mineralogy
The CA rocks are represented by basaltic an-desites, pyroxene- and amphibole-bearing andesitesand dacites. The basaltic andesites and the andesitesconsist of a main assemblage of plagioclase, or-thopyroxene, clinopyroxene and magnetite, whichcan be accompanied by amphibole and biotite in themost silica-rich samples. The dacites are constitutedby plagioclase, orthopyroxene, amphibole, biotite,magnetite, ilmenite and quartz.
The KCA series is predominantly corundum-normative high-K andesites and dacites. Althoughtheir mineralogy is similar to their equivalents in theCA series, amphibole is never present and biotite isthe major ferromagnesian mineral.
The SH series is represented by banakites andŽlatites. The banakites consist of plagioclase richer in
albite and orthoclase than the equivalent rocks of the.CA and KCA series , orthopyroxene, clinopyroxene
Ž .endiopside–diopside , sanidine, biotite and quartz.

( )R. Benito et al.rLithos 46 1999 773–802 777
In the latites, plagioclase and sanidine are also coex-istent but clinopyroxene is absent and orthopyroxeneis scarce, whereas biotite and quartz show higherabundances.
The UP rocks are olivine–diopside–richteriteŽ .madupitic lamproites jumillites , enstatite–sani-
Ž .dine–phlogopite lamproites cancalites , hyalo-en-Ž .statite–phlogopite lamproites fortunites and hyalo-
Ž .olivine–diopside–phlogopite lamproites verites . Invitreous samples, the glass phase is rich in SiO ,2
Al O and K O, while in the holocrystalline vari-2 3 2
eties, it is replaced by potassic richterite and iron-richsanidine. Apatite, calcite, rutile and spinels are themost important accessory minerals.
3.2. Major and trace elements
Representative chemical analyses of the CA, KCA,SH and UP lavas are selected in Table 1. In Figs. 2and 3, these series have also been plotted in MgO-element and chondrite-normalized diagrams. In gen-eral, the CA rocks are poorer in K O, TiO , P O2 2 2 5
and incompatible and compatible trace elements rela-tive to the KCA and SH ones, whereas the UP rocksare richer in K O and incompatible trace elements,2
as well as in MgO, Ni and Cr, relative to the othergroups. All the series display the typical signature of
Žlavas belonging to active margins e.g., Al O )2 3
13%, TiO - 1.2% and high BarLa, BarNb,2
LarNb, ThrNb, ZrrNb and BrBe ratios; Perfit etal., 1980; Pearce, 1982; Morris et al., 1990;
.Hawkesworth et al., 1993, 1994 . In this context, it isimportant to note that all the lavas from the NVPSdisplay a small but persistent negative Eu anomalyas well as a high correlation between 87Srr86Sr, Band 1rSr.
The CA rocks exhibit a relatively wide range ofSiO and their abundance in major elements is simi-2
lar to that of equivalent rocks of other areas. Theyare characterized by high contents of Al O and2 3
CaO, moderate Na O, and low TiO , K O and2 2 2
P O . This series displays a typical enrichment in2 5Ž .LILE higher in Rb and Th than in Ba and LREE,
Ž .and negative anomalies of Sr, Nb, Ta and Ti Fig. 3 .With increasing SiO , a progressive enrichment of2
K O, Rb, Th, Zr and REE is observed, as well as a2
decrease in Fe OU , MgO, CaO, TiO , P O , Co, Ni2 3 2 2 5
and V.
The KCA rocks show a narrower range of varia-tion in SiO relative to the above described series,2
but they are usually richer in TiO , K O and P O ,2 2 2 5
and poorer in FeO and CaO, while Al O is similar.2 3
They are also enriched in LILE and LREE, and showŽ .negative anomalies of Nb, Ta, Sr, P and Ti Fig. 3 .
The abundance of all these elements, as well as Ni,Cr, V and Co, is higher than the CA rocks withsimilar SiO content, but their BarLa, LarNb,2
ThrNb and ZrrNb ratios are of the same magnitude.With increasing SiO , Al O remains virtually con-2 2 3
stant, while there is an increase in K O and P O ,2 2 5
and a decrease in MgO and CaO.In general, the SH rocks are characterized by
higher contents of TiO , K O and P O . They are2 2 2 5Žalso strongly enriched in LILE in this case, the
higher values correspond to Th and not to Rb, as in.the two other series and LREE, relative to the rest
Ž .of incompatible trace elements Fig. 3 . In contrast,their abundance in HREE and compatible elements isin the range observed in the KCA rocks. As a resultof the enrichment in highly incompatible elementsrelative to the moderately incompatible ones, theLILErLREE and LILErHFSE ratios are higher thanthose of the CA and KCA rocks. With increasingsilica, Al O , MnO, MgO, CaO, TiO and P O2 3 2 2 5
decrease.The UP rocks display much higher contents of
MgO, Ni and Cr, as well as K O, TiO , P O , LILE2 2 2 5Ž .particularly Th and LREE, relative to the othergroups. On the other hand, they have moderate to
Žlow contents of Al O , CaO, Sc and V Figs. 2 and2 3.3
3.3. Isotopic ratios
The d18 O values of the four series range between
Žq9.5 and q20.3‰ Munksgaard, 1984; Lopez-Ruiz´.and Wasserman, 1991 . There is no good correlation
between these values and the abundance of SiO ,2
MgO or incompatible elements. However, there is aŽ . 18strong positive correlation rs0.92 between d O
Ž . Ž .and the loss on ignition LOI values Fig. 4 . Thiscorrelation, as well as the evidence for extensivedevitrification of the matrix of many of the samplesŽwhich can represent up to )50% of the rock
. 18volume , suggest that the measured d O values arenot primary. The effects of post-crystallization hy-

( )R. Benito et al.rLithos 46 1999 773–802778
Table 1Ž . Ž .Representative analyses of major % , trace elements ppm and Sr and O isotopes of the lavas from SE Spain
Calc-alkaline lavas
Cabo de Gata
GAT-7 GAT-8 GAT-18 GAT-19 GAT-10 GAT-11basaltic andesite andesite andesite andesite andesite dacite
SiO 54.47 56.87 60.07 60.71 60.81 63.782
TiO 0.60 0.64 0.40 0.46 0.56 0.512
Al O 17.93 16.72 16.05 16.14 16.12 15.762 3
Fe O 3.25 1.96 1.53 2.12 1.75 1.582 3
FeO 3.88 5.29 4.63 3.04 4.02 3.42MnO 0.13 0.13 0.11 0.11 0.11 0.09MgO 5.55 3.93 4.35 2.40 2.98 2.21CaO 8.91 8.96 8.35 6.73 7.55 5.90Na O 1.16 2.55 1.43 2.12 2.40 2.522
K O 1.28 1.17 1.15 2.28 1.51 1.852
P O 0.13 0.14 0.11 0.12 0.10 0.092 5
LOI 2.31 1.36 1.54 2.70 1.65 2.11Total 99.60 99.72 99.72 98.93 99.56 99.82
Li 14 14 15 52 27 30Be 1.1 1.1 1.2 1.6 1.9 1.9B 31 25 12 20 43 52F 315 435 270 335 385 505Sc – 32.6 31.0 23.7 25.5 20.5V 210 173 157 104 111 96Cr 40 90 75 29 81 48Co 32.0 24.7 19.9 14.8 18.7 13.5Ni 18 26 13 10 14 8Cu 21 34 30 13 59 6Rb 50 33 45 52 73 98Sr 275 236 218 150 193 204Y 20 26 17 27 26 27Zr 115 106 103 105 121 128Nb 2 2 3 2 6 5Ba 238 126 272 282 232 244La 7 11.3 12.1 9.9 14.8 18.8Ce 31 25.3 24.6 20.7 30.0 38.9Nd – 12.2 11.3 8.52 12.6 17.1Sm – 3.00 2.52 1.89 2.91 3.34Eu – 0.83 0.77 0.58 0.78 0.82Tb – 0.51 0.42 0.33 0.49 0.50Yb – 1.73 1.65 1.19 1.63 1.68Lu – 0.28 0.29 0.22 0.28 0.27Hf – 2.03 1.95 1.82 2.55 3.03Ta – 0.32 0.38 0.40 0.53 0.59Pb 17 21 9 14 40 57Th 5 3.51 3.47 4.62 5.10 6.88U – 1.28 0.94 1.90 1.86 2.39
87 86Srr Sr – – 0.71154 0.71082 0.71298 –18
d O q11.0 q10.5 q9.5 – q11.3 q11.6measured18
d O q8.7 q9.9 q8.6 – q10.2 q9.7corrected

( )R. Benito et al.rLithos 46 1999 773–802 779
Ž .Table 1 continued
High-K calc-alkaline lavas
Mar Menor El Hoyazo Mazarron´
CAR-1 CIE-1 GAT-14 MAZ-10high-K andesite high-K andesite high-K andesite high-K dacite
SiO 61.89 62.47 61.44 64.002
TiO 0.59 0.65 0.77 0.582
Al O 16.70 14.96 17.32 16.022 3
Fe O 1.34 0.89 1.29 0.652 3
FeO 3.37 4.16 3.70 4.09MnO 0.07 0.09 0.06 0.08MgO 2.51 2.96 1.95 2.10CaO 6.18 5.20 3.04 4.83Na O 1.76 1.80 1.99 2.482
K O 2.17 2.22 2.78 2.612
P O 0.16 0.18 0.14 0.212 5
LOI 2.85 3.55 4.72 2.49Total 99.59 99.13 99.20 100.14
Li 20 26 14 33Be 3 3 4 4B 63 91 69 57F 455 415 685 530Sc 23.8 21.2 17.4 20.7V 104 126 133 88Cr 95 208 152 103Co 11.9 21.3 14.3 12.5Ni 18 81 29 13Cu 22 32 32 22Rb 116 133 90 162Sr 243 150 334 497Y 23 20 25 28Zr 132 139 178 172Nb 12 12 15 16Ba 481 350 662 585La 27.3 26.1 58.1 36.1Ce 53.1 54.1 104.0 75.4Nd 24.5 25.6 45.9 34.2Sm 4.98 4.90 7.92 5.79Eu 1.08 1.04 1.73 1.30Tb 0.70 0.72 0.89 0.75Yb 2.14 2.24 1.78 2.02Lu 0.31 0.35 0.30 0.27Hf 3.28 3.64 5.44 4.30Ta 1.00 0.90 1.38 1.43Pb 31 21 20 50Th 10.20 9.65 22.00 21.40U 4.23 4.53 5.82 8.60
87 86Srr Sr 0.71543 0.71563 0.71303 –18
d O q13.1 q13.2 q17.7 –measured18
d O q9.9 q8.8 q11.1 –corrected

( )R. Benito et al.rLithos 46 1999 773–802780
Ž .Table 1 continued
Shoshonitic lavas
Cartagena Mazarron Vera´
ATA-1 BEA-1 MAZ-5 MAZ-7 MAZ-8 GAR-1 ALI-1banakite banakite banakite latite latite latite latite
SiO 58.24 59.16 62.88 63.68 64.19 66.62 66.822
TiO 0.73 0.89 0.47 0.71 0.63 0.65 0.642
Al O 16.25 15.05 14.53 15.53 16.22 15.10 16.092 3
Fe O 1.73 1.22 1.03 0.49 0.81 1.87 0.712 3
FeO 2.91 3.45 3.11 3.54 3.26 1.34 1.55MnO 0.08 0.07 0.07 0.07 0.05 0.03 0.02MgO 2.94 3.19 2.31 1.56 1.58 1.77 0.98CaO 5.50 5.19 2.91 2.71 2.57 2.83 2.39Na O 2.12 2.03 1.87 1.74 2.25 1.46 2.332
K O 4.67 5.15 3.94 4.55 4.43 4.51 3.372
P O 0.57 0.79 0.36 0.32 0.42 0.65 0.252 5
LOI 3.94 3.32 6.23 4.69 3.39 3.17 4.00Total 99.68 99.51 99.71 99.59 99.80 99.73 99.15
Li – 11 18 18 50 – 26Be – 13 4 5 6 – 3B – 113 111 112 103 – 56F – 1745 795 875 1100 – 990Sc 19.5 20.9 – 14.6 14 – 11.3V 98 134 143 108 – 143 94Cr 132 193 128 97 138 121 87Co 18.4 16.9 19 11.1 11 25 5.5Ni 80 75 41 34 49 40 36Cu 39 51 26 16 18 43 45Rb 185 339 319 230 227 228 142Sr 513 624 725 535 581 833 1871Y 32 31 45 30 31 45 47Zr 229 339 224 245 260 218 242Nb 27 35 26 29 33 26 15Ba 1564 2168 1793 1211 1310 1731 4271La 62.2 75.6 53 52.4 63.5 43 47.0Ce 139.0 186.0 91 113.0 137.0 122 106.0Nd 69.5 106.0 – 54.1 68.2 – 55.0Sm 11.80 17.90 – 9.47 12.40 – 13.40Eu 2.31 3.10 – 1.97 2.26 – 2.81Tb 1.14 1.42 – 1.01 1.18 – 1.90Yb 2.21 2.14 – 2.33 2.13 – 4.73Lu 0.31 0.31 – 0.36 0.30 – 0.67Hf 7.25 10.40 – 6.25 7.67 – 6.49Ta 2.02 2.62 – 2.25 2.31 – 1.70Pb 215 90 65 67 71 134 300Th 67.20 102.00 50 48.70 64.20 48 31.30U 16.80 26.30 – 16.80 15.40 – 16.70
87 86Srr Sr – 0.71574 – 0.71631 0.71768 – 0.7094518
d O – q13.3 q20.3 q15.3 – q13.4 –measured18
d O – q9.2 q11.0 q8.7 – q9.6 –corrected

( )R. Benito et al.rLithos 46 1999 773–802 781
Ž .Table 1 continued
Ultrapotassic lavas
Jumilla Aljorra Vera Cancarix Barqueros Fortuna Salmeron´JUM-5 ALJ-1 VER-4 CAN-1 BAR-1 FOR-1 CMO-1jumillite verite verite cancalite fortunite fortunite fortunite
SiO 48.99 54.05 55.33 55.33 55.32 55.82 56.882
TiO 1.54 0.91 1.40 1.59 1.63 1.48 1.522
Al O 8.45 13.35 10.70 9.29 11.24 11.49 9.042 3
Fe O 3.94 5.31 0.99 1.89 2.25 2.56 2.292 3
FeO 1.98 1.09 3.96 3.23 3.40 2.98 2.79MnO 0.09 0.11 0.08 0.07 0.07 0.08 0.08MgO 16.68 8.37 11.91 12.97 9.48 19.77 11.56CaO 7.65 7.28 2.92 3.27 3.59 2.44 3.03Na O 1.13 1.39 2.93 0.52 1.25 0.97 1.642
K O 6.86 5.77 3.48 7.99 6.88 7.93 8.452
P O 1.25 0.65 0.63 1.09 0.72 0.85 1.082 5
LOI 1.78 1.74 5.18 2.38 4.46 3.36 1.06Total 100.34 100.02 99.50 99.62 100.29 99.73 99.42
Li 34 28 67 43 36 45 41Be 13.5 8.0 11.8 18.2 15.2 14.6 19B 36 33 238 140 183 113 63F 3835 1485 3155 3700 3085 4195 5100Sc 15.5 24.8 13.9 11.7 14.4 13.7 –V 128 129 139 127 134 111 114Cr 911 666 722 651 583 561 523Co 45.2 36.5 37.0 32.6 34.5 33.5 37Ni 714 392 617 541 479 504 552Cu 21 46 28 22 29 28 19Rb 326 265 473 587 500 611 528Sr 867 466 441 695 516 453 615Y 31 28 31 33 35 36 32Zr 538 294 649 727 678 580 856Nb 54 26 54 57 50 47 68Ba 2185 1596 1554 1814 1274 1475 1722La 89.2 68.7 89.5 98.5 84.7 69.2 67Ce 238.0 173.0 253.0 282.0 248.0 191.0 204Nd 147.0 104.0 159.0 185.0 163.0 126.0 –Sm 28.00 18.0 25.60 30.80 26.6 22.60 –Eu 4.73 3.09 4.22 5.04 4.39 3.78 –Tb 1.94 1.32 1.53 1.78 1.65 1.54 –Yb 2.14 1.78 1.67 1.95 2.27 2.19 –Lu 0.28 0.23 0.20 0.26 0.27 0.30 –Hf 17.60 9.90 17.80 21.10 19.80 17.60 –Ta 3.35 2.20 3.26 3.39 3.09 2.78 –Pb 170 293 205 206 113 75 149Th 104.00 82.4 90.60 112.00 106.0 85.60 129U 12.20 16.7 20.20 26.80 22.30 21.30 –
87 86Srr Sr 0.71706 0.71974 0.72098 0.71775 0.71810 0.71845 –18
d O q11.7 q11.4 q18.5 q13.3 – – q11.8measured18
d O q10.4 q10.2 q11.1 q10.9 – – q11.8corrected
18 Ž .The 1d O values are from Lopez-Ruiz and Wasserman 1991 .´

( )R. Benito et al.rLithos 46 1999 773–802782
Ž .Fig. 2. MgO-major elements diagrams of the calc-alkaline lavas of Cabo de Gata CA , the high-K calc-alkaline lavas of the El Hoyazo, MarŽ . Ž . Ž .Menor and Mazarron KCA , the shoshonites of Mazarron, Cartagena and Vera SH , and the ultrapotassic lavas UP .´ ´
dration and low-temperature alteration on thewhole-rock d
18 O values can be corrected by measur-18 Ž .ing the d O values of phenocrysts e.g., pyroxene
in the lavas or by extrapolation to primary waterŽ .contents Ferrara et al., 1985 . The pyroxene and
plagioclase phenocrysts of the CA, KCA and SHlavas are usually zoned and the pyroxenes are re-stricted to the less silicic rocks. For this reason,
Ž .Lopez-Ruiz and Wasserman 1991 have calculated´d
18 O values corrected for alteration effects following

( )R. Benito et al.rLithos 46 1999 773–802 783
Ž . Ž .Fig. 3. Multi-element diagrams, normalized with respect to the chondrites, of the calc-alkaline CA , high-K calc-alkaline KCA ,Ž . Ž . Ž .shoshonitic SH and ultrapotassic UP lavas of NVPS. The normalization values are the ones suggested by Thompson et al. 1984 .
the second method. Although this is an empiricalŽ .procedure, Ferrara et al. 1985 demonstrated that it
can produce results which agree well with thoseobtained from phenocrysts. The calculated primary
Žvalues display a much more restricted range q8.6.to q11.8‰; Table 1 and Fig. 5 with the CA rocks
18 Ž .showing lower d O values q8.6 to q10.2‰ and18 Žthe UP ones the highest d O values q10.2 to
.q11.8‰ .The 87Srr86Sr ratios in the four series are high
Ž .0.7080–0.7213 , with a generalized increase fromŽCA to UP, as observed in Fig. 5 Powell and Bell,
1970; Munksgaard, 1984; Nelson et al., 1986;.Toscani et al., 1990; and this work . In contrast to
the oxygen isotopes, the 87Srr86Sr ratios have notbeen significantly modified by alteration processes.This is demonstrated by the Sr isotope analyses
Ž .performed by Toscani et al. 1990 in whole rock,plagioclase separates and groundmass of CA rocks,which show very small differences, usually withinthe analytical error. Furthermore, this is supported bythe good correlation of the Sr isotopes relative to87 86 Ž .Rbr Sr see Munksgaard, 1984 .
Lead isotopic ratios are high in the four series,and there are no significant differences among them.In the CA and UP lavas, 206 Pbr204 Pb, 207Pbr204 Pband 208Pbr204 Pb values vary between 18.84 and18.91, 15.67 and 15.70 and 38.85 and 39.88, and

( )R. Benito et al.rLithos 46 1999 773–802784
18 Ž . Ž . Ž . Ž .Fig. 4. The d O-LOI diagram of the calc-alkaline CA , high-K calc-alkaline KCA , shoshonitic SH and ultrapotassic UP lavas ofŽ .NVPS open symbols: Lopez-Ruiz and Wasserman, 1991; solid symbols: Munksgaard, 1984 . The thick line represents the regression line´
Ž 18 .d Os1.814 LOIq8.239 used to correct the obtained data for secondary hydrationrdevitrification according to the method of Ferrara etŽ .al. 1985 . The thin lines are extrapolations parallel to the regression line down to a LOIs1.06%. This value is the total H O content of2
sample CMO-1 which is the only one that is glass-free.
between 18.66 and 18.83, 15.67 and 15.74 and 38.97Žand 39.19, respectively Hertogen et al., 1985, 1988;
.Nelson et al., 1986; Arribas and Tosdal, 1994 .
4. Petrology and geochemistry of the metapeliticxenoliths
The KCA and SH rocks contain two groups ofinclusions: metapelitic xenoliths, and igneous
quartz–diorite, basaltoid and quartz–gabbroic inclu-sions. The first group is more abundant, representingtwo thirds of the total volume of inclusions. Thepetrology and chemical composition of both groups
Žof inclusions have been studied by Zeck 1968,. Ž .1970, 1992 and Molin 1980 .
Metapelitic xenoliths range in diameter from afew millimeters to 50 cm, although most of them are-10 cm. The disaggregation of these xenoliths pro-
ŽFig. 5. Sr and O isotopic ratios in the NVPS lavas after Powell and Bell, 1970; Munksgaard, 1984; Hertogen et al., 1985, 1988; Nelson et.al., 1986; Toscani et al., 1990; Lopez-Ruiz and Wasserman, 1991; and this work , and in the gneiss-derived xenoliths of the high-K´
Ž .calc-alkaline and shoshonitic lavas after Munksgaard, 1984; and this work . In the O isotopes, the open bars correspond to the measuredvalues, while the solid bars represent corrected data.

( )R. Benito et al.rLithos 46 1999 773–802 785
duced anhedral crystals of cordierite, plagioclase,spinel, zircon and graphite, euhedral garnet crystals,and corroded quartz crystals, which are found withinthe host lavas. The composition and zoning of thegarnet xenocrysts has been studied by Lopez-Ruiz et´
Ž . Ž . Ž .al. 1977 , Molin 1980 and Munksgaard 1985 .Here, we will deal with these metapelitic xenoliths,whose textures and mineralogy suggest that theyrepresent refractory residues produced after partialmelting episodes from gneisses initially made up of
Žbiotite, garnet, sillimanite, feldspars and quartz Zeck,.1968, 1970; Cesare et al., 1997 .
4.1. Mineralogy
The gneissic xenoliths contain biotite and silli-manite which can be accompanied by variableamounts of cordierite, almandine, spinel and quartz.Three main groups of xenoliths can be distinguishedaccording to the relative abundances of those miner-
Ž .als: biotite–sillimanite–almandine bt–sil–alm ,Ž .spinel–cordierite spl–crd and cordierite–quartz
Ž .crd–qtz . These represent end-member terms with aŽ .complete transition between them Zeck, 1968, 1970 .
Although their distribution is irregular within thevolcanic suite, certain types predominate in specificareas. In this sense, the bt–sil–alm types with vari-able cordierite are the most abundant at El Hoyazo,while the spl–crd ones predominate at Mar Menor.
The mineralogy of these xenoliths suggests thatthey represent the residue of the original rock assem-blage after having lost an anatectic melt fraction.Additionally, the perfect cotectic split into plagio-clase-bearing restite without quartz or K-feldspar andquartz-bearing restite without plagioclase or K-feldspar strongly favors an origin by partial melting.The crd–qtz xenoliths probably derive from the com-paratively quartz-rich portions of the original gneiss.The inverse ratio of the proportion of cordierite tothat of biotiteqsillimanite suggests that in the pres-ence of H O, quartz and feldspars partially melted at2
the beginning of the process. Afterwards, duringH O-free conditions, the reactions responsible for2
the generation of cordierite would be btqsilqqtzscrdq liquid or btqsilqqtzscrdqK-feldsparq liquid, depending on K-feldspar migrating to theliquid or remaining in the xenolith, and btqsilscrd
Ž .qsplq liquid Zeck, 1968, 1970; Benito, 1993 .
4.2. Major and trace elements
The bt–sil–alm and the spl–crd xenoliths haveŽ .similar chemical composition Table 2 . All are Si-
Ž .poor 38%-SiO -51% and Al-, Fe-, Mg- and2ŽTi-rich 26% - Al O - 37%, Fe O q MgO q2 3 2 3
.TiO s9–22% . The contents of CaO, Na O, MnO2 2
and P O range between 0.45 and 6.02%, 0.15 and2 5
3.38%, 0.02 and 0.30%, and 0.06 and 0.38%, respec-tively, depending on the mineralogy. The spl–crdrocks which have lower proportions of biotite, dis-
Žplay low concentrations of potassium K Os0.25–2.2.21% , while the biotite-rich xenoliths have higher
Ž .concentrations K Os2.16–4.69% . The crd–qtz2Ž .rocks show much higher contents of SiO 64.43% ,2
Ž . Ž .and lower contents of Al O 18.37% , CaO 0.43%2 3Ž .and TiO 0.64% as compared to the above de-2
scribed types.The bt–sil–alm xenoliths are chemically similar
to the average pelites of Taylor and McLennanŽ .1985 . However, K O and Rb are slightly depleted2
and Th, Nb, Zr, TiO , Ce and La are slightly en-2Ž .riched Fig. 6 . Moreover, the abundance of Ba, Sr,
P O and Y is highly variable, depending on their2 5
content in plagioclase, almandine and apatite. TheŽ .transition xenoliths between the bt–sil–alm crd
rocks and the spl–crd ones are characterized byŽlower Rb concentrations between 0.2 and 0.7 times
.the average composition of the pelites , and K O,2
although the abundance of this oxide is variable,depending on their content in biotite. The contents inTh, Nb, Zr, TiO , Ce, Y, La, Ba and Sr are high.2
The spl–crd xenoliths display very high contents ofTh, Nb, Zr, TiO , Ce, Y and La relative to the2
pelites. By contrast, K O, Rb and Ba are present in2
very low concentrations. The abundance of Sr andP O is variable, and in general, similar to the2 5
pelites.
4.3. Isotopic ratios
The 87Srr86Sr ratios range between 0.7172 andŽ . 180.7303 Munksgaard, 1984 and the d O values
Žvary between q11.6 and q16.2‰ Munksgaard,. Ž 181984; and this work , except sample ATA-4A d O
. 87 86sq9.7‰ . The Srr Sr ratios are higher in thexenoliths than in the host lavas whereas the d
18 Ovalues are similar. However, this similarity is fortu-

( )R. Benito et al.rLithos 46 1999 773–802786
itous because the xenolith d18 O values are higher
than those of the host lava values corrected forŽ .hydrationrdevitrification Fig. 5 .
5. Previous petrogenetic hypotheses
Taking into account the geochemical data of thelavas and their metapelitic xenoliths, we will now
discuss the previous hypotheses for the genesis ofthe KCA and SH rocks.
5.1. Anatectic melting of metamorphic rocks
The high and homogeneous d18 O values of the
lavas from El Hoyazo, Vera, Mazarron and Mar´Menor, and of their Al-rich xenoliths, led Munks-
Ž . Žgaard 1984 to support the hypothesis of Zeck 1968,
Table 2Ž . Ž .Representative analyses of major % , trace elements ppm and O isotopes of the gneiss-derived xenoliths
Mazarron´
MAZ-16 MAZ-15 MAZ-14 MAZ-24 MAZ-57A MAZ-20 MAZ-17A MAZ-22bt–sil bt–sil bt–sil bt–sil–crd bt–sil–crd spl–crd spl–crd spl–crd
SiO 48.12 49.36 50.33 42.05 47.03 45.29 46.41 47.492
TiO 1.36 1.30 1.40 1.48 1.51 1.64 1.41 1.422
Al O 26.11 27.69 26.63 33.90 29.73 32.45 31.89 29.492 3
Fe O 11.13 7.64 8.38 11.12 8.62 10.37 9.22 9.772 3
MnO 0.30 0.08 0.13 0.22 0.11 0.08 0.20 0.28MgO 3.18 1.75 1.73 2.62 2.09 3.67 2.86 2.91CaO 1.86 1.38 1.73 2.73 3.24 3.21 3.29 2.34Na O 1.23 1.95 3.38 1.40 1.77 0.90 1.80 1.612
K O 4.27 4.25 3.69 1.58 3.30 0.79 1.66 3.062
P O 0.09 0.15 0.24 0.26 0.13 0.25 0.16 0.102 5
LOI 2.30 4.31 2.30 2.58 1.39 1.28 0.96 1.08Total 99.95 99.86 99.94 99.94 98.92 99.93 99.86 99.55
Sc 24.2 24.7 24.6 29.1 25 29 19.3 29V 237 244 196 270 228 301 249 256Cr 147 138 119 149 175 193 182 181Co 15.5 13.5 22.6 19.9 17 16.1 23.6 18.7Ni 35 48 52 43 30 42 54 42Cu 10 10 16 52 36 13 27 12Rb 137 269 162 108 112 33 60 56Sr 752 389 370 929 722 593 489 513Y 28 46 33 43 39 43 27 20Zr 198 247 243 278 343 206 303 411Nb – – – – 31 – – –Ba 1916 925 769 1597 1701 475 1078 1045La 72.7 63.6 51.9 69.3 54 78 75.4 89.2Ce 153 132 109 145 112 166 155 180Nd 62.8 57.0 46.1 61.0 – 72.0 67.0 77.0Sm 11.9 11.1 9.2 11.7 – 13.9 13.2 14.5Eu 4.69 3.56 2.81 4.68 – 3.67 2.92 3.01Tb 1.36 1.48 1.28 1.51 – 1.96 1.44 1.48Yb 4.10 4.49 4.50 5.50 – 4.42 2.51 1.75Lu 0.59 0.66 0.64 0.81 – 0.64 0.38 0.27Hf 5.9 7.0 6.9 7.7 – 5.8 8.9 11.5Ta 1.66 2.05 2.28 1.93 – 2.29 2.59 2.42Pb 94 81 86 72 87 36 76 80Th 25.2 21.7 18.1 24.8 24 26.6 28.6 32.4U 5.7 3.8 5.2 6.8 – 5.3 2.3 6.5
18d O – – q15.2 – q11.9 – – q11.6measured

( )R. Benito et al.rLithos 46 1999 773–802 787
Ž .Table 2 continued
Mar Menor Cartagena El Hoyazo
MAN-7 MAN-5 MAN-6 CIE-6 ATA-4A GAT-46 GAT-33Aspl–crd spl–crd spl–crd spl–crd bt–sil bt–sil crd–qtz
SiO 43.43 44.56 46.37 47.44 47.23 42.05 64.432
TiO 1.80 1.79 1.38 1.74 1.58 1.55 0.642
Al O 34.82 33.73 34.24 30.70 27.06 29.60 18.372 3
Fe O 11.85 10.26 10.95 10.05 8.45 13.47 8.452 3
MnO 0.17 0.14 0.14 0.17 0.16 0.09 0.08MgO 2.58 2.24 2.70 1.47 1.77 4.99 3.01CaO 1.44 3.45 0.96 3.10 6.02 0.55 0.43Na O 1.19 1.76 1.02 2.61 2.28 0.15 0.682
K O 0.31 0.25 1.39 0.52 4.54 2.16 1.272
P O 0.15 0.21 0.21 0.22 0.25 0.13 0.172 5
LOI 1.42 1.23 0.92 1.68 0.43 5.06 2.42Total 99.16 99.62 100.28 99.70 99.77 99.80 99.95
Sc 31.9 31.7 16.1 44 – 16 –V 341 245 287 301 358 301 112Cr 213 193 148 182 278 164 110Co 24.3 22.3 25.6 15 23 17 19Ni 48 32 37 16 48 37 31Cu 22 11 11 14 16 14 11Rb 26 17 41 22 133 113 62Sr 100 137 35 300 632 53 32Y 39 52 26 62 48 28 31Zr 307 374 268 351 334 252 145Nb – – – 27 – 24 –Ba 168 162 153 253 928 611 243La 92.1 81.3 69.3 83 89 43 37Ce 191 169 142 148 166 84 65Nd 81.0 73.0 63.0 – – – –Sm 15.6 14.4 12.4 – – – –Eu 2.17 2.22 1.23 – – – –Tb 1.81 1.99 1.49 – – – –Yb 4.80 5.10 1.98 – – – –Lu 0.73 0.72 0.30 – – – –Hf 8.7 10.5 7.6 – – – –Ta 2.43 2.65 1.98 – – – –Pb 16 27 21 33 186 11 6Th 32.6 27.9 23.1 24 26 16 14U 5.7 5.8 3.9 – – – –
18d O – – q12.6 q12.2 q9.7 q15.0 q15.2measured
.1970 that the KCA and SH lavas are derived byŽ .anatexis of a semi- pelitic rock assemblage. How-
ever, as mentioned earlier, the d18 O values in the
KCA and SH lavas have been strongly modified bysecondary alteration and low-temperaturehydrationrdevitrification processes. The pre-alter-ation d
18 O values calculated from those of Munks-Ž . Ž .gaard 1984 and Lopez-Ruiz and Wasserman 1991´
are in the range of q8.7 to q11.6‰, which are ingeneral lower than those of the xenoliths. If we alsotake into account that the 87Srr86Sr ratios of the
ŽKCA and SH lavas 0.7095–0.7178; Munksgaard,.1984; and this work are lower than those of theŽentrained xenoliths 0.7172–0.7303; Munksgaard,
.1984 , an origin by the partial melting of metamor-phic rocks seems unlikely.

( )R. Benito et al.rLithos 46 1999 773–802788
Fig. 6. Trace element variation diagrams, normalized to pelites, of the gneiss-derived xenoliths which are found within the high-KŽ . Ž . Ž .calc-alkaline lavas of El Hoyazo a and Mar Menor d , and within the shoshonites of Mazarron b and c . The normalization values´
Ž .correspond to the mean composition of pelites given by Taylor and McLennan 1985 .
5.2. Magma mixing or assimilation of crustal materi-als
Ž .According to Zeck 1992 , the existence of Al-richrestite, basaltoid and quartz–gabbroic inclusions inthe lavas from El Hoyazo suggests that these lavaswere generated by mixingrmingling of an anatecticŽ .felsic melt and a more mafic magma of deeper
Ž .origin mantle-derived . When plotted in element-Laand element-LarTh diagrams, the volcanic rocks ofSE Spain define straight-lines or hyperbolic-curves,depending on the diagram, with the CA and UP
Žrocks plotting at the starting and ending points Figs..7 and 8 . This suggests a simple two-component
mixing process with the KCA and SH lavas being
the result of mixing of CA and UP magmas. How-ever, the major element contents and the Sr and O
Žisotope ratios of the KCA and SH rocks Figs. 10.and 11 do not follow such mixing trends thus, ruling
out this hypothesis.Ž .Alternatively, Bellon et al. 1983 suggested that
the assimilation of pelitic material by magmas withcharacteristics similar to the CA rocks from Cabo deGata was responsible for the KCA and SH lavas.
Ž .However, as proposed by Benito 1993 , the liquidscoming from the metapelitic xenoliths should displayconcentrations of incompatible trace elements analo-gous or slightly lower than those of the KCA lavas,and therefore, their mixing with magmas with evenlower concentrations in these elements, such as the

( )R. Benito et al.rLithos 46 1999 773–802 789
Ž .Fig. 7. La–Rb, Ce, Tb, Ta diagrams of the calc-alkaline lavas of Cabo de Gata CA , the high-K calc-alkaline lavas of the El Hoyazo, MarŽ . Ž . Ž .Menor and Mazarron KCA , the shoshonites of Mazarron, Cartagena and Vera SH , and the ultrapotassic lavas UP .´ ´
CA ones, cannot give rise to either the KCA or theSH rocks, which show higher concentrations of theseelements.
5.3. Mantle metasomatized with sediment-deriÕedfluids
The distribution of the CA, KCA, SH and UPlavas of SE Spain in the element-La and element-
Ž .LarTh diagrams Figs. 7 and 8 , as well as their Sr,Pb and O isotopic signature led Lopez-Ruiz and´
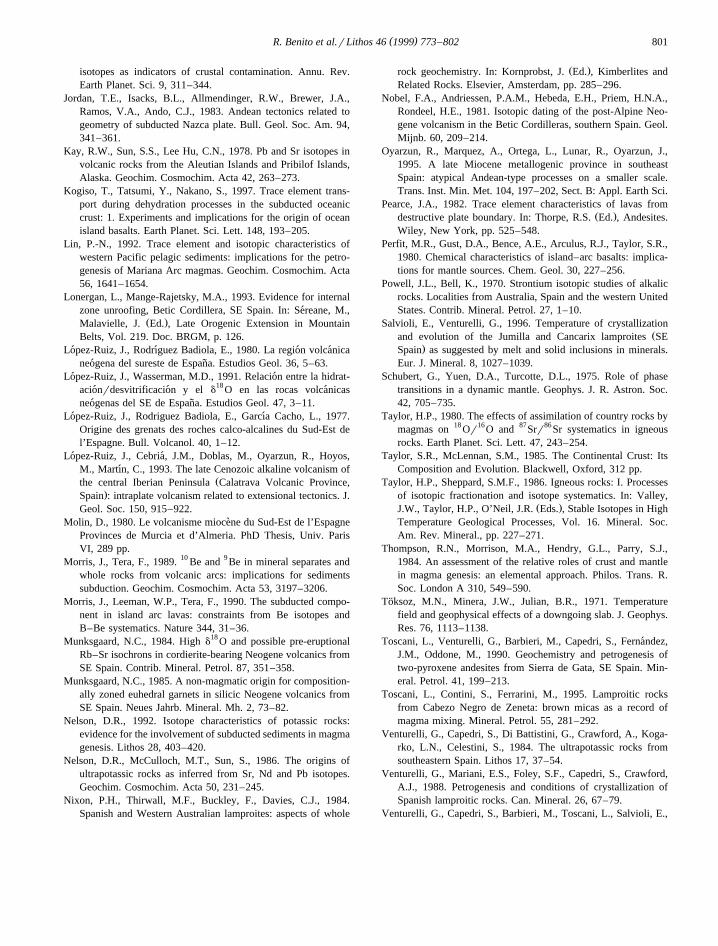
Ž .Wasserman 1991 to propose that the four-rockseries were derived from a mantle metasomatized bysediment-derived fluids. In element-La diagrams, theliquids resulting from the melting of such a sourcemay show approximately linear trajectories, when-ever the degrees of partial melting are similar or
Ž .proportional to the source-contamination Fig. 9a .Similarly, in element-LarTh diagrams, the metaso-matism of the source is represented by hyperbolic-
curves, and the partial melts derived from it bydegrees of melting proportional to the contamination
Ž .also follow hyperbolic-curves Fig. 9b . However,the lack of constraints on the trace element contentsof the mixing end-members as well as on the bulksolidrliquid distribution coefficients during melting,disallows the calculation of neither the mantle meta-somatism trends nor the partial melting parameters.Furthermore, the magmas generated by the combina-tion of these two processes can also be influenced byfractional crystallization andror crustal contamina-tion. In a 87Srr86Sr vs. d
18 O diagram, the lavasderived from a metasomatized mantle plot alongconvex-upward hyperbola, as the ratio between theSr concentration in the mantle and the sediment-de-
Ž .rived fluids, is usually lower than 1 James, 1981 .Obviously, if these magmas underwent later assimi-lation and fractional crystallization, these trajectorieswould be more or less distorted, depending on thedegree of contamination, the composition of thecontaminant, and the rate of crystallization.
( )R. Benito et al.rLithos 46 1999 773–802790
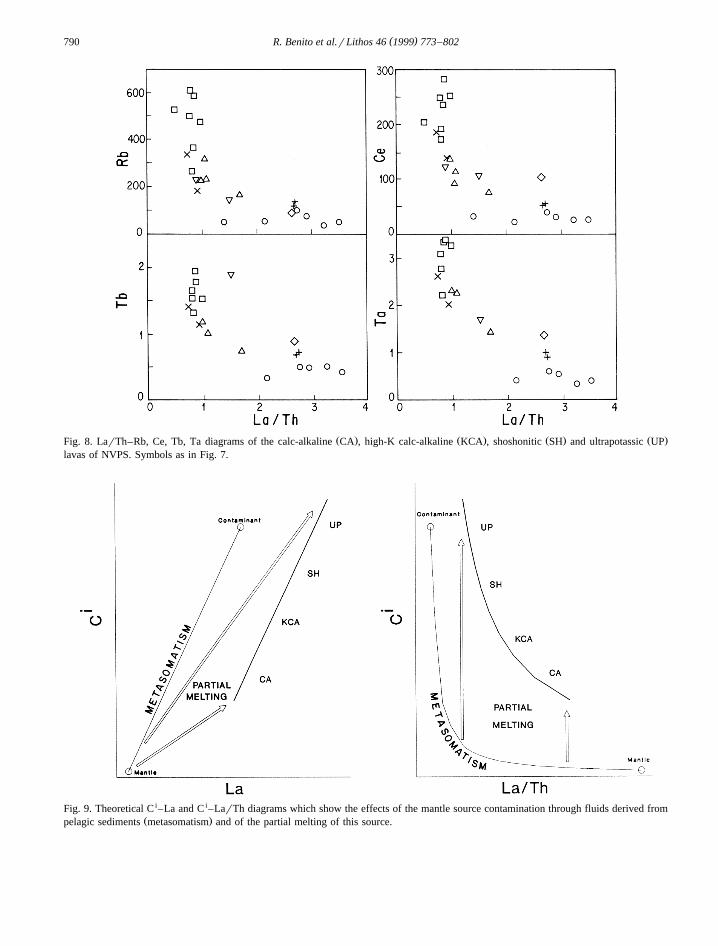
Ž . Ž . Ž . Ž .Fig. 8. LarTh–Rb, Ce, Tb, Ta diagrams of the calc-alkaline CA , high-K calc-alkaline KCA , shoshonitic SH and ultrapotassic UPlavas of NVPS. Symbols as in Fig. 7.
Fig. 9. Theoretical C i–La and C i–LarTh diagrams which show the effects of the mantle source contamination through fluids derived fromŽ .pelagic sediments metasomatism and of the partial melting of this source.

( )R. Benito et al.rLithos 46 1999 773–802 791
Fig. 10. The 87Srr86 Sr– d18 O diagram of the metasomatism model
of the mantle by fluids derived from pelagic sediments, as pro-Ž .posed by Lopez-Ruiz and Wasserman 1991 for the calc-alkaline´
Ž .lavas CA , the high-K calc-alkaline lavas of the Mar Menor andEl Hoyazo, the shoshonites of Mazarron and Vera, and the´
Ž . 87 86ultrapotassic lavas UP . Srr Sr ratios are from MunksgaardŽ . 181984 and this work. d O values are calculated from those
Ž .obtained by Lopez-Ruiz and Wasserman 1991 and Munksgaard´Ž .1984 . The numbers next to the metasomatism curves indicate thepercentages of participation of the sediment-derived fluids.
According to the hypothesis of mantle metasoma-tism for the lavas of SE Spain, the mantle componentshould have low contents of La, Rb, Zr, Ce, Nd, Sm,Eu, Tb, Hf, Ta, U and Th, as well as low Sr and Oisotopic ratios, while the one derived from the sedi-mentary component should have higher contents of
Žthese incompatible elements particularly LILE and.LREE and higher Sr and O isotopic ratios.
In the model proposed by Lopez-Ruiz and´Ž .Wasserman 1991 , it was assumed that the mantle
component has a composition equivalent to the de-Ž87 86 18pleted lithosphere Srr Sr s 0.7027, d O s
.q5.7‰ and Srs12 ppm . The sediment componentcorresponds to a fluid derived from subducted pelagic
Ž87 86sediments and is highly heterogeneous Srr Srs18 .0.715–0.722, d Osq20‰ and Srs60–360 ppm .
The compositions located between the two mixingcurves represented in Fig. 10 reproduce the isotope
compositions of the CA and associated rocks. How-ever, in this model, the amount of sediment-derivedfluids required to explain the high Sr- and O-isotoperatios of the lavas ranges between 20 and 40%.
Although this single-step mixing model can ac-count for the elemental composition and the isotopicratios of the lavas of SE Spain, and it is probably
Ž .valid for the UP rocks Nelson, 1992 and the CA, itdoes not take into account the obvious interaction ofthe KCA and SH magmas with the crustal rocksduring their ascent to the surface. This model alsofails to account for the strong linear correlation
Ž .shown by some KCA El Hoyazo and Mar MenorŽ . 87 86and SH rocks Vera in the Srr Sr–1rSr diagram
Ž .Fig. 11 . Moreover, the linear trends displayed bythe lavas on this diagram could only be produced inthe unlikely situation of a metasomatized mantlesource with heterogeneous 87Srr86Sr ratios, andwhere the degrees of melting are inversely propor-tional to this ratio, in order to generate melts with a
Fig. 11. The 87Srr86 Sr–1rSr=103 diagram for the high-K calc-Ž .alkaline lavas of El Hoyazo and Mar Menor KCA , and shoshon-
Ž . Ž .ites of Vera SH . Data are from Munksgaard 1984 and thisŽ . Ž .work. The fields for the calc-alkaline CA and ultrapotassic UP
magmas have been included for comparison. The linear trendsŽ .observed for the KCA and SH absent in the CA and UP are
interpreted as the result of mixing.

( )R. Benito et al.rLithos 46 1999 773–802792
smaller Sr concentration which correlates with ahigher isotopic ratio.
6. A new model: mantle metasomatismHcrustalcontamination
The distribution of the KCA rocks from El Hoy-azo and Mar Menor and the SH from Vera on the87Srr86Sr–d
18 O and 87Srr86Sr–1rSr diagrams, sug-gests a more complex petrogenetic model, whichshould also be in agreement with the geodynamicframe proposed for this area. In the following para-graphs, we will first test the feasibility of this modelfrom a geochemical point of view and then we willdiscuss the geodynamic evolution of the area.
6.1. Geochemical modeling
ŽAlthough mantle metasomatism as suggested byprevious authors and supported by the geodynamic
.evolution of this region can account for some of theanomalous geochemical characteristics of the mag-mas, the distribution of the KCA and SH rocks onthe 87Srr86Sr–d
18 O and 87Srr86Sr–1rSr diagramsand the presence of metapelitic xenoliths suggest thatinteraction with crustal rocks also played a role. Wethus, propose here a two-stage model, involvingmantle metasomatism by sediment-derived fluids fol-lowed by crustal contamination of the metasomatizedmantle-derived magmas. This scenario is similar tothose suggested for the island of Martinique in the
Ž .Lesser Antilles Davidson and Harmon, 1989 andŽ .the Aeolian Islands Ellam and Harmon, 1990 .
To test this model and to establish the values ofits parameters, we have assumed as a first approachthat the interactions between the different compo-nents take place by simple binary mixing, as in thismechanism, the mixing lines join the two end-mem-ber compositions. As trace elements alone do notallow to distinguish between partial melting of ametasomatized mantle and crustal contamination, forthese calculations, we have considered the variationsin d
18 O, 87Srr86Sr and Sr. The crustal contaminationcan also take place by simultaneous assimilation and
Ž .fractional crystallization AFC . Additionally, simpleŽ .fractional crystallization FC can occur before
andror after the contamination process. These pro-cesses will also be considered later.
6.1.1. Mantle metasomatismTo calculate the trends that define this interaction,
it is necessary to assume the composition of theoriginal mantle and the sediment-derived fluids. Dueto the lack of additional constraints, we have as-sumed a depleted lithospheric signature for the start-
Ž 18ing composition of the mantle d Osq5.7‰,87Srr86Srs0.7027 and Srs12 ppm; see, e.g., El-lam and Hawkesworth, 1988; Hart, 1988; Harmon
.and Hoefs, 1995 . For the metasomatizing fluidsderived from pelagic sediments, a reasonable d
18 OŽvalue can be q20‰ Taylor and Sheppard, 1986;
Davidson and Harmon, 1989; Ellam and Harmon,.1990 . Because the marine sediments have a wide
Žrange in Sr 17–1570 ppm; see Dasch, 1969; Bis-caye and Dasch, 1971; White et al., 1985; Ben
.Othman et al., 1989 , we assumed an intermediateŽ .value 861 ppm; see Biscaye and Dasch, 1971 . If
Žthe mobility of Sr during dehydration is 41% Kogiso.et al., 1997 , the resulting abundance of Sr in the
fluids is ;360 ppm. As their minimum Sr isotopicratio is imposed by the maximum of the lavasŽ . 87 860.7213 , we have assumed that Srr Srs0.722.This value is within the range shown by marine
Žsediments 0.7021–0.7429; see Dasch, 1969; Bis-caye and Dasch, 1971; White et al., 1985; Ben
.Othman et al., 1989 . All these parameters are sum-marized in Table 3.
The calculated metasomatism curve is a convex-upward hyperbola on the 87Srr86Sr–d
18 O diagramŽ .Fig. 12a and a straight line with negative slope on
87 86 Ž .the Srr Sr–1rSr diagram Fig. 12b . The compo-sition of the metasomatized mantle sources in MarMenor, El Hoyazo and Vera should be located some-where along these trends. Obviously, melting of thismantle produces magmas which inherit the isotopicratios of their sources but not the trace elementcontents. For this reason, the composition of theprimary magmas should plot on the curve of Fig. 12abut not on the line of Fig. 12b. As none of the lavasconsidered plot on the curve of Fig. 12a, this modelimplies that all suffered later crustal contamination.
6.1.2. Crustal contaminationThe isotopic composition of the crustal liquids
can be directly obtained from the high-Al restitexenoliths that are found in these rocks. For calcula-tion purposes, we have considered the average and

()
R.B
enitoet
al.rL
ithos46
1999773
–802
793
Table 318 Ž . 87 86 Ž .The d O values ‰ , Srr Sr ratios and Sr concentrations ppm of the components involved in the mantle metasomatismqcrustal contamination process
Lithospheric Fluids derived Metasomatized mantle Mantle melts Crustal liquidsmantle from sediments Mar Menor El Hoyazo Vera Mar Menor El Hoyazo Vera Mar Menor El Hoyazo Vera
18d O q5.7 q20 q6.4 q6.1 q5.9 q6.4 q6.1 q5.9 q14
q16.287 86Srr Sr 0.7027 0.7220 0.7145 0.7115 0.7080 0.7145 0.7115 0.7080 0.7220
0.7303Sr 12 360 29 21 16 300 850 1900 80 100 400
45 60 270
Ž .For data sources lithospheric mantle and fluids derived from sediments and calculation procedures, see text.

( )R. Benito et al.rLithos 46 1999 773–802794
87 86 18 Ž . 87 86 3 Ž . 87 86Fig. 12. The Srr Sr–d O a and Srr Sr–1rSr=10 b diagrams for the metasomatism of the mantle. Srr Sr ratios and SrŽ . 18concentrations for the lavas are from Munksgaard 1984 and this work. d O values are calculated from those obtained by Lopez-Ruiz and´
Ž . Ž .Wasserman 1991 and Munksgaard 1984 . The numbers next to the metasomatism curve indicate the percentages of participation of thesediment-derived fluids.
87 86 Žmaximum values of Srr Sr 0.7220 and 0.7303,. 18 Žrespectively and d O q14‰ and q16.2‰, re-
. Žspectively . The minimum values 0.7172 and.q11.6‰ were not considered as they are equal or
Žlower than the maximum for the lavas 0.7178 and. 87 86q11.6‰ . The Srr Sr ratios are used to calculate
their corresponding Sr concentration by taking intoaccount the regression lines for the lavas on the87 86 Ž .Srr Sr–1rSr diagram Fig. 13; Table 3 , whichcorrespond to mixing lines.
The isotopic ratios of the primary mantle-derivedmagmas are situated on the metasomatism curve ofFig. 12a and the crustal contamination lines arehyperbolae which start at the composition of theinitial magmas and finish at the points that representthe crustal liquids. This means that the isotopic ratiosof the mantle-derived magmas can be calculated bylocating the intersection of both curves on the87Srr86Sr–d
18 O diagram. To apply this approach,we calculated crustal contamination curves and se-lected those that better fit the data for each groupŽ .see Fig. 14a . To calculate these curves, it is re-
quired to establish the Sr concentration of the man-tle-derived melts whose possible values are linked tothe 87Srr86Sr ratios by the regression lines on the87 86 Ž .Srr Sr–1rSr diagram Fig. 13 . The results ofthis calculation are summarized in Table 3.
The Sr concentrations of the metasomatized man-tle sources are easily obtained from the metasoma-
87 86 Žtism line of the Srr Sr–1rSr diagram see Fig.. 87 86 Ž14b by drawing lines of constant Srr Sr i.e.,
.partial melting lines .Finally, the percentages of contribution of the
sediment-derived fluids are obtained from the meta-somatism curve in Fig. 14a, and those of contribu-tion of crustal liquids are obtained by the mixing
Ž .lines of Fig. 13 see Table 4 .
6.1.3. Discussion of the resultsThe results of this model suggest that only a small
Ž .percentage 1–5% of sediment-derived fluids havepervaded the lithospheric mantle. These values are
Žsimilar to those obtained for some island-arcs e.g.,Kay et al., 1978; Barreiro, 1983; Hole et al., 1984;

( )R. Benito et al.rLithos 46 1999 773–802 795
Fig. 13. The 87Srr86 Sr–1rSr=103 diagram of the crustal con-tamination process for the high-K calc-alkaline lavas of El Hoy-azo and Mar Menor, and shoshonites of Vera. The numbers nextto the mixing lines indicate the percentages of participation of thecrustal liquids. Data source as in Fig. 11.
White and Dupre, 1986; Davidson and Harmon,´1989; Morris and Tera, 1989; Woodhead, 1989;
.Ellam and Harmon, 1990 . The degrees of meltingnecessary to generate mantle-derived magmas with
Ž .the calculated Sr concentrations 1900–300 ppmfrom the metasomatized mantle with Sr ranging 16–29 ppm are relatively low, even when the residue-melt bulk distribution coefficients for Sr are <1Ž .see Table 4 .
If the average value of 87Srr86Sr for the restites isassumed to be equivalent to that of the crustal liquidsŽ .0.7220 , then their proportions of participation dur-ing the shallow contamination process range between22 and 63% at Mar Menor, 36 and 73% at ElHoyazo and 35 and 88% at Vera. However, if the
87 86 Ž .highest Srr Sr ratio is considered 0.7303 , thenthe calculated maximum participation of the crustal
Ž .liquids is lower 54%, 70% and 80%, respectivelyŽ .Fig. 13; Table 4 .
Although these percentages may seem high, evenassuming that the crustal liquids had a granitic com-
Ž .position SiO s66–71% , the primary mantle-de-2
rived magmas would have SiO percentages of 46–2
57% for the KCA rocks of Mar Menor, 48–57% forthe KCA of El Hoyazo and 41–59% for the SH ofVera. These values seem reasonable if we considerthat the source has been metasomatized bysediment-derived fluids.
The magmas generated by melting of the metaso-matized mantle have higher Sr abundances than thosein the crustal liquids. As a consequence, the effectdue to crustal contamination in the magmas derivedfrom the metasomatized mantle is to decrease the Srconcentration and to increase the 87Srr86Sr and d
18 Oratios. Concerning the remaining trace elements, as
Žboth the KCArSH lavas and the CArUP which.have not suffered crustal contamination follow anal-
ogous patterns in the element-La and element-LarThŽ .diagrams Figs. 7 and 8 , it seems plausible that the
crustal liquids probably have similar abundances tothose in the metasomatized mantle magmas. In thiscase, crustal contamination only produces slight de-viations from the metasomatismqmelting curvesŽ .Fig. 9 . This also explains that in general, thecorrelation between the Sr isotopic ratios and thetrace elements is not high.
In this model, the sediment-derived fluids aremainly responsible for the higher abundance of boththe incompatible trace elements and the isotopicratios of Sr and Pb in the generated magmas. Thiscomponent is also responsible for the depletion inHFSE, and for the slight negative anomaly of Eu, asthese geochemical characteristics are typical of most
Žoceanic sediments see, e.g., Ben Othman et al.,.1989; Lin, 1992; Cousens et al., 1994 . Crustal
contamination may have contributed to enhance theseanomalies, as anatectic melts derived from ametapelitic source usually have these characteristicsŽ .Taylor and McLennan, 1985 . However, both theCA and UP also have this signature but show noevidences of crustal contamination, thus suggestingthat the sediment-derived fluids is the major compo-nent controlling the HFSE and Eu anomalies. Bycontrast, the anatectic melts are mainly responsiblefor the high d
18 O values, as they have trace elementsconcentrations similar to the melts derived from themetasomatized mantle.
6.1.4. Possible effects due to FC and AFCTo avoid assuming many unknown parameters, in
Section 6.1.3, high-level differentiation was not con-

( )R. Benito et al.rLithos 46 1999 773–802796
87 86 18 Ž . 87 86 3 Ž .Fig. 14. The Srr Sr–d O a and Srr Sr–1rSr=10 b diagrams of the metasomatism of the mantle and crustal contaminationmodel for the high-K calc-alkaline lavas of El Hoyazo and Mar Menor, and shoshonites of Vera. The numbers next to the metasomatism andcrustal contamination curve indicate the percentages of participation of the sediment-derived fluids and the crustal liquids, respectively. Datasources as in Fig. 12.
sidered, either before or after the contamination bycrustal liquids. If the primitive basaltic partial meltsdirectly derived from the mantle had experienced FCbefore that contamination, the only variation on theproposed model would correspond to the calculated
melting degrees from the metasomatized mantle. IfFC occurred after the contamination, the trends onthe 87Srr86Sr–1rSr diagram would be displacedhorizontally when the fractionation rates are identi-cal. The slope of these trends would also be modified
Table 4Ž .Contributions in mixing processes and degrees of partial melting % of components involved in the mantle metasomatismqcrustal
contamination hypothesisSr cŽ .Metasomatism Partial melting D s0.001 Crustal contaminationRS
Lithospheric Fluids derived Metasomatized Mantle Crustalmantle from sediments mantle melts liquids
a aMar Menor 95.0 5.0 9.9 37–78 63–22b b46–82 54–18a aEl Hoyazo 97.3 2.7 2.4 27–64 73–36b b30–65 70–35a aVera 98.8 1.2 0.8 12–65 88–35b b20–67 80–33
c 87 86 Ž .Calculated using the Srr Sr ratios of the restite xenoliths a: average; b: maximum and the Sr concentrations calculated for the crustalŽ .liquids see Table 3 .

( )R. Benito et al.rLithos 46 1999 773–802 797
according to the bulk solidrliquid distribution coef-ficient values. If DSr is -1, the later FC triggers anincreased concentration of the Sr in the melts, whichis higher when the initial concentration is lower. Thecontrary situation occurs if DSr is )1. In our case,a value of DSr s0.8 seems plausible as it wouldimply the fractionation of 60% plagioclase and 40%orthopyroxene, if we use the distribution coefficients
Ž .of Gill 1991 . These proportions are in agreementwith the modal composition of the potassic andesites
Žin the area Lopez-Ruiz and Rodrıguez Badiola,´ ´.1980 . For example, if the Mar Menor lavas experi-
enced, after the contamination by crustal liquids, afractionation of 50%, with DSr s0.8, the initial Srconcentration of the mantle-derived melt would be240 ppm, and the one of the crustal liquid 75 ppmŽ .Fig. 15a . These concentrations are slightly lowerthan those calculated for the model without fraction-ation. As a consequence, the required degree ofpartial melting of the metasomatized mantle and thecrustal contribution would also be lower.
If the crustal contamination follows AFC insteadof a simple mixing process, the straight-lines over
the 87Srr86Sr–1rSr diagram would start at the initialmagma composition, but they would not end at theSr composition of the assimilated material, but athigher values if DSr -1 or lower ones if DSr )1. Inthis case, in addition to DSr, it is also necessary to
Žassume values for r ratio of mass of crystals accu-mulated to the mass of material assimilated; seeTaylor, 1980; DePaolo, 1981; Taylor and Sheppard,
.1986 . For example, if the Mar Menor lavas under-went an AFC process, where rs1.25 and DSr s0.8,the Sr concentration in the crustal liquid would be 65
Ž .ppm Fig. 15b , lower than those calculated for thesimple mixing model.
As it can be deduced from these calculations, tomodel the effects due to AFC, it would be necessaryto assume the values of both DSr and r thus,introducing higher uncertainties into the model. Fi-nally, it is important to note that independently of theparticular process considered to calculate the interac-
Žtion with crustal components i.e., AFC vs. simple.mixing and the degree of complexity introduced
Žinto the model i.e., considering the effects due to.FC , the general model involving two mixing stages
Fig. 15. The 87Srr86Sr–1rSr=103 diagrams for the high-K calc-alkaline lavas of the Mar Menor. In this diagram, the following situationsŽ . Ž .have been considered: a the metasomatized mantle melts have suffered fractional crystallization FC after the crustal contamination
Ž . Ž . Žprocess, and b fractional crystallization and assimilation have been simultaneous AFC . The crosses represent the lavas Munksgaard,.1984; and this work and the solid circles represent the calculated melts.

( )R. Benito et al.rLithos 46 1999 773–802798
remains valid, and the only variations would beobtained for the absolute values of the parameters.
6.2. Geodynamic setting
The origin of the NVPS magmas has to be under-stood in terms of the complex tectonic history of thisAlpine realm. The tectonic evolution of the Beticsthat ultimately led to magmatic activity along the
ŽNVPS can be summarized in three main steps Doblasand Oyarzun, 1989; Banda et al., 1993; Vissers and
. Ž .van der Wal, 1993; Oyarzun et al., 1995 : 1 Creta-ceous to Oligocene NW-directed subduction of
Ž .oceanic crust; 2 Upper Oligocene–Lower Miocenecontinental collision, cessation of subduction, and
Ž .slab detachment and sinking into the mantle; and 3Middle to Upper Miocene extensional collapse of thealready overthickened orogenic wedge and the onset
Ž .of magmatic activity along the NVPS Fig. 16 .Asymmetric extension occurred along NE-orientedand SE-dipping major detachment systems. Top-to-the-SE displacement of the upper plate generated theextensional disruption of this realm, involving crustalupward arching, denudation of the Nevado–Filabride´metamorphic core complex, and upwelling of thepreviously metasomatized mantle beneath southeast-ern Iberia. Within this scenario, volcanism extrudedalong the NVPS through high-angle normal faults,disrupting the brittle upper-plate of the detachmentsystems. The overall collapse through major exten-sional detachment faults resulted in the strong thin-ning of the Betics realm, within a Basin and Range
Žtype tectonic scenario. Geophysical data IGME,.1983 indicate crustal thinning from 38 km in the
Iberian foreland to 14 km within the Alboran Sea.Moho depths beneath the NVPS range between 23
Ž .and 30 km Banda et al., 1993 . These values areintermediate between those of a thickened continen-
Žtal margin 50–70 km, Andean Central Volcanic. Ž .Zone and the average oceanic crust 7 km . How-
ever, since this realm underwent crustal thickeningŽ .during Pliocene time Lopez-Ruiz et al., 1993 , the´
current Moho depth of the NVPS might represent amaximum value. Perhaps a crustal thickness of ;20km would be closer to the actual values for Middleto Upper Miocene times.
Ž .As deduced from hot-spot motion Duncan, 1981 ,fast N drift of the African plate took place between
Fig. 16. Schematic model for the Eocene to Miocene geodynamicevolution of SE Spain.
Ž .40 and 20 Ma Upper Eocene–Lower Miocene , thusimplying high rates of convergence between Africaand Iberia. Under these conditions, we can envisagea shallow-dipping Benioff zone and an overall com-pressional stress regime preventing volcanic activity
Žin the Iberian margin e.g., Barazangi and Isacks,.1979; Jordan et al., 1983 . Low-angle subduction
would have also implied depression of the mantleisotherms resulting from the introduction of a cool
Žoceanic plate e.g., Toksoz et al., 1971; Schubert et¨.al., 1975; Anderson et al., 1992 . This is further
supported by the absence of magmatism during this

( )R. Benito et al.rLithos 46 1999 773–802 799
Žperiod of time Lopez-Ruiz and Rodrıguez Badiola,´ ´.1980; Doblas and Oyarzun, 1989 . The subsequent
extensional collapse of the overthickened Betic oro-gen through SE-dipping detachment systems inducedthe following: major lithospheric stretching, asym-metric isostatic uprise of asthenospheric mantle to-
Žwards the low-pressure thinned region Doblas and.Oyarzun, 1989 , melting of the subcontinental litho-
sphere and Middle to Upper Miocene magmatismalong the NVPS. The evolution of the detachmentsystems gave rise to a NW-dippingrdeepening
Ž .crust–mantle boundary Fig. 16 which accounts forthe NE-oriented geochemical, petrological and age
Žpolarity zonation observed within the NVPS from.the SE to NW; Fig. 1 , with progressively younger
volcanic ages, and a transition from CA to shoshoniticŽ .and final lamproitic magmatism Figs. 1 and 16 .
Two main points can be extracted from the previ-ous discussion, which are in agreement with the
Ž .proposed geochemical model: 1 the existence of aŽ .previous subduction under the Betics, and 2 the
contemporaneous character of the later extension andmagmatism. Subduction processes are likely to haveinduced a continuous metasomatism of the subconti-nental lithosphere by fluids involving a componentderived from the sediments carried by the descend-ing slab.
7. Conclusions
The KCA and SH rocks of the NVPS showsimilarly to the associated CA and UP ones, highLILErLREE, LILErHFSE and BrBe ratios andhigh Sr and O isotope values. Additionally, theyentrain metapelitic xenoliths, whose mineralogicaland chemical composition suggest that they representanatectic restites.
The contamination of the lithospheric mantle by afluid component derived from pelagic sediments pro-vides the geochemical modification of the mantlesource necessary to produce the characteristic sub-duction signature of high LILErHFSE ratios and
Ž .isotopic ratios relative to MORB . However, thishypothesis does not take into account the obviousinteraction with crustal rocks experienced by theKCA and SH magmas during their ascent to thesurface, as shown by the gneiss-derived xenoliths
which are found within these rocks, nor does itexplain the linear trends shown by the KCA and SHrocks in the 87Srr86Sr–1rSr diagram.
Trace elements and Sr–O isotopic ratios modelingfor the KCA and SH lavas, and their restitic xeno-liths, allow us to propose a petrogenetic model con-sisting of two mixing stages. During the first episode,
Ž .source-contamination metasomatism takes placewithin the lithospheric mantle by fluids derived from
Ž .subducted pelagic sediments between 1 and 5% .This process would yield a heterogeneous source
Ženriched in incompatible elements specially LILE. 87 86and LREE , and Srr Sr, with only minor modifi-
cation of the d18 O values. The partial melting of this
metasomatized mantle gives rise to magmas highlyenriched in LILE and LREE, that inherit the isotopicsignature of their source. In the second stage, duringtheir ascent to the surface, these magmas interactedwith crustal liquids from the Betic Paleozoic base-ment. Mixing between these two liquids producedmagmas enriched in d
18 O and to a lower extent in87Srr86Sr. On the contrary, although the crustal con-
Žtribution is high )18% at Mar Menor, )35% at El.Hoyazo and )33% at Vera , the effect on the trace
elements abundances is minor due to the similartrace element composition of both crustal- and man-tle-derived liquids.
The CA and associated volcanism of SE Spain isatypical in that it is not coeval with subductionprocesses and it is rather the consequence of theNeogene extensional disruption of a previously en-riched lithosphere. Compressional tectonics were ac-tive in the Betic orogen during two time-spans: late
Ž .Cretaceous to Oligocene subduction and lateŽ .Oligocene to early Miocene continental collision .
Therefore, the metasomatism of the lithosphericmantle takes place between the end of the Creta-ceous and the beginning of the Miocene, while thecrustal contamination and magmatic extrusion oc-curred during the Middle to Upper Miocene.
Acknowledgements
Financial support was provided by the Direccion´General de Ensenanza Superior e Investigacion˜ ´
Ž .Cientıfica Spain through the research project PB95-´0107. Sc, REE, Hf, Ta, Th and U, and Sr isotope

( )R. Benito et al.rLithos 46 1999 773–802800
analyses were funded in part by the Belgian NationalŽFund for Scientific Research grants to J.H. and
.D.D. . We also thank Dr. S. Foley, Dr. A. Embey-Isztin and an anonymous reviewer for their com-ments on the manuscript.
References
Anderson, D.L., Zhang, Y.S., Tanimoto, T., 1992. Plume heads,continental lithosphere, flood basalts and tomography. In:
Ž .Sorey, B.C., Alabaster, T., Pankhurst, R.J. Eds. , Magmatismand the Causes of Continental Break-up, Vol. 68. Geol. Soc.London Spec. Publ., pp. 99–124.
Arribas, A., Tosdal, R.M., 1994. Isotopic composition of Pb in oredeposits of the Betic Cordillera, Spain: origin and relationshipto other european deposits. Econ. Geol. 89, 1074–1093.
Banda, E., Gallart, J., Garcıa Duenas, V., Danobeitıa, J.J., Makris,´ ˜ ˜ ´J., 1993. Lateral variation of the crust in the Iberian Peninsula:new evidence from the Betic Cordillera. Tectonophysics 221,55–66.
Barazangi, M., Isacks, B., 1979. Subduction of the Nazca platebeneath Peru: evidence from spatial distribution of earth-quakes. Geophys. J. R. Astron. Soc. 57, 537–555.
Barreiro, B.A., 1983. Lead isotopic compositions of South Sand-wich Island volcanic rocks and their bearing on magma gene-sis in intra-oceanic arcs. Geochim. Cosmochim. Acta 47,817–822.
Bellon, H., Brousse, R., 1977. Le magmatisme perimediterraneen´ ´ ´Ž .occidental. Essai de synthese. Bull. Soc. Geol. France 19,`
469–480.Bellon, H., Bordet, P., Montenat, C., 1983. Chronologie du mag-
matisme neogene des Cordilleres Betiques, Espagne merid-´ ` ` ´ ´Ž .ionale. Bull. Soc. Geol. France 25, 205–217.
Benito, R., 1993. Hibridacion del manto y asimilacion de corteza´ ´continental en el magmatismo calco-alcalino y shoshonıtico´del SE de Espana. PhD Thesis, UAM, 222 pp.˜
Ben Othman, D., White, W.M., Patchett, J., 1989. The geochem-istry of marine sediments, island arc magma genesis, andcrust–mantle recycling. Earth Planet. Sci. Lett. 94, 1–21.
Biscaye, P.E., Dasch, E.J., 1971. The rubidium, strontium, stron-tium–isotope system in deep-sea sediments: Argentine basin.J. Geophys. Res. 76, 5087–5096.
Cesare, B., Salvioli, E., Venturelli, G., 1997. Crustal anatexis andmelt extraction during deformation in the restite xenoliths atEl Joyazo, SE Spain. Mineral. Mag. 61, 15–27.
Clayton, R.N., Mayeda, T.K., 1963. The use of bromine pentaflu-oride in extraction of oxygen from oxides and silicates forisotopic analysis. Geochim. Cosmochim. Acta 27, 43–52.
Cousens, B.L., Allan, J.F., Gorton, M.P., 1994. Subduction-mod-ified pelagic sediments as the enriched component in back-arcbasalts from the Japan Sea: Ocean Drilling Program Sites 797and 794. Contrib. Mineral. Petrol. 117, 421–434.
Dasch, E.J., 1969. Strontium isotopes in weathering profiles,deep-sea sediments, and sedimentary rocks. Geochim. Cos-mochim. Acta 33, 1521–1552.
Davidson, J.P., Harmon, R.S., 1989. Oxygen isotope constraintson the petrogenesis of volcanic arc magmas from Martinique,Lesser Antilles. Earth Planet. Sci. Lett. 95, 255–270.
DePaolo, D.J., 1981. Trace elements and isotopic effects ofcombined wallrock AFC. Earth Planet. Sci. Lett. 53, 189–202.
Di Battistini, G., Toscani, L., Iaccarino, S., Villa, I.M., 1987.KrAr ages and the geological setting of calc-alkaline volcanicrocks from Sierra de Gata, SE Spain. Neues Jahrb. Mineral.Mh. 8, 369–383.
Doblas, M., Oyarzun, R., 1989. Neogene extensional collapse inŽ .the western Mediterranean Betic–Rift orogenic belt : implica-
tions for the genesis of the Gibraltar Arc and magmaticactivity. Geology 17, 430–433.
Duncan, R., 1981. Hot-spots in the southern oceans—an absoluteframe of reference for motion of the Gondwana continents.Tectonophysics 74, 29–42.
Ellam, R.M., Harmon, R.S., 1990. Oxygen isotope constraints onthe crustal contribution to the subduction-related magmatismof the Aeolian islands, southern Italy. J. Volcanol. Geotherm.Res. 44, 105–122.
Ellam, R.M., Hawkesworth, C.J., 1988. Elemental and isotopicvariations in subduction related basalts: evidence for a three-component model. Contrib. Mineral. Petrol. 98, 72–80.
Ferrara, G., Laurenzi, M.A., Taylor, H.P., Tonarini, S., Turi, B.,1985. Oxygen and strontium isotope studies of K-rich volcanicrocks from the Alban Hills, Italy. Earth Planet. Sci. Lett. 75,13–28.
Gill, J.B., 1991. Orogenic andesites and plate tectonics. Springer,Berlin, 390 pp.
Harmon, R.S., Hoefs, J., 1995. Oxygen isotope heterogeneity ofthe mantle deduced from global 18 O systematics of basaltsfrom different geotectonic settings. Contrib. Mineral. Petrol.120, 95–114.
Hart, S.R., 1988. Heterogeneous mantle domains: signatures, gen-esis and mixing chronologies. Earth Planet. Sci. Lett. 90,273–296.
Hawkesworth, C.J., Gallagher, K., Hergt, J.M., McDermott, F.,1993. Mantle and slab contributions in arc magmas. Annu.Rev. Earth Planet. Sci. 21, 175–204.
Hawkesworth, C.J., Gallagher, K., Hergt, J.M., McDermott, F.,1994. Destructive plate margin magmatism: geochemistry andmelt generation. Lithos 33, 169–188.
Hertogen, J., Lopez-Ruiz, J., Rodrıguez Badiola, E., Demaiffe, D.,´ ´Weis, D., 1985. Petrogenesis of ultrapotassic volcanic rocksfrom SE Spain: trace elements and Sr–Pb isotopes. TerraCognita 5, 215–216.
Hertogen, J., Lopez-Ruiz, J., Demaiffe, D., Weis, D., 1988.´Modelling of source enrichment and melting processes for thecalc-alkaline–shoshonite–lamproite suite from SE Spain.Chem. Geol. 70, 153.
Hole, M.D., Saunders, A.D., Marriner, G.F., Tarney, J., 1984.Subduction of pelagic sediments: implications for the origin ofCe anomalous basalts from the Mariana Islands. J. Geol. Soc.Ž .London 141, 453–472.
Ž .IGME Ed. , 1983. Mapa Sismotectonico de Granada 1:100,000.´Madrid.
James, D.E., 1981. The combined use of oxygen and radiogenic
( )R. Benito et al.rLithos 46 1999 773–802 801
isotopes as indicators of crustal contamination. Annu. Rev.Earth Planet. Sci. 9, 311–344.
Jordan, T.E., Isacks, B.L., Allmendinger, R.W., Brewer, J.A.,Ramos, V.A., Ando, C.J., 1983. Andean tectonics related togeometry of subducted Nazca plate. Bull. Geol. Soc. Am. 94,341–361.
Kay, R.W., Sun, S.S., Lee Hu, C.N., 1978. Pb and Sr isotopes involcanic rocks from the Aleutian Islands and Pribilof Islands,Alaska. Geochim. Cosmochim. Acta 42, 263–273.
Kogiso, T., Tatsumi, Y., Nakano, S., 1997. Trace element trans-port during dehydration processes in the subducted oceaniccrust: 1. Experiments and implications for the origin of oceanisland basalts. Earth Planet. Sci. Lett. 148, 193–205.
Lin, P.-N., 1992. Trace element and isotopic characteristics ofwestern Pacific pelagic sediments: implications for the petro-genesis of Mariana Arc magmas. Geochim. Cosmochim. Acta56, 1641–1654.
Lonergan, L., Mange-Rajetsky, M.A., 1993. Evidence for internalzone unroofing, Betic Cordillera, SE Spain. In: Sereane, M.,´
Ž .Malavielle, J. Ed. , Late Orogenic Extension in MountainBelts, Vol. 219. Doc. BRGM, p. 126.
Lopez-Ruiz, J., Rodrıguez Badiola, E., 1980. La region volcanica´ ´ ´ ´neogena del sureste de Espana. Estudios Geol. 36, 5–63.´ ˜
Lopez-Ruiz, J., Wasserman, M.D., 1991. Relacion entre la hidrat-´ ´acionrdesvitrificacion y el d
18 O en las rocas volcanicas´ ´ ´neogenas del SE de Espana. Estudios Geol. 47, 3–11.´ ˜
Lopez-Ruiz, J., Rodriguez Badiola, E., Garcıa Cacho, L., 1977.´ ´Origine des grenats des roches calco-alcalines du Sud-Est del’Espagne. Bull. Volcanol. 40, 1–12.
Lopez-Ruiz, J., Cebria, J.M., Doblas, M., Oyarzun, R., Hoyos,´ ´M., Martın, C., 1993. The late Cenozoic alkaline volcanism of´
Žthe central Iberian Peninsula Calatrava Volcanic Province,.Spain : intraplate volcanism related to extensional tectonics. J.
Geol. Soc. 150, 915–922.Molin, D., 1980. Le volcanisme miocene du Sud-Est de l’Espagne`
Provinces de Murcia et d’Almeria. PhD Thesis, Univ. ParisVI, 289 pp.
Morris, J., Tera, F., 1989. 10 Be and 9 Be in mineral separates andwhole rocks from volcanic arcs: implications for sedimentssubduction. Geochim. Cosmochim. Acta 53, 3197–3206.
Morris, J., Leeman, W.P., Tera, F., 1990. The subducted compo-nent in island arc lavas: constraints from Be isotopes andB–Be systematics. Nature 344, 31–36.
Munksgaard, N.C., 1984. High d18 O and possible pre-eruptional
Rb–Sr isochrons in cordierite-bearing Neogene volcanics fromSE Spain. Contrib. Mineral. Petrol. 87, 351–358.
Munksgaard, N.C., 1985. A non-magmatic origin for composition-ally zoned euhedral garnets in silicic Neogene volcanics fromSE Spain. Neues Jahrb. Mineral. Mh. 2, 73–82.
Nelson, D.R., 1992. Isotope characteristics of potassic rocks:evidence for the involvement of subducted sediments in magmagenesis. Lithos 28, 403–420.
Nelson, D.R., McCulloch, M.T., Sun, S., 1986. The origins ofultrapotassic rocks as inferred from Sr, Nd and Pb isotopes.Geochim. Cosmochim. Acta 50, 231–245.
Nixon, P.H., Thirwall, M.F., Buckley, F., Davies, C.J., 1984.Spanish and Western Australian lamproites: aspects of whole
Ž .rock geochemistry. In: Kornprobst, J. Ed. , Kimberlites andRelated Rocks. Elsevier, Amsterdam, pp. 285–296.
Nobel, F.A., Andriessen, P.A.M., Hebeda, E.H., Priem, H.N.A.,Rondeel, H.E., 1981. Isotopic dating of the post-Alpine Neo-gene volcanism in the Betic Cordilleras, southern Spain. Geol.Mijnb. 60, 209–214.
Oyarzun, R., Marquez, A., Ortega, L., Lunar, R., Oyarzun, J.,1995. A late Miocene metallogenic province in southeastSpain: atypical Andean-type processes on a smaller scale.Trans. Inst. Min. Met. 104, 197–202, Sect. B: Appl. Earth Sci.
Pearce, J.A., 1982. Trace element characteristics of lavas fromŽ .destructive plate boundary. In: Thorpe, R.S. Ed. , Andesites.
Wiley, New York, pp. 525–548.Perfit, M.R., Gust, D.A., Bence, A.E., Arculus, R.J., Taylor, S.R.,
1980. Chemical characteristics of island–arc basalts: implica-tions for mantle sources. Chem. Geol. 30, 227–256.
Powell, J.L., Bell, K., 1970. Strontium isotopic studies of alkalicrocks. Localities from Australia, Spain and the western UnitedStates. Contrib. Mineral. Petrol. 27, 1–10.
Salvioli, E., Venturelli, G., 1996. Temperature of crystallizationŽand evolution of the Jumilla and Cancarix lamproites SE
.Spain as suggested by melt and solid inclusions in minerals.Eur. J. Mineral. 8, 1027–1039.
Schubert, G., Yuen, D.A., Turcotte, D.L., 1975. Role of phasetransitions in a dynamic mantle. Geophys. J. R. Astron. Soc.42, 705–735.
Taylor, H.P., 1980. The effects of assimilation of country rocks bymagmas on 18 Or16O and 87Srr86Sr systematics in igneousrocks. Earth Planet. Sci. Lett. 47, 243–254.
Taylor, S.R., McLennan, S.M., 1985. The Continental Crust: ItsComposition and Evolution. Blackwell, Oxford, 312 pp.
Taylor, H.P., Sheppard, S.M.F., 1986. Igneous rocks: I. Processesof isotopic fractionation and isotope systematics. In: Valley,
Ž .J.W., Taylor, H.P., O’Neil, J.R. Eds. , Stable Isotopes in HighTemperature Geological Processes, Vol. 16. Mineral. Soc.Am. Rev. Mineral., pp. 227–271.
Thompson, R.N., Morrison, M.A., Hendry, G.L., Parry, S.J.,1984. An assessment of the relative roles of crust and mantlein magma genesis: an elemental approach. Philos. Trans. R.Soc. London A 310, 549–590.
Toksoz, M.N., Minera, J.W., Julian, B.R., 1971. Temperature¨field and geophysical effects of a downgoing slab. J. Geophys.Res. 76, 1113–1138.
Toscani, L., Venturelli, G., Barbieri, M., Capedri, S., Fernandez,´J.M., Oddone, M., 1990. Geochemistry and petrogenesis oftwo-pyroxene andesites from Sierra de Gata, SE Spain. Min-eral. Petrol. 41, 199–213.
Toscani, L., Contini, S., Ferrarini, M., 1995. Lamproitic rocksfrom Cabezo Negro de Zeneta: brown micas as a record ofmagma mixing. Mineral. Petrol. 55, 281–292.
Venturelli, G., Capedri, S., Di Battistini, G., Crawford, A., Koga-rko, L.N., Celestini, S., 1984. The ultrapotassic rocks fromsoutheastern Spain. Lithos 17, 37–54.
Venturelli, G., Mariani, E.S., Foley, S.F., Capedri, S., Crawford,A.J., 1988. Petrogenesis and conditions of crystallization ofSpanish lamproitic rocks. Can. Mineral. 26, 67–79.
Venturelli, G., Capedri, S., Barbieri, M., Toscani, L., Salvioli, E.,

( )R. Benito et al.rLithos 46 1999 773–802802
Zerbi, M., 1991. The Jumilla lamproite revisited: a petrologi-cal oddity. Eur. J. Mineral. 3, 123–145.
Venturelli, G., Salvioli, E., Toscani, L., Barbieri, M., Gorgoni, C.,1993. Post-magmatic apatiteqhematiteqcarbonate assem-blage in the Jumilla lamproites. A fluid inclusion and isotopestudy. Lithos 30, 139–150.
Vissers, R.L.M., van der Wal, D., 1993. Geology of the Beticlithosphere: evidence for extensional collapse in the Alboran
Ž .realm. In: Sereane, M., Malavielle, J. Eds. , Late Orogenic´Extension in Mountain Belts, Vol. 219. Doc. BRGM, pp.204–205.
White, W.M., Dupre, B., 1986. Sediment subduction and magma´genesis in the Lesser Antilles: isotopic and trace elementconstraints. J. Geophys. Res. 91, 5927–5941.
White, W.M., Dupre, B., Vidal, P., 1985. Isotope and trace´
element geochemistry of sediments from the BarbadosRidge–Demerara Plain region, Atlantic Ocean. Geochim. Cos-mochim. Acta 49, 1875–1886.
ŽWoodhead, J.D., 1989. Geochemistry of the Mariana arc western.Pacific : source composition and processes. Chem. Geol. 76,
1–24.Zeck, H.P., 1968. Anatectic origin and further petrogenesis of
almandine-bearing biotite–cordierite–labradorite–dacite withmany inclusions of restite and basaltoid material, Cerro delHoyazo, SE Spain. PhD Thesis, Amsterdam Univ., 161 pp.
Zeck, H.P., 1970. An Erupted Migmatite from Cerro del Hoyazo,SE Spain. Contrib. Mineral. Petrol. 26, 225–246.
Zeck, H.P., 1992. Restite-melt and mafic–felsic magma mixingand mingling in an S-type dacite, Cerro del Hoyazo, southeast-ern Spain. Trans. R. Soc. Edinburgh: Earth Sci. 83, 139–144.


![Medical Isotope Production and Use [March 2009] - National Isotope](https://img.dokumen.tips/doc/110x75/62038cd4da24ad121e4ab7b4/medical-isotope-production-and-use-march-2009-national-isotope.jpg)
