Embed Size (px)
DESCRIPTION
SR 109 Access Management Study. Technical Committee Meeting September 9, 2014. Agenda. Welcome and Introductions Project Management Report Technical Report Next Steps. Study Area. Study Goals and Objectives. - PowerPoint PPT Presentation
Citation preview
Technical Committee Meeting
September 9, 2014
SR 109 Access Management Study

Agenda
Welcome and Introductions
Project Management Report
Technical Report
Next Steps

Study Area

Study Goals and Objectives
Preserve and enhance the long-term safety, efficiency, economic development, and environmental resources of the SR 109 corridor
Develop an access management plan and permitting process that defines standards and policies for the location, spacing, design and operation of:
Driveways Street connections Median openings Traffic signals Interchanges

Study Outcomes
Access Management
Plan
Corridor Vision Access Categories
Recommended Improvements

Project Management Report

Project Management Report Project Schedule
Task 1: Project Management Plan
Task 2: Publ ic, Stakeholder, and Media Outreach Plan
Task 3: Technica l Review & Analys is of Historic, Existing and Future Conditions
Task 4: Document & Assess Existing Access Management Guidel ines and Practices
Task 5: Develop Access Management Resource Ki t
Task 6: Develop Corridor Specifi c Access Management Plan
Task 7: Prepare Final Documentation & Electronic Fi les
Steering Committee/Corridor Management Commitee Meetings Public Meetings
Technical Committee Meetings Major Deliverables
Jan Feb2014 2015
May Task
AprilJune SeptAugJuly MarchNov DecOct
0 0
0

Project Management Report Public Workshops – Objectives
1. Establish a vision for the corridor
2. Discuss how access management can help achieve the vision for the corridor
3. Ask corridor stakeholders to identify areas of concern – opportunities and challenges

Project Management Report Public Workshops – Agenda
A. Welcome & Introductions
B. Presentation – Setting the Context
C. Establishing Corridor Values and Priorities – Priority Pyramid
D. Locations of Concern and Opportunities – Mapping Exercise
E. Establishing a Corridor Vision
F. Adjourn

Project Management Report Public Workshops – Location/Dates/Time
- Potential locations – two meetings:
o Sumner County Administration Building
o Wilson County Courthouse
- Potential meeting dates/time – 5:30-7:00 pm:
o Wednesday and Thursday October 22 and 23
o Wednesday and Thursday October 29 and 30
o Wednesday and Thursday November 12 and 13

Project Management Report Public Workshops – Outreach
- Stakeholder database
o Elected and government officials
o Property owners along corridor
o Other major stakeholders (civic, business, and community)
- Workshop announcement
o MPO media contact list
o State, regional, and local partners – websites and social media

Technical Report: Existing Conditions and Trends

Task 3 - Existing Conditions & Trends Existing Plans & Programs – Goals & Objectives
Environmental Features & Natural Resources
Land Use and Development Patterns
Travel Demand & Transportation System Performance
Performance Measures

Existing Plans & Programs
SR 109
TDOT Long Range
Transportation Plan MPO
Regional Transportation
Plan 2035
MPO Transportation Improvement
Program 2014-2017
MPO Regional Bicycle &
Pedestrian StudyMPO Tri-County
Land Use and Transportation
Study
2035 Comprehensive Plan: Sumner
County’s Blueprint to the Future
Wilson County Gateway Land
Use Master Plan
Gallatin on the Move
2020
Lebanon Future Land
Use Plan Update
Lebanon Major Thoroughfare
Plan
Portland Future Land
Use Map

Related Goals & Objectives1. Maximize economic opportunity and economic competitiveness
by identifying strategic development areas
2. Maintain the rural character of communities by encouraging development in existing community centers
3. Preserve environmental features by protecting natural resources
4. Ensure that the highway operates as a high-speed, high volume transportation facility for the movement of people and goods by managing congestion
5. Support all transportation modes by providing access to safe and convenient pedestrian, bicycle, and transit systems
6. Establish and maintain ongoing collaborative partnerships across jurisdictions and agencies by coordinating policies and standards
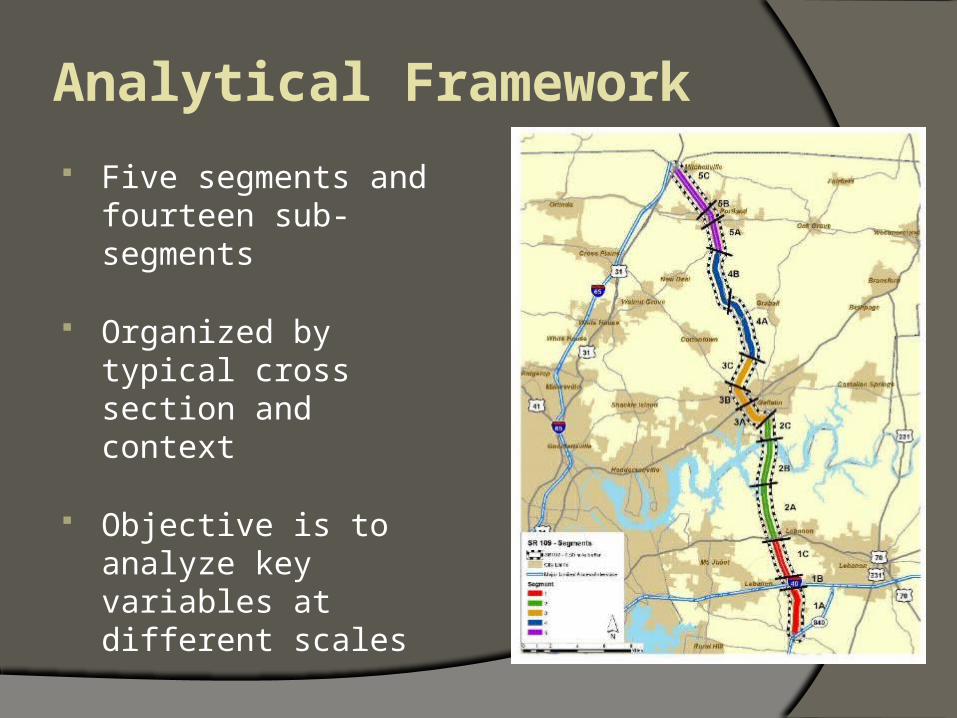
Five segments and fourteen sub-segments
Organized by typical cross section and context
Objective is to analyze key variables at different scales
Analytical Framework

Segment 1
Industrial uses anchor both ends of corridor and ends of Gallatin Bypass
Office, commercial and mixed use concentrations – from Hickory Ridge Rd. to US 70/Lebanon Rd. and adjacent to Gallatin bypass
Residential/rural uses and significant environmental features north of US 70 to River and from Gallatin Bypass to Portland
Strip commercial from River to Gallatin Bypass and through Portland
Parcels Property Owners
161 128
Land Development and Environmental Constraints
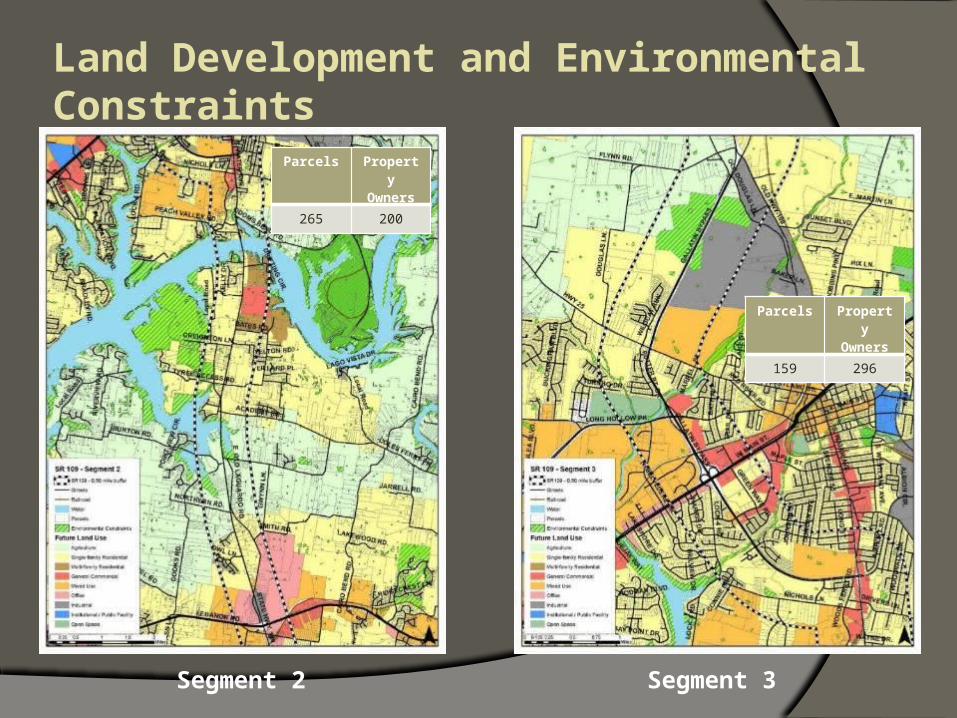
Segment 2 Segment 3
Parcels Property Owners
159 296
Parcels Property Owners
265 200
Land Development and Environmental Constraints

Segment 4 Segment 5
Parcels Property Owners
358 256
Parcels Property Owners
97 64
Land Development and Environmental Constraints

Crash Locations Between 2011-2013, SR 109
averaged more than 430 crashes per year
30% of the crashes resulted in injuries, including 11 fatalities
- Six of the fatalities occurred between US 70 and the Gallatin Bypass
Crashes are concentrated at or near intersections and interchanges, including:- I-40 interchange area- Long Hollow Pike- SR 25/Red River Rd.- SR 52

Crash Locations
2011 - 2013 Total Crashes
1 - 10 crashes
11 - 25 crashes
26 - 50 crashes
51 - 125 crashes

Crash Locations
2011 - 2013 Total Crashes
1 - 10 crashes
11 - 25 crashes
26 - 50 crashes
51 - 125 crashes

Crash Locations
2011 - 2013 Total Crashes
1 - 10 crashes
11 - 25 crashes
26 - 50 crashes
51 - 125 crashes

Crash Locations
2011 - 2013 Total Crashes
1 - 10 crashes
11 - 25 crashes
26 - 50 crashes
51 - 125 crashes

Crash Locations
2011 - 2013 Total Crashes
1 - 10 crashes
11 - 25 crashes
26 - 50 crashes
51 - 125 crashes
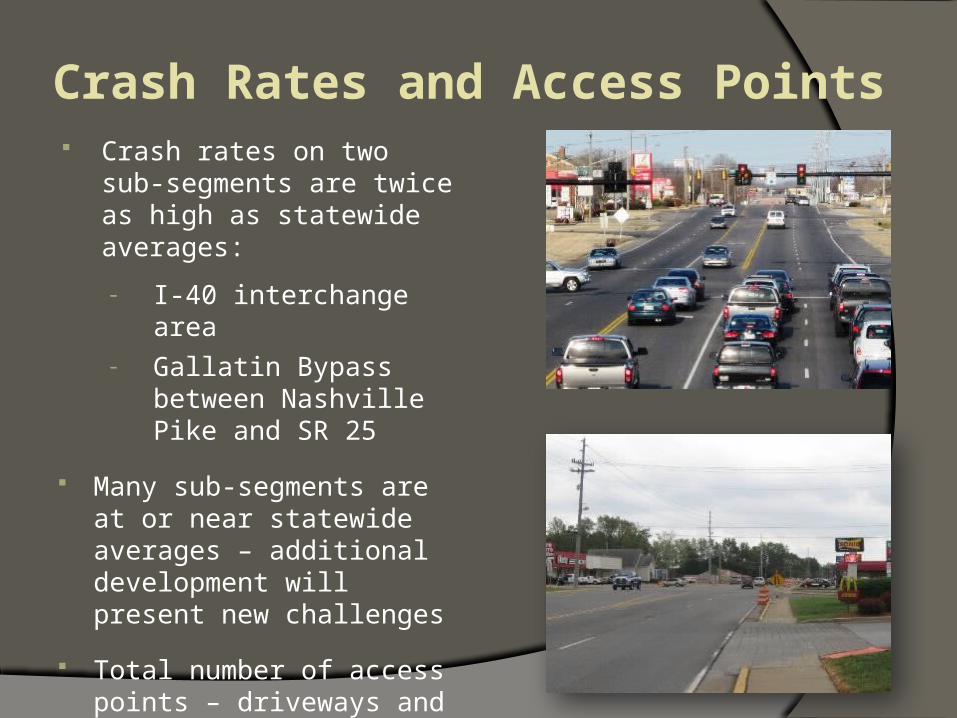
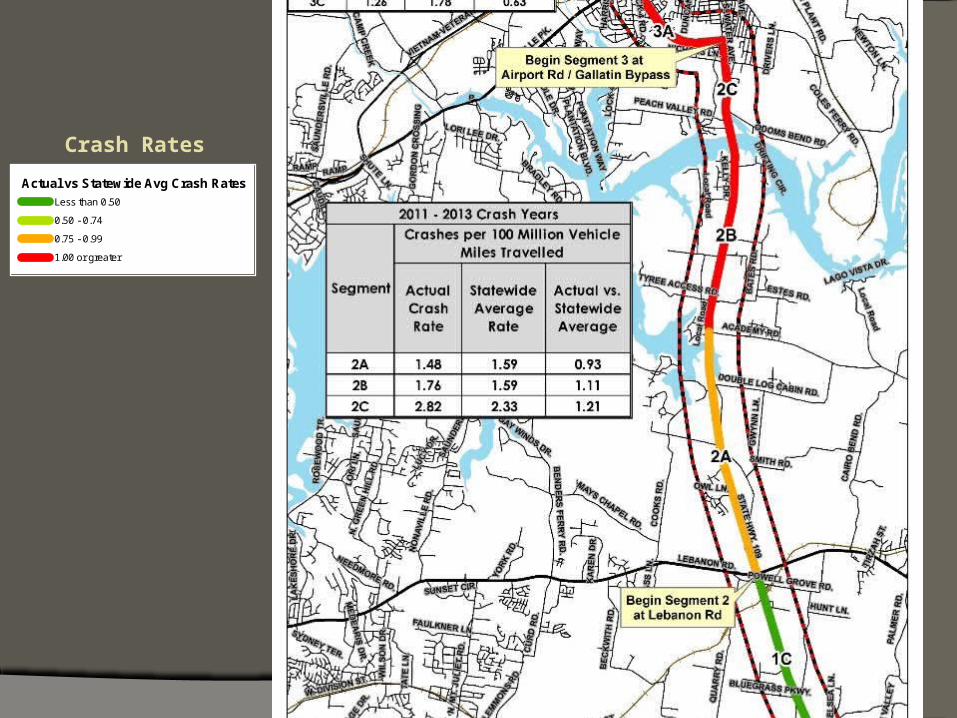
Crash Rates and Access Points Crash rates on two sub-
segments are twice as high as statewide averages:
- I-40 interchange area- Gallatin Bypass between
Nashville Pike and SR 25
Many sub-segments are at or near statewide averages – additional development will present new challenges
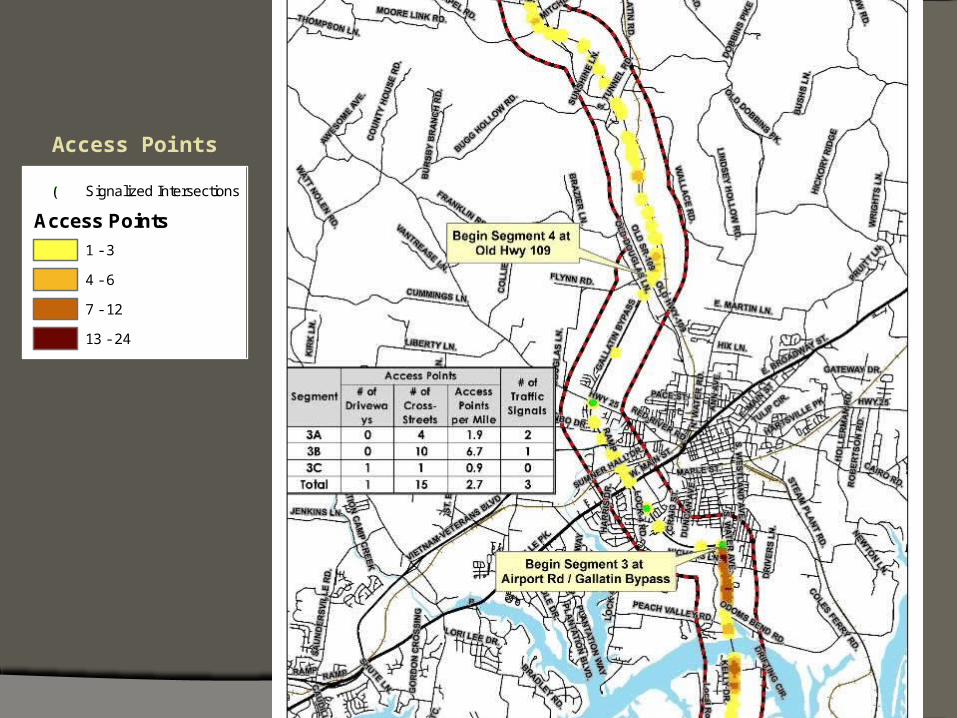
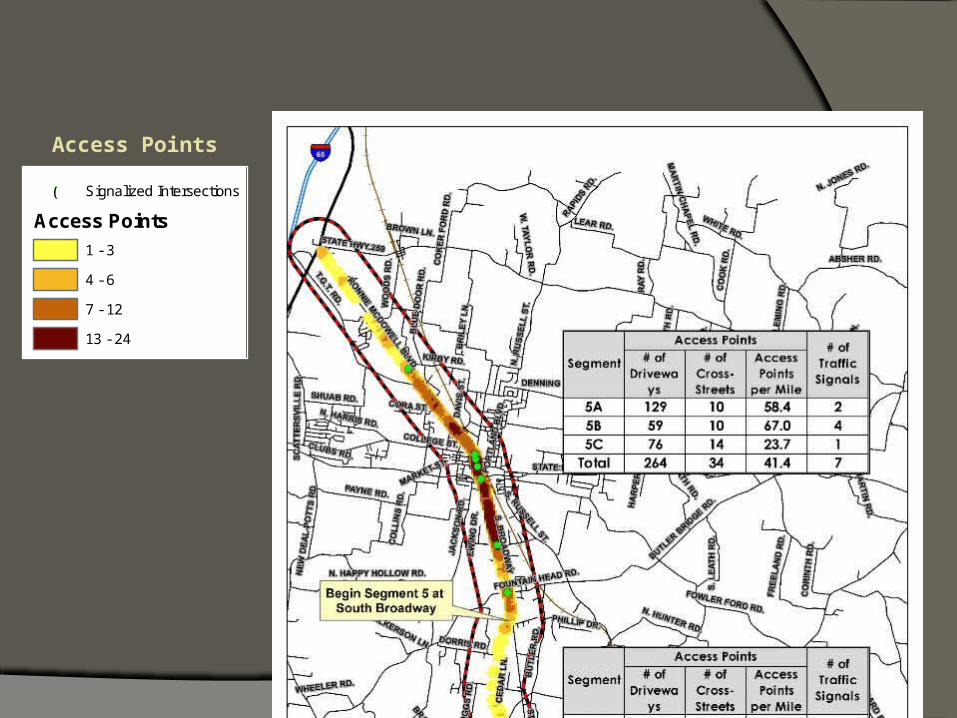
Total number of access points – driveways and streets – and signalized intersections strongly impacts safety

Crash Rates
Actual vs Statewide Avg Crash Rates
Less than 0.50
0.50 - 0.74
0.75 - 0.99
1.00 or greater
Crash Rates
Actual vs Statewide Avg Crash Rates
Less than 0.50
0.50 - 0.74
0.75 - 0.99
1.00 or greater
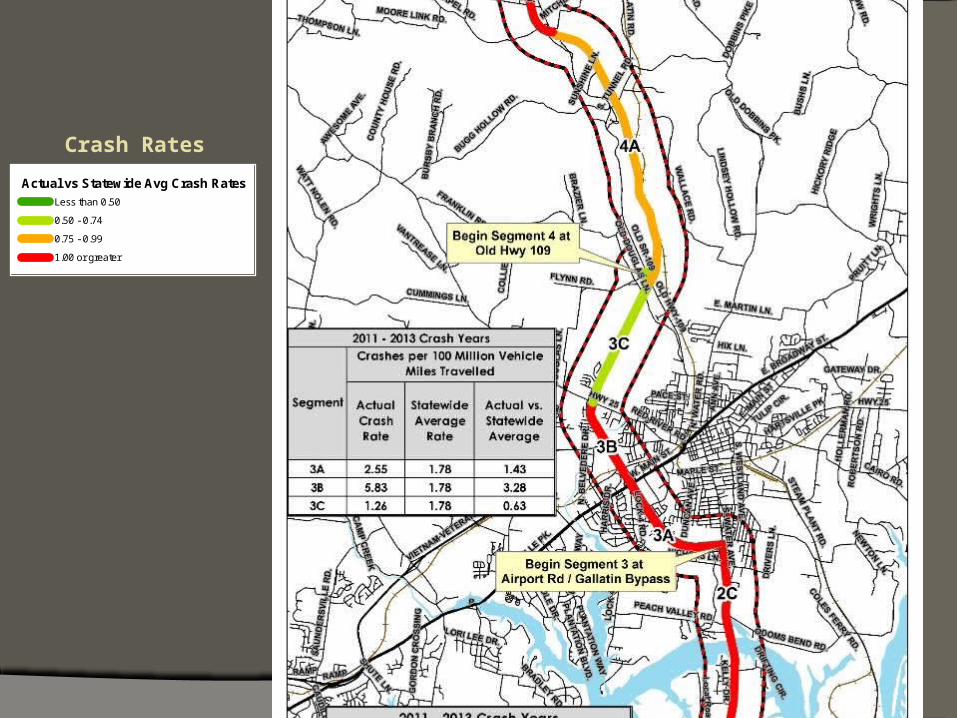
Crash Rates
Actual vs Statewide Avg Crash Rates
Less than 0.50
0.50 - 0.74
0.75 - 0.99
1.00 or greater
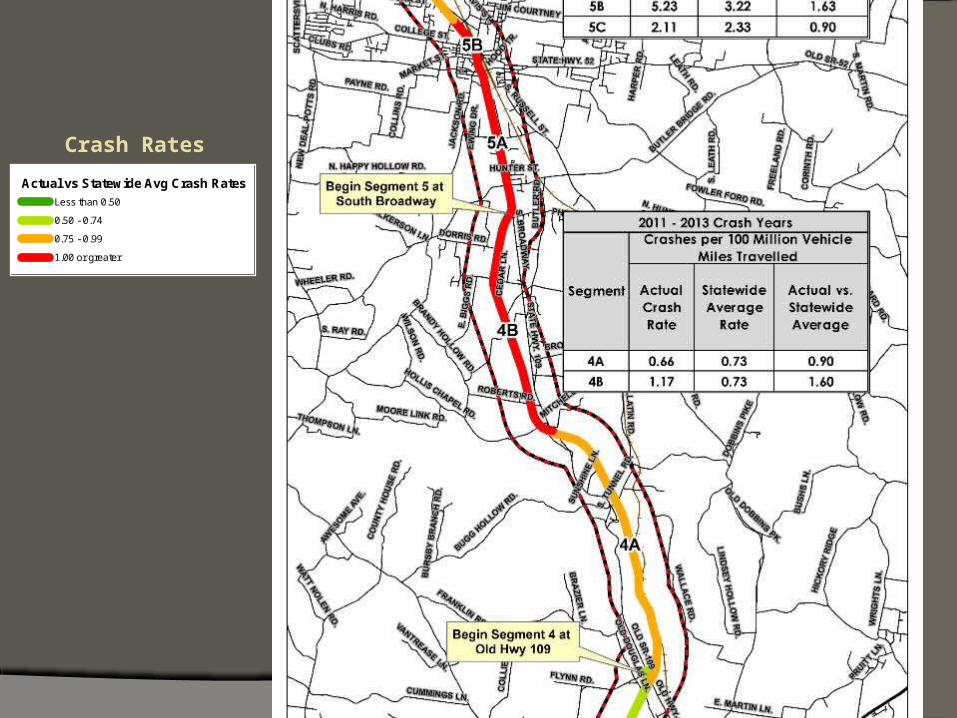
Crash Rates
Actual vs Statewide Avg Crash Rates
Less than 0.50
0.50 - 0.74
0.75 - 0.99
1.00 or greater
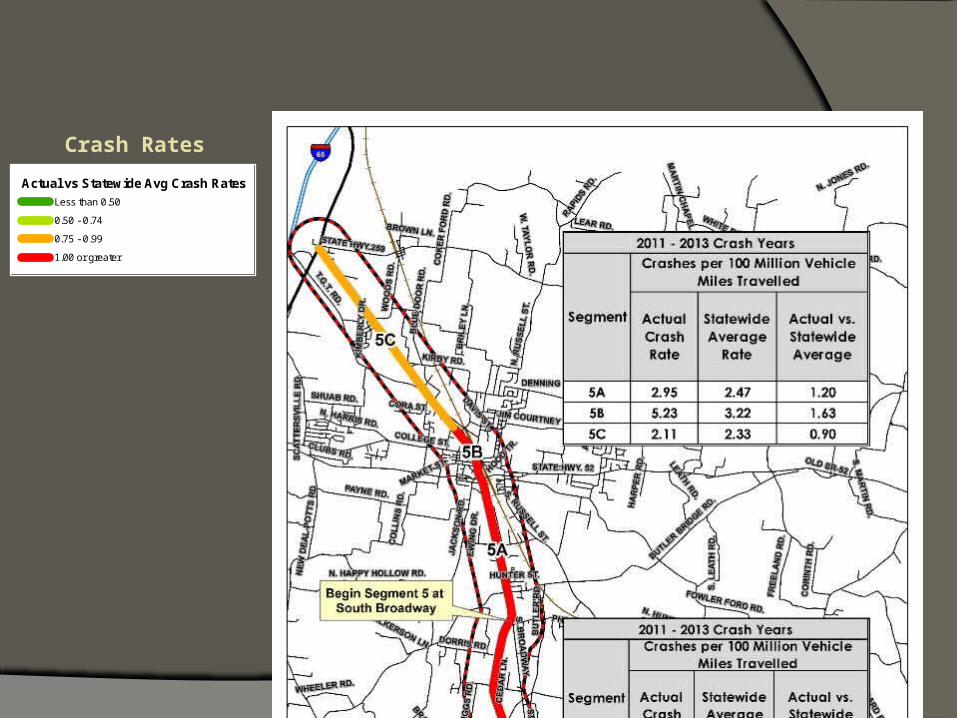
Crash Rates
Actual vs Statewide Avg Crash Rates
Less than 0.50
0.50 - 0.74
0.75 - 0.99
1.00 or greater

Access Points
!( Signalized Intersections
Access Points
1 - 3
4 - 6
7 - 12
13 - 24

Access Points
!( Signalized Intersections
Access Points
1 - 3
4 - 6
7 - 12
13 - 24
Access Points
!( Signalized Intersections
Access Points
1 - 3
4 - 6
7 - 12
13 - 24

Access Points
!( Signalized Intersections
Access Points
1 - 3
4 - 6
7 - 12
13 - 24
Access Points
!( Signalized Intersections
Access Points
1 - 3
4 - 6
7 - 12
13 - 24

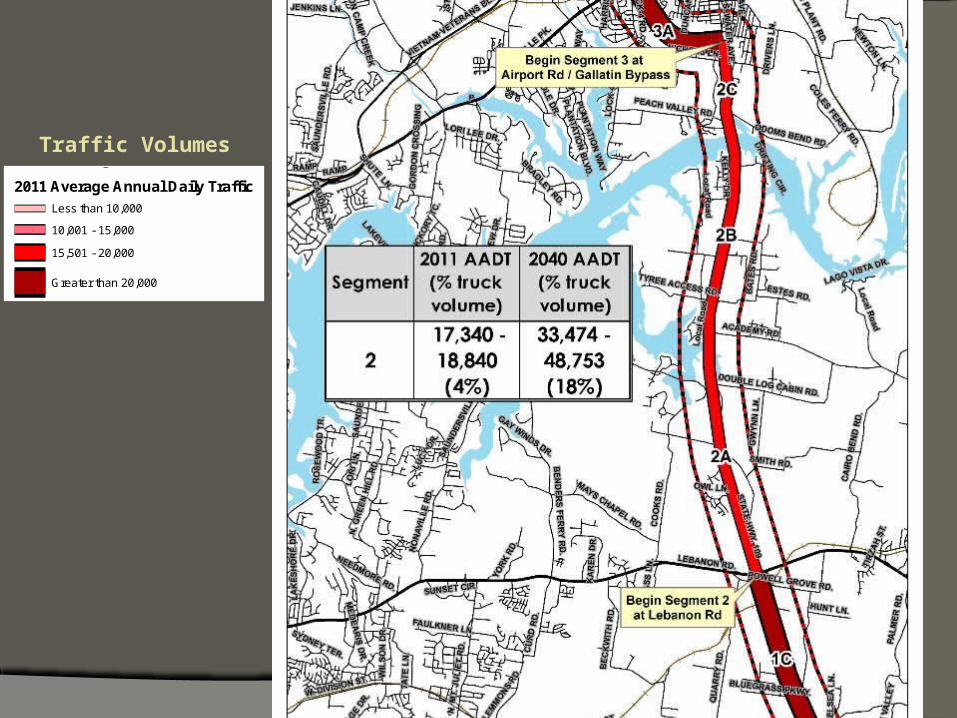
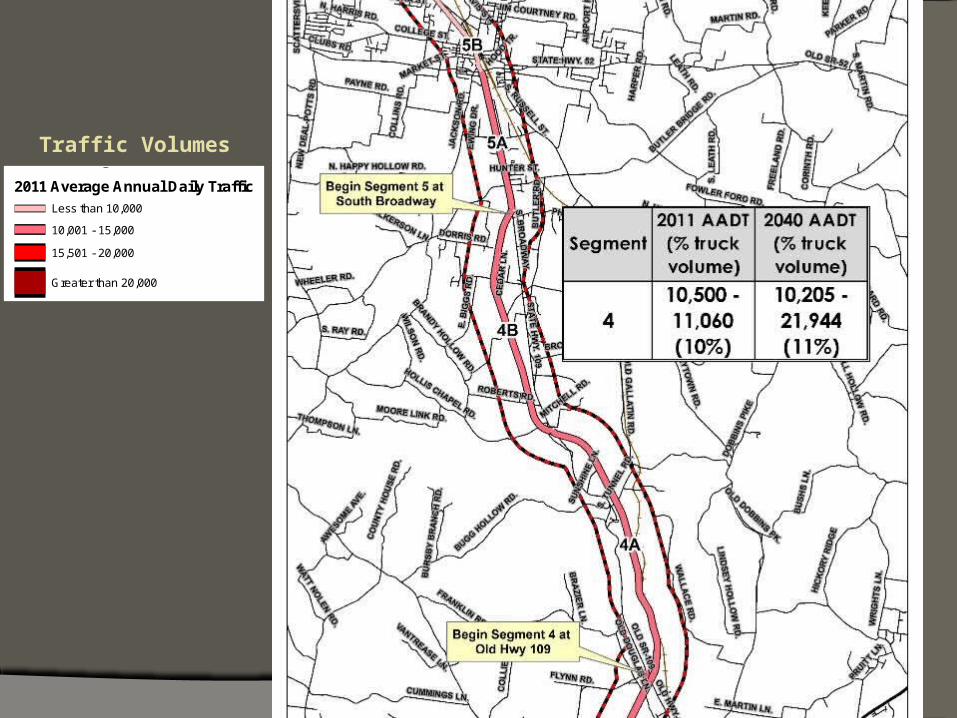
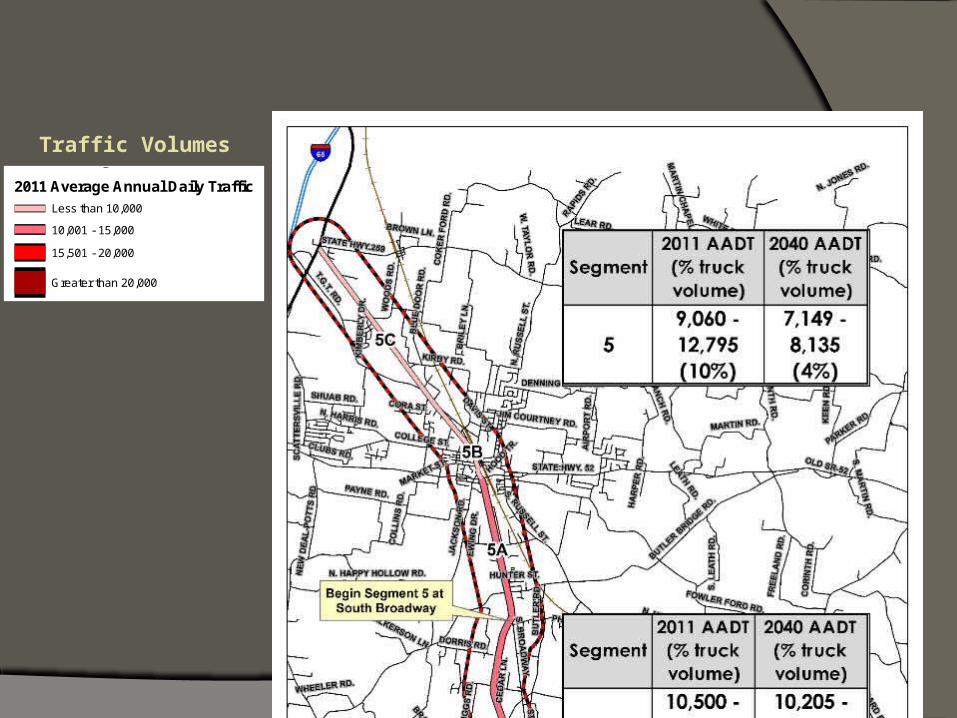
Traffic Volumes & Speed Traffic volumes are projected to
more than double by 2040 on SR 109 between SR 840 and Portland
The percentage of truck traffic is forecasted to increase as much as fourfold over the next 25 years
As percent of free flow speed, average peak hour speeds are lowest:
- Between I-40 and US 70/Lebanon Road
- On the southern end of the Gallatin Bypass
- South of SR 52 in Portland
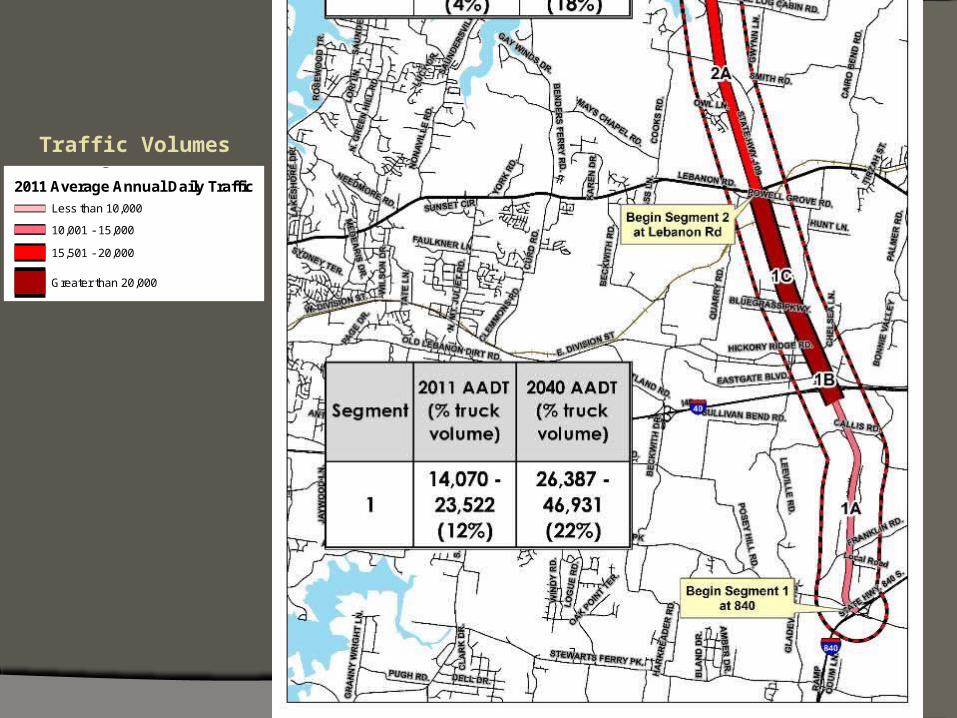
Traffic VolumesSR 109 - Segment 1
2011 Average Annual Daily TrafficLess than 10,000
10,001 - 15,000
15,501 - 20,000
Greater than 20,000
SR109 - 0.50 mile buffer
Streets
Railroad
Parcels
Water
City Limits
Traffic VolumesSR 109 - Segment 1
2011 Average Annual Daily TrafficLess than 10,000
10,001 - 15,000
15,501 - 20,000
Greater than 20,000
SR109 - 0.50 mile buffer
Streets
Railroad
Parcels
Water
City Limits

Traffic VolumesSR 109 - Segment 1
2011 Average Annual Daily TrafficLess than 10,000
10,001 - 15,000
15,501 - 20,000
Greater than 20,000
SR109 - 0.50 mile buffer
Streets
Railroad
Parcels
Water
City Limits
Traffic VolumesSR 109 - Segment 1
2011 Average Annual Daily TrafficLess than 10,000
10,001 - 15,000
15,501 - 20,000
Greater than 20,000
SR109 - 0.50 mile buffer
Streets
Railroad
Parcels
Water
City Limits
Traffic VolumesSR 109 - Segment 1
2011 Average Annual Daily TrafficLess than 10,000
10,001 - 15,000
15,501 - 20,000
Greater than 20,000
SR109 - 0.50 mile buffer
Streets
Railroad
Parcels
Water
City Limits

Mid
night
1:00
AM
2:00
AM
3:00
AM
4:00
AM
5:00
AM
6:00
AM
7:00
AM
8:00
AM
9:00
AM
10:0
0 AM
11:0
0 AM
Noon
1:00
PM
2:00
PM
3:00
PM
4:00
PM
5:00
PM
6:00
PM
7:00
PM
8:00
PM
9:00
PM
10:0
0 PM
11:0
0 PM
44.0
46.0
48.0
50.0
52.0
54.0
56.0
Northbound Southbound
Corridor Travel TimePeak period:7 AM to 8 AMSouthbound53:45 travel time42.3 miles per hour

SR 109 Travel Time Today Free flow
47 minutes, 8 seconds
Peak hour delay 6 minutes,
43 seconds

1A 1B 1C 2A 2B 2C 3A 3B 3C 4A 4B 5A 5B 5C0.0
1.0
2.0
3.0
4.0
5.0
6.0
7.0
4.96
0.95
3.20
5.04
4.06
2.11 2.31
1.64
2.44
5.31
4.434.08
2.06
4.55
0.00
0.84
1.32
0.15
0.22
0.01
0.54
0.29
0.37
0.21
0.081.23
0.00
1.46
Segment Travel Times (Min.)
Free Flow Time Delay

Driveway connections and speed
Less connections = more speed

1A 1B 1C 2A 2B 2C 3A 3B 3C 4A 4B 5A 5B 5C0
20
40
60
80
100
120
140
160
1222
74 7964
56
4 102
3447
139
69
90
Existing Connections on SR 109

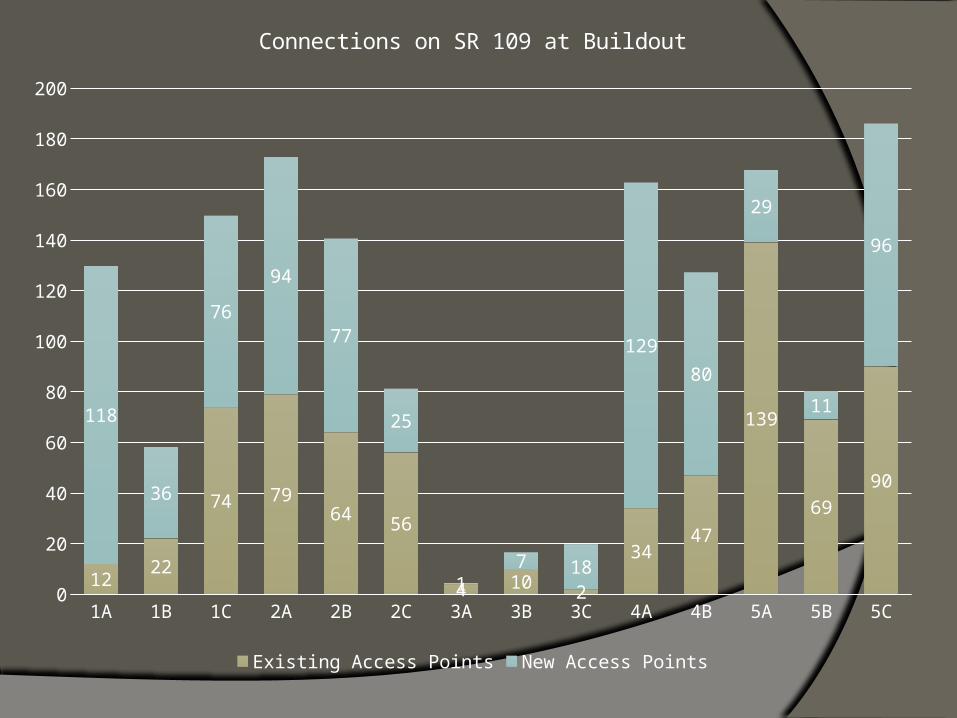
Current practice
One parcel = one connection (or more)
1A 1B 1C 2A 2B 2C 3A 3B 3C 4A 4B 5A 5B 5C0
20
40
60
80
100
120
140
160
180
200
1222
74 7964
56
4 102
3447
139
69
90
118
36
76
94
77
25
17 18
129
80
29
11
96
Connections on SR 109 at Buildout
Existing Access Points New Access Points

Speed guidelines
Speed (mph) Minimum Connection
Spacing
20 120
25 200
30 330
35 470
40 630
45 870
TRB Access Management Manual

1A 1B 1C 2A 2B 2C 3A 3B 3C 4A 4B 5A 5B 5C0
200
400
600
800
1,000
1,200
1,400
1,600
1,800
2,0003,270
420 420
560 560
300
5,600
1,580
11,830
1,510
910
180 160
440
300
160210
260 250210
4,910
950
1,190
320 340
150 140
220
Connection Spacing
ExistingBuildout
4,900
3,270 5,600 11,800

1A 1B 1C 2A 2B 2C 3A 3B 3C 4A 4B 5A 5B 5C0
10
20
30
40
50
60
Posted Speed
Existing Posted Speed Future Posted Speed
1A 1B 1C 2A 2B 2C 3A 3B 3C 4A 4B 5A 5B 5C0.0
2.0
4.0
6.0
8.0
10.0
12.0
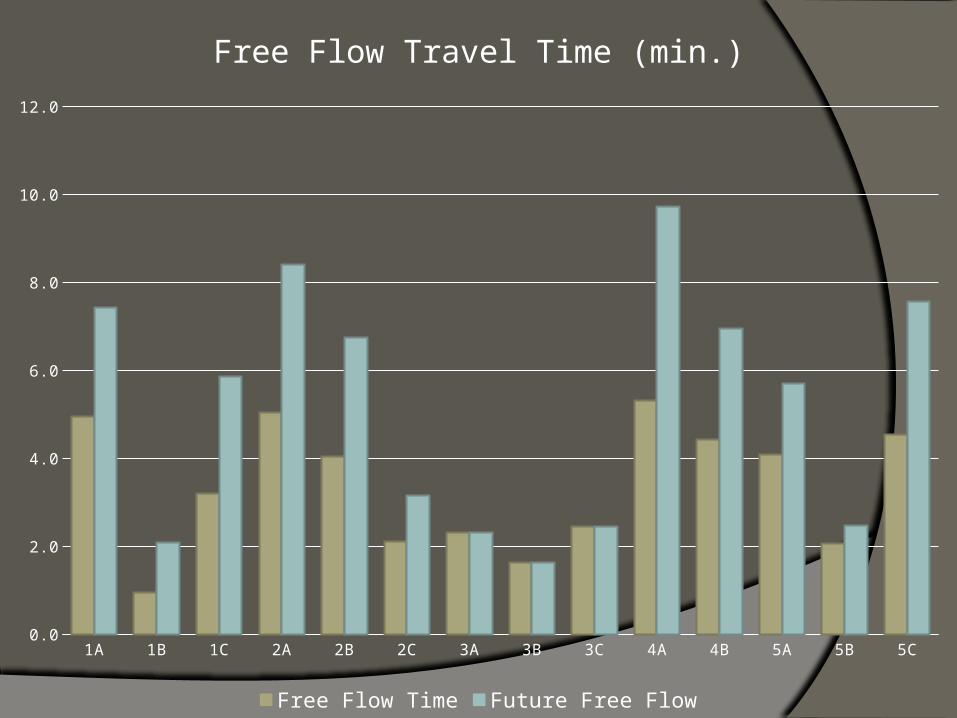
Free Flow Travel Time (min.)
Free Flow Time Future Free Flow
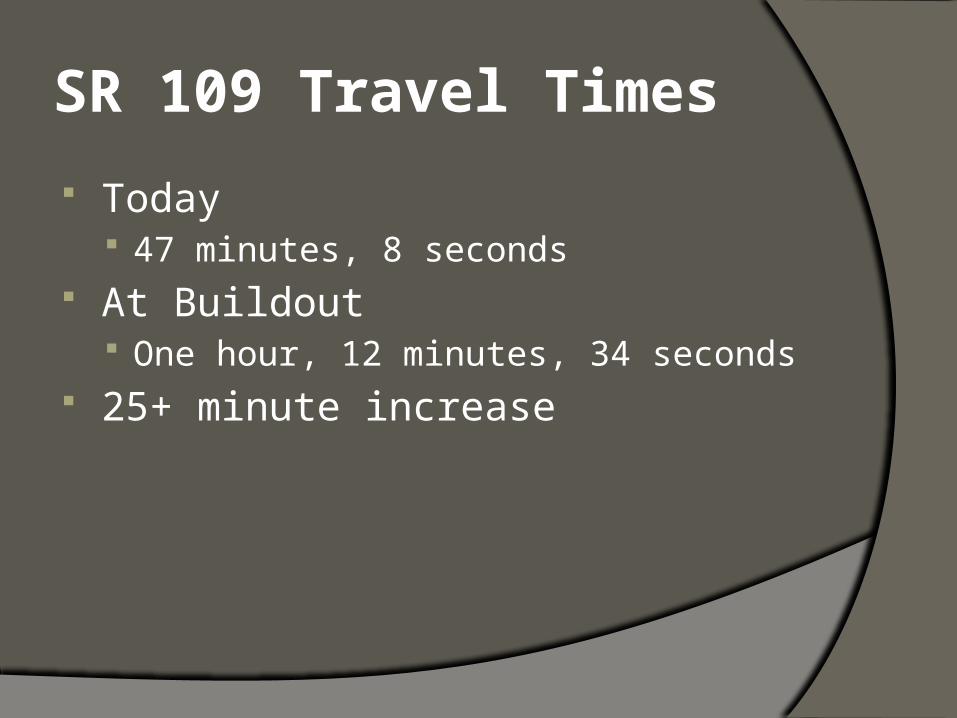
SR 109 Travel Times
Today 47 minutes, 8 seconds
At Buildout One hour, 12 minutes, 34 seconds
25+ minute increase
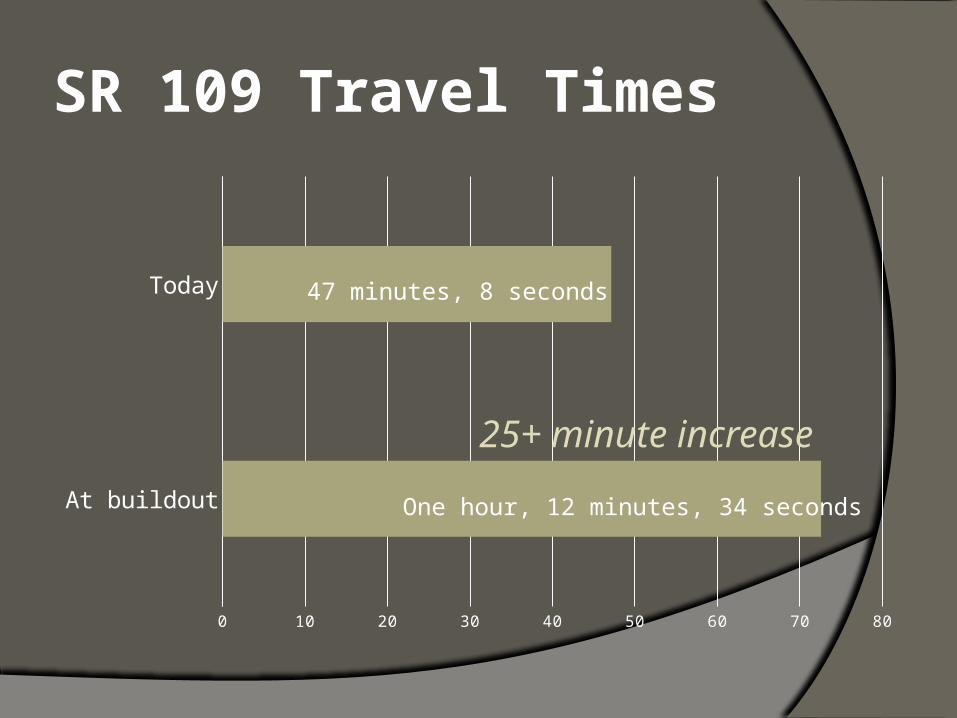
SR 109 Travel Times
At buildout
Today
0 10 20 30 40 50 60 70 80
47 minutes, 8 seconds
One hour, 12 minutes, 34 seconds
25+ minute increase

Key Findings Land Development & Environmental Constraints
- Four general land development patterns: industrial, commercial/mixed use, strip commercial, and residential/rural
Safety
- High number of crashes throughout corridor, but concentrated at or near intersections and interchanges
- Total number of access points and signalized intersections strongly impacts safety
Travel Demand
- Traffic volumes projected to more than double and the percentage of truck traffic to increase fourfold over the next 25 years – projected 25+ minute increase

Proposed Performance Measures Safety
- Crash potential Mobility
- Average travel time Access
- Connection spacing Economic Development
- Market area- Time required to process permits
Environmental Impacts- Air pollution- Water quantity/Water quality

Technical Report: Existing Access Management Guidelines & Practices

Driveway Permitting on SR 109
Statute directs Commissioner to adopt Rules
Current Rules are dated 2003, but have changed little for several decades
The Rules are substantially inadequate for major arterials considering modern access design practice
TDOT does not appear to have the ability to adopt stricter permitting criteria for specific corridors such as SR 109
TDOT driveway Rules need updating to current accepted practice

Access Permitting Process
Permit coordination is maintained between TDOT and local agencies, but vary in method
Local agencies are generally pleased with TDOT coordination process
TDOT driveway Rules approve driveway access but local agencies control requests
TDOT has authorized new driveways during projects without consulting locals
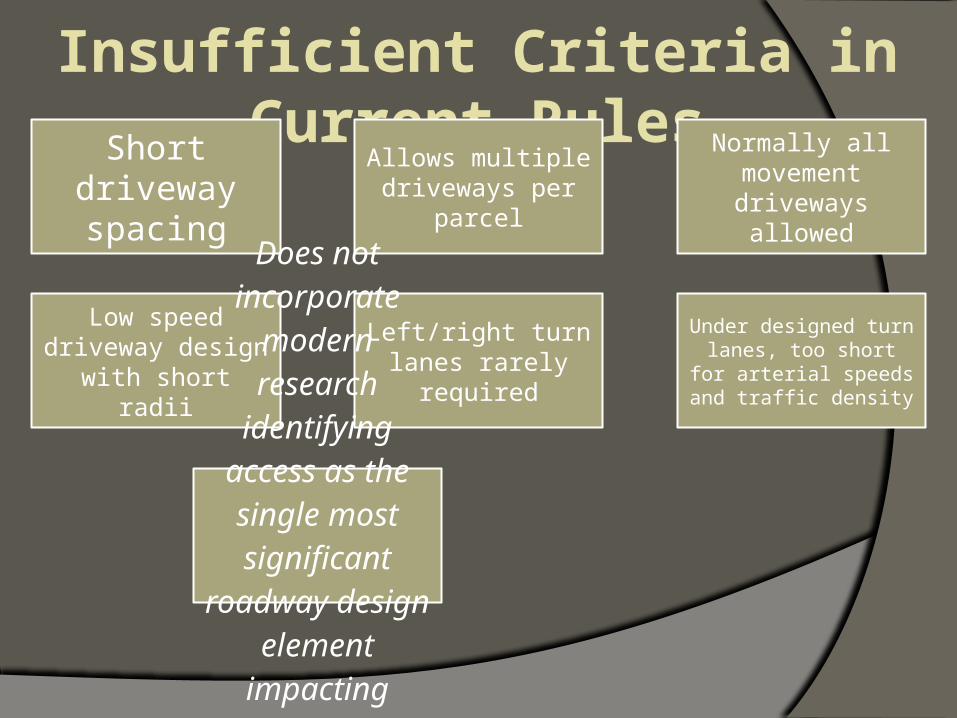
Insufficient Criteria in Current RulesShort
driveway spacing
Allows multiple driveways per
parcel
Normally all movement
driveways allowed
Low speed driveway design with short radii
Left/right turn lanes rarely
required
Under designed turn lanes, too short for arterial speeds and traffic density
Does not incorporate
modern research
identifying access as the single most significant
roadway design element
impacting safety and
capacity along a roadway
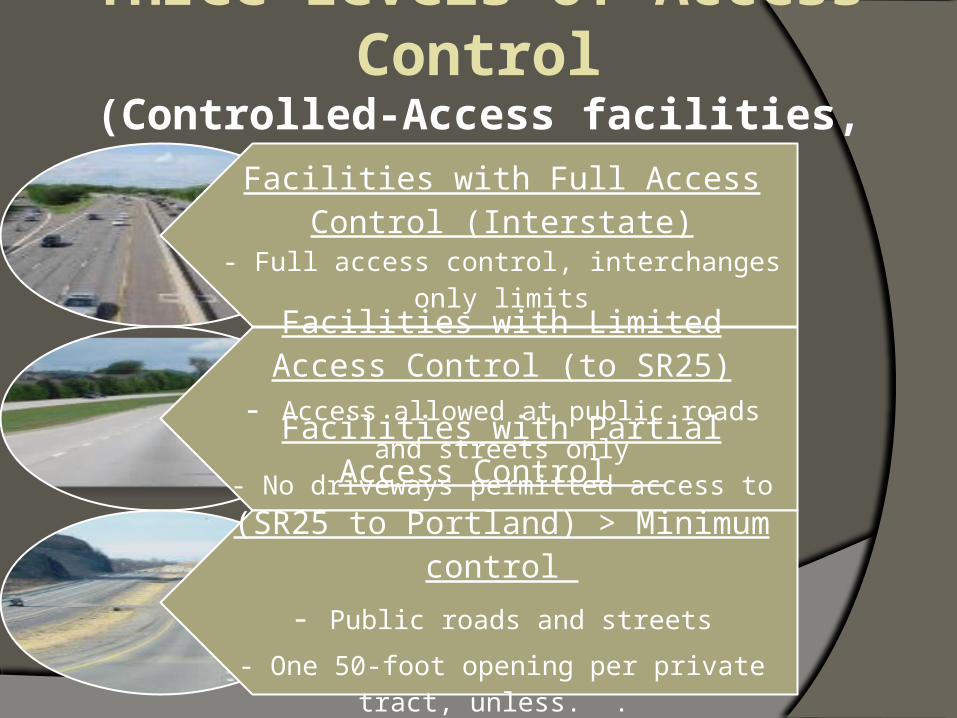
Three Levels of Access Control
(Controlled-Access facilities, TCA 54-16-101.)
Facilities with Full Access Control (Interstate)
- Full access control, interchanges only limits
Facilities with Limited Access Control (to SR25)
- Access allowed at public roads and streets only
- No driveways permitted access to the mainlineFacilities with Partial Access Control (SR25 to Portland) > Minimum control
- Public roads and streets
- One 50-foot opening per private tract, unless. .
- Existing driveways per tract replaced in-kind
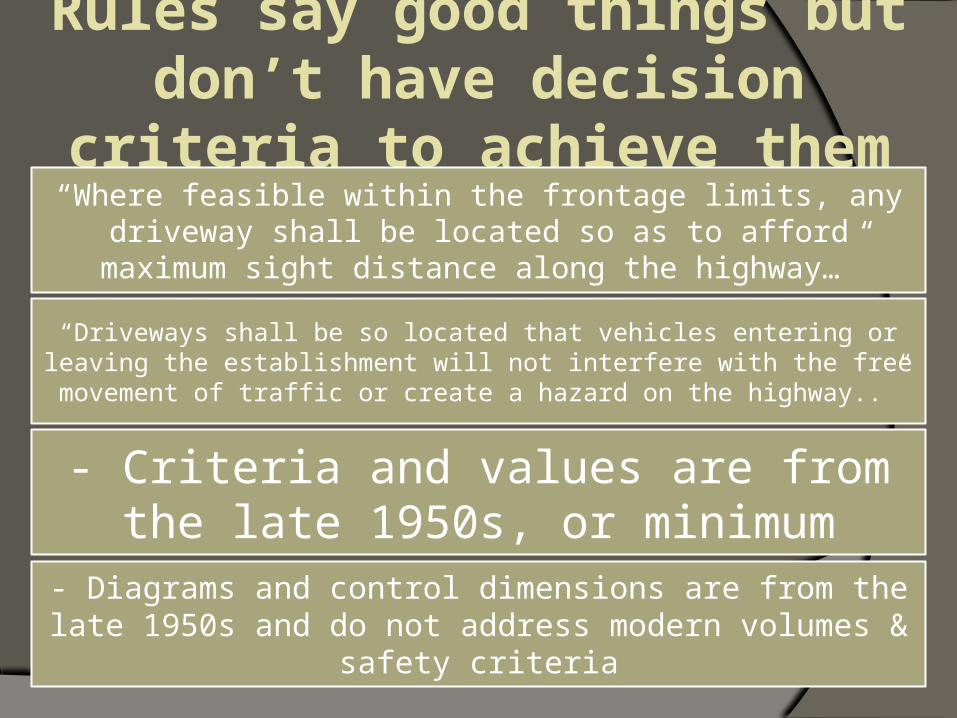
Rules say good things but don’t have decision
criteria to achieve them“Where feasible within the frontage limits, any driveway shall be located so as to afford maximum sight distance
along the highway…”
“Driveways shall be so located that vehicles entering or leaving the establishment will not interfere with the free movement of traffic or create a hazard on the highway..”
- Criteria and values are from the late 1950s, or minimum
- Diagrams and control dimensions are from the late 1950s and do not address modern volumes & safety criteria

Common Access Problems on SR 109
Strip development
with no secondary
access roadsTwo-way-left
turn lanes versus raised
medians
Residential properties with driveways on
arterial
Spacing of driveways too close to each other and to intersections
Design not adequate for
current & future arterial volume
and speeds
Far more driveways than necessary to
give reasonable access
No plans for adequate traffic signal spacing
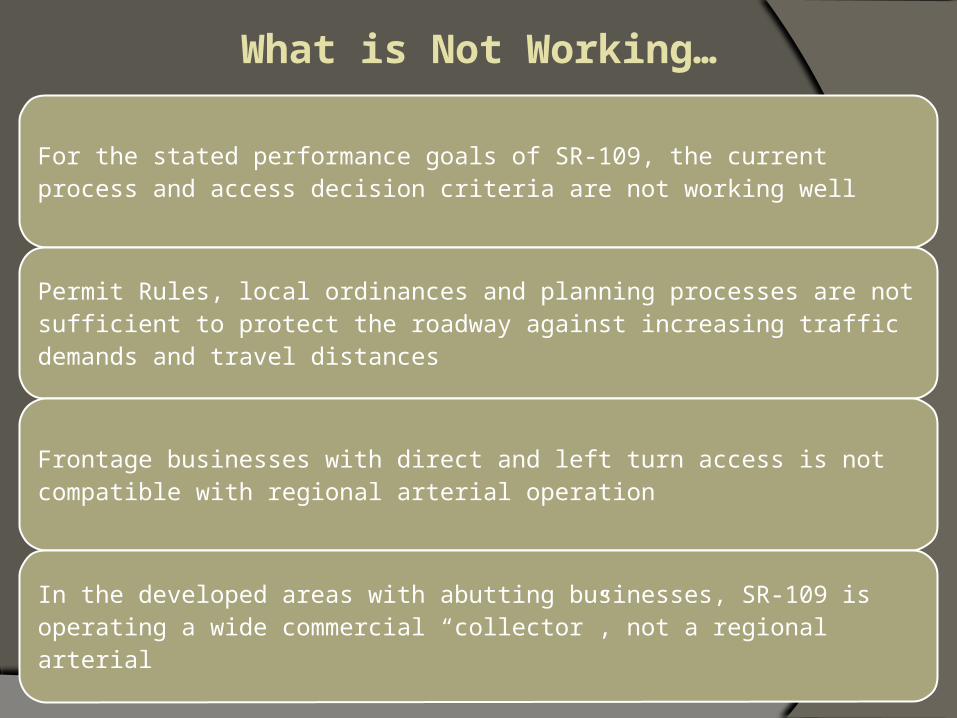
What is Not Working…
For the stated performance goals of SR-109, the current process and access decision criteria are not working well
Permit Rules, local ordinances and planning processes are not sufficient to protect the roadway against increasing traffic demands and travel distances
Frontage businesses with direct and left turn access is not compatible with regional arterial operation
In the developed areas with abutting businesses, SR-109 is operating a wide commercial “collector”, not a regional arterial

When modern access principles are applied to a specific corridor…. Crashes reduced by 30 to 60 percent Capacity increased by 20 to 40 percent
66Demosthenes


Decreasing crash rates by adding medians….
Florida DOT

Speed Variation is a Major Factor

Critical Elements in Arterial Performance
Use raised medians to limit left turns
Uniform and well spaced intersections
All access design elements reducing speed differential to 10 mph or less (radii, turn-lane)
Treat SR 109 as an arterial - not a wide commercial collector
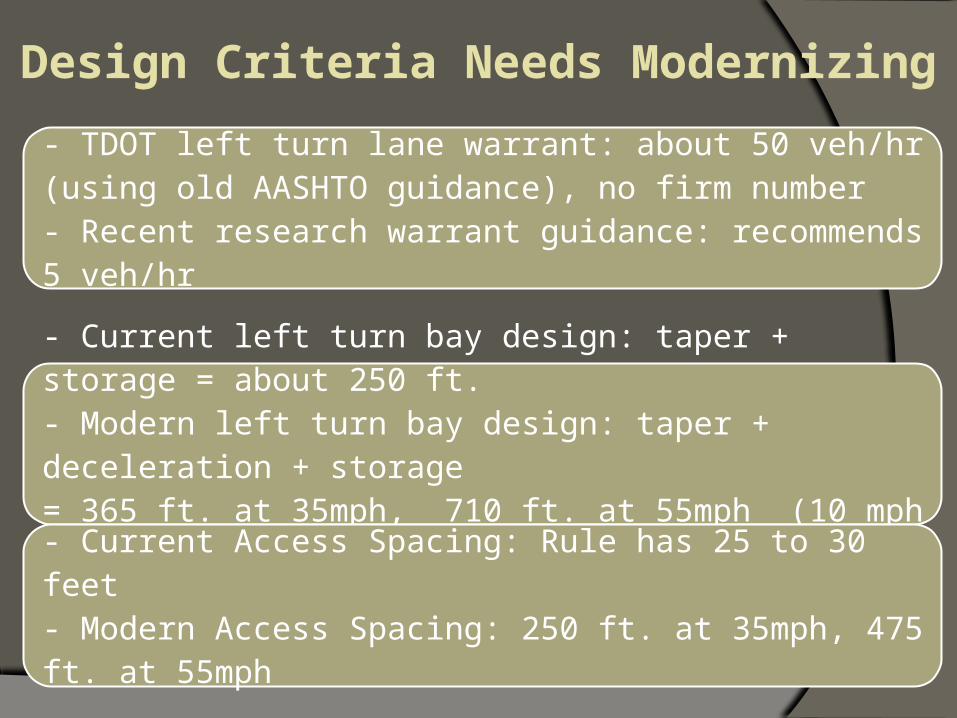
Design Criteria Needs Modernizing
- TDOT left turn lane warrant: about 50 veh/hr (using old AASHTO guidance), no firm number - Recent research warrant guidance: recommends 5 veh/hr
- Current left turn bay design: taper + storage = about 250 ft.- Modern left turn bay design: taper + deceleration + storage = 365 ft. at 35mph, 710 ft. at 55mph (10 mph differential)
- Current Access Spacing: Rule has 25 to 30 feet- Modern Access Spacing: 250 ft. at 35mph, 475 ft. at 55mph

Best Practice - Administrative
Model ordinances and resolutions (local)
Zoning overlays for SR-109 corridor
Adding criteria to existing zoning language to address arterials and access to secondary's
Adding criteria to site planning requirements, i.e., access spacing, left turns accommodation, denial of direct access at critical locations
Adopt access management plan using intergovernmental agreements

Access Management Resource Kit
Will present
and discuss
the benefits of improving
the managem
ent of access on an arterial corridor
Will also discuss
the complications and
challenges to
applying access
techniques
Presentation of the practices, policies,
techniques and
implementation
strategies

Modern Access Management
is successful because…1
• It limits conflict frequency on the roadway
2 • It reduces the velocity of conflicts
3
• It reduces the frequency of uncontrolled left turn conflicts which create the greatest likelihood of fatalities and severe injuries
4• It improves business mobility by getting goods, services and customers to businesses more efficiently (just not always most conveniently on a property-by-property basis)

I-40 north for 0.5 mile to Hickory Ridge
• 117 crashes, 50 injuries in 3 years• 59 at intersections, 9 turn angles, 32 rear end• Between 60 and 80% access related• Only 4 single vehicle crashes out of 117
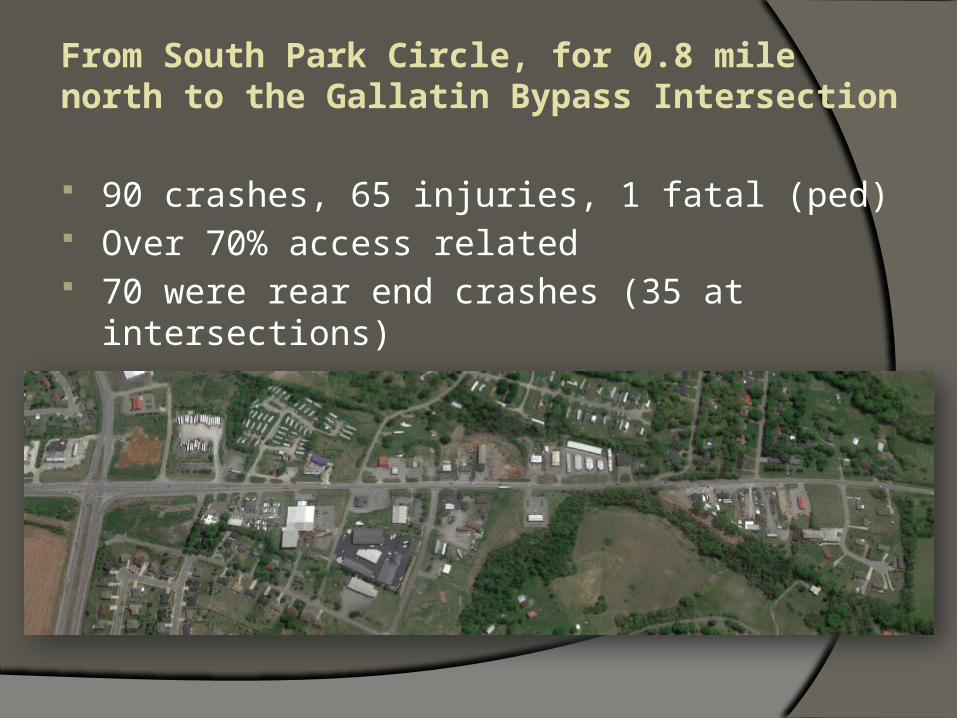
From South Park Circle, for 0.8 mile north to the Gallatin Bypass Intersection
90 crashes, 65 injuries, 1 fatal (ped) Over 70% access related 70 were rear end crashes (35 at intersections)

Bypass Section Crashes in 3 years 308 crashes reported, with 315 injuries, 4 fatalities About 156 access related crashes 51% access related on controlled-access road 123 rear end crashes

Portland: Hardison North to Freedle
134 crashes with 110 injuries (55 serious) Only 7 single vehicle crashes About 77% access related

Best Practices (modern criteria)
No driveway without necessity
Raised median always if frequent access
Spacing - Min 225 ft. at 35mph, 450 ft. at 55mph
Turn lane length 35mph = 410 ft., 55mph = 700 ft.
Uniform and well spaced intersections
Consider roundabouts rather than traffic signals
Shared driveways to reduce numbers
All new subdivisions with internal circulation
Left turn warrant 10 veh/hr or less

Driveway Test for Arterial Access
The property owner must find the location with the least level of public hazard while still achieving the test of reasonable access (does not rise to the level of substantial impairment)
Then design the access to mitigate impacts
The challenge for local agencies is to prevent subdivision of land that creates even more parcels requiring direct access over time


![Tvorba Tabuliek traťových pomerovgasparik/SR 1023 (D)[1].pdf109 B Hidasnémeti MÁV ― Čaňa ― Barca 109 C Krásna nad Hornádom ― Barca St 4 109 D Barca St 1 ― Košice nákladná](https://img.dokumen.tips/doc/110x75/5e2a0ac047534e1524340eaf/tvorba-tabuliek-traovch-pomerov-gaspariksr-1023-d1pdf-109-b-hidasnmeti.jpg)


![INDEX [] · 2005-10-25 · 5 Bryant, John F, 27 Bryant, Levi Clinton, Sr, 109 Bryant, Lillie S, 101 Bryant, Linster, 101 Bryant, Litha L, 109 Bryant, Louisa M, 111 Bryant, Mary, 101](https://img.dokumen.tips/doc/110x75/5f4498e1f4a6be5e1a48d4d2/index-2005-10-25-5-bryant-john-f-27-bryant-levi-clinton-sr-109-bryant.jpg)


![[109年醫師國考用書] —收錄於Access Medicine 資料庫](https://img.dokumen.tips/doc/110x75/624a0f19ea65af21686f3828/109-access-medicine-.jpg)
