Embed Size (px)
Citation preview

8/8/2019 Spss Handbook
http://slidepdf.com/reader/full/spss-handbook 1/11
Running Head: USING SPSS TO PERFORM HYPOTHESIS TESTS 1
Using SPSS to Perform Hypothesis Tests
Cameron Koontz
Longwood University

8/8/2019 Spss Handbook
http://slidepdf.com/reader/full/spss-handbook 2/11
USING SPSS TO PERFORM HYPOTHESIS TESTS 2
Single Sample t -Test
Use a single sample t -test if:
- the goal is to see if the sample group is significantly different from the population
-
either or is unknown- the variable is normally distributed with n< 30
Performing a Single Sample t -Test
1. When in SPSS, enter into ³Variable View.´
a. Enter a name for the Dependent Variable in the first cell.
2. Enter back into ³Data View.´
a. Enter the data in the column with the DV.
3. Go to Analyze Compare Means One-Sample T Test
4. Select the variable, and click on
the arrow to put it in the ³Test
Variable(s)´ box.
a. In the area labeled ³Test
Value,´ type the given
to test the sample against. b. Under ³Options´, change
the ³Confidence Interval´
to the correct value
depending on your alpha
level.

8/8/2019 Spss Handbook
http://slidepdf.com/reader/full/spss-handbook 3/11
USING SPSS TO PERFORM HYPOTHESIS TESTS 3
5. Click OK to analyze the data.
a. A new window will pop up. It will include some descriptive statistics as well as
the results of running the t -test.
b. In the first column, your DV will be shown. The second column will show the t obt.
This, in addition to the degrees of freedom in the third column, can be used to
compare to the t crit to see if the results fall within the rejection range.
Alternatively, the fourth column will also display the significance.
Independent t -Test
Use an independent t -test if:
- the goal is to find if an experimental group is significantly different than the control
group
- population information is unknown
Performing an Independent t -Test
1. W
hen in SPSS, enter into ³Variable View.´a. For the name of the first row, type ³Group´ or some other way to distinguish your
control from experimental.
b. Within this ³Group´ row, click
the cell under ³Values,´ then
click the button on the right
side of the cell.
i. This is where the
experimental and
control group will be
distinguished. In the³Value´ box, type a
number to be associated
with the control group (usually ³1´). Under ³Label,´ call it the name of the
control group. Click ³Add´ to add it to the box below.
ii. Repeat this for the experimental group, using a different value number and
label, then press ³OK.´

8/8/2019 Spss Handbook
http://slidepdf.com/reader/full/spss-handbook 4/11
USING SPSS TO PERFORM HYPOTHESIS TESTS 4
c. In the second row in the ³Name´ column, type in a name to call the dependent
variable.
2. Go back into ³Data View.´ In the ³Group´ column, type
the number that corresponds with the label for both
groups, making one row for each data point. In the
column for the DV, put in all the data. Make sure that
the data is paired with the correct value label.
3. Go to Analyze Compare Means Independent-
Samples T Test.a. Click in the DV label, and click the arrow to put
it in the ³Test Variables´ box.
b. Click on ³Groups´ and click on the bottom arrow
to put it in the ³Grouping Variable´ box.
i. The groups need to be defined, and this
can be accomplished
by clicking ³Define
Groups.´ Put the
value for the first
group in ³Group 1´
and the value for the
second group in
³Group 2´
c. Clicking ³Options´ will
allow you to change the
confidence interval.
d. Click OK to analyze the data.
4. A new window will pop up, displaying the results of the t -test. It is important to look at
the ³Equal variances assumed´ row.a. The t obt is shown as well as the degrees of freedom, which gives the necessary
information for looking at a table to find the t crit. Alternatively, the ³Sig. (2
tailed)´ will display the significance.

8/8/2019 Spss Handbook
http://slidepdf.com/reader/full/spss-handbook 5/11
USING SPSS TO PERFORM HYPOTHESIS TESTS 5
Dependent t -Test
Use a dependent t -test if:
- each participant is in every group
- there are two groups to compare to each other
Performing a Dependent t -Test
1. When in SPSS, enter into ³Variable View.´
a. In the first row for the ³Name´ column, type a label for the first group.
b. In the second row for the ³Name´ column, type a label for the second group.
2. Enter into ³Data View´ and enter the data
into each row, making sure that the data for
each column is matched with the other.
3. To analyze the data, go to Analyze
Compare Means Paired-Samples T Test.
a. Click the first group name, and then
click the arrow to send it over to the
³Variable 1´ cell.
b. Click the second group name, and
then click the arrow to send it over to
the ³Variable 2´ cell.
c. Click ³Options´ to change the
confidence interval.
d.
Click OK to run the test.
4. In order to interpret the test, look at the ³Paired Samples Test´ box.
a. In the three rightmost columns is the t -score, degrees of freedom, and
significance.

8/8/2019 Spss Handbook
http://slidepdf.com/reader/full/spss-handbook 6/11
USING SPSS TO PERFORM HYPOTHESIS TESTS 6
One-Way ANOVA
Use a one-way ANOVA if:
- there is one independent variable with three or more levels
-
the experiment is a between groups design- the goal is to assess equivalence or difference among sample means
- the hypothesis is not directional
Performing a one-way ANOVA
1. When in SPSS, enter into ³Variable View.´
a. For the first row in the ³Name´ column, type ³Participants.´ This will allow for
individual labeling of the participants.
b. In the second row in the
³Name´ column, type a name
for the independent variable.
i. In this row, go to the
³Values´ column, click
the cell, and then click
the button on the right
side of the cell.
ii. Choose a value and a
label for each level of
the IV and add them.
c.
In the third column, type aname for dependent variable.
2. Enter into ³Data View.´
a. In the ³Participants´ column, either write the
participants¶ names, or for the sake of
confidentiality, label them with a number.
b. In the column with the IV, use the value labels to
designate which data point in the DV column
belongs to which level of the IV.
c. In the column with the DV, enter all the data, being
sure to keep the right score with the correct level of IV.
3. Go to Analyze Compare Means One-Way ANOVA.
a. Click on the dependent variable, and click on the
top arrow to send it to the ³Dependent List.´
b. Click on the independent variable, and click on the
bottom arrow to send it to the ³Factor´ box.

8/8/2019 Spss Handbook
http://slidepdf.com/reader/full/spss-handbook 7/11
USING SPSS TO PERFORM HYPOTHESIS TESTS 7
c. Click ³Options´ to have the option to make descriptive statistics available.
d. Click ³Post Hoc´ to change
the confidence level, or to
select any post hoc tests to
perform.
e. Click OK to perform the test.
4. The only row of interest is the
³Between Groups´ row. The Fobt and
significance as well as the degrees of
freedom are shown. It is important
to note that the one-way ANOVA
can only assess whether or not there are significant differences between the means, and
cannot show where the differences are.
R epeated Measures ANOVA
Use a repeated measures ANOVA if:
- there is one independent variable with three or more levels
-
each subject is in each group- the experiment is a repeated measures design
Performing a Repeated Measures ANOVA
1. When in SPSS, enter into ³Variable
View.´
a. In the ³Name´ column, type the
name of each level of the
independent variable, using a new
row for each new level.
2. Enter into ³Data View.´
a. Enter all the data into the cells,
being sure to keep each data point
consistent across the row, so as to
keep its pairs.
3. Go to Analyze General Linear Model Repeated Measures.

8/8/2019 Spss Handbook
http://slidepdf.com/reader/full/spss-handbook 8/11
USING SPSS TO PERFORM HYPOTHESIS TESTS 8
a. In the ³Within-Subject Factor Name´ type the name of the IV. In the ³Number of
Levels´ box, type the number of levels of the IV, then click ³Add.´ Click
³Define´ to define the levels.
b. Click each of the
groups, then click the
arrow to send them to
the ³Within-Subjects
Variables´ box.
c. Click ³Options´ to
change the
confidence interval.
d. Click OK to perform
the test.
4. To view the results of the
test, look at the ³Tests of Within-Subject Effects´ box.
a. Look at the first row
to see the results.
This will show the Fobt value as well as the degrees of freedom. Also, the degrees
of freedom of the Error is necessary to look in an F table to find the critical level.
Alternatively, look at the rightmost box to see the significance of the results.

8/8/2019 Spss Handbook
http://slidepdf.com/reader/full/spss-handbook 9/11
USING SPSS TO PERFORM HYPOTHESIS TESTS 9
Two-Way ANOVA
Use a two-way ANOVA if:
- there are two factors, and there are two or more groups for each factor
- the experiment is a between groups design
Performing a Two-Way ANOVA
1. When in SPSS, enter into ³Variable View.´
a. In the ³Name´ column, type the name of each
factor into a different row.
i. In each row, go to the ³Values´ column
and click the button to the right. Add a
value label for each group within the
factor.
b. Add a final row for the dependent variable. In
the ³Name´ column, type a name for the DV.
2. Enter into ³Data View.´
a. All the data must be specified to each group that
it belongs to. For each piece of data that is
entered into the DV column, type the number
corresponding to the value label of the group it
belongs to in the factor columns.
3. Go to Analyze General Linear Model Univariate.
a.
Click on the DV, and click on the top arrow tosend it to the ³Dependent Variable´ box.
b. Click on the factors and click
on the second arrow to send
them to the ³Fixed Factor(s)´
box.
c. Click on ³Options´ in order to
change the significance level as
well as to add the descriptive
statistics to the results.
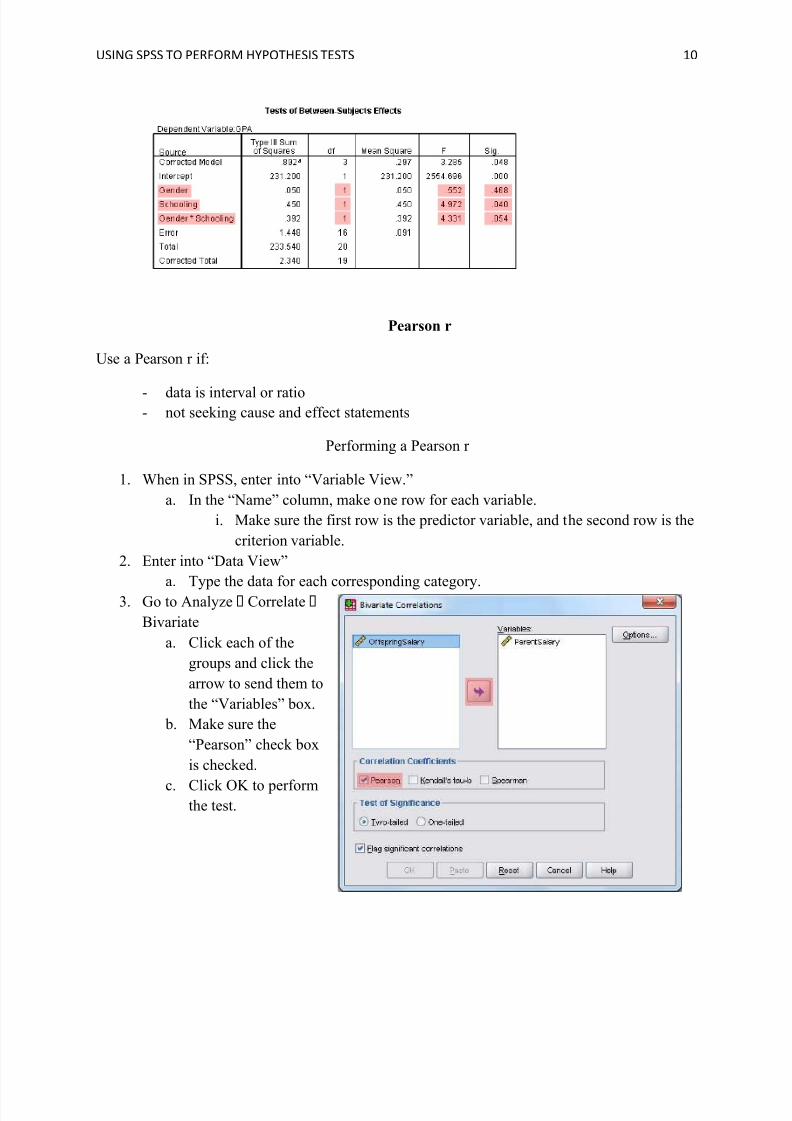
d. Click OK to perform the test.4. The ³Tests of Between-Subjects
Effects´ is of interest. The third row
includes the FA, as well as the
significance and degrees of freedom.
In the fourth row is the FB information.
The fifth row shows the FAB information.
8/8/2019 Spss Handbook
http://slidepdf.com/reader/full/spss-handbook 10/11
USING SPSS TO PERFORM HYPOTHESIS TESTS 10
Pearson r
Use a Pearson r if:
- data is interval or ratio- not seeking cause and effect statements
Performing a Pearson r
1. When in SPSS, enter into ³Variable View.´
a. In the ³Name´ column, make one row for each variable.
i. Make sure the first row is the predictor variable, and the second row is the
criterion variable.
2. Enter into ³Data View´
a.
Type the data for each corresponding category.3. Go to Analyze Correlate
Bivariate
a. Click each of the
groups and click the
arrow to send them to
the ³Variables´ box.
b. Make sure the
³Pearson´ check box
is checked.
c. Click OK to performthe test.

8/8/2019 Spss Handbook
http://slidepdf.com/reader/full/spss-handbook 11/11
USING SPSS TO PERFORM HYPOTHESIS TESTS 11
4. Look at the first row, which should be the predictor variable. In the rightmost box will be
the correlation and the significance of this correlation.