Embed Size (px)
Citation preview

Market Update January 2014
SPP’s Middle Market Leverage Cash Flow Market At A Glance
Deal Component January ’14 December ’13 January ‘13
Cash Flow Senior Debt
(x EBITDA) <$7.5MM EBITDA 1.50x-2.50x >$10MM EBITDA 2.25x-3.50x >$25MM EBITDA 2.50x-4.00x
<$7.5MM EBITDA 1.50x-2.50x >$10MM EBITDA 2.25x-3.50x >$25MM EBITDA 2.50x-4.00x
<$10MM EBITDA 1.50-2.00x >$15MM EBITDA 2.00-3.00x >$25MM EBITDA 2.50-3.50x
Total Debt Limit
(x EBITDA) <$7.5MM EBITDA 3.00x-4.25x >$10MM EBITDA 3.75x-5.00x >$25MM EBITDA 4.00x-5.75x
<$7.5MM EBITDA 3.00x-4.25x >$10MM EBITDA 3.75x-5.00x >$25MM EBITDA 4.00x-5.75x
<$10MM EBITDA 3.00-4.00x >$15MM EBITDA 3.50-4.50x >$25MM EBITDA 4.00-5.00x
Senior Cash Flow Pricing L+3.50%-4.50% (bank)
L+4.50%-6.50% (non-bank) L+3.50%-4.50% (bank) L+4.50%-6.50% (non-bank)
L+3.5%-4.5% (bank) L+4.5%-6.5% (non-bank)
Second Lien Pricing (Avg) <$10MM EBITDA L+9.00%-12.00%
Floating (1.00% floor) >$15MM EBITDA L+7.00%-9.00% Floating (1.00% floor)
<$10MM EBITDA L+9.00%-12.00% Floating (1.00% floor) >$15MM EBITDA L+7.00%-9.00% Floating (1.00% floor)
<$15MM EBITDA L+9.00-12.00% Floating (1.00% Floor); >$20MM EBITDA L+7.50%-9.00% Floating (1.00% Floor)
Subordinated Debt Pricing <$7.5MM EBITDA 12.0%-15.0%
>$10MM EBITDA 11.0%-13.0% >$25MM EBITDA 11.0%-12.0% Warrants limited to special situatuions; BDC’s indicating 10% sub in cases where a silent second lien is available (more below).
<$7.5MM EBITDA 12.0%-15.0% >$10MM EBITDA 11.0%-13.0% >$25MM EBITDA 11.0%-12.0% Warrants limited to special situatuions; BDC’s indicating 10% sub in cases where a silent second lien is available (more below).
<$10MM EBITDA 14.0%-17.0% >$15MM EBITDA 13.0%-15.0% >$25MM EBITDA 11.0%-14.0%
One-Stop Pricing <$7.5MM EBITDA L+ 9.0%-11.0% Floating
(1% Floor) >$10MM EBITDA L+7.00%-8.00% Floating (1% Floor) Potential for fixed rate with BDC or Mezz lender.
<$7.5MM EBITDA 9.0%-12.0% >$10MM EBITDA L+7.00%-9.00%
10.0%-12% Fixed <$10MM EBITDA L+9.00%-10.00% Floating (1.00% Floor) >$15MM EBITDA L+8.00%-9.00% Floating (1.00% Floor)
Libor Floors No Libor floor for most bank deals
1.00% for non-bank deals, second lien and floating rate one-stops.
No Libor floor for most bank deals 1.00% for non-bank deals, second lien and floating rate one-stops.
0%-1% for most bank deals; 1.00%-1.50% for non-bank deals.
Mezzanine Opt. Prepayment
(first 3 years) Highly negotiated; as competition for deals grows more intense in the final quarter, more investors are willing to go with “no non-call”, i.e., 3.0% in year one, 2.0% in year two, and 1.0% in year three.
Highly negotiated; as competition for deals grows more intense in the final quarter, more investors are willing to go with “no non-call”, i.e., 3.0% in year one, 2.0% in year two, and 1.0% in year three.
Highly negotiated; Coupon-only deals (no warrants) seeking no-call 1-2 years, with declining prepayment penalties 103, 102, 101, par). Significantly more latitude in warrant deals. (SBIC maximum limited to 5,4,3,2,1). As coupon-only deals dominate, pre-payment premiums scrutinized.
Minimum Equity Contribution 25.0%-35.0% total equity (including
rollover); minimum 10.0%-15.0% new cash combined with rollover or seller notes.
25.0%-35.0% total equity (including rollover); minimum 10.0%-15.0% new cash combined with rollover or seller notes.
25%-35% Total Equity (including “rollover”); minimum 20% “new cash” in.
Recap Liquidity Everyone starts the new year liquid and
eager to book assets. No hesitation to deploy into recaps, but better pricing dynamics associated with a recap that is coupled with an acquisition (i.e. preference for “accretive” use of proceeds).
Recap liquidity in ample supply across all lending constituencies; however, with respect to commercial bank lenders, heightened scrutiny given to any deals outside the unofficial “3 senior leverage/4 total leverage” box.
Most recap activity pushed through at year-end 2012 to capture expiring tax benefits. Market participants expect a pronounced drop off in new recapitalization transactions as a function of less generous tax environment and a desire for sponsors to continue to harvest assets held beyond their normal investment horizon. Lenders/investors across the credit spectrum are still interested in funding leveraged recapitalizations.
Story Receptivity 2014, like almost every year, before is
about as sympathetic a market as a storied issuer can find. Investors have either cleared the books for year end, or are finalizing documentation for the overhang of Q4 deals. Those issuers that used December to prep offering materials, financial models, and run quality of earnings or appraisals will be the primary beneficiaries. Easily the best time of year to take care of any of the more problematic credit relationships.
While most institutions report being underinvested for the year, and willing to look at new deals, we have crossed the threshold for new deals closing in 2013 except for the cleanest or repeat issuers in the market. While more storied credits can still get some interest, it is a better strategy to get all issuing docs (CIM, model, Q/E, appraisals, etc) completed for a fresh offering in early January.
Q1 is historically the most forgiving market of the year. Lack of deal flow in the January / February period after the year end crush of deals (more poignant in 2012 as a result of tax considerations) suggests a very good market for storied paper (including distressed issuers, failed M&A auctions, and smaller issuers often overlooked in a busy market).
Tone of the Market The market hasn’t yet fully engaged as
investors filter back from holiday travel. Absent a year-end tax deadline that defined December 2012, more deals remain in documentation and the market is less fatigued than last year. Investors across all constituencies report massive liquidity and are hungry to get deals in the pipeline.
Lots of pressure on issuers and investors alike to close deals by year end, but absent the kind of frenetic activity prompted by the tax law changes we experienced at the end of 2012, there is decidedly less volume and stress. Most lenders report surplus liquidity going into 2014 with increasing talk of a “bubble” forming in the mezzanine space where pricing and terms continues to become increasingly aggressive. .
There is evidence of slightly reduced bank participation across the board (see below) and especially for senior cash flow transactions for issuers sub-$10 million EBITDA. However, the normal lull in new deal flow for January issuers should compensate for any reduced commercial bank lender participation. Mezzanine liquidity conditions remain as robust as ever and competition for new deals should result in competitive pricing and terms.
*Changes from last month in red

“Hey Hey Do you hear, do you hear That sound It's the sound of the lost gone found It's the sound of a mute gone loud It's the sound of a new start… It sounds like It sounds like It sounds like Ladeedadadadada, dadadadada Now, oh, now is the start” “Now is the Start,” A Fine Frenzy
Now is the Start January represents a new start on a variety of fronts beyond the simple beginning of the calendar year; it represents the commencement of the Yellen era for Fed leadership, the initiation and roll out of the long awaited tapering program instituted by the Fed, a possible thaw in congressional partisan polarization that has crippled fiscal policy, and the emergence of an economy that seems to be shaking off much of the sluggishness that has characterized the recovery since 2010. As discussed in greater detail below, almost every recent macroeconomic indicium is reporting stronger and sustained growth. Granted growth is moderate, but it is systemic economic expansion all the same. Housing, manufacturing, employment, retail sales, consumer confidence, and GDP are recording among their highest level in 12 quarters. The only metric not experiencing a more robust expression is inflation, providing the Fed even greater running room in navigating its current accommodative monetary policy. The headline news in December was the Fed’s decision to go forward with its plans to taper; reigning in the current pace of Treasury and MBS securities by $10 billion, to $75 billion a month ($5 billion a month less each), with the understanding that asset purchases would continue to moderate through 2014. Interestingly enough, the actual act of tapering did little to drive interest rates up (10-year US Treasuries only increased by seven basis points, from 2.82% to 2.89%), a far cry from the 65 basis point increase in 10-year US Treasuries in the May/June period when Chairman Bernanke made his first public comments merely noting the possibility of instituting a reduction in the fourth quarter. The tepid response to the actual tapering event was in large part attributable to the forward guidance the Fed gave on keeping the Fed Funds rate near zero for the foreseeable future, and specifically that “it likely will be appropriate to maintain the current target range for the federal funds rate well past the time that the unemployment rate declines below 6%, especially if projected inflation continues to run below the committee’s 2% longer-run goal.” Bernanke’s comments have provided the necessary guidance to assuage the equity and bond markets that short term rates will remain near zero through 2015. Given that headline CPI (see Inflation discussion below) is currently running at about 1.2% year-over-year, there doesn’t seem to be any immediate threat to continued accommodation. Janet Yellen’s confirmation as the new Chairperson of the Federal Reserve will likely have little effect on Fed policy in the short-term. As she noted in her confirmation hearings on November 14th, “I consider it imperative that we do what we can to promote a very strong recovery…It’s important not to remove support, especially when the recovery is fragile and the tools available to monetary policy, should the economy falter, are limited given that short-term interest rates are at zero.” If not an outright endorsement of Bernanke’s
10-Year Treasury Constant Maturity Rate
Source: FRED
CPI and Core CPI
Source: BLS
Unemployment Rate
Source: BLS
Labor Force Participation Rate
Source: BLS
2.9%
0.0%
0.5%
1.0%
1.5%
2.0%
2.5%
3.0%
3.5%
4.0%
4.5%
0.0%
0.5%
1.0%
1.5%
2.0%
2.5%
3.0%
3.5%
4.0%
4.5%
12
-Mo
nth
Per
cen
t C
han
ge CPI
Core CPI
7.0%
0.0%
2.0%
4.0%
6.0%
8.0%
10.0%
12.0%
63.0%
61.5%
62.0%
62.5%
63.0%
63.5%
64.0%
64.5%
65.0%
65.5%

policy pronouncements to date, her testimony demonstrated unequivocally her sponsorship of the Fed’s current monetary policy of active accommodation. A closer look into the last month’s specific macroeconomic data points provides support for the premise that the economy is entering 2014 on terra firma:
Inflation: As noted briefly above, on the inflation front, consumer
prices (“CPI”) were flat for November resulting from reductions in energy costs that offset gains in other components of the index. Following a 0.1% decline in October, CPI registered a 0.0% change; Core CPI (taking out the more volatile food and energy price fluctuations) rose 0.2%. The year-over-year change in CPI registered a 1.2% gain and Core CPI registered a year-over-year change of 1.7%; levels comfortably below the 2.0% target set by the Fed.
Employment: Surprisingly, December non-farm payrolls only grew by 74,000, a significant reduction from the consensus expectation of 200,000 or better, especially in light of the December ADP Employment report released one day earlier reporting private payroll growth of 238,000 for December. Though weaker than anticipated, it did represent the 39th consecutive month of increased non-farm payrolls, dropping the unemployment rate to 6.7%, a five year low. The reduction in the unemployment rate seems squarely rooted more in people leaving the labor force however, the civilian participation rate dropped by 0.2% in December to a level of 62.8% (the level previously recorded in October of this year, and the worst reading since 1978). To put some context to these levels, the unemployment rate has dropped from 10.0% in October of 2009, however, the participation rate was as high as 63.5% in June of 2013. At the current rate of growth it would take another seven years at the current job growth rate to get to a 6.0% unemployment rate and a participation rate equal to that at which prevailed at the official “end” of the recession in June of 2009.
Manufacturing: The nation’s manufacturing sector rose solidly through year end. The December ISM Manufacturing Index held steady at 57 following an even stronger 57.3 in November (which represented a 30 month peak). The New Orders component of the index rose 0.6 for month (the fifth straight 60+ reading for the index) coming in at 64.2. This follows a bullish industrial production reading, where manufacturing output rose 0.6% in November (the fourth consecutive month of growth). The solid gains in manufacturing are broad based, but are getting particular support from a firming housing sector and strong motor vehicle output.
Consumer Confidence/Retail Sales: According to the latest Gallup US Consumer Spending Measure, in December, Americans reported spending $96 a day, representing the highest monthly average since September of 2008, and the highest spending for any December in six years. Part of this can obviously be attributed to the Christmas holiday, but it is also just the latest in a series of releases suggesting that American consumers are increasingly confident about current conditions. The Conference Board’s Consumer confidence level for December rose to 78.1 from 70.4 in November. The “present situation” component rose 2.7 points to 76.2, the highest level for this reading since the end of the recession. Similarly, the Thomson Reuters/University of Michigan index of consumer sentiment jumped to 82.5 in December, it highest reading since July. This follows solid consumer spending readings for November (+0.5%) and October (+0.4%). Collectively, this data indicates that spending in Q4 2013 will likely outpace Q3’s 2.0% annual rate.
Manufacturing and Non-Manufacturing Indices
Source: ISM
Bloomberg Consumer Comfort Index
Source: Bloomberg
University of Michigan Consumer Sentiment
Source: FRED
Retail Sales
Source: FRED
0
10
20
30
40
50
60
70
Manufacturing
Non-Manufacturing
-28.4
-60
-50
-40
-30
-20
-10
0
84.1
0.0
10.0
20.0
30.0
40.0
50.0
60.0
70.0
80.0
90.0
100.0
184,837
168,000
170,000
172,000
174,000
176,000
178,000
180,000
182,000
184,000
186,000
Mil
lio
ns
of D
oll
ars
GDP: Probably the best evidence of the uptick in US economy can be
found in the second revision to Q3 GDP released on December 20th. Real GDP was revised to 4.1% from 3.6%. Both business investment (revised +4.8%) and consumer spending (revised +0.6%) drove the surge, while inventories (which pushed the first revision from 2.8% to 3.6%) were unchanged. Corporate profits were revised to show a 7.7% annualized growth rate from Q2, and stand 5.7% higher than a year ago (annualized). This represents the quickest pace of improvement in GDP since Q4 2011, and could suggest improved expectations of Q4 2013 GDP into 2014.
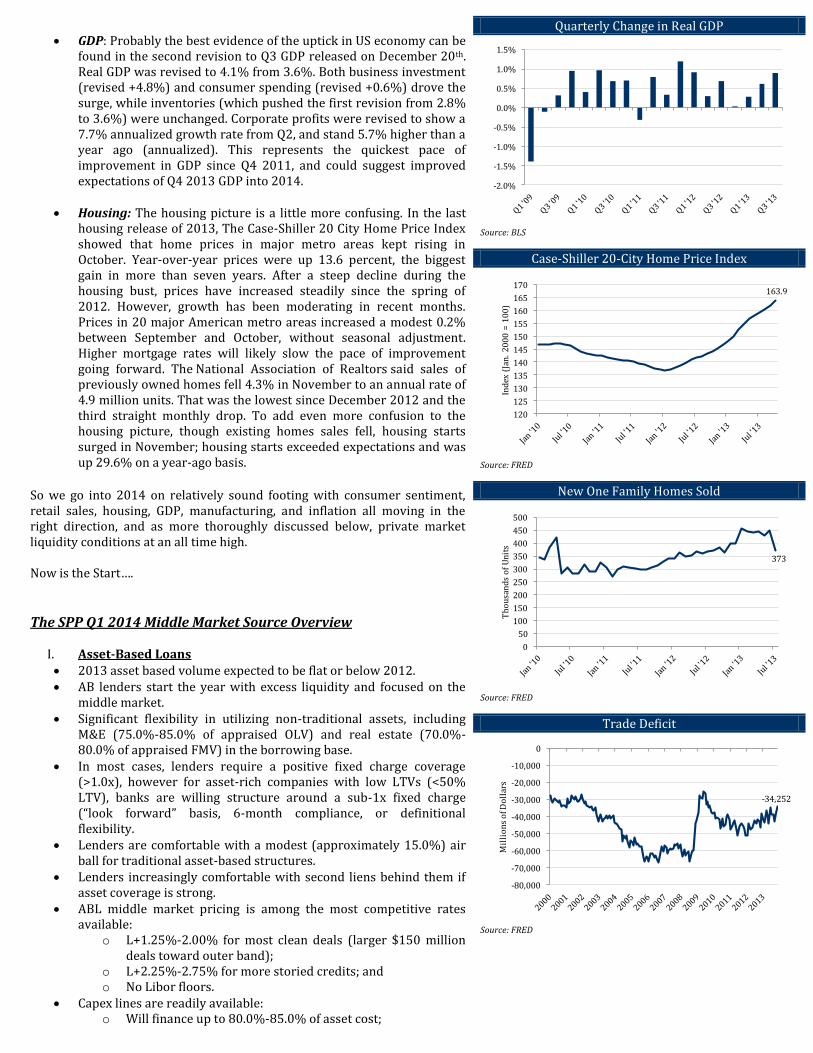
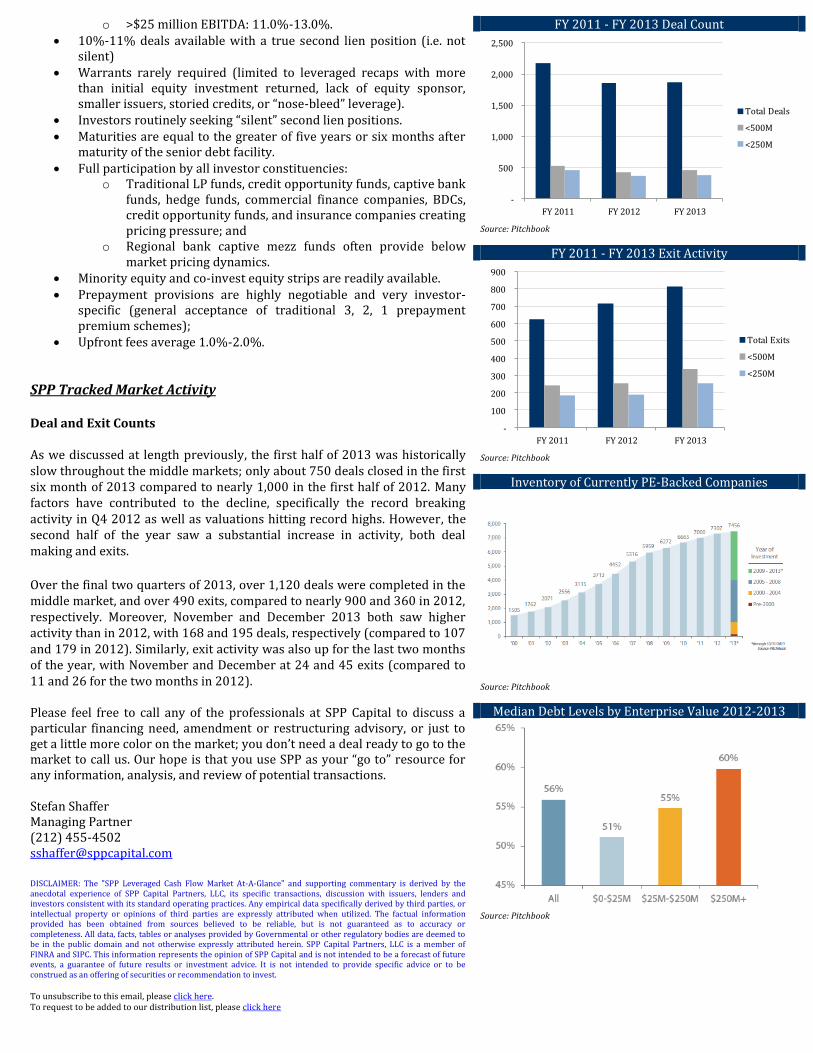
Housing: The housing picture is a little more confusing. In the last housing release of 2013, The Case-Shiller 20 City Home Price Index showed that home prices in major metro areas kept rising in October. Year-over-year prices were up 13.6 percent, the biggest gain in more than seven years. After a steep decline during the housing bust, prices have increased steadily since the spring of 2012. However, growth has been moderating in recent months. Prices in 20 major American metro areas increased a modest 0.2% between September and October, without seasonal adjustment. Higher mortgage rates will likely slow the pace of improvement going forward. The National Association of Realtors said sales of previously owned homes fell 4.3% in November to an annual rate of 4.9 million units. That was the lowest since December 2012 and the third straight monthly drop. To add even more confusion to the housing picture, though existing homes sales fell, housing starts surged in November; housing starts exceeded expectations and was up 29.6% on a year-ago basis.
So we go into 2014 on relatively sound footing with consumer sentiment, retail sales, housing, GDP, manufacturing, and inflation all moving in the right direction, and as more thoroughly discussed below, private market liquidity conditions at an all time high. Now is the Start….
The SPP Q1 2014 Middle Market Source Overview
I. Asset-Based Loans 2013 asset based volume expected to be flat or below 2012. AB lenders start the year with excess liquidity and focused on the
middle market. Significant flexibility in utilizing non-traditional assets, including
M&E (75.0%-85.0% of appraised OLV) and real estate (70.0%-80.0% of appraised FMV) in the borrowing base.
In most cases, lenders require a positive fixed charge coverage (>1.0x), however for asset-rich companies with low LTVs (<50% LTV), banks are willing structure around a sub-1x fixed charge (“look forward” basis, 6-month compliance, or definitional flexibility.
Lenders are comfortable with a modest (approximately 15.0%) air ball for traditional asset-based structures.
Lenders increasingly comfortable with second liens behind them if asset coverage is strong.
ABL middle market pricing is among the most competitive rates available:
o L+1.25%-2.00% for most clean deals (larger $150 million deals toward outer band);
o L+2.25%-2.75% for more storied credits; and o No Libor floors.
Capex lines are readily available: o Will finance up to 80.0%-85.0% of asset cost;
Quarterly Change in Real GDP
Source: BLS
Case-Shiller 20-City Home Price Index
Source: FRED
New One Family Homes Sold
Source: FRED
Trade Deficit
Source: FRED
-2.0%
-1.5%
-1.0%
-0.5%
0.0%
0.5%
1.0%
1.5%
163.9
120
125
130
135
140
145
150
155
160
165
170
Ind
ex (
Jan
. 2
00
0 =
10
0)
373
0
50
100
150
200
250
300
350
400
450
500
Th
ou
san
ds
of
Un
its
-34,252
-80,000
-70,000
-60,000
-50,000
-40,000
-30,000
-20,000
-10,000
0
Mil
lio
ns
of D
oll
ars

o Amortization highly negotiable once drawn (one year’s grace on amortization is common);
o Capex facility can provide a big boost to fixed charge coverage as only “unfunded” amounts deducted from EBITDA (i.e. Fixed Charge Coverage = (EBITDA-Unfunded Capex)/(Interest + Fixed Amortization + Cash Taxes)
Undrawn revolver pricing ranges from 0.25%-0.375% and is inversely related to usage of facility.
Four- to five-year maturities are typical. Closing fees are in the 0.25%-0.50% range.
II. Senior Cash Flow Middle Market Loans 2013 flat to small decline from 2012 levels. Lenders report significant competition for new assets, especially for
sponsored transactions which often have “B” tranches, or last-out, and covenant-light structures.
Maturities: 4 and 5 years most common; 7 years in some cases. Approximately 50% of middle market bank lenders willing to lend
in excess of 3.00x EBITDA. Closing Fees: 0.6%-1.0% (non-bank lenders routinely at 1.0%). Amortization structures:
o Commercial banks: The most common amortization is a seven- to ten-
year straight line with a balloon in year five; and Generally want to see a minimum of 25.0%-30.0%
amortized in the first three years, but will consider slightly back-loaded structures.
o Non-bank commercial lenders: 0.0%-5.0% amortization per annum with a 50.0%
excess cash flow sweep. No Libor floors for commercial banks; most non-bank senior
lenders still pushing for 1.0% Libor floor. Smaller “club” deals often more competitive than large syndicated
facilities. Lower middle market pricing and leverage metrics:
o Most commercial banks are generally not competitive for smaller (sub-$5 million EBITDA) cash flow credits, pushing such borrowers to non-bank senior and one-stop alternatives;
o Sub-$7.5 million EBITDA issuers with no sponsor are rarely above 1.50x-2.00x SD/LTM EBITDA, but sponsored deals often achieve 2.50x SD/LTM EBITDA.
Pricing grids: o Commercial bank lenders:
L+3.50%-4.50% for leveraged middle market deals;
Higher quality, less leveraged deals as low as 1.50% to 2.00%;
Upfront fees: 0.375%-0.563%; 0.250%-0.375% unused—generally higher where
there are more unused proceeds; Par call; Term facilities are being priced at, or with a small
premium (0.25%-0.50%) to revolving credit facilities; and
“Leveraged” deals generally considered as anything greater than 3X Sr. /4X Total.
o Non-bank commercial lenders: L+4.50%-5.00% for <2.5x SD/EBITDA; L+5.00%-6.00% for >3x SD/EBITDA; L+5.00%-6.50% for <$10 million EBITDA; Upfront fees: 0.75%-2.00%; Prepayment penalties: no call or 2.0% year one,
1.0% in year two, par call thereafter.
Nonfarm Payroll Employment (Seasonally Adjusted)
Source: FRED
Construction Spending
Source: FRED
30-Year Conventional Mortgage Rate
Source: FRED
U.S. Business Loans, Seasonally Adjusted
Source: FRED
136,765
124,000
126,000
128,000
130,000
132,000
134,000
136,000
138,000
Th
ou
san
ds
of
Em
plo
ye
es
934,414
740,000
760,000
780,000
800,000
820,000
840,000
860,000
880,000
900,000
920,000
940,000
960,000
Mil
lio
ns
of D
oll
ars
4.5%
0.0%
1.0%
2.0%
3.0%
4.0%
5.0%
6.0%
1,585.9
0
200
400
600
800
1,000
1,200
1,400
1,600
1,800
Bil
lio
ns
of D
oll
ars

III. One-Stops/Unitranche
2013 saw dramatic growth of the Unitranche community. o Focused primarily on $5 million to $15 million in LTM
EBITDA (though will do smaller and larger deals); and o Largely industry agnostic.
Structures are cash flow-based and less focused on asset coverage. Term Loan Facilities:
o Amortization ranges from 0.0%-10.0% per annum with an excess cash flow sweep; and
o Most lenders lender’s focus on 5.0% amortization w/50% Excess Cash Flow Sweep.
Most One-Stop Lenders generally can provide revolving credit facilities.
o Will size the revolver in accordance with current assets; and
o In cases where the lender cannot provide a revolving credit facility directly, they will contract out the revolver to a local commercial bank.
Closing fees range from 1.0%-2.0%. Prepayment provisions range among investors, but the norm is a
3.0%, 2.0%, 1.0% declining premium. Investors include commercial finance companies, BDCs, traditional
mezzanine funds, and credit opportunity funds, and some mezz LPs. Maturities commonly 5 years. Lenders fall into two groups:
o Senior debt focus: generally require greater fixed amortization, but provide lower interest cost; or
o Mezzanine focus: generally require less (or no) stated amortization (just CF sweep), but on the higher end of the pricing grid.
Typical lower middle market unitranche debt range from 3.00x-4.00x LTM EBITDA:
o with an average of approximately 3.50x. o The most aggressive seen is 5.50x with an equity co-
investment. Fixed charge coverage is routinely set at a 20.0% discount to
projections with a floor of 1.10x; Fixed and Floating rates both available; Pricing is surprisingly consistent across the credit spectrum:
o L+9.0%-11.0% the norm for most sub $10 million EBITDA; o L+7%-8% for $10 million plus EBITDA issuers;
o Least competitive at 12.0%.
IV. Mezzanine Market 2013 volume expected to be down precipitously due to competition
from one-stops and non-bank commercial lenders; Consensus is that while current pricing has stabilized, leverage
multiples may still be on the rise; Traditional subordinated debt remains among most competitive
lender constituencies; Creative mezzanine alternatives are abundant—last-out notes,
senior unsecured notes, second-lien notes, split-lien notes, preferred shares.
Subordinated notes: cash coupon of 11.0%-12.0% is required. Current leverage metrics:
o <$7.5 million EBITDA: 3.00x-4.25x; o >$10 million EBITDA: 3.75x-5.00x; o >$25 million EBITDA: 4.00x-5.75x; and o “Storied” or “challenged” credits: 3.50x-4.00x.
All-in (cash & PIK) pricing schemes: o <$7.5 million EBITDA: 13.0%-17.0%; o >$10 million EBITDA: 12.0%-15.0%; and
U.S. Leveraged Loan Issuance
Source: Thomson Reuters
Middle Market Loan Issuance
Source: Thomson Reuters
December Deal Count
Source: Pitchbook
December Exit Activity
Source: Pitchbook
0
20
40
60
80
100
120
Bil
lio
ns
of
Do
lla
rs
Pro rata Institutional
0
5
10
15
20
25
Bil
lio
ns
of
Do
lla
rs
Large (Deal Size: $100mm-$500mm)
Traditional (Deal Size: <$100mm)
-
50
100
150
200
250
December 2011 December 2012 December 2013
Total Deals
<500M
<250M
-
10
20
30
40
50
60
70
80
90
100
December 2011 December 2012 December 2013
Total Exits
<500M
<250M
o >$25 million EBITDA: 11.0%-13.0%. 10%-11% deals available with a true second lien position (i.e. not
silent) Warrants rarely required (limited to leveraged recaps with more
than initial equity investment returned, lack of equity sponsor, smaller issuers, storied credits, or “nose-bleed” leverage).
Investors routinely seeking “silent” second lien positions. Maturities are equal to the greater of five years or six months after
maturity of the senior debt facility. Full participation by all investor constituencies:
o Traditional LP funds, credit opportunity funds, captive bank funds, hedge funds, commercial finance companies, BDCs, credit opportunity funds, and insurance companies creating pricing pressure; and
o Regional bank captive mezz funds often provide below market pricing dynamics.
Minority equity and co-invest equity strips are readily available. Prepayment provisions are highly negotiable and very investor-
specific (general acceptance of traditional 3, 2, 1 prepayment premium schemes);
Upfront fees average 1.0%-2.0%.
SPP Tracked Market Activity Deal and Exit Counts
As we discussed at length previously, the first half of 2013 was historically slow throughout the middle markets; only about 750 deals closed in the first six month of 2013 compared to nearly 1,000 in the first half of 2012. Many factors have contributed to the decline, specifically the record breaking activity in Q4 2012 as well as valuations hitting record highs. However, the second half of the year saw a substantial increase in activity, both deal making and exits.
Over the final two quarters of 2013, over 1,120 deals were completed in the middle market, and over 490 exits, compared to nearly 900 and 360 in 2012, respectively. Moreover, November and December 2013 both saw higher activity than in 2012, with 168 and 195 deals, respectively (compared to 107 and 179 in 2012). Similarly, exit activity was also up for the last two months of the year, with November and December at 24 and 45 exits (compared to 11 and 26 for the two months in 2012). Please feel free to call any of the professionals at SPP Capital to discuss a particular financing need, amendment or restructuring advisory, or just to get a little more color on the market; you don’t need a deal ready to go to the market to call us. Our hope is that you use SPP as your “go to” resource for any information, analysis, and review of potential transactions. Stefan Shaffer Managing Partner (212) 455-4502 [email protected] DISCLAIMER: The "SPP Leveraged Cash Flow Market At-A-Glance" and supporting commentary is derived by the anecdotal experience of SPP Capital Partners, LLC, its specific transactions, discussion with issuers, lenders and investors consistent with its standard operating practices. Any empirical data specifically derived by third parties, or intellectual property or opinions of third parties are expressly attributed when utilized. The factual information provided has been obtained from sources believed to be reliable, but is not guaranteed as to accuracy or completeness. All data, facts, tables or analyses provided by Governmental or other regulatory bodies are deemed to be in the public domain and not otherwise expressly attributed herein. SPP Capital Partners, LLC is a member of FINRA and SIPC. This information represents the opinion of SPP Capital and is not intended to be a forecast of future events, a guarantee of future results or investment advice. It is not intended to provide specific advice or to be construed as an offering of securities or recommendation to invest. To unsubscribe to this email, please click here. To request to be added to our distribution list, please click here
FY 2011 - FY 2013 Deal Count
Source: Pitchbook
FY 2011 - FY 2013 Exit Activity
Source: Pitchbook
Inventory of Currently PE-Backed Companies
Source: Pitchbook
Median Debt Levels by Enterprise Value 2012-2013
Source: Pitchbook
-
500
1,000
1,500
2,000
2,500
FY 2011 FY 2012 FY 2013
Total Deals
<500M
<250M
-
100
200
300
400
500
600
700
800
900
FY 2011 FY 2012 FY 2013
Total Exits
<500M
<250M
SUPPORTING DATA
Historical Cash Flow Senior Debt (x EBITDA) Historical Total Debt Limit (x EBITDA)
Source: SPP’s “MIDDLE MARKET LEVERAGE CASH FLOW MARKET AT A GLANCE” Source: SPP’s “MIDDLE MARKET LEVERAGE CASH FLOW MARKET AT A GLANCE”
Historical Senior Cash Flow Pricing (Bank) Historical Senior Cash Flow Pricing (Non-Bank)
Source: SPP’s “MIDDLE MARKET LEVERAGE CASH FLOW MARKET AT A GLANCE” Source: SPP’s “MIDDLE MARKET LEVERAGE CASH FLOW MARKET AT A GLANCE”
Historical Second Lien Pricing Historical Subordinated Debt Pricing
Source: SPP’s “MIDDLE MARKET LEVERAGE CASH FLOW MARKET AT A GLANCE” Source: SPP’s “MIDDLE MARKET LEVERAGE CASH FLOW MARKET AT A GLANCE”
Historical Minimum Equity Contribution Secondary High Yield Pricing
Source: SPP’s “MIDDLE MARKET LEVERAGE CASH FLOW MARKET AT A GLANCE” Source: Piper Jaffray Debt Capital Markets Update
0.00x
1.00x
2.00x
3.00x
4.00x
5.00x
6.00x
< $7.5MM EBITDA > $10MM EBITDA > $25MM EBITDA
0.00x
1.00x
2.00x
3.00x
4.00x
5.00x
6.00x
7.00x
< $7.5MM EBITDA > $10MM EBITDA > $25MM EBITDA
0 bps
100 bps
200 bps
300 bps
400 bps
500 bps
600 bps
700 bps
800 bps
900 bps
Bank Lower Bound Bank Upper Bound
0 bps
100 bps
200 bps
300 bps
400 bps
500 bps
600 bps
700 bps
Non-Bank Lower Bound Non-Bank Upper Bound
0%
3%
6%
9%
12%
15%
18%
Lower Bound Upper Bound
LIBOR Floor Lower Bound LIBOR Floor Upper Bound
0%
3%
6%
9%
12%
15%
18%
<$7.5MM EBITDA >10MM EBITDA > $25MM EBITDA
0%
10%
20%
30%
40%
50%
60%
Lower Bound Upper Bound
85.0
90.0
95.0
100.0
105.0
110.0
Secondary High Yield Pricing SPP Value Inflection Point