Embed Size (px)
Citation preview

Sponsored by:
Second Quarter 2007 ReportVol. 3, No. 2Investment Trends
Quarterly
Spotlight on

iiInvestment TrendsQuarterly
Copyright© 2007 by Real Estate Research Corporation (RERC) and the CCIM Institute.
B.K. Allen, CCIMB.K. Allen Real EstatePotomac Falls, Virginia
Todd Clarke, CCIMNew Mexico ApartmentsAlbuquerque, New Mexico
Wayne D’Amico, CCIMProperty PoliticsEssex, Connecticut
Paul Fetscher, CCIMGreat American BrokerageLong Beach, New York
Stephen FurnaryING Clarion PartnersNew York, New York
Breck HansonLaSalle Bank, N.A.Chicago, Illinois
Charles LowreyPrudential Investment Management ServicesParsippany, New Jersey
Dennis MartinRREEF/DB Real EstateNew York, New York
Jeff Lyon, CCIMGVA Kidder MathewsSeattle, Washington
Buzz McCoyBuzz McCoy Associates, Inc.Los Angeles, California
Tom Nordstrom, CCIMAEGON USA Realty Advisors, Inc.Cedar Rapids, Iowa
Art PasquerellaBerwind Property Group, Inc.Philadelphia, Pennsylvania
Duncan Patterson, CCIMPatterson-Woods AssociatesGreenville, Delaware
Gary M. Ralston, CCIM, SIOR, SRS, CPM, CREFlorida Retail Development, LLCWinter Park, Florida
Cynthia Shelton, CCIMColliers ArnoldOrlando, Florida
Frank Simpson, CCIMThe Simpson CompanyGainesville, Georgia
Richard SokolovSimon Property GroupIndianapolis, Indiana
John Stone, CCIMJohn M. Stone CompanyDallas, Texas
Dewey Struble, CCIMSperry Van NessReno, Nevada
Julien StudleyJulien Studley, Inc.New York, New York
Allan SweetAMLI Residential Properties TrustChicago, Illinois
Garry Weiss, CCIMFirst Industrial Realty TrustChicago, Illinois
Sam ZellEquity Group InvestmentsChicago, Illinois
RERC~CCIM Investment Trends Quarterly
RERC Editorial Staff
PublisherKenneth P. Riggs, Jr.CFA®, CRE, FRICS, MAI, CCIM
Editor-in-ChiefBarb Bush
Lead AnalystBrian Velky
Research AnalystsGreg PhilippCliff CarlsonAshley Smith
Design EditorLindsay Kalvig
Data ManagementBen Neil
Production CommitteeTerri CotterScott HamerlinckDaniel Warner
Research AssistantsCody ConradMorgan EvenBrooke RugeSteven SchlangeRajiv SharmaJackie Sorensen
CCIM Institute
PresidentJoseph A. Fisher, CCIM
President-ElectTimothy S. Hatlestad, CCIM
First Vice PresidentCharles McClure, CCIM
Executive Vice PresidentSusan Groeneveld, CAE
Director of Public RelationsEdward M. Bury, APR
CCIM Member Services CommitteeNicholas Miner, CCIM ChairmanSteve Moreira, CCIM Vice Chairman
Immediate Past Chairman,CCIM Member Services CommitteeFrank Simpson, CCIM
Advisory Board Members
Copyright Notice for RERC~CCIM Investment Trends Quarterly
Copyright© 2007 by Real Estate Research Corporation (RERC) and the CCIM Institute. All rights reserved. No part of this publication may be reproduced, duplicated, or copied in any form, includ-ing electronic forwarding or copying, xerography, microfilm, or other methods, or incorporated into any information retrieval system, without the written permission of RERC and the CCIM Institute.
iiiInvestment TrendsQuarterly
Copyright© 2007 by Real Estate Research Corporation (RERC) and the CCIM Institute.
RealEstateResearchCorporation
Founded in 1931, Real Estate Research Corporation is one of the longest-serv-ing and most recognized national firms devoted to real property research, valu-ation, real estate consulting, indepen-dent fiduciary services, and portfolio services.
“
”
Offices located throughout the U.S., with headquarters in Chicago
LeadershipKenneth P. Riggs, Jr., CFA®, CRE, FRICS, MAI, CCIMCEO & President
Jules H. Marling, III, CRE, MAIPartner & Senior Vice President
Del H. Kendall, CRE, MAIPartner & Senior Vice President
Donald A. Burns, CRE, FRICS, MAIPartner & Senior Vice President
Austin D. MacMullan, MAI, CCIMPartner & Senior Vice President
Gregory P. Kendall, CRE, MAIPartner & Senior Vice President
Standard PublicationsRERC Real Estate Report
RERC/CCIM Investment Trends Quarterly
Expectations & Market Realities in Real Estate
Real Estate Research Corporation980 North Michigan Avenue, Suite 1110Chicago, IL 60611-4522Phone: 319.352.1500Fax: 319.352.4050www.RERC.com
Explore our services... ■ Specialized Research■ Independent Fiduciary Services■ Fairness Opinions■ Litigation Support■ Consulting■ Portfolio Services■ Commercial Valuation■ Financial Risk Management■ Market Research & Analysis■ Appraisal Management Services
IndependentTo ensure objectivity and independence, RERC does not engage in any activity that may conflict with the best interests of our cli-ents. As an impartial observer of the markets, RERC is able to collect and synthesize data and commentary unavailable to less independent organizations.
UniqueRERC brings unique and diverse skills to solving complex real estate issues. RERC’s innovative approach to problem solving is fostered by the diverse education and professional backgrounds of our team members.
ExpertiseRERC’s expertise originates from a national presence and per-spective, coupled with local market knowledge gained through the completion of hundreds of engagements annually in every major market. Our clients have found that RERC is relationship-oriented, focusing first and foremost on our clients’ and custom-ers’ needs, and delivering the highest quality products and ser-vices. RERC is an SEC-registered advisor.


vInvestment TrendsQuarterly
Copyright© 2007 by Real Estate Research Corporation (RERC) and the CCIM Institute.
Acknowledgements
REALTORS® Commercial Alliance of the National Association of REALTORS®
NAR PresidentPat Vredevoogd Combs, ABR, CRS, GRI, PMN
NAR Executive Vice President/CEODale A. Stinton
RCA Committee RepresentativeCindy S. Chandler, CCIM, CRE
NAR Vice President of Commercial Real EstateJames Marrelli
Real Estate Research CorporationFounded 75 years ago, Real Estate Research Corporation (RERC) was the nation’s first independent real estate firm that specialized in both real estate research and analysis. Recognized as a pioneer in the art of real estate man-agement and for monitoring key sectors of the economy that influence the real estate industry, RERC has retained its place as one of the industry’s leading real estate investment trends analysts through the publication of such reports as Expectations & Market Realities in Real Estate and the RERC Real Estate Report. Today, RERC is known for its research publications and market studies, commercial property valuations, complex consult-ing assignments, portfolio management and tech-nology services, independent fiduciary services, and corporate advisory services.
The CCIM InstituteThe CCIM Institute, headquartered in Chicago, confers the Certified Commer-cial Investment Member designation through an extensive curriculum of 200 classroom hours in addition to professional experience requirements. CCIMs are recognized experts in commercial real estate brokerage, leasing, asset management, valuation, and investment analysis, and form a business net-work encompassing more than 1,000 markets throughout North America, Eu-rope, Asia and the Caribbean. There currently are more than 8,600 CCIM designees, with an additional 8,200 professionals pursuing the designation. CCIM Institute is an affiliate of the National Association of REALTORS®. Visit www.ccim.com.
REALTORS® Commercial Alliance of the National Association of REALTORS®
The REALTORS® Commercial Alliance (RCA) is the commercial division of the National Association of REALTORS® (NAR). The RCA represents the collective commercial real estate constituencies of NAR, including affiliated commercial organizations—the CCIM Institute, the Counselors of Real Estate (CRE), the Institute of Real Estate Management (IREM), the REALTORS® Land Institute (RLI), and the Society of Industrial and Office REALTORS® (SIOR). The RCA works to serve the needs of commercial practitioner members and shape and unify the commercial real estate industry through the development of valuable products and services, technology initiatives, public policy advocacy, educa-tion, research, and legal analysis.
The RERC/CCIM Investment Trends Quarterly is produced by Real Estate Research Corporation (RERC) in association with and for members of the CCIM Institute. The RERC/CCIM Invest-ment Trends Quarterly is sponsored by the REALTORS® Com-mercial Alliance of the National Association of REALTORS®.

�Investment TrendsQuarterly
Copyright© 2007 by Real Estate Research Corporation (RERC) and the CCIM Institute.
InThisVolume
East RegionBaltimore, Boston, Charlotte, Hartford, Norfolk, Northern New Jersey, New York City, Pittsburgh, Philadelphia, Raleigh, Richmond, Washington, D.C.
South RegionAtlanta, Austin, Dallas/Ft. Worth, Houston, Memphis, Miami, Nashville, New Orleans/Baton Rouge, Oklahoma City, Orlando, San Antonio, Tampa
Midwest RegionChicago, Cincinnati, Cleveland, Columbus, Detroit, Indianapolis, Kansas City, Milwaukee, Minneapolis, Omaha, St. Louis, Toledo
West RegionDenver, Honolulu, Las Vegas, Los Angeles, Phoenix, Portland, Sacramento, Salt Lake City, San Diego, San Francisco, Seattle, Tucson
National OverviewEconomic SummaryEffect on Real EstateProperty Sector Highlights“Greater Baton Rouge remains in state of contrasts”Regional SummaryScope & MethodologyContributors
Scope & Methodology
Complete Regional- & Metro-Level Analysis Coming Soon!
Now Available!

�Investment TrendsQuarterly
Copyright© 2007 by Real Estate Research Corporation (RERC) and the CCIM Institute.
Foreword
May 2007
Dear Readers,
We are starting to see evidence of some of the changes that have been predicted in the economy, the financial markets, and the commercial real estate market. Economic growth is slowing and oil prices are elevated. On the other hand, we are seeing record-high stock market returns, still-low interest rates, and consumers continuing to spend. As for commercial real estate, times are still good. Fundamentals remain strong and pricing is higher than ever, but there is a sense that these good times can’t last forever. As we suggest in this issue of the RERC/CCIM Investment Trends Quarterly, it is time to step back and adjust to the new heights in real estate as we gain footing at this new level.
Our goal is to help provide you with some of the research tools to do just that, and we continue to further broaden and dis-sect the research and analysis provided in the RERC/CCIM Investment Trends Quarterly. Besides the new price-weighted and size-weighted national and regional price averages, we have streamlined the research, analysis, and reporting format for the 48 metropolitan areas we cover. We think you will find this new layout particularly useful in your review of these metropolitan markets.
In addition, this issue’s feature article takes a look at the redevelopment efforts underway in Louisiana, and particularly in Baton Rouge. Now, nearly 2 years since Hurricanes Katrina and Rita struck the area, we are seeing nearly unbridled growth in Louisiana’s capitol city.
We would also like to thank all who shared their sales transactions, completed surveys, sent reports, or communicated your insights about the various property sectors and markets. The information you contribute is essential to all of us in-volved in the business of real estate.
Sincerely,
Kenneth P. Riggs, Jr., CCIM, CRE, MAICEO & President Real Estate Research Corporation (RERC)
Joseph A. Fisher, CCIM2007 CCIM Institute PresidentPresident, Real Estate Investment Services Corp.

�Investment TrendsQuarterly
Copyright© 2007 by Real Estate Research Corporation (RERC) and the CCIM Institute.
NewHeightsforInvestorsWith the Dow Jones Industrial Average surpassing the 13,300 mark, key business mergers and acquisitions continuing, and first quarter 2007 corporate earnings coming in strong, capital seems to be nearly as flush this year as when the year 2006 ended.
Commercial real estate is still attracting significant amounts of capital as well, with first quarter 2007 reports showing one New York office building selling for nearly $1,100 per square foot, and a square foot of a Baltimore retail property selling at a price nearly that high. Although we cannot expect prices like these to last forever, we do expect such trends to continue throughout the rest of the year – if capital doesn’t get ahead of fundamen-tals.
RERC suggests that 2007 is a year to step back, take time to adjust to these heights, and prepare for the challenges ahead. The pace of the growth we saw in 2006 is not sustainable, and capitalization rates eventually will go up. There will be some dif-ficulties, especially among properties purchased at high prices without strong financial structures, or among those properties that have been oversold or undercapitalized. So long as there is ample job growth, unemployment remains low, fundamentals are positive, and investors don’t get too greedy, commercial real estate will do well through 2007.
EconomicSummaryThe rate of gross domestic product (GDP) growth increased 1.3 percent in first quarter 2007, according to the Bureau of Economic Analysis (BEA). The fourth quarter 2006 rate was revised upward to 2.5 percent, and reflected the posi-tive contributions from personal consumption expenditures, exports, and state, local, and federal government spend-ing. These contributions were partly offset by residential fixed investments and private inventory investments.
At their March 20/21, 2007 meeting, the Federal Open Market Committee (FOMC) left the federal funds target rate at 5.25 percent, stating that their “predominant policy concern remains the risk that inflation will fail to moder-ate as expected. Future policy adjustments will depend on the evolution of the outlook for both inflation and economic growth.”
The Federal Reserve Board noted in its April 25, 2007 Beige Book that most districts have seen only modest growth in overall economic activity during first quarter 2007. Gener-ally, retail sales growth was steady and tourism activity re-mained positive. Demand for healthcare, accounting, legal, and technology services continued to grow. Manufacturing activity remained slow, although reports varied. Agricultural conditions were mixed.
■
■
■
The U.S. unemployment rate increased slightly to 4.5 per-cent in April 2007, with employment increases primarily in professional and business services, healthcare, and retail trade, as reported by the Bureau of Labor Statistics (BLS). According to the April 25, 2007 Beige Book, most districts reported a continued tight supply of skilled and profes-sional workers. Although pay increases generally remained moderate, wage pressures increased slightly in several districts.
CCIM Institute designees and candidates rated the U.S. economy at 6.1 on a 10-point scale, with a score of 10 representing a very strong economy and a 1 representing a very weak economy. This first quarter 2007 rating was slightly lower than the fourth quarter 2006 rating of 6.3.
After a slow first quarter 2007, the manufacturing sector rebounded in April. According to the Institute for Supply Management (ISM), the manufacturing index increased to 54.7, following a reading of 50.9 in March, 52.3 in Febru-ary, and 49.3 in January.
Labor productivity in the business sector increased 1.3 percent in first quarter 2007, while output increased 1.2 percent on a seasonally-adjusted basis and hours were unchanged, according to the BLS. Non-farm business productivity increased 1.7 percent in first quarter, output increased 1.4 percent, and hours declined 0.3 percent. Manufacturing productivity grew at a 2.7 percent annual rate, as output increased 1.5 percent and hours fell 1.1 percent.
Along with indications of slowing in the economy, there are also indications of strength, especially as it relates to busi-ness spending. Corporate profits in many industries for first quarter 2007 are exceeding expectations. As a result, new orders for non-defense capital goods increased $8.4 bil-lion, or 11.7 percent in March 2007, for a total of $80.2 billion, reports the Commerce Department. Shipments, unfilled orders, and inventories for capital goods also in-creased in March.
New orders for manufactured durable goods increased by 3.4 percent in March 2007, following an increase of 2.4 percent in February and a decline of 9.3 percent in Janu-ary. Shipments of durable goods increased in March by 0.8 percent, following declines of 0.8 percent in February and 1.5 percent in January. Unfilled orders increased 1.8 per-cent in March and 0.9 percent in February, following a 0.2-percent increase in January. Inventories of manufactured durable goods increased 0.3 percent in March and 0.1 per-
■
■
■
■
■
■

�Investment TrendsQuarterly
Copyright© 2007 by Real Estate Research Corporation (RERC) and the CCIM Institute.
EconomicSummary
NAR U.S. Economic Outlook: May 20072006 Quarterly 2007 Quarterly 2008 Quarterly Annual
Q2 Q3 Q4 Q1 Q2 Q3 Q4 Q1 Q2 Q3 2005 2006 2007 2008
Annual Growth Rate
Real GDP 2.6 2.0 2.5 1.3 2.3 2.6 2.9 3.0 3.1 3.3 3.2 3.3 2.1 3.0
Nonfarm Payroll Employment 1.5 1.6 1.5 1.5 1.1 0.9 0.8 1.1 1.2 1.1 1.7 1.9 1.3 1.1
Consumer Prices 5.0 3.1 -2.1 3.8 4.0 3.2 2.2 2.1 2.3 2.5 3.4 3.2 2.5 2.5
Real Disposable Income -1.5 3.2 5.3 4.5 -1.8 2.9 2.9 3.9 3.3 3.3 1.2 2.6 2.6 3.0
Consumer Confidence 107 104 107 110 106 108 109 110 110 110 100 106 108 110
Unemployment 4.7 4.7 4.5 4.5 4.5 4.6 4.7 4.8 4.8 4.8 5.1 4.6 4.6 4.8
Interest Rates, Percent
Fed Funds Rate 4.9 5.3 5.2 5.3 5.3 5.3 5.3 5.0 4.8 4.8 3.2 5.0 5.3 4.8
3-Month T-Bill Rate 4.7 4.9 4.9 5.0 5.0 5.0 4.9 4.7 4.5 4.5 3.1 4.7 5.0 4.6
Prime Rate 7.9 8.3 8.3 8.3 8.3 8.3 8.3 8.0 7.8 7.8 6.2 8.0 8.3 7.8
Corporate Aaa Bond Yield 5.9 5.7 5.4 5.4 5.5 5.6 5.7 5.8 5.9 5.9 5.2 5.6 5.5 5.9
10-Year Government Bond 5.1 4.9 4.6 4.7 4.7 4.8 4.9 5.0 5.0 5.0 4.3 4.8 4.8 5.0
30-Year Government Bond 5.1 5.0 4.7 4.8 4.8 4.9 5.0 5.1 5.1 5.1 4.6 4.9 4.9 5.1
Source: Forecast produced using Macroeconomic Advisers quarterly model of the U.S. economy. Quarterly figures are seasonally-adjusted annual rates. Assumptions and simulations by NAR’s Dr. Lawrence Yun.
cent in February, after increasing 0.4 percent in January. As reported by the Commerce Department, the increases were led by transportation equipment.
According to the BLS, the producer price index (PPI) for finished goods increased 1.0 percent in March 2007, fol-lowing a 1.3-percent increase in February and a 0.6-per-cent decline in January. The finished goods index climbed at a 6.9-percent seasonally-adjusted annual rate during first quarter 2007, following a 3.5-percent increase during fourth quarter 2006.
The BLS reported that the consumer price index (CPI) for all urban consumers increased 0.9 percent in March 2007 (before seasonal adjustment), 2.8 percent higher than year-ago averages. On a seasonally-adjusted basis, CPI increased 0.6 percent in March, with overall energy costs increasing 5.9 percent and the food index increasing 0.3 percent in March.
According to the BEA, disposable personal income (DPI) increased 0.7 percent in March 2007, following a 0.6-per-cent increase in February and a 1.1-percent increase in January.
The Conference Board reports that the consumer confi-dence index declined to 104.0 in April 2007 from 108.2 in March. The present situation index also declined, due pri-
■
■
■
■
marily to a “combination of weakening expectations and a less favorable assessment of present-day conditions.” Ac-cording to the Commerce Department, consumer spending increased 0.3 percent in March 2007, following a 0.6-per-cent increase in February, and a 0.5-percent increase in January. The University of Michigan consumer sentiment index declined to 88.4 in March 2007 from 91.3 in Febru-ary, due mostly to concerns about gasoline prices, hous-ing, and stock market volatility.
The year 2007 is starting out strong for retail and clothing sellers. Retail sales increased 0.6 percent in March 2007 from February, and 3.6 percent since last year. General merchandise sales are also doing well, with an increase of 5.8 percent since last year. According to store reports, discounters Wal-Mart and Target saw March 2007 sales increases of 11.7 percent and 16.8 percent, respectively, from year-ago sales numbers. Nordstom’s sales increased 14.2 percent in March 2007 from year-ago sales, Kohl’s sales increased 25.4 percent in March 2007 from last year, while American Eagle saw an increase of 35.0 percent in retail sales from a year ago.
Vehicle sales were mixed, with sales of imports stronger than those of domestic vehicles in some districts, as re-ported in the April 25, 2007 Beige Book. For the first time ever, Toyota surpassed General Motors as the top seller of automobiles worldwide during first quarter 2007.
■
■

�Investment TrendsQuarterly
Copyright© 2007 by Real Estate Research Corporation (RERC) and the CCIM Institute.
TheEffectonRealEstate
According to the April 25, 2007 Beige Book, residential real estate activity continued to weaken in many districts, and remained flat in others, although the Boston district noted improving residential markets and volume across New Eng-land.
Cold weather in February 2007 and decreased subprime lending contributed to fewer closed home sales in March, ac-cording to the National Association of REALTORS® (NAR). After rising for 3 consecutive months, total existing home sales fell 8.4 percent to a seasonally-adjusted annual rate of 6.12 million in March from 6.68 million in February.
According to NAR, the median price for existing homes in February was $212,800, and the recovery in the housing market has been delayed until approximately fourth quarter
■
■
■
2007. Prices are expected to fall 0.7 percent (national aver-age) in 2007, although local markets will have up and down dynamics, including possible price gains of up to 10 percent in markets like Portland, Raleigh, and Austin.
The Commerce Department reported that single-family hous-ing starts in March 2007 declined at a seasonally-adjusted an-nual rate of nearly 1.52 million, a 0.8-percent decrease from the February number. However, approximately 1.63 million single-family housing completions occurred in March, which is 1.5 percent above those for February. In addition, slightly more than 1.54 million single-family building permits were is-sued in March, 0.8 percent above February permits.
Total new construction increased by 7.0 percent in February 2007 from January, reaching a seasonally-adjusted annual rate of $609.6 billion according to McGraw-Hill Construction. At an annual rate of slightly more than $276 billion, residential building in February remained unchanged from January. Sin-gle-family housing construction fell approximately 2 percent in February, while multifamily housing construction jumped about 13 percent in February after a weak January. Nonresi-dential building increased about 25 percent in February to an annual rate of $219.1 billion.
Commercial real estate markets remained active across most districts, as reported in the April 25, 2007 Beige Book. Solid gains were seen in the St. Louis, New York, and Kansas City districts. Office vacancy rates continued to decline in most cities of the San Francisco, Kansas City, New York, and Min-neapolis districts, although the Dallas district reported that of-fice leasing has slowed. However, commercial construction continued to expand in most districts, and was considered ro-bust in some regions. Commercial development in the Atlanta district during first quarter 2007 exceeded year-ago levels.
All five of the commercial real estate sectors surveyed by RERC for the RERC/CCIM Investment Trends Quarterly re-ceived performance ratings above 6.5, with the apartment sector once again earning the highest rating of 7.1. Many survey respondents noted that the slowing housing market will strengthen the apartment sector in the coming quarters.
CCIM Institute designees and candidates rated “return ver-sus risk” for commercial real estate at 6.2 on a scale of 1 to 10, with 10 being high, indicating their view is that the returns are slightly greater than the risk. The apartment and hotel sectors received the highest rating at 6.7.
■
■
■
■
■
�Investment TrendsQuarterly
Copyright© 2007 by Real Estate Research Corporation (RERC) and the CCIM Institute.
TheEffectonRealEstate
CCIM Institute designees and candidates rated “value versus price” of commercial real estate at 5.3 on a scale of 1 to 10, with 10 being high. Survey respondents rated the industrial sector as having the best value compared to price, giving it an average rating of 5.7.
“Inflation versus value” for commercial real estate earned a 4.8 rating from CCIM Institute designees and candidates, indicating that inflation for commercial real estate properties will be slightly less than their value.
Several CCIM Institute designees and candidates stated that commercial real estate market growth is stabilizing. Some survey respondents suggest that supply will shortly exceed demand if current rates continue, but others expect supply to slow with construction remaining fairly high.
Some CCIM Institute designees and candidates are expect-ing capitalization rates to increase. Capitalization rate com-pression has been expected to slow for some time, and with a slowing housing market and a stable economy, this may finally occur.
CCIM Institute designees and candidates echoed many of the same sentiments during first quarter 2007 that were of-fered during the previous few quarters, expecting the apart-ment market to fare well due to increased rents and higher demand, as more foreclosures are expected with more people renting rather than buying. Respondents expect the office sector to perform well due to increased rents, supply constraints, higher occupancies, and continued employment growth in office-using industries. Industrial properties are ex-pected to see the greatest amount of growth over the coming year.
■
■
■
■
■
As one would expect, RERC’s transaction analysis shows the highest dollar volume of sales occurred in the office sector as compared to the other property types tracked by RERC. The apartment market saw the highest total number of transac-tions from April 1, 2006 to March 31, 2007.
The apartment sector has the lowest realized capitalization rate at 5.1 percent, as well as the lowest median capitaliza-tion rate at 6.1 percent.
In Summary…
Although the commercial real estate market reached new heights in 2006, some survey respondents expect a slow-down to occur in 2007. However, RERC suggests that 2007 commercial market performance is more likely to level off, and investors should take time to enjoy the stellar perfor-mance of the past year.
Market fundamentals for commercial real estate remain strong. Private equity investors are becoming even bigger players in this market, creating more demand than in the past. As a result, prices have continued to increase as capi-talization rates have decreased. Corporate profits and personal incomes are up, the Baby Boomers seem to be leaving their retirement funds in the market, and investment dollars still need a place to be in-vested. Capital should continue to flow into the commercial real estate market, as interest rates are expected to remain low and other investment alternatives, such as stocks and bonds, for the most part, seem to be moving in a generally lateral direction.
■
■
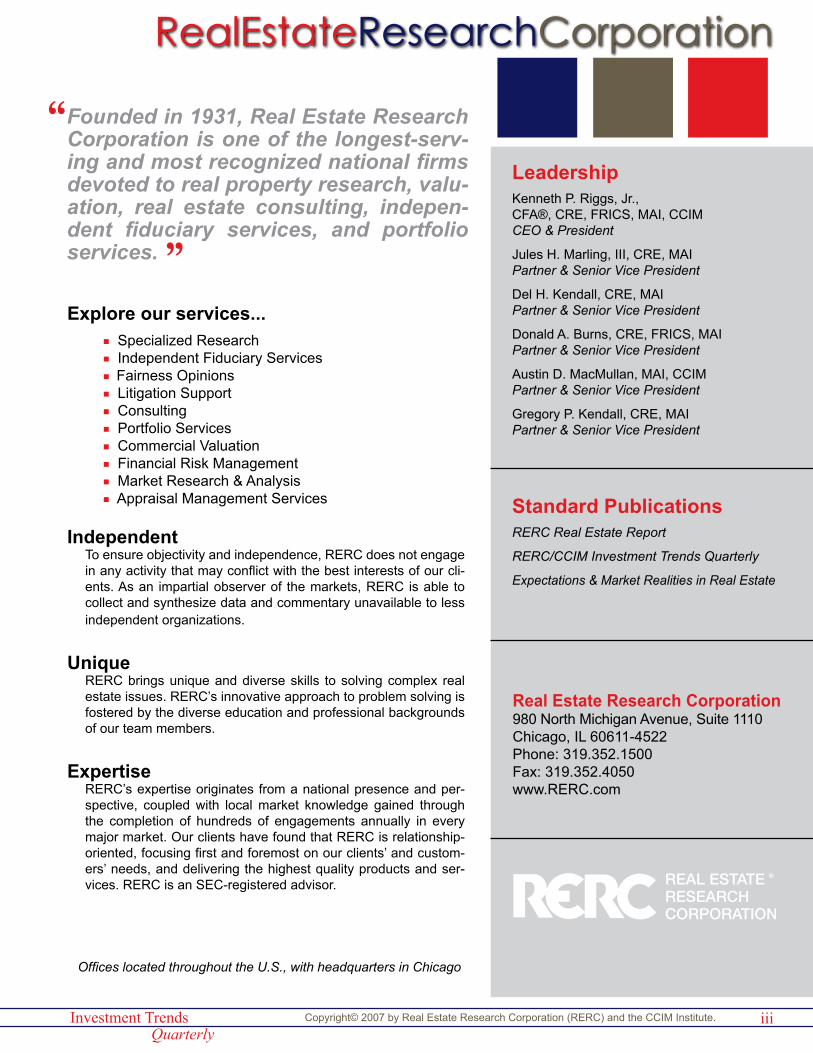
What Do the Financial Markets Tell Us?Compounded Annual Rates of Return as of 3/31/2007
Market Indices 1-Year 3-Year 5-Year 10-Year 15-YearConsumer Price Index 2.78% 3.10% 2.81% 2.53% 2.62%
10-Year Treasury Bond* 4.82% 4.51% 4.38% 4.98% 5.51%
Dow Jones Industrial Average 11.21% 6.05% 3.50% 6.50% 9.34%
NASDAQ Composite 5.28% 6.97% 5.43% 6.56% 9.51%
NYSE Composite 11.58% 11.53% 7.50% 7.55% 9.37%
S&P 500 10.02% 8.15% 4.42% 6.52% 8.77%
NCREIF Index 16.60% 17.44% 13.84% 12.94% 10.21%
NAREIT Index 21.79% 20.33% 21.41% 14.10% 14.86%
*Based on Average End of Month T-Bond RatesSources: Economy.com, NCREIF, NAREIT, compiled by RERC

�Investment TrendsQuarterly
Copyright© 2007 by Real Estate Research Corporation (RERC) and the CCIM Institute.
Real Estate Indicators - 1Q 2007
Performance Indicators Recent Data Impact on Commercial Real Estate
Consumer ConfidenceDecember 2006 - 109.0 January 2007 - 110.2 February 2007 - 111.2 March 2007 - 107.2
Although consumer confidence fell slightly in March, it remains strong over-all due to the growing job market and new highs in the stock markets. Strong consumer confidence will have the greatest positive impact on the hospitality and retail sectors.
Real GDP (seasonally-adjusted annual rates in billions)
3rd Quarter 2006 - $13,322.64th Quarter 2006 - $13,458.2 1st Quarter 2007 (advance) - $13,632.6
Real GDP growth, a key factor reflecting the overall health and strength of the economy, increased by 1.3 percent in first quarter 2007. As predicted, this is lower than fourth quarter 2006 GDP growth of 2.5 percent, and much lower than the year-ago GDP growth rate of 5.6 percent.
Unemployment Rate (seasonally-adjusted)
December 2006 - 4.5% January 2007 - 4.6% February 2007 - 4.5% March 2007 - 4.4%
Another key factor reflecting the health of the nation's economy is the job market, which continues to grow. Low unemployment continues to support the commercial real estate market, which depends heavily on job growth and economic expansion.
Federal Funds RateDecember 12, 2006 - 5.25% January 31, 2007 - 5.25% March 21, 2007 - 5.25%
At its last meeting, the Federal Open Market Committee (FOMC) elected to keep the federal funds rate at 5.25 percent. This has helped to keep interest rates low overall, and investing in commercial real estate an attractive option. The rate is expected to remain at 5.25 percent unless inflation becomes more problematic.
10-Year Treasury Rates
December 29, 2006 - 4.71% January 31, 2007 - 4.83% February 28, 2007 - 4.56% March 30, 2007 - 4.65% April 25, 2007 - 4.66%
As long-term interest rates continue to hover below the 5.0-percent level, commercial real estate will continue to benefit from the relative low borrow-ing rates. There has been very little volatility among the long-term treasury rates over the past year, and we expect this to continue through mid-2007.
S & P 500 IndexDecember 2006 - 6.17% 4Q06 YTD Return March 30, 2007 - 0.18% 1Q07 YTD Return April 27, 2007 - 5.49% YTD Return
Despite strong investment performance during the latter half of 2006, the stock market distinctly cooled during first quarter 2007. However, the stock market rebounded in April, with S&P YTD returns nearing 5.5 percent, and the Dow surging past the 13,000 barier. Overall, stock market volatility will continue to make many investors wary, which benefits the relatively stable real estate market.
Housing Starts (thousand units)
January 2007 - 1,399 February 2007 - 1,506 March 2007 - 1,518
Although housing starts increased during first quarter 2007, the rate of growth has slowed dramatically over the last year. The apartment market should see the most benefit with increased demand for rental units.
Existing Home Sales January 2007 - 6.44 million units February 2007 - 6.69 million units March 2007 - 6.12 million units
After a typically slow start in January, home sales increased during Febru-ary and then fell dramatically in March due to continued cold weather in the Midwest and Northeast. The slowdown in the housing market should help the apartment market as those who are not buying homes will rent.
Vacancy RatesOffice (TWR)= 12.3% up from 12.2% in 4Q06 Industrial (TWR) = 9.3% down from 9.4% in 4Q06 Retail (TWR) - 8.2% up from 8.0% in 3Q06 Apartment (Reis) - 6.0% up from 5.9% in 4Q06
With the exception of the industrial sector, vacancy for core real estate increased during first quarter 2007. Despite the upward shifts in vacancy among the office, retail, and apartment sectors, net absorption remained strong, although it was outpaced by new construction.
Rental Rates (RERC's surveyed rent growth expectations)
Office - 3.3% to 3.5% Industrial - 2.6% to 2.8% Retail - 2.8% to 3.1% Apartment - 3.4% Hotel - 3.4%
RERC's survey respondents expent rental growth to increase slightly over the coming quarters, however, some of this growth will be offset by anticipated expense growth. Overall, rental growth is quite timely and can help support the high prices we've seen. Rental growth continues to be very market-spe-cific, with the most substantial increases occurring in high-growth coastal markets.
Real Estate Returns
RERC's Required Returns: Office - 8.0% to 8.4% Industrial - 8.0% to 8.6% Retail - 8.1% to 8.3% Apartment - 7.8% Hotel - 10.0%
NCREIF Realized Returns: Office - 16.7% - 25.1% Industrial - 15.6% - 18.1% Retail - 11.6% - 12.8% Apartment - 13.9% Hotel -23.2%
Total office market returns further increased during first quarter 2007, with 1-year trailing total returns above 25 percent for CBD office and nearing 17 percent for suburban office. Returns for the other property sectors were stable and more in line with fourth quarter 2006 returns. Total returns are expected to begin to slowly revert towards the mean during 2007, with 2007 total returns lower than 2006 returns.
Capitalization Rates
RERC's Required Cap Rates: Office - 6.2% Industrial - 7.0% Retail - 6.6% Apartment - 5.1% Hotel - 8.2%
NCREIF Implied Cap Rates: Office - 5.7% - 6.5% Industrial - 6.3% - 6.6% Retail - 6.1% - 6.5% Apartment - 5.2% Hotel - 8.5%
RERC's first quarter 2007 required cap rates decreased slightly from fourth quarter 2006 rates, as did NCREIF cap rates. This slight decrease indicates that cap rates are beginning to stabilize. As we have noted, cap rates have bottomed out in most markets and asset management is becoming abso-lutely critical to income-generation and value creation.

�Investment TrendsQuarterly
Copyright© 2007 by Real Estate Research Corporation (RERC) and the CCIM Institute.
NAR Commercial Forecast (April 2007)
2006 2007
2005 2006 2007 II III IV I II III IV
OFFICE
Vacancy Rate (%)13.1 12.9 12.9 12.7 12.5 12.3 13.9 13.6 12.9 12.1
Net Absorption (‘000 sq. ft.) 21,011 19,771 19,645 19,198 19,033 16,640 8,425 90,280 73,741 71,731
Office Employment (thousands) 16,539 16,654 16,749 16,840 16,918 17,005 17,033 16,338 16,749 17,102
Completions (‘000 sq. ft.) 11,974 13,326 22,530 14,682 13,437 12,723 14,359 36,282 57,174 51,495
Inventory (millions sq. ft.) 3,278 3,291 3,314 3,329 3,342 3,355 3,378 3,257 3,314 3,365
Rent Growth (%) 0.9 1.1 1.0 1.0 1.3 1.4 0.7 5.2 4.3 5.2
INDUSTRIAL
Vacancy Rate (%) 9.7 9.5 9.5 9.4 9.3 9.0 10.1 9.9 9.5 9.0
Net Absorption (‘000 sq. ft.) 54,679 51,554 57,391 61,221 55,929 55,843 21,029 295,817 191,293 231,078
Industrial Employment (thousands) 10,185 10,186 10,211 10,239 10,266 10,295 10,279 10,175 10,211 10,322
Completions (‘000 sq. ft.) 39,584 35,780 65,568 52,278 51,628 36,379 39,419 150,689 179,792 181,405
Inventory (millions sq. ft.) 11,941 11,977 12,043 12,095 12,146 12,182 12,236 11,863 12,043 12,224
Rent Growth (%) 0.2 0.4 0.7 0.8 0.9 1.0 0.6 2.9 1.7 3.8
RETAIL
Vacancy Rate (%) 8.1 8.0 8.1 8.1 8.1 8.1 8.1 7.2 8.1 8.1
Net Absorption (‘000 sq. ft.) -351 7,282 4,036 3,550 4,530 5,208 5,315 30,479 6,756 18,114
Completions (‘000 sq. ft.) 5,365 5,658 5,101 4,270 5,022 5,509 585 23,355 21,558 19,945
Inventory (millions sq. ft.) 1,526 1,531 1,537 1,541 1,546 1,551 1,563 1,515 1,537 1,557
Rent Growth (%) -0.6 0.5 0.6 0.5 0.3 0.2 0.3 2.9 -0.4 1.2
MULTIFAMILY
Vacancy Rate (%) 4.6 4.8 5.4 5.3 5.1 4.8 5.9 6.2 5.4 5.4
Net Absorption (Units) 114,748 50,754 -29,001 66,067 79,973 91,136 -2,433 350,975 259,996 207,371
Completions (Units) 56,844 57,478 52,554 55,448 56,038 55,084 57,320 203,343 221,886 220,924
Inventory (Units in Millions) 13.7 13.7 13.8 13.8 13.9 13.9 14.0 13.6 13.8 14.0
Rent Growth (%) 1.1 1.1 1.1 1.0 0.9 1.0 0.9 2.9 4.3 3.9
Sources: NAR, Torto Wheaton Research

�Investment TrendsQuarterly
Copyright© 2007 by Real Estate Research Corporation (RERC) and the CCIM Institute.
NationalMarketAnalysis
Investment Conditions Ratings* - 1Q 2007Office 6.5
Industrial 6.8
Retail 6.9
Apartment 7.1
Hotel 7.0*Ratings are averages based on responses to surveys from CCIM designees and can-didates for first quarter 2007.
National Transaction Breakdown (4/1/06 - 3/31/07)Office Industrial Retail Apartment Hotel
< $2 MillionVolume (Mil) $2,699 $4,621 $4,738 $6,060 $258
Size Weighted Avg. $85 $49 $85 $71,247 $35,879
Price Weighted Avg. $123 $83 $130 $109,104 $58,948
Median $91 $56 $86 $81,448 $38,225
$2 - $5 MillionVolume (Mil) $4,951 $7,577 $8,232 $6,753 $1,130
Size Weighted Avg. $115 $56 $128 $69,636 $42,700
Price Weighted Avg. $173 $96 $227 $128,694 $68,107
Median $150 $79 $193 $94,229 $49,127
> $5 MillionVolume (Mil) $206,660 $40,449 $65,582 $98,916 $38,029
Size Weighted Avg. $231 $70 $166 $108,414 $174,848
Price Weighted Avg. $406 $107 $271 $200,888 $351,938
Median $176 $79 $180 $92,986 $111,111
All TransactionsVolume (Mil) $214,311 $52,647 $78,552 $111,729 $39,418
Size Weighted Avg. $221 $66 $152 $102,090 $156,938
Price Weighted Avg. $397 $103 $258 $191,546 $341,880
Median $140 $67 $130 $86,864 $78,123
Capitalization Rates % (All Transactions)Range 3.4 - 10.6 4.0 - 10.8 3.8 - 10.0 3.1 - 10.4 5.0 - 11.0
Weighted Avg. 6.2 7.0 6.6 5.1 8.2
Median 7.0 7.1 6.8 6.1 8.6Source: RERC

OfficePropertySector
�0Investment TrendsQuarterly
Copyright© 2007 by Real Estate Research Corporation (RERC) and the CCIM Institute.
CCIM Institute designees and candidates gave the office sector an investment conditions rating of 6.5 (on a scale of 1 to 10, with 10 being high) for first quarter 2007, an increase from the previous quarter’s rating of 6.2. Despite the increase from last quarter, this is the lowest rating among the five major property types tracked in the RERC/CCIM Investment Trends Quarterly.
Several survey respondents, especially those in the West-ern region, stated that the office market in their area is expected to strengthen.
Although the office sector had the second lowest number of transactions as compared to the other major property types covered by RERC, this sector had the highest dollar volume of transactions during first quarter 2007.
According to RERC’s analysis, the first quarter 2007 size-weighted average price of office space is $221 per square foot, the price-weighted average price of office space is $397 per square foot, and the median price of office space is $140 per square foot. The large margin between the median price and the price- and size-weighted averages is due to the many high-priced, large-property transactions conducted during this time period.
According to RERC’s analysis, the first quarter 2007 weighted-average capitalization rate for the office sector is 6.2 percent.
According to Torto Wheaton Research, the average va-cancy rate for central business district (CBD) office proper-ties during first quarter 2007 was 10.3 percent. The aver-age vacancy rate for suburban office properties was 14.0 percent, which was the first increase in suburban office property vacancy since 2003.
■
■
■
■
■
■
Office Risk-Adjusted Returns
5.5%
6.0%
6.5%
7.0%
7.5%Weighted Avg. Cap Rate
WestSouthMidwestEast
National Weighted Avg. Cap Rate
Weighted Avg. Capitalization Rate - 1Q 2007
$100
$200
$300
$400
$500
$600Price-Weighted Average PPSF
WestSouthMidwestEast
National Price-Weighted Average PPSF
Price-Weighted Avg. Price Per Sq. Ft. - 1Q 2007
$100
$200
$300
$400
$500
$600Size-Weighted Average PPSF
WestSouthMidwestEast
National Size-Weighted Average PPSF
Size-Weighted Avg. Price Per Sq. Ft. - 1Q 2007
National

��Investment TrendsQuarterly
Copyright© 2007 by Real Estate Research Corporation (RERC) and the CCIM Institute.
IndustrialPropertySector
CCIM institute designees and candidates gave the industrial sector an investment conditions rating of 6.8 (on a scale of 1 to 10, with 10 being high) for first quarter 2007. This is the sec-ond-lowest rating of the five property types tracked by RERC. It is also equal to the industrial sector’s fourth quarter 2006 investment conditions rating.
The availability rate for the industrial sector was 9.3 percent during first quarter 2007, 40 basis points lower than last quar-ter, according to Torto Wheaton Research.
According to RERC’s analysis, the size-weighted average price of industrial space is $66 per square foot, very compa-rable to the median price of $67 per square foot. The higher price-weighted average price of $103 per square foot of in-dustrial space reflects the sale of several smaller-sized, high-priced buildings.
According to RERC’s transaction analysis, the first quarter 2007 weighted average capitalization rate for industrial proper-ties is 7.0 percent, down 40 basis points from the fourth quar-ter 2006 rate.
CCIM Institute designees and candidates view the industrial sector as the best commercial real estate property type value in terms of price. Survey respondents also view inflation as less of a threat to the industrial sector than it might be for other property sectors.
First quarter 2007 survey respondents stated that the industrial sector is seeing the most growth among the various property types, and that the industrial warehouse subsector offers the greatest investment opportunity.
■
■
■
■
■
■
6.25%
6.50%
6.75%
7.00%
7.25%
7.50%
7.75%Weighted Avg. Cap Rate
WestSouthMidwestEast
National Weighted Avg. Cap Rate
Weighted Avg. Capitalization Rate - 1Q 2007
$30
$50
$70
$90
$110
$130
$150Price-Weighted Average PPSF
WestSouthMidwestEast
National Price-Weighted Average PPSF
Price-Weighted Avg. Price Per Sq. Ft. - 1Q 2007
$30
$50
$70
$90
$110
$130
$150Size-Weighted Average PPSF
WestSouthMidwestEast
National Size-Weighted Average PPSF
Size-Weighted Avg. Price Per Sq. Ft. - 1Q 2007
National

��Investment TrendsQuarterly
Copyright© 2007 by Real Estate Research Corporation (RERC) and the CCIM Institute.
RetailPropertySector
6.00%
6.25%
6.50%
6.75%
7.00%
7.25%
7.50%Weighted Avg. Cap Rate
WestSouthMidwestEast
National Weighted Avg. Cap Rate
Weighted Avg. Capitalization Rate - 1Q 2007
$100
$150
$200
$250
$300
$350
$400Price-Weighted Average PPSF
WestSouthMidwestEast
National Price-Weighted Average PPSF
Price-Weighted Avg. Price Per Sq. Ft. - 1Q 2007
CCIM Institute designees and candidates gave the retail sec-tor an investment conditions rating of 6.9 (on a scale of 1 to 10, with 10 being high) for first quarter 2007. This rating was slightly higher than the fourth quarter 2006 rating.
The retail availabilty rate increased 20 basis points to 8.2 per-cent during fourth quarter 2006, according to Torto Wheaton Research.
Retail availability is expected to continue to increase if con-sumer spending slows. Discretionary spending is at risk due to high energy prices, loss of certain kinds of jobs, and to the slowdown in the housing sector in some regions.
CCIM Institute designees and candidates gave the retail sec-tor a risk versus return rating of 6.7, which, along with that rating for apartments, was the highest rating given to the ma-jor property types, and indicates respondents view the returns for this property sector are greater than the amount of risk it presents.
The retail sector seems to be showing a little more life. Sev-eral survey respondents stated that the retail sectors in their area are stabilizing, and in many cases, are showing signs of growth.
The retail sector had the second-highest number of sales transactions completed (second only to apartment transac-tions) from April 1, 2006 to March 31, 2007.
According to RERC’s analysis, the size-weighted average price per square foot for retail space for first quarter 2007 is only slightly higher than the median price. However, due to the many high-priced transactions that occurred during the time period analyzed, the price-weighted average price of retail space was substantially higher.
■
■
■
■
■
■
■
$100
$150
$200
$250
$300
$350
$400 Size-Weighted Average PPSF
WestSouthMidwestEast
National Size-Weighted Average PPSF
Size-Weighted Avg. Price Per Sq. Ft. - 1Q 2007
National
��Investment TrendsQuarterly
Copyright© 2007 by Real Estate Research Corporation (RERC) and the CCIM Institute.
ApartmentPropertySector
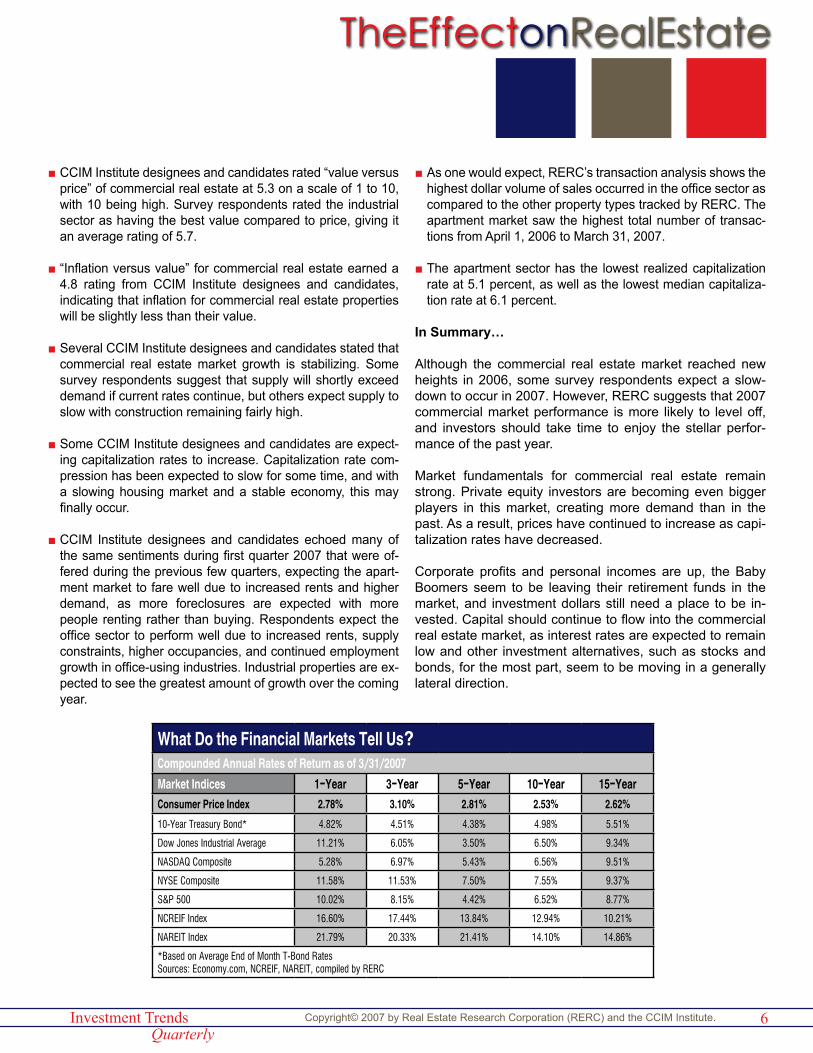
CCIM Institute designees and candidates rated investment conditions for the apartment sector at 7.1 (on a scale of 1 to 10, with 10 being high) for first quarter 2007, a slight in-crease from fourth quarter 2006. Like last quarter, survey respondents gave the apartment sector the highest rating of any of the property types tracked by RERC.
Average vacancy in the apartment sector increased to 6.0 percent during first quarter 2007, from 5.9 percent during fourth quarter 2006, and from 5.4 percent in third quarter, according to Reis, Inc. However, demand for rental units is expected to increase as the housing market cools.
RERC’s recent apartment sales analysis shows that the first quarter 2007 average capitalization rate for the apart-ment sector is 5.1 percent. This was the lowest capitaliza-tion rate among the property types tracked by RERC.
Although the apartment sector received the highest invest-ment conditions rating, several CCIM Institute designees and candidates noted that apartment market growth is starting to slow.
The apartment sector received a risk versus return rating of 6.7, one of the higher ratings in this category, indicating that respondents believe that the amount of returns asso-ciated with investing in apartment properties is higher than the amount of expected risk.
The median price per apartment unit is $86,864, less than the size-weighted average of $102,090 per unit and the price-weighted average of $191,546.
■
■
■
■
■
■
4.0%
4.5%
5.0%
5.5%
6.0%
6.5%
7.0%Weighted Avg. Cap Rate
WestSouthMidwestEast
National Weighted Avg. Cap Rate
Weighted Avg. Capitalization Rate - 1Q 2007
$50,000
$100,000
$150,000
$200,000
$250,000
$300,000
$350,000Price-Weighted Average PPU
WestSouthMidwestEast
National Price-Weighted Average PPU
Price-Weighted Avg. Price Per Unit - 1Q 2007
$50,000
$100,000
$150,000
$200,000
$250,000
$300,000
$350,000Size-Weighted Average PPU
WestSouthMidwestEast
National Size-Weighted Average PPU
Size-Weighted Avg. Price Per Unit - 1Q 2007
National

��Investment TrendsQuarterly
Copyright© 2007 by Real Estate Research Corporation (RERC) and the CCIM Institute.
HotelPropertySector
Investment conditions for the hotel sector earned a rating of 7.0 (on a scale of 1 to 10, with 10 being high) during first quarter 2007, which is substantially higher than the 6.5 rating earned last quarter, according to CCIM Institute designees and candidates.
According to Smith Travel Research, the fourth quarter 2006 hotel occupancy rate was 58.2 percent, a 1.3-per-cent decrease in the occupancy rate recorded during the same period a year earlier. Revenue per available room (RevPAR) was $61.69, an increase of 7.5 percent from 1 year ago.
Capital is expected to continue to flow into the commercial real estate market during 2007, with the hotel sector see-ing some of the strongest demand. However, increased construction is expected to impact hotel fundamentals throughout the remainder of the year.
CCIM Institute designees and candidates gave the hotel sector a value versus price rating of 5.2, indicating that the amount of value in a hotel property is only slightly more than the price indicated for those properties.
Several CCIM Institute designees and candidates stated that some area hotels were seeing strong revenues and fundamentals due to the strong economic outlook and a shortage of hotel supply due to the number of properties being converted to condominiums.
RERC’s analysis shows the median sale price per hotel unit is $78,123. This was well below both the size-weight-ed and price-weighted averages.
■
■
■
■
■
■
7.5%
8.0%
8.5%
9.0%Weighted Avg. Cap Rate
WestSouthMidwestEast
National Weighted Avg. Cap Rate
Weighted Avg. Capitalization Rate - 1Q 2007
$50,000
$150,000
$250,000
$350,000
$450,000 Price-Weighted Average PPU
WestSouthMidwestEast
National Price-Weighted Average PPU
Price-Weighted Avg. Price Per Unit - 1Q 2007
$50,000
$150,000
$250,000
$350,000
$450,000Size-Weighted Average PPU
WestSouthMidwestEast
National Size-Weighted Average PPU
Size-Weighted Avg. Price Per Unit - 1Q 2007
National

��Investment TrendsQuarterly
Copyright© 2007 by Real Estate Research Corporation (RERC) and the CCIM Institute.
By Edward M. Bury, APR
Nearly 2 years after the most unwelcomed of visitors – Hurri-canes Katrina and Rita – ravaged Louisiana and its Gulf Coast neighbors, the economy of Louisiana’s capitol city grapples with nearly unbridled growth. After New Orleans and the coastal ar-eas flooded, Baton Rouge swelled with people, capital, oppor-tunities for new development, and soaring demand for existing commercial and residential property.
Statistics from the Baton Rouge Area Chamber of Commerce point to a robust economy at year-end 2006: 10,000 new jobs in the metropolitan statistical area (MSA), along with job growth in other Louisiana parishes; a remarkably low unemployment rate (approaching 3 percent); moderating natural gas prices and strong refining markets; and $10 billion in new construc-tion. And, there is no shortage of investors seeking to purchase existing product or developers hoping to satisfy the ever-pres-ent demand.
Owners who sell – and often at low capitalization rates – have challenges in finding new properties to purchase. This may prompt investors to shift their cash to properties out of state or to other investment vehicles.
The Class A office market, for example, comprises more than 3 million square feet. According to the Louisiana Commercial Data Base (LACDB) TRENDS report, two of the city’s office submarkets are 100-percent leased, while the other two sub-markets are more than 96-percent leased. In the months be-fore Hurricane Katrina, the market was just under 70-percent leased.
On the other side of the equation, greater Baton Rouge faces steep inflation in the construction and labor markets. A survey of business leaders revealed that the top concerns were traffic congestion and the availability of qualified workers, followed by rising labor and utility costs, and delays in repairing infrastruc-ture.
But back to the positive. The projected population growth of 15,000 to 20,000 by year-end 2007 has energized the housing market, especially the apartment sector. Planners are drawing up “neo-traditional” or urban village developments to create a continuous fabric of blended land adjacent to shops and offices. More than 600 apartment units were completed in 2006, and more than 1,700 are planned for this year, mostly falling into the “upscale” category. Sales of multifamily complexes that are 20 to 40 years old have yielded $30,000 to $50,000 per unit and 6.5 percent to 7.5 percent capitalization rates, while new apart-ments sell for up to $75,000 per unit and command 6.0 percent to 7.0 percent capitalization rates.
Where will these people shop? Under construction are stores from Cabela’s, Home Depot, and Bass Pro Shops, as well as a Tanger Outlet Mall and others.
As in any growing market, Baton Rouge eventually may have to cope with being overbuilt. But more than likely, this is not an is-sue city fathers or investors will have to address anytime soon.
Karl Landreneau, CCIM, contributed insight to this article, and statistical data was taken from the LACDB online TRENDS re-port.
remains in state of contrasts
��Investment TrendsQuarterly
Copyright© 2007 by Real Estate Research Corporation (RERC) and the CCIM Institute.
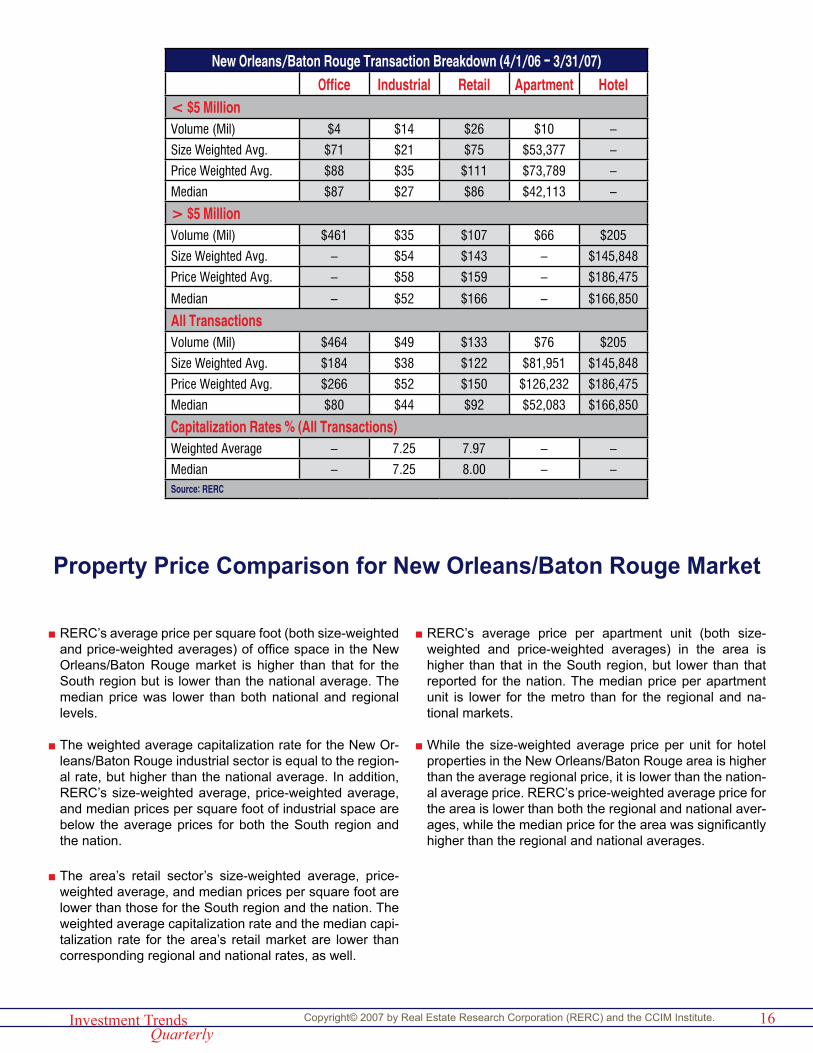
New Orleans/Baton Rouge Transaction Breakdown (4/1/06 - 3/31/07)Office Industrial Retail Apartment Hotel
< $5 MillionVolume (Mil) $4 $14 $26 $10 –
Size Weighted Avg. $71 $21 $75 $53,377 –
Price Weighted Avg. $88 $35 $111 $73,789 –
Median $87 $27 $86 $42,113 –
> $5 MillionVolume (Mil) $461 $35 $107 $66 $205
Size Weighted Avg. – $54 $143 – $145,848
Price Weighted Avg. – $58 $159 – $186,475
Median – $52 $166 – $166,850
All TransactionsVolume (Mil) $464 $49 $133 $76 $205
Size Weighted Avg. $184 $38 $122 $81,951 $145,848
Price Weighted Avg. $266 $52 $150 $126,232 $186,475
Median $80 $44 $92 $52,083 $166,850
Capitalization Rates % (All Transactions)Weighted Average – 7.25 7.97 – –
Median – 7.25 8.00 – –Source: RERC
RERC’s average price per square foot (both size-weighted and price-weighted averages) of office space in the New Orleans/Baton Rouge market is higher than that for the South region but is lower than the national average. The median price was lower than both national and regional levels.
The weighted average capitalization rate for the New Or-leans/Baton Rouge industrial sector is equal to the region-al rate, but higher than the national average. In addition, RERC’s size-weighted average, price-weighted average, and median prices per square foot of industrial space are below the average prices for both the South region and the nation.
The area’s retail sector’s size-weighted average, price-weighted average, and median prices per square foot are lower than those for the South region and the nation. The weighted average capitalization rate and the median capi-talization rate for the area’s retail market are lower than corresponding regional and national rates, as well.
■
■
■
RERC’s average price per apartment unit (both size-weighted and price-weighted averages) in the area is higher than that in the South region, but lower than that reported for the nation. The median price per apartment unit is lower for the metro than for the regional and na-tional markets.
While the size-weighted average price per unit for hotel properties in the New Orleans/Baton Rouge area is higher than the average regional price, it is lower than the nation-al average price. RERC’s price-weighted average price for the area is lower than both the regional and national aver-ages, while the median price for the area was significantly higher than the regional and national averages.
■
■
Property Price Comparison for New Orleans/Baton Rouge Market

��Investment TrendsQuarterly
Copyright© 2007 by Real Estate Research Corporation (RERC) and the CCIM Institute.
Gold
SilverProperty Politics, Wayne D’Amico, Essex, CT
Bronze
Contributors
Wayne Spiegel Boston, MAAJF Properties Eddie Perez Miami, FLB. T. Property Associates
Diane Baer Yecko Pittsburgh, PA
Baldwin Commercial Properties Tom Baldwin San Antonio,
TX
Barbara Collins, Inc. J. Barbara Collins Miami, FL
CB Richard Ellis/MEGA
James W. Maenner Omaha, NE
Century 21 Samia Realty
Barry C. Weyland Portland, ME
Cohen Financial Lyle W. Preest FloridaColdwell Banker Commercial Hank Adams W i l m i n g t o n ,
NCColdwell Banker Commercial Nicholson Williams Realty
Henry D. Rogers
Jacksonvil le, FL
Colliers Peter Kravaritis Chicago, ILColliers ABR, Inc. Craig Evans New YorkCommercial Investment Services Rob Stefka Nebraska
Duemelands Commercial
Skip Duemeland Bismarck, ND
FCREI Brian Heffernan Stockton
Graham Organization Mark Vellinga Souix Falls, SD
Halo Realty Nancy Johns-Wood Nashville, TN
Handy Realty Randall Handy Delaware
Hilgenberg Realty, LLC Philip J. Hilgenberg Wisconsin
Hoot Gibson Realty, Inc.
Ralph D. "Hoot" Gibson Tucson, AZ
Investment Realty Company Roger Gray San Antonio,
TXJoseph E. Kean Company
Joseph E. Kean Houston, TX
K.S.K. Services, Inc. Kenneth Kraw-czyk Milwaukee, WI
Kelly Capital Fred Caminite No Specific Market
Kennedy Wilson Tom Pardee Austin, TXLarkin Commercial Properties, Inc. Jay Verro New York
Larsen Baker LLC George C. Larsen Arizona
Mizrach Realty Associates
Danny Zelonker Miami, FL
Mohr Financial William Mohr No Specific Market
NAI Horizon John S. Filli Phoenix, AZ
National Realty Janie Alf Brevard County, FL
NexCore Group Bryan Barnes Denver, COPrudential CRES Ed Light Tampa, FLRam Harnden Commercial
Daren W. Hebold
Southern Maine
RE/MAX John V. Griesmer Cincinnati, OH
Re/Max Executives Linda Joyner-Jones
Lewiston, ID/Clarkston, WA
Realty Executives Frank Weiskopf Knoxville, TN
REMAX 2000 Ronald A. Egoroff
Brevard County
��Investment TrendsQuarterly
Copyright© 2007 by Real Estate Research Corporation (RERC) and the CCIM Institute.
Thank you to all who
contributed to this report.
Contributors
ReMax Greater Atlanta Kelly Kim Atlanta, GA
REMAX Realty Group Frank Szelest Ft. Myers/Naples, FL
Renaissance Enterprises Vilas Patel Atlanta
Rexford Industrial Jacqueline Harris Los Angeles
Ross Realty Group Abraham Adler TampaSchonberger Associates, LLC
Sanford Schonberger
Northern New Jersey
Sperry Van Ness Henry Hagen-dorf Houston
Sperry Van Ness Walt Arnold AlbuquerqueSperry Van Ness/Chiri-co Huber Properties Edna Chirico Charlotte
Sperry Van Ness/Rambo & Ginsberg Clark Rambo Southwest
FloridaThe Blau & Berg Company
Kenneth Crimmins
Northern New Jersey
The Houston Group, Inc. Houston Jones
Louisville/Southern Indiana
The Masiello Group - Commercial Assoc. Steve Farrar Maine
The Schenk Company Greg Schenk ColumbusThornton Oliver Keller Ben Zamzow BoiseUpstate Commercial Group Nancy Meyer New York
US General Services Administration
Mark A. Montgomery
No Specific Market
Valkyrie Group LLC Gene Carlson Michigan
Van Eaton & Romero David D. Kellenberger
No Specific Market
Visser Shidlofsky Eric J.W. Visser Austin

��Investment TrendsQuarterly
Copyright© 2007 by Real Estate Research Corporation (RERC) and the CCIM Institute.
Scope&MethodologyThe analysis provided in the RERC/CCIM Investment Trends Quarterly is conducted by Real Estate Research Corporation (RERC). The information is gathered in raw form from surveys sent to CCIM designees and candidates, and from sales transactions collected from various sources, including CCIM members, Catylist Inc., various key commercial information exchange organizations (CIEs), the media, assessors’ offices, RERC contacts in the marketplace, and other reliable public and private resources. All sales transactions are aggregated, analyzed, and reported on by RERC. Additional data and forecasts are provided courtesy of the REALTORS® Commercial Alliance and Torto Wheaton Research.
Published quarterly, the RERC/CCIM Investment Trends Quarterly report provides timely insight into transaction volume, pricing, and capitalization rates for the core income-producing properties.
RERC Definitions
Capitalization Rate: The capitalization rate is usually defined as the first year “stabilized” net operating income (NOI) (NOI is before capital expenditures—tenant improvements, leasing commissions, reserves—and debt service) divided by the present value (or purchase price).
RERC Capitalization Rate and Ranges: Capitalization rates and ranges listed throughout this report are based on RERC’s proprietary realized capitalization rate model, which includes available transaction-based capitalization rates, survey responses, NCREIF Index Returns, and other market factors, but is heavily weighted toward transaction-based capitalization rates for each property type within each market.
National/Regional Market Analysis: RERC ranks the investment potential of the metros and property types it covers based on various space market and financial market criteria, including pricing, capitalization rates, vacancy rates, and other factors.
Investment Conditions Rating: A rating of 1 through 10 (with 10 being high) reflecting survey respondents’ collective views of the investment environment for a particular property type in comparison with other property types. The rating may take into account supply and demand, economic conditions, pricing, rental rates, or other factors.
NCREIF Definitions
NCREIF: The National Council of Real Estate Investment Fiduciaries (NCREIF) is a independent organization dedicated to the compilation, validation, and distri-bution of performance data for the institutional real estate investment community.
Total Return: The total return includes appreciation (or depreciation), realized capital gain (or loss), and income. It is computed by adding the income and capital appreciation return on a quarterly basis.
Implied Cap Rate (Income Return): The implied capitalization rate measures the portion of return attributable to each property’s NOI. It is computed by dividing the total NOI by the total quarterly investment.
Capital Appreciation Return: The capital appreciation return measures the change in market value adjusted for any capital improvements/expenditures and partial sales divided by the average quarterly investment.
Annual and Annualized Returns: Annual returns are computed by chain linking quarterly rates of return to produce time-weighted rates of return for the annual and annualized periods under study. For time periods beyond 1 year, the annualized returns are expressed as the annual compounded rate of return.
Allocation: The distribution, expressed as a percentage of the overall investment, in a particular geographic area by property type.
For a detailed description of the proceeding returns as well as the calculations used by NCREIF to derive these figures, please visit http://www.ncreif.org/indices.
The combined returns are the weighted average of the returns for each property type according to the proportionate market value of properties surveyed relative to the total market values surveyed during a time period.
RERC Defined Regions and MSAs
West: Alaska, Arizona, California, Colorado, Hawaii, Idaho, Montana, Nevada, New Mexico, Oregon, Utah, Washington, Wyoming
Midwest: Illinois, Indiana, Iowa, Kansas, Michigan, Minnesota, Missouri, Nebraska, North Dakota, Ohio, South Dakota, Wisconsin
South: Alabama, Arkansas, Florida, Georgia, Louisiana, Mississippi, Oklahoma, Tennessee, Texas
East: Connecticut, Delaware, Kentucky, Maine, Maryland, Massachusetts, New Hampshire, New Jersey, New York, North Carolina, Pennsylvania, Rhode Island, South Carolina, Vermont, Virginia, Washington D.C., West Virginia
Metropolitan Statistical Area (MSA): A geographic unit comprised of one or more counties around a central city or urbanized area with 50,000 or more population. Contiguous counties are included if they have close social and economic links with the area’s population nucleus.
With a few exceptions, the MSAs within this report coincide with the U.S. Office of Management and Budget’s December 2005 definitions for each MSA. For ex-ample, St. Paul, Minn., and Bloomington, Minn., as well as many other suburbs, are included within the Minneapolis MSA.
Note of Caution: It is imperative to exercise caution when comparing the data contained herein to previous reports published by RERC. The data herein is not “fixed,” and will be updated and changed as additional transaction information is gathered and analyzed.
Disclaimer: This publication is designed to provide accurate information in regard to the subject matter covered. It is sold with the understanding that the publisher is not engaged in rendering legal or accounting service. The publisher advises that no statement in this issue is to be construed as a recommendation to make any real estate investment or to buy or sell and security or as investment advice. The examples contained in the publication are intended for use as background on the real estate industry as a whole, not as support for any particular real estate investment or security. Although the RERC/CCIM Investment Trends Quarterly uses only sources that it deems reliable and accurate, Real Estate Research Corporation (RERC) does not warrant the accuracy of the information contained herein.