Embed Size (px)
DESCRIPTION
Captstone Project Sports Economics 2011 Colorado State University
Citation preview

!!!!
The Economics of Stadium Sharing
!!!!!
Ian Brennan
!!
Dylan Leasure
!!!!
January 29th, 2012
!
! 1
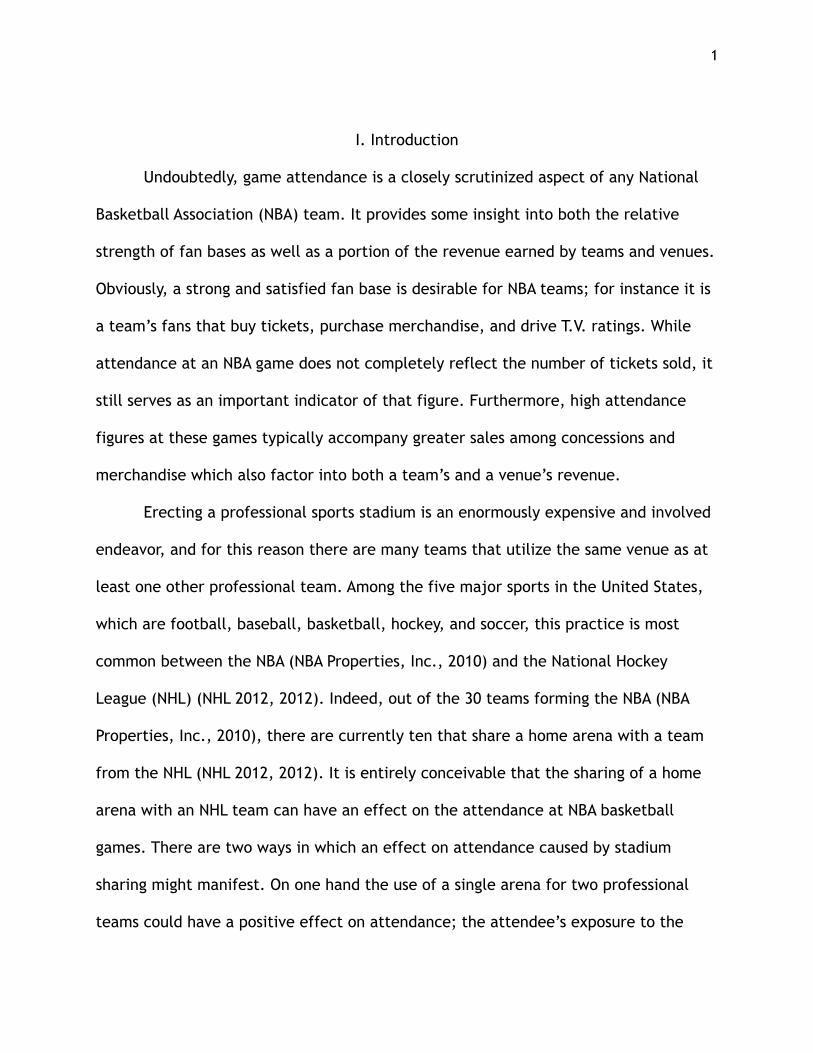
!I. Introduction
Undoubtedly, game attendance is a closely scrutinized aspect of any National
Basketball Association (NBA) team. It provides some insight into both the relative
strength of fan bases as well as a portion of the revenue earned by teams and venues.
Obviously, a strong and satisfied fan base is desirable for NBA teams; for instance it is
a team’s fans that buy tickets, purchase merchandise, and drive T.V. ratings. While
attendance at an NBA game does not completely reflect the number of tickets sold, it
still serves as an important indicator of that figure. Furthermore, high attendance
figures at these games typically accompany greater sales among concessions and
merchandise which also factor into both a team’s and a venue’s revenue.
Erecting a professional sports stadium is an enormously expensive and involved
endeavor, and for this reason there are many teams that utilize the same venue as at
least one other professional team. Among the five major sports in the United States,
which are football, baseball, basketball, hockey, and soccer, this practice is most
common between the NBA (NBA Properties, Inc., 2010) and the National Hockey
League (NHL) (NHL 2012, 2012). Indeed, out of the 30 teams forming the NBA (NBA
Properties, Inc., 2010), there are currently ten that share a home arena with a team
from the NHL (NHL 2012, 2012). It is entirely conceivable that the sharing of a home
arena with an NHL team can have an effect on the attendance at NBA basketball
games. There are two ways in which an effect on attendance caused by stadium
sharing might manifest. On one hand the use of a single arena for two professional
teams could have a positive effect on attendance; the attendee’s exposure to the

! 2
marketing for both teams instead of just the one could result in higher attendance
during both of their games. There is also the possibility that stadium sharing could
have a negative effect, due to a degraded aesthetic quality or profit loss when seats
aren’t filled at an NHL game but are needed in an NBA game. In order to examine this
issue further, we will draw upon economic analysis.
We are interested in using economic analysis to clearly establish whether or not
this arena sharing between NBA and NHL teams has any measurable effect, positive or
negative, on attendance at NBA games. Should any attendance differential exist
between those that share with the NHL and the rest of the teams in the league, we
are also interested in quantifying it. Our analysis will be conducted by comparing
attendance for the ten teams that share arenas with attendance for the 20 other
teams that do not. Attendance will be measured using data obtained from ESPN’s
online database for the 2008-2009 through 2010-2011 seasons (2012 ESPN Internet
Ventures, 2012), and we will be analyzing attendance as a percentage of capacity
rather than raw attendance figures. That is, attendance will be quantified as the
recorded number of people at a game divided by the total seating capacity of each
NBA arena. As venues vary in seating capacity, measuring attendance in this manner
lends a better means of comparison than figures for absolute attendance.
Additionally, in order to examine attendance in this way, we will account for the
different variables that drive it such as a team’s lagged winning percentage and
average ticket prices.
Since the results will show if there is any effect on the attendance whatsoever
when a stadium is shared as well as what that effect is, they can provide insight into

! 3
some of the benefits or drawbacks associated with building multipurpose sports
venues. Knowing this can tell us whether or not shared stadiums should be attractive
to developers and cities looking to build a new arena. Information about this is going
to become more pertinent in the very near future; the sports facility construction
cycle will begin again around the year 2020 (Siegfried, Zimbalist, 2000, p.1). This is
due to the thirty year average of the useful economic life of stadiums (Siegfried,
Zimbalist, 2000, p.1).
!II. Economic Model
Attendance at NBA basketball games can be modeled using simple supply and
demand analysis with attendance determinants making up the demand equation
(Garcia and Rodriguez, 2002). Additionally, NBA franchises are treated as monopolies
due to the fact that each one provides a unique product (Leeds and von Allmen,
2010). In this instance the demand for seats in an NBA arena is primarily predicated
on consumer income, population, prices of related goods, and consumer preferences,
which is consistent with economic theory (Leeds and von Allmen, 2010). Furthermore,
since ticket prices are predetermined for a season, consumer expectations regarding
prices do not factor into demand (Leadley and Zygmont, 2005)Obviously, fans of a
particular sports team gain a certain benefit from watching a live performance of that
team. Standard economic theory states that these consumers will demand seats at an
NBA game up until the point at which the marginal benefits they receive are equal to
the price of ticket for that game (Leeds and von Allmen, 2010). Moreover, as noted
above, NBA franchises hold market power due to offering a unique product, so they

! 4
are assumed to behave as monopolies. Notably, the marginal cost for each ticket
provided by the franchise is equal to zero up until when stadium capacity is reached,
and then marginal cost is treated as infinite, instead (Leeds and von Allmen, 2010).
This is important because it means the monopolist NBA franchise will set its ticket
price such that the quantity of tickets sold occurs where the firm’s marginal revenue
becomes equal to its marginal cost of zero (Leeds and von Allmen, 2010).
Alternatively, if stadium capacity is reached before this occurs, then the venue will be
sold out. Since it is assumed that NBA teams are profit-maximizing firms, they will
care more about charging a price that causes marginal revenue and marginal cost to
be equal rather than hosting a sellout crowd. Thus, between the behavior of the fans
and the franchises, equilibrium is established in the market for tickets for an NBA
game.
Figure 1 depicts this equilibrium in the
market for tickets for an NBA game. On the
vertical axis is the price of a ticket in dollars,
while the quantity of tickets is represented on
the horizontal axis. The demand for tickets
represents the marginal benefit to fans and
slopes downward due to the fact that as the
price of ticket increases, the quantity of
tickets demanded by fans falls (Leeds and von Allmen, 2010). Additionally, the line
labeled MC for marginal cost represents the quantity at which marginal cost becomes
infinite due to the fact that arena capacity has been reached. This particular graph

! 5
shows an example of the case in which a sellout will not occur because marginal
revenue and marginal cost become equal before venue capacity is reached.
Changes related to the different
determinants of demand will cause
the demand curve to shift. In other
words if say fans’ preferences change
in favor of attending more NBA
basketball games, then the demand
for tickets for an NBA game will
increase which will induce an outward
shift in the demand curve from D1 to D2. Consequently, the marginal revenue curve
also shifts from MR1 to MR2 because the home team will be able to charge a higher
price and thus, receive more revenue. As a result equilibrium moves from the point
(P1,Q1) to (P2,Q2). This is illustrated in Figure 2.
For this analysis any attendance related effect caused by arena sharing
between NBA and NHL franchises is treated as an aspect of consumer preferences,
which, as is shown above, is one of the determinants of demand. Assuming that this
venue sharing does indeed have an effect on the attendance at NBA games, there are
two ways in which this effect might appear,
and so they must both be considered. On
one hand it could result in an attendance
premium at NBA games. That is, the sharing
of arenas by two major sports could cause

! 6
attendance figures to be higher for those NBA teams that share a venue than it is for
those that do not. This positive effect on attendance would manifest in the form of an
outward shift of the demand curve. For instance an NBA arena that also houses an NHL
team exposes NHL fans to marketing for NBA games. Most marketing related to the
NBA is aimed at promoting the entire league as opposed to any one specific franchise
(Leeds and von Allmen, 2010). However, in this case the lack of marketing for a
specific team does not matter because there is the potential that fans of a completely
different sport (hockey) are being affected. Further, anything related to the NBA
franchise housed in a given arena can also be treated as marketing because fans
coming and going from NHL games are exposed to them. This extra dose of marketing
reminds these fans that they can also attend NBA games at the very same venue and
results in a rightward shift of the demand curve which can be seen in Figure 3.
There is also the possibility that there could be a negative effect on
attendance due to stadium sharing. Stadium sharing could draw a lot of attention to
the team with the highest win percentage. Winning percentage has a significant
effect on attendance; of course any consumer of professional sports is more likely to
attend the game of a winning team. (Coates and Humphreys, 2007) In a stadium
sharing scenario, winning percentage could display a negative effect on a team’s
attendance. With a shared stadium
substitution could play a role in the
attendance of the individual sports teams.
If one team has a higher win percentage we
could see it pull attendance from the sports

! 7
team it shares a stadium with. This could lead to very negative effects. If one team is
able to sell out and the other is struggling to cover costs due to lack of attendance we
will start to see some serious problems with stadium sharing’s economic feasibility.
These negative effects could cause a leftward shift in the demand curve for NBA
tickets shown in Figure 4. Focusing on the percent change the winning percentage of
both teams has on attendance is important to finding whether or not stadium sharing
has an effect on attendance.
!III. Literature Review
Coates and Humphreys (2007) aspired to link ticket prices with concessions and
attendance at professional sporting events. They did this by developing a monopoly
price determination model based on fan cost index, which encapsulates all
complementary good pricing at professional sporting events, ticket demand function,
and the capacity constraint of the stadium (Coates and Humphreys, 2007). The main
goal was to maximize revenue while taking the capacity constraint problem into
consideration.
The results of the data show monopolistic leagues that oddly price at an
inelastic point. The ticket price variable was found to be significant in the NBA and
MLB (Coates and Humphreys, 2007). The ticket price elasticity was also found to be
small, meaning it was inelastic (Coates and Humphreys, 2007). It was also found that
concession prices are placed at a more elastic point, having found the fan cost index
statistically significant and its elasticity is greater than that of the ticket price
variable. From this Coates and Humphreys (2007) found that concession pricing is

! 8
based on concessions’ profit maximization, and that attendance is not affected by this
pricing, except for in the NBA. The study also finds that in the NFL, because the
capacity constraints were binding due to the high number of games that were at
capacity or just below it, the tools that worked in estimating for the MLB and NBA
would not work for the NFL (Coates and Humphreys, 2007).
In our analysis of the effects of stadium sharing on attendance, this information
is especially pertinent. Finding that an inelastic ticket price is the most common in
the NBA gives us a more detailed view on attendance and how price affects it. Coates’
and Humphreys (2007) finding that the FCI is significant in the NBA’s attendance but
not in the MLB and NFL, is both very interesting and also obviously related to
examining attendance at NBA games. By getting a more detailed idea about
attendance, the inputs that need to be included in its accurate estimation and how
those inputs are related to changes in attendance as a percentage of capacity, the
model will give a better indication of the true effects of arena sharing on attendance.
Morse, Shapiro, McEvoy, and Rascher (2008) explored the possibility that roster
turnover may have an effect on demand in the NBA. They wanted to see if player
movement and loyalty really affected attendance. The model used was a demand
model, but it was found that a censored model worked best in order to add some
extra weight to sell-outs. Due to the fact that an OLS model assumes that there are
no constraints on the variables, the authors found that sell-outs do not carry as much
weight as they should because demand usually exceeds capacity (Morse, Shapiro,
McEvoy, and Rascher, 2008). They devised the censored model to correct for this and
show that sell-outs meant demand in excess of capacity.

! 9
They estimated multiple regression models all having attendance as the
dependent variable. The main focus was on the variables that had to do with roster
turnover. Roster turnover was explained with player turnover, the players who played
60% or more of the seasons’ games and did not return on the following year’s roster,
and salary turnover, the proportion of the team’s payroll that does not return the next
season (Morse, Shapiro, McEvoy, and Rascher, 2008). They included variables such as
previous attendance, current and previous season winning percentages, All-star
players, per-capita income, local major sports competition, and a few other
explanatory variables that were previously found to have statistical significance when
estimating attendance. They used previous season’s uncensored variables and seasons
that weren’t sold out to forecast demand above capacity in the censored regression.
This helps to show the real demand changes due to certain roster changes and gives
them true weight.
The results found that in the uncensored regression the significant independent
variables were previous attendance, current team win percentage, previous team win
percentage, and all-star players on the roster, neither player or salary turnover was
deemed statistically significant by this model (Morse, Shapiro, McEvoy, and Rascher,
2008). When the censored regression was run they still found that player and salary
turnover were not statistically significant but, population and local sport competition
were found to have statistical significance (Morse, Shapiro, McEvoy, and Rascher,
2008). Interestingly, per-capita income had no statistical significance, and neither did
ticket price (Morse, Shapiro, McEvoy, and Rascher, 2008). While it was found that
roster turnover had no significant effect on attendance, the findings of this study

! 10
conflict with the perspectives of many previous studies with regard to significant
variables that affect attendance.
This study is very interesting with respect to the study we are conducting now
because of its findings on local sports competition. Through running their regressions
they found that local sports competition was the only variable that had a noticeably
negative and significant effect on attendance (Morse, Shapiro, McEvoy, and Rascher,
2008). This is important to this study because we are trying to find the statistical
significance stadium sharing has on attendance. Stadium sharing is obviously local
sports competition; we could find that the negative effect is much greater when two
local professional sports teams play in such proximity.
Leadley and Zygmont (2005) examine the possibility of a honeymoon effect on
attendance at NBA basketball games from 1971-2000. In this particular case, the
honeymoon effect can be described as a new NBA arena experiencing high attendance
levels during the first several seasons following its completion but then encountering
a decline in attendance as it begins to age (Leadley and Zygmont, 2005). The model
they use to examine whether or not a honeymoon effect was present during the
1971-2000 seasons relies upon several standard assumptions. Leadley and Zygmont
(2005) assume that demand for seats at NBA games is a linear function of ticket price,
the marginal cost of a ticket is zero, and that demand is also determined by team and
city characteristics. Also of note is the fact that population and income variables,
which are known determinants of demand, were excluded due to collinearity with the
dummy variables estimated for each of the teams (Leadley and Zygmont, 2005).

! 11
Two models were estimated, one for attendance demand and one for ticket
price. Several lag variables such as a team’s previous year winning percentage were
included because ticket prices are determined prior to the beginning of the season
(Leadley and Zygmont, 2005). They estimated fixed-effects models using panel data
and employed a maximum-likelihood Tobit procedure in order to censor for arena
capacity (Leadley and Zygmont, 2005). This was done because roughly 15% of their
observations were of teams selling out for the entire season, and 12% of their
observations were for teams that averaged a 95% attendance rate (Leadley and
Zygmont, 2005). Failing to account for these facts would have caused bias among the
estimators, but the authors note that dummy variables can be used as a censoring
mechanism as well and with similar results (Leadley and Zygmont, 2005).
After estimating their model, Leadley and Zygmont (2005) found that there was
a honeymoon effect for NBA arenas during the 1971-2000 seasons which they estimate
to be between 15 and 20%. They note that this nonlinear effect begins to substantially
decrease after the first four years following the completion of an arena and
effectively disappears after ten years (Leadley and Zygmont, 2005).
While Leadley and Zygmont’s (2005) results do not directly pertain to our
hypothesis, they highlight some of the methods that must be used in order to
estimate a correct model. For instance the censoring of arena capacity will be
conducted using the dummy variable method, rather than the Tobit procedure, and
our model for attendance is similar to theirs. Furthermore, Leadley and Zygmont
(2005) note that there was a boom in the construction of new NBA arenas during the
1990s. As our dataset is comprised of data for the 2008-2009, 2009-2010, and

! 12
2010-2011 NBA seasons, we ignore the honeymoon effect in our analysis. There should
be enough of a time difference between our dataset and theirs for the implications of
this effect to be significantly reduced, that is, if the honeymoon effect is still even
present.
IV. Data and Methodology
Using data from ESPN for the 2008-2009 through the 2010-2011 NBA regular
seasons and release 1.9.7 of the Gretl software package, regression analysis will be
used to examine the effects of stadium sharing between NBA and NHL teams on
attendance at NBA games (2012 ESPN Internet Ventures, 2012). More specifically,
since this analysis will be conducted using panel data, an ordinary least squares
regression model has been specified below in its matrix notation:
APCT =Xβ + εit
An ordinary least squares model has been specified in this case because we assume
that the heterogeneity inherent to each NBA team does vary over time. The
dependent variable APCT represents the average overall home attendance as a
percentage of arena capacity was collected from ESPN (2012). There were a couple of
years for which no percentages were available, so values were manually calculated by
dividing the average home attendance figure for each team by the capacity of its
arena (2012 ESPN Internet Ventures, 2012). The matrix X contains the continuous
variables excess, and price, as well as the dummy variable teams for each team,
times, a dummy variable to explain which year the data is from, and shared,
explaining whether or not the stadium is shared by multiple professional teams.

! 13
Additionally, the standard OLS well-behaved error term is represented in the model by
the term εit.
A dummy variable is used to represent whether or not an arena is shared by the
NBA team and an NHL team. It is denoted as shared and takes a value of one if the
home arena of a team is shared and a value of zero if it is not. The data for whether
or not an arena is shared was compiled by cross referencing the NBA handbook (NBA
Properties, Inc., 2010) and the NHL’s official website (NHL 2012, 2012). Of note is that
there are 11 NBA teams that share but only 10 arenas that are shared with the NHL.
This is because the Clippers, Lakers, and the Kings (NHL) all share the Staples Center.
However, this is not an issue because the Staples Center is listed as having different
capacities for the Clippers and Lakers which allows them to be treated as different,
despite sharing an arena (NBA Properties, Inc., 2010). Some of the variables typically
associated with demand such as income, population, and unemployment have not
been included. Leadley and Zygmont note that the inclusion of these variables and
the team dummy variables can lead to multicollinearity issues (2005).
As ticket price is an important factor to examine when analyzing attendance,
the average general admission ticket price has been included for each team in each
year and is denoted by the variable priceit. Obviously, these are subject to inflation
over time, so the values have been deflated to 2008 dollars using the average annual
consumer price index (Bureau of Labor Statistics, 2012). Pricing information was
obtained from Forbes.com (2011) and Team Marketing Report (2012). Another
important factor related to attendance at NBA games is a team’s winning percentage.
Since fans’ expectations for a team’s performance is in part determined by that

! 14
team’s performance in the previous season, we lagged win percentage by one year.
This is represented by the variable winpctit-1 where the subscript t-1 represents the
one year lag applied to this variable. Team winning percentages were taken from
ESPN (2012 ESPN Internet Ventures, 2012).
In some years the average attendance as a percentage of capacity for several
teams was in excess of one hundred percent. For this reason the final variable
included in our model is a dummy denoted as excessit that serves as an indicator of
when a team’s average attendance as a percentage of capacity is above one hundred
percent. Leadley and Zygmont explain that some method of accounting for values
greater than one hundred percent should be included because failing to do so results
in biased estimation (2005). The inclusion of a dummy variable is done in lieu of using
the Tobit procedure since Leadley and Zygmont note that this method serves as an
adequate alternative (2005).
Summary statistics are included in Table 1. There are 90 observations 30 teams
with 3 years of collected data each. The data summary is fairly ordinary, we see that
Attendance as percent of capacity has a fairly high mean at 90%. This tells us that
most of our teams are on average filling 90% of their seats during the regular season.
As discussed before, we see that the maximum for our APCT variable is above 100% to
account for those teams that have sell-out games. Win percentage is an interesting
variable to investigate as well, using all the teams in the NBA we find that on average
50% of the games are won, this might seem odd but every game played always has a
loser therefore, it would show that our data were incorrect if the average was

! 15
anything but 50%. The shared variable average is intriguing because it tells us that
around 36% of the stadiums in the NBA are shared.
Figure 5 depicts a histogram of the average attendance as a percentage of
capacity for the 30 teams in the NBA. It was created using release 2.13.0 of the R
statistical package. We see in figure one that our data is skewed leftward. This
means that more teams operate at a higher attendance as a percentage of capacity.
The data does not seem to have a normal distribution; we see an odd dip between 85
and 95 percent, a spike between 95 and 100 and then a massive drop for over 100
percent. The drop after 100 is easily explained by the fact that most teams do not
have a sell out season. The gap between the lower attendance percentages and high
ones is difficult to explain at this point but is an interesting pattern in the data, and
may be of significance later in the study.
V. Estimation and Results
After testing the ordinary least squares model we specified in the previous
section, we found that our overall model is significant at traditional levels of
significance. Full results of the regression analysis can be found below in Table 2 and
Table 3. Since we used an ordinary least squares model, an F test was used to check
model significance. As Table 3 shows, the p-value associated with this test implies
statistical significance at all traditional levels. The results of this test suggest that the
model has a certain degree of explanatory power because at least one of the
coefficients associated with an explanatory variable has been found to be significant.
Additionally, the R2 value of 0.918426 indicates that 91.8426 percent of the variation

! 16
in the average attendance as a percentage of capacity can be explained by our
ordinary least squares regression model.
The winning percentage of a team in the previous year was found to be
statistically significant at the .1 significance level but not the .05 or .01 levels of
significance. This is reflected in the relatively low p-value of 0.0866. Holding all other
factors constant, a one percentage point increase in the winning percentage of a
team in the previous year is associated with a 12.2309 percentage point increase in
the average attendance as a percentage of capacity in the current year. This is
consistent with the results obtained by Leadley and Zygmont (2005). Additionally, the
average price of a ticket was found to be insignificant at all traditional levels of
significance with a p-value of 0.4391. The fact that ticket price is not significant at all
traditional significance levels is unexpected as theory indicates that there is a
negative relationship between price and quantity (attendance) (Leeds and von
Allmen, 2010). Indeed, we still regard price as an important aspect of our model due
to the stance of the prevailing literature; ceteris paribus, a one dollar increase to the
average price of a ticket is associated with a -0.0542901 percentage point decrease to
the average attendance as a percentage of capacity.
Of the two attendance related dummy variables included in our model, both
the excess variable and the shared variable were found to be significant at all
traditionally used levels. That is, the shared variable was found to be significant with
a p-value of 0.0043. Given our hypothesis that stadium sharing between NBA and NHL
teams could have an effect on attendance as a percentage of capacity at NBA games,

! 17
this result is not surprising. A stadium that is shared between NBA and NHL teams has
on average a 2.62184 percentage point higher attendance as a percentage of capacity
than an arena that is not shared, ceteris paribus. As mentioned in the previous
section, the excess variable has been included as a censor for teams that had average
attendance levels of 95% of greater in order to prevent biased coefficients (Leadley
and Zygmont, 2005). The excess variable is significant, meaning that for an arena
whose average attendance as a percentage of capacity was above 95%, the average
attendance as a percentage of capacity was 5.44279 percentage points higher than it
was for an arena whose average was less than 95%, holding all other factors constant.
Time dummies were included in order to account for unobserved heterogeneity, but
these were found to be insignificant when using an F test. The beta values estimated
by the regression model had p-values of 0.3056 and 0.8656 for the years t-1 and t-2,
respectively.
Most of the team dummies were found to be significant at all traditional levels.
Only the dummies for the Sacramento Kings and for the Minnesota Timberwolves were
found to not be significant at traditional levels. Furthermore, the variable for the
Milwaukee Bucks was found to be significant at the .1 level but not the .05 or .01
levels of significance. These results are not surprising because previous studies have
found that team dummies capture many of the factors associated with demand for
tickets for NBA games. For instance Leadley and Zygmont found that these dummies
capture much of the variation associated with demand determinants such as income
and population levels (2005).

! 18
We also specified a model utilizing the logs of average attendance as a
percentage of capacity, ticket price, and the previous season’s winning percentage as
an alternative means for examining whether or not arena sharing has an effect on
average attendance as a percentage of capacity. Full results of this log-log model
specification can be found below in Table 4, while results from the F test can be
found in Table 5. The results of this model suggest that it is worse fit than our original
model with regard to the individual significance of several of the explanatory
variables. That is, the extremely small p-value associated with the overall F test
signifies model significance at all traditional levels, but several important explanatory
variables are now insignificant. The team dummy variables are largely unchanged
other than with regard to the coefficient values. Mystifyingly, the logprice variable is
now insignificant at the .1, .05, and .01 levels, and the logwinpctatt-1 is also now
insignificant. The shared variable is still significant in this specification and has a p-
value of 0.0179 in this instance. Moreover, the time dummies are still not significant
according to the results of the regression model.
Figure 2 can be found below, and it depicts the predicted attendance for
shared and non-shared arenas. This provides a visual display of the attendance
premium associated with arena sharing between NBA and NHL teams. While the
predicted values for shared arenas have a range that begins at a lower attendance
level than those of the non-shared venues, these values are also most heavily
concentrated above 95% of capacity. In comparison the fitted values for the non-
shared arenas are more evenly spread out between about 75% and 100% of arena

! 19
capacity. Also, there are more shared arenas with attendance levels above 100% of
capacity than there are non-shared arenas with attendance levels above this amount.
VI. Conclusion
In conducting this analysis, our intent was to determine whether or not the
sharing of a home venue by NBA and NHL teams has any effect, whether positive or
negative, on the attendance as a percentage of capacity at NBA games. We used an
OLS regression model with time and unit dummies in order to test our hypothesis that
arena sharing does have some sort of an effect on attendance. According to the
results of our regression analysis, there was an attendance premium associated with
arena sharing between NBA and NHL teams for the 2008-2009 through 2010-2011
seasons. That is this sharing of a home arena was associated with a positive effect on
attendance as a percentage of capacity at NBA games during this time frame, ceteris
paribus. This attendance premium was likely due to the fact that venue sharing
between teams belonging to these two leagues exposed fans attending an NHL game
to marketing for both the NBA as a whole and for the specific NBA team housed by
that arena. Additionally, for these seasons we found positive linear relationships
between the lagged winning percentage of a team and the average price of a general
admission ticket. The first of these results is consistent with the findings of Leadley
and Zygmont (2005), while the second falls in line with the prevailing literature
(Leads and von Allmen, 2010).
For future research studies, we would like to examine data for other NBA
seasons in order to determine whether or not our findings about the effect of stadium

! 20
sharing on attendance hold for those other seasons. Furthermore, we would also like
to examine whether this attendance premium associated with arena sharing is also
present for attendance at NHL games.
Table 1: Summary Statistics
Figure 5: Histogram of APCT
!
!!
Variable Mean Minimum Maximum Number of
Observations
APCT 90.33444444 69.1 104.7 90
winpctt-1 0.500030894 0.146341463 0.804878049 90
price 50.59777778 22.89 113.4 90
shared 0.366666667 0 1 90
excess 0.1 0 1 90

! 21
!!Figure 6: Predicted Attendance for Shared and Non-Shared Arenas
!
!Table 2: Coefficients for an Ordinary Least Squares Model with Robust Standard
Errors
Dependent Variable: Average Attendance as a Percentage of Arena Capacity 2008-2010
n = 90
Variable Coefficient Standard Error P-value
Intercept 76.5244 3.20878 1.11e-030
shared 2.62184 0.879058 0.0043
excess 5.44279 1.23552 4.93e-05
winpctatt-1 12.2309 7.00895 0.0866

! 22
price -0.0542901 0.0696547 0.4391
dt-1 1.26187 1.22033 0.3056
dt-2 -0.388141 1.11619 0.7289
Bucks -0.150552 0.885113 0.8656
Bulls 16.7563 1.84534 1.57e-012
Cavaliers 15.8848 1.77816 2.70e-012
Celtics 14.4876 2.49797 3.38e-07
Clippers 7.71639 1.53132 5.39e-06
Grizzlies -4.28814 0.734502 2.93e-07
Hawks 5.45483 0.682280 8.89e-011
Heat 14.0920 2.18021 2.84e-08
Hornets 8.78995 0.884439 6.96e-014
Jazz 16.1138 1.13645 5.15e-020
Kings -1.33499 2.40625 0.5813
Lakers 16.9733 4.29947 0.0002
Magic 15.3948 1.49127 1.76e-014
Mavericks 14.7240 1.97332 6.61e-010
Nets -5.68568 1.04780 1.33e-06
Nuggets 5.92670 1.74614 0.0013
NYKnicks 19.4771 3.31703 2.59e-07
Pacers -3.07141 0.647665 1.54e-05
Pistons 5.83664 0.916594 4.07e-08
Raptors 7.60864 1.40434 1.37e-06
Rockets 11.0796 1.29102 9.92e-012
SeventySixers -8.49474 0.546460 8.83e-022
Spurs 15.7361 1.53461 2.25e-014
Suns 16.1895 2.36670 6.88e-09
Thunder 19.7767 1.44146 2.13e-019

! 23
!Table 3: F Test for an Ordinary Least Squares Model with Robust Standard Errors
!!
!!!
Table 4: Coefficients for a Log-Log Model with Robust Standard Errors
Dependent Variable: Log(Average Attendance as a Percentage of Capacity) 2008-2010
n = 90
Timberwolves -0.700140 1.67783 0.6781
Trailblazers 15.8164 1.66144 3.16e-013
Warriors 14.6722 0.579165 5.27e-032
F Statistic 18.21276
P-Value 1.05e-19
R2 0.918426
Adjusted R2 0.867998
Variable Coefficient Standard Error P-value
Intercept 4.58034 0.156478 3.20e-035

! 24
!!!
!!
References
2012 ESPN Internet Ventures. (2012). NBA Attendance Report-2011. Retrieved from
http://espn.go.com/nba/attendance/_/year/2011
Bureau of Labor Statistics. (2012). Cpi inflation calculator. Retrieved from
http://www.bls.gov/data/inflation_calculator.htm
Coates, D., & Humphreys, B. (2007). Ticket Prices, Concessions, and Attendance at
Professional
Sporting Events. International Journal of Sport Finance. 2(3), 161-170.
shared 0.0320740 0.0131408 0.0179
excess 0.0598856 0.0145711 0.0001
l_winpctatt-1 0.0374958 0.0346991 0.2846
logprice -0.0483329 0.0426786 0.2623
dt-1 0.0164793 0.0153121 0.2865
dt-2 -9.63640e-05 0.0107499 0.9929
Bucks 0.0343316 0.0181658 0.0640
Bulls 0.200067 0.0241263 2.92e-011
Cavaliers 0.210047 0.0225913 7.09e-013
Celtics 0.195024 0.0285762 7.31e-09
Clippers 0.0963752 0.0220949 5.71e-05

! 25
Forbes.com. (2011, Jan 26). Nba team valuations. Retrieved from
http://www.forbes.com/lists/2010/32/basketball-valuations-11_New-
York- Knicks_328815.html
Garcia, J., & Rodriguez, P. (2002). The determinants of football match attendance
revisited: empirical evidence from the spanish football league. Journal of
Sports
Economics, 3(18), 18-38.
Leadley, J. C., & Zygmont, Z. X. (2005). When is the honeymoon over? National
basketball association attendance 1971-2000. Journal of Sports Economics,
6(203), 203-221.
Leeds, M., & von Allmen, P. (2010). The economics of sports. (4th ed.). Boston, MA:
Pearson Education, Inc.
Morse, A. L., Shapiro, S. L., McEvoy, C. D., & Rascher, D. A. (2008). The effects of
roster turnover on demand in the national basketball association.
International Journal of Sports Finance, 3(1), 8-18.
!NBA Properties Inc. (2010). NBA directories. In J. Gardella, M. Broussard, T. Kuck, R.
Reheuser, J. Shapiro & P. Steber (Eds.), Official NBA Guide 2010-2011 Edition
(pp. 8
37). Retrieved from
http://i.cdn.turner.com/nba/nba/.element/pdf/2.0/global/footer/
201011/2010-11-NBA
GUIDE.pdf
Siegfried, John, & Zimbalist, Andrew. (2000) The Economics of Sports Facilities and
Their

! 26
Communities. Journal of Economic Perspectives, 14(3), 95-114.
Team Marketing Report. (2010, Nov). team marketing research. Retrieved from
https://www.teammarketing.com/public/files/2010_NBA_FCI.pdf
!!