Embed Size (px)
Citation preview

21
Advanced Concepts of Strength & Conditioning
Sport Analysisfor Program
Development
NCSF
CertifiedStrengthCoach
Chapter
2
IntroductionDevelopment of an effective strength and conditioning program aimed at promot-
ing specific adaptations is based on the defined need(s) of a particular sport. This is
accomplished by analyzing the actions and supportive physio-metabolic factors that
account for optimal performance, often labeled a motion analysis. The major goal
in using motion analysis is to obtain an objective understanding of the crucial factors
that contribute to success in a given sport. An athlete’s performance can then be com-
pared to elite levels within the sport to identify deficits as well as elements that con-
tribute to success by position. Individual sports typically provide a straightforward
analysis of fundamental variables that characterize the sport; team and ball sports on
the other hand have a wider range of interrelated, critical variables that dictate success
in competition. It is important to recognize what needs to be analyzed during the de-
velopment of a training program, as well as the objective meaning of the data as it relates
to performance. The total distance covered during a basketball game for instance is
not very important, whereas the total distance covered at high (versus low) intensity is
very relevant. Depending on the method of analysis (i.e., notation, video, and/or
computerized), physical, technical, tactical, and behavioral aspects can be assessed to create the
training foundations for player development.
Physical variables such as the type of movement, distance covered, intensity, frequency,
changes in direction and work-recovery ratio all provide a reference of the athlete’s overall
physiological demands. Due to these variables and the nature of competitive events, a physical
analysis is much more easily quantified for individual sports than team sports. When the average
physiological values provide insufficient data to identify key differentiating elements within the
sport, it is better to rely on the analysis of physiological and motion characteristics during high-
intensity actions. There are two reasons to direct focus on the high intensity aspects of the game
or sport: 1) the majority of game outcomes are dependent on actions that occur at the highest
intensities or with the most effort; and 2) it is the high velocity/intensity actions that most com-
monly dictate the capacity to perform at an elite level. Therefore, analysis of the high intensity
actions performed, and the means that drive success during those actions, are often the ones
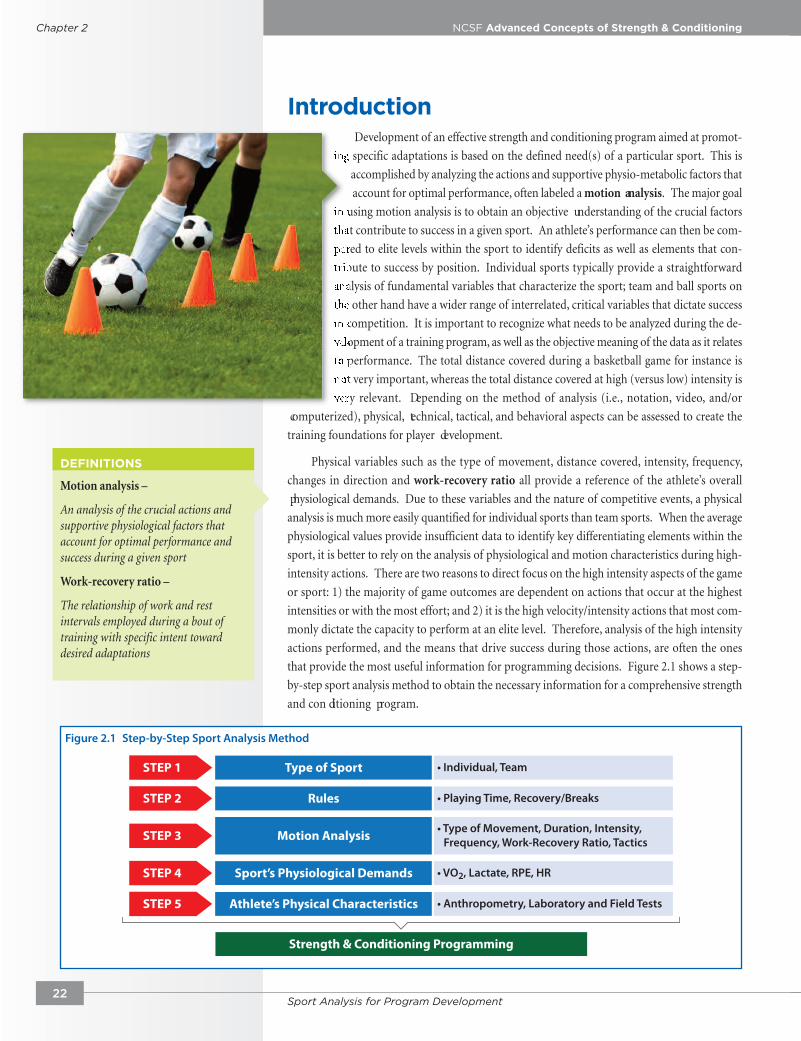
that provide the most useful information for programming decisions. Figure 2.1 shows a step-
by-step sport analysis method to obtain the necessary information for a comprehensive strength
and con ditioning program.
22
DEFINITIONS
Motion analysis –
An analysis of the crucial actions andsupportive physiological factors thataccount for optimal performance andsuccess during a given sport
Work-recovery ratio –
The relationship of work and restintervals employed during a bout oftraining with specific intent towarddesired adaptations
Chapter 2 NCSF Advanced Concepts of Strength & Conditioning
Sport Analysis for Program Development
STEP 1 Type of Sport • Individual, Team
STEP 2 Rules • Playing Time, Recovery/Breaks
STEP 3 Motion Analysis • Type of Movement, Duration, Intensity, Frequency, Work-Recovery Ratio, Tactics
STEP 4 Sport’s Physiological Demands • VO2, Lactate, RPE, HR
STEP 5 Athlete’s Physical Characteristics • Anthropometry, Laboratory and Field Tests
Strength & Conditioning Programming
Figure 2.1 Step-by-Step Sport Analysis Method

The collected information must be thoughtfully integrated in the training process to correct
for deficiencies identified on the field, court, ice rink, etc. It should also be used as a feedback
mechanism or analytical tool that properly evaluates the effectiveness of the training program as
it relates to athletic development. The data will direct the training program to focus on specific
outcomes (based on objective criteria) that serve a purpose in performance enhancement, whether
it be neural, metabolic, or musculoskeletal. If the data does not provide information for the pro-
gram constructs, the analysis is essentially a waste of time. The first step is to objectively analyze
the performance and interpret the findings. Analytical metrics will allow for comparisons be-
tween levels and can provide relevant data to identify the major obstacles to success. For instance,
if bat speed is a major difference between Division 1 and Division 3 athletes in baseball, it would
make sense to not only work on swing mechanics but also on explosiveness in the weight room.
Pertinent data can be used to plan and implement select training variables to improve the athlete
or team to a reasonable degree. Premeditated training can only provide so much benefit in a
quantified period of time, so the needs of the athlete or team must be prioritized and balanced
in an ongoing program. We will discuss periodization in later chapters as it relates to this con-
cept. Attempting to address everything at once is irrational; rather, focusing the training on key
deficiencies in a coordinated manner will lead to a higher degree of success. Of additional rele-
vance is the fact that human performance is the result of multiple factors acting together, which
supports taking an integrated approach.
Varying coaching styles used by head sport coaches add a level of complication to the devel-
opment of a needs analysis. Each coach will present a slightly (or significantly) different coaching
style and acknowledge performance variables to a greater or lesser extent based on his/her pref-
erences for success. Consider this concept with basketball: one coach may decide to emphasize
the high-intensity components of cutting, driving, and rebounding to challenge a team at one-
on-one interaction; whereas another may emphasize the team’s ability to run the court at the
highest controlled pace to challenge the opposition from a metabolic standpoint. Additionally,
variables that may play a primary role in performance may exist, but objectively quantifying them
is a challenge. These variables can include actions or skills such as the use of body movements
to “juke” an opponent or to tight rope the out-of-bounds marker during a reception in football.
These aspects can make the overall sport analysis more complicated. A football combine, for
instance, does not identify an athlete’s ability to be in the right position for a reception or to gen-
erate a head fake that can stop an opponent flat in their tracks. Although it is possible to quantify
most of the typical movements and physical characteristics of a given sport, it is inappropriate to
use obtained data to assume absolute prediction of performance. The attrac-
tiveness of sport is based on unpredictable or unquantifiable factors that do not
always follow the same patterns. This may sometimes explain why an under-
sized athlete, a slower athlete, or even a seemingly “un-athletic” individual
can succeed at specific tasks during competition with greater success than
someone who “fits the mold” of the sport on paper. Recall that analysts sug-
gested Doug Flutie would struggle in college and never succeed in the pros be-
cause he was too small; on the contrary, he led the Canadian league in passing
before moving to the NFL. There is always someone too small, too slow, or too
“something” that will complicate the evaluation process.
NCSF Advanced Concepts of Strength & Conditioning Chapter 2
Sport Analysis for Program Development
DEFINITIONS
Needs analysis –
The identification, organization, andprioritization of physiological needsapplicable to improving performance or health measures during sportparticipation or structured exercise
23
24
Chapter 2 NCSF Advanced Concepts of Strength & Conditioning
SoccerSoccer is the most popular sport in the world, although its allure in the United
States is significantly less than Europe and Central and South America. Histori-
cally, the knowledge of coaches and their perception of the game and players have
been used as the main tool for training decisions. However, the use of more
objective tools to analyze the game has become increasingly popular in the last
decade, partly due to improved accessibility to new technologies such as global
positioning system (GPS) devices that provide the data for a comprehensive break-
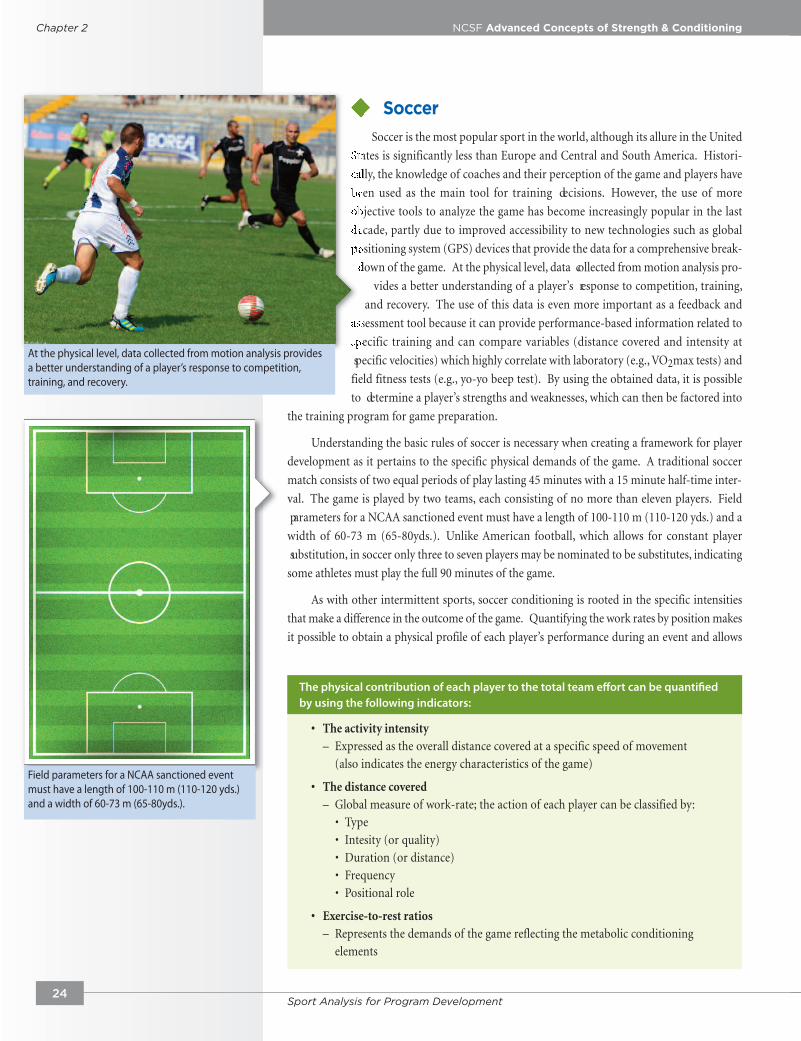
down of the game. At the physical level, data collected from motion analysis pro-
vides a better understanding of a player’s response to competition, training,
and recovery. The use of this data is even more important as a feedback and
assessment tool because it can provide performance-based information related to
specific training and can compare variables (distance covered and intensity at
specific velocities) which highly correlate with laboratory (e.g., VO2max tests) and
field fitness tests (e.g., yo-yo beep test). By using the obtained data, it is possible
to determine a player’s strengths and weaknesses, which can then be factored into
the training program for game preparation.
Understanding the basic rules of soccer is necessary when creating a framework for player
development as it pertains to the specific physical demands of the game. A traditional soccer
match consists of two equal periods of play lasting 45 minutes with a 15 minute half-time inter-
val. The game is played by two teams, each consisting of no more than eleven players. Field
parameters for a NCAA sanctioned event must have a length of 100-110 m (110-120 yds.) and a
width of 60-73 m (65-80yds.). Unlike American football, which allows for constant player
substitution, in soccer only three to seven players may be nominated to be substitutes, indicating
some athletes must play the full 90 minutes of the game.
As with other intermittent sports, soccer conditioning is rooted in the specific intensities
that make a difference in the outcome of the game. Quantifying the work rates by position makes
it possible to obtain a physical profile of each player’s performance during an event and allows
Sport Analysis for Program Development
At the physical level, data collected from motion analysis provides a better understanding of a player’s response to competition,training, and recovery.
The physical contribution of each player to the total team effort can be quantifiedby using the following indicators:
• The activity intensity– Expressed as the overall distance covered at a specific speed of movement
(also indicates the energy characteristics of the game)
• The distance covered– Global measure of work-rate; the action of each player can be classified by:
• Type
• Intesity (or quality)
• Duration (or distance)
• Frequency
• Positional role
• Exercise-to-rest ratios– Represents the demands of the game reflecting the metabolic conditioning
elements
Field parameters for a NCAA sanctioned eventmust have a length of 100-110 m (110-120 yds.)and a width of 60-73 m (65-80yds.).

25
NCSF Advanced Concepts of Strength & Conditioning Chapter 2
for comparisons to desired values. This data can then be used as a feedback tool for goal setting
in the training and conditioning program.
There are two methods used to quantify a player’s movement profile during a soccer game:
time spent performing the action (duration) or distance covered during the action. Each
approach provides relevant data for the analysis which can be later utilized in programming. The
physical profile of a player can be further validated by evaluating physiological variables such as
heart rate (HR), lactate accumulation, rate of perceived exertion (RPE), oxygen consumption,
and other blood markers during a competitive event.
The overall motion analysis of a soccer game indicates that players perform over 1,000
different movements while accelerating or decelerating. These movements include various types
of game skills such as headers or tackles as well as specific, multidirectional actions that change
based on varying game scenarios. Compared to linear movements, multidirectional movements
are more likely to induce fatigue due to the amount of tissue employed to maintain stability
during changes of direction. The dynamics of soccer require, on average, a change of activity
every six (6) seconds. When using total distance covered to analyze the game, most field players
cover around 9-14 km (an average of 11 km during a game), with the majority of the distance
covered at a relatively low intensity. Due to the tactics used by each team, the total distance
covered may vary, generally by about one kilometer between games. When total distance covered
or time spent during the game is broken down categorically according to speed thresholds, it is
easier to understand the true physical requirements of the game by volume, intensity, and work-
recovery ratios [1]. Table 2.1 provides an example of a general category threshold used within
several studies. The use of both distance covered (in meters) and time spent (in seconds) at each
category provides an opportunity to estimate the work-recovery ratios crucial for programming
metabolic-specific fitness. Figure 2.2 depicts analysis of the game using both methods for a better
understanding of the overall physical requirements of a standard 90-minute game. As a general
reference, of the average 10.6 km covered during a game, the percentage of distance covered
averaged 0.2% standing, 35.1% walking, 39.5% jogging, 16.1% running, 6.6% high speed running,
and 2.4% sprinting. The average percentage of time spent at each category reflects 5.7% standing,
58.8% walking, 26.3% jogging, 6.6% running, 2.1% high speed running, and 0.6% sprinting.
Sport Analysis for Program Development
Category Speed threshold
Standing 0-0.6 km/h
Walking 0.7-7.1 km/h
Jogging 7.2-14.3 km/h
Running 14.4-19.7 km/h
High-speed Running 19.8-25.1 km/h
Sprinting > 25.2 km/h
Mohr, M., Krustrup, P., & Bangsbo, J. (2003). Match performance
of high-standard soccer players with special reference to
development of fatigue. Journal of Sport Sciences, 21(7), 519-528.
Table 2.1 Movement speeds in soccer
DEFINITIONS
Rate of perceived exertion (RPE) –
Individual perception of exertionquantified by a scale numbered 6-20used to monitor subjective effort duringa bout of activity
Walking (0.7-7.1 km/h) 3809.0m Jogging (7.2-14.3 km/h) 4281.0m Running (14.4-19.7 km/h) 1745.0m HSR (19.8-25.1 km/h) 716.0m Sprinting (> 25.2 km/h) 264.0m Standing (0-0.6 km/h) 26.8m
Distance Covered Walking (0.7-7.1 km/h) 3305.0s Jogging (7.2-14.3 km/h) 1477.0s Running (14.4-19.7 km/h) 370.0s HSR (19.8-25.1 km/h) 116.0s Sprinting (> 25.2 km/h) 34.0s Standing (0-0.6 km/h) 321.0s
Time Spent in Each Category
Figure 2.2 Distance covered and time spent in each category during a soccer game
Adapted from Bradley, 2009.

26
Chapter 2 NCSF Advanced Concepts of Strength & Conditioning
Sport Analysis for Program Development
The average recovery time between maximal sprints ranges from 65-75 seconds; players statisti-
cally perform a high speed run every 30 seconds. From the previous data it is possible to estimate
a work- recovery ratio for high and low intensity activities. Based on distance covered, the ratio
between low- to high-intensity activities is 2.2:1; however, when using the time spent during each
activity, the ratio is about 7:1. Taken at face value, this ratio indicates that aerobic metabolism
predominates during a game, but of greater relevance is the fact that game outcomes are actually
based on anaerobic-driven actions [2]. Therefore, if the emphasis in training is based simply on
breaking down percentages, the player would be inappropriately trained for success.
Ball Possession
Despite the fact that the soccer ball is the most distinct element of the game, players run
most of the time without possession of the ball. This not only stresses the main role of condi-
tioning for performance (getting to the ball) but also indicates the limited possibilities of creating
and executing plays during the game. The monitoring of 20 Spanish Premier League matches
and 10 Champions League games showed that the total distance covered with the ball ranged
between 119–286 m, which corresponded to 1.2–2.4% of the total distance cov-
ered [3]. The distance and velocity covered with the ball during French League
play is illustrated in figure 2.3, showing mean and peak speed during runs
of 12.9 ±1.0 km/h and 24.9 ±2.4 km/h, respectively. Overall, players had
46.7 ±9.1 individual possessions per match with about 53.4 ±8.1 seconds in
possession of the ball with variations based on position. The mean distance
covered, time, and touches per possession was 4.2 ±0.7 meters, 1.1 ±0.1 seconds
and 2.0 ±0.2, respectively; with speed at ball reception at 10.3 ±0.9 km/h [4].
It should be clear that although the total distance covered during a soccer
match is an acceptable general reference, the best indication as to the condition
of the team is gained by observing the total distance covered at high intensities.
This has direct implications in soccer performance as it has been shown that
distances covered at high intensities is a distinguishing characteristic between
players at different performance levels. Elite players execute on average, 28%
more high-intensity running than their moderately-skilled counterparts [5]. As expected, the dis-
tance covered at a high-intensity pace is greater in the first half compared to the second half of
the game. Furthermore, breaking down the game every 15 minutes indicates that during the final
15 minutes of the game, outfield players (all players but the goalie) perform less high-intensity
running and sprinting compared to the rest of the game [5]. Interestingly, no difference has been
observed between a player’s conditioning level and the total distance covered with or without ball
possession during high-intensity running; all players covered on average, 1,135 m with ball pos-
session and 1,590 m without ball possession. In addition, when breaking down the game into
five-minute increments, the peak distance covered at high-intensity running was approximately
241 ±78 m, while in the following five-minute period, the amount of high-intensity running
dropped to 114 ±57 m, clarifying the metabolic impact [1].
Positional Role
The positional role on the field dictates the physical requirements of each player during a
soccer game. Player positions are commonly defined as goalkeeper (GK), central defender (CD),
external defenders (ED), central midfielders (CM), external midfielders (EM) and forwards (F).
Due to the difference in physical requirements on the field, goalkeepers are analyzed separately
0
20
40
60
80
100
120
Dribbling Speed (km/h)
0-11 km/h
11.1-14.0 km/h
14.1-19.0 km/h
> 19.1 km/h
Dis
tanc
e (m
)
Figure 2.3 Distance covered with ball possessionat different speeds
Adapted from Carling et al., 2010.

NCSF Advanced Concepts of Strength & Conditioning Chapter 2
from the rest of the team, all of whom are collectively referred to as
outfield players.
Although the average distance covered during the game is 11
km, differences exist by positional role in outfield players (Figure 2.4),
indicating that:
– CM and EM players cover a greater distance than defenders
(CD and ED) and forwards (F)
– CD covered shorter distances than that of any other group
– ED did not significantly differ from forwards
When the distance covered by position is analyzed by velocity of
movement, the data indicates that [3]:
– At low intensity (0–11 km/h), there are no significant differ-
ences between players of any position.
– CD cover a shorter distance compared to all other playing
positions at all work intensities greater than 11 km/h. At the
highest intensity (>23 km/h) there are no differences with
CM players.
– At 11.1–14 km/h, no differences are observed between ED and F. There is no significant
difference between ED and F in all other intensities.
– CM players cover the greatest distance at intensities between 11.1-19 km/h, while EM
cover the highest distance at intensities >19.1 km/h.
– At >23 km/h or sprinting, there are no differences between ED, EM and F, whereas CD
and CM covered a shorter distance.
Physiological Characteristics of Soccer
During the full duration of a game, elite soccer players perform a variety of movements
at different intensities in an intermittent fashion. Players will perform several high-intensity
activities interspersed with recovery periods of low-intensity movement (i.e., jogging, trotting,
or walking). Due to the amount of recovery the average intensity values are skewed, making use
of stress indicators such as HR fairly limited in predicting the true physiological intensity of the
game. The average HR during the game indicates that players perform at intensities close to
anaerobic threshold (i.e., 80-90% of HRmax) [7]. The average estimated oxygen consumption
during the game is about 70% of VO2max, although estimations are limited by the use of HR to
predict oxygen consumption and the interplay between anaerobic and aerobic metabolism. The
analysis of soccer activities also indicates that VO2 ranges from 2.5-4.5 L, which corresponds to
70-95% of VO2max (moderate- to high-intensity actions) [8,9,10]. The periods of high-intensity
activity during the game promote greater lactate accumulation, with values ranging from 4-6
mmol/L. No substantial differences have been observed between elite and non-professional
players in terms of relative intensity; however, absolute intensity remains highest amongst pro-
fessional players [11]. This clearly demonstrates the need for high levels of conditioning for success
in the sport. The sporadic nature of the game places the energy demands across all metabolic
systems. The numerous, brief, high-intensity actions draw on immediate and intermediate
sources for sufficient energy. This underscores the need for explosive and high-tension exercise
for the promotion of sport-specific metabolic efficiency. A common error is not recognizing
Sport Analysis for Program Development
9500m
10000m
10500m
11000m
11500m
12000m
12500m
Independentof Position
CentralDefender
(CD)
ExternalDefender
(ED)
CentralMidfield
(CM)
ExternalMidfield
(EM)
Forward(F)
Dist
ance
(m)
Figure 2.4 Distance covered by playing position
Adapted from Di Salvo et al 2007.
Average measured HRs during competitionindicate that players perform at intensitiesclose to anaerobic threshold.
27

28
Chapter 2 NCSF Advanced Concepts of Strength & Conditioning
soccer as an explosive sport warranting training similar to other sprint-based activities.
Glycogen represents the limiting energy substrate for soccer performance as post game
storage is reduced by 40-70% of pregame values. The rate of muscle glycogen utilization
and recovery dictates the appearance and delay of fatigue in soccer [12]. The physical
characteristics of competitive soccer players are summarized in Table 2.2.
SummarySoccer can be categorized as an intermittent sport due to the high-intensity actions
interspersed with the moderate-to-low intensity activities observed throughout the game.
This places high demands on the phosphagen and glycolytic systems, making glycogen
storage and recovery critical to performance. The game requires high intermittent
endurance capacity to perform skilled actions at maximum intensity in a repeated
manner over the full 90-minute event. This requires an emphasis on developing effi-
ciency in anaerobic byproduct buffering and underscores a need for high oxygen con-
sumption capacity, despite VO2 not being expressed in a uniform fashion during the
game. The ability to maintain sprint performance towards the end of the game is a
distinct factor between teams of different competition levels, suggesting that soccer-
specific speed training should be an integral part of the training program. Additionally, the
hundreds of varied types of actions performed during the game indicate the importance of agility,
quickness, and reaction time development in soccer-specific conditions. This supports the need
for simulated game play such as three-on-three training in the conditioning program of athletes.
Dynamic strength requirements place emphasis on Olympic and compound exercises as requisite
exercise selections for soccer players. Likewise, power actions will promote full expression of a
player’s skills; making plyometrics, ballistics, and resisted sprint training integral training
methods.
Goalkeepers (GK)
Key Actions:Vertical jumps, sliding, lateral leaps and slides in all vectors, short sprints and tackles
Goals:GK cover the shortest total distance in a game; however, they are involved in key burst ac-
tions that heavily influence the game outcome. This suggests a need for anaerobic power training
as a mainstay for position-specific athletic development. Dynamic strength training using
Olympic and compound exercises are preferred and should be used in combination with ballistic
GK drills for power improvements. Although it is generally believed that the functions of a GK
place little demand on aerobic capacity, it is crucial for promoting rapid phosphagen system re-
covery. Multidirectional anaerobic drills should be used for conditioning to promote the neces-
sary agility and dynamic reactions needed for this position; furthermore, position-specific drills
with applicable work-recovery ratios are recommended to stimulate improved efficiency of the
phosphagen system.
Central Defenders (CD)
Key Actions: Short sprints, tackles, headers, sliding, and opponent contact to maintain position
Goals: Although CD cover less total distance at any intensity compared to any other field player,
the intermittent demands of the game still require a high aerobic capacity, particularly to aid in
recovery from the short-duration, specific actions performed during the soccer match (i.e., tackles
and headers). Some of the distinctive anthropometric characteristics of CD are their height and
Sport Analysis for Program Development
Table 2.2 Physical characteristics of soccer players
Variable Range
Age (yr) 21.5 - 31.1
Height (cm) 175 - 187
Body mass (kg) 68 - 82.6
Body fat (%) 7.3 - 9.7
BMI (kg/m2) 21.4 - 24.4
VO2max (ml/kg/min) 56 - 65
Aerobic threshold (% VO2max) 80 - 85
CMJ height (cm) 46.1 - 62.7
5-10-5 (Pro agility) (s) 4.26 - 4.53
40-yd sprint (s) 4.55 - 4.91
Bench press 1RM (lbs) 143 - 209
Squat 1RM (lbs) 288 - 372
DEFINITIONS
Ballistics –
Velocity-based lifts that emphasizeconcentric acceleration with a goal being to notably surpass gravitationalrate; examples include heavy throws,box jumps, and the Olympic lifts

NCSF Advanced Concepts of Strength & Conditioning Chapter 2
leanness in combination with elevated quantities of lean mass compared to other players.
Dynamic strength exercises focusing on the lower extremities (including the hip adductor mus-
culature) are important for injury prevention. Power training via plyometric and ballistic activ-
ities that develop jumping ability is critical to the position. CD require a powerful trunk-leg
system for optimal performance when defending set pieces (i.e., corner kicks, free kicks) and
crosses. Additionally, backwards movements are important in this field position for tactical and
technical purposes.
External Defenders (ED)
Key Actions: Short and long sprinting, tackles, sliding, quick change of direction
Goals: ED cover more total distance than CD as well as greater distances at high velocities. The
position involves performing defensive plays as well as participation in attacking actions requiring
short- and long-distance sprints. Their involvement in the game includes a high number of
actions with possession of the ball. These demands make aerobic endurance, more specifically
intermittent aerobic endurance, an elevated requirement for this positional role. Sprint perform-
ance is requisite to tactical responsibilities as well, so anaerobic efficiency is a key element in
training. Dynamic strength work and power development using compound ballistic exercises,
resisted sprint exercises, and plyometrics are relevant training modalities which should be
integrated in the program.
Central Midfielders (CM)
Key Actions: Distance covered, physical challenge, ball checking, and quick turns with the ball
Goals: CM require the highest relative aerobic power among players as they cover the largest
distance during the game. Greater VO2 values demonstrated during analysis correlate with the
number of sprint efforts made per game. Clearly, the better the condition of a given CM, the
more sprint attempts will be made; which can have a significant impact on a game’s outcome,
particularly in the second half. This cross in energy systems indicates an emphasis on intermittent
endurance training using varied work-recovery ratios (from 1:1 to 1:10) for 5-60 second dura-
tions, interspersed with active recovery periods. Sprint training should cover distances from 5-
20 m, with a special focus on 5 m speed and multidirectional changes, as this positional role
requires the highest percentage of short (5 m) sprints compared to any other position. Further-
more, CM must have a strength level that allows them to challenge physical plays and offensive
players. This requires strength training using a total-body emphasis and training of sport-specific
functions. The demand to perform short explosive actions, coupled with the necessary ability to
perform quick turns with the ball for short and long passes in a repeated fashion indicates the
need for explosive, multidirectional training under soccer-specific environments.
External Midfielders (EM)
Key Actions: High-intensity intermittent runs, acceleration, quick change of direction with
the ball
Goals: The total distance covered by EM during the game, equaling approximately 12.0 km,
indicates the high aerobic power demands of this position. Overall, EM cover a greater total dis-
tance than CD, ED and F. Additionally, this positional role requires the greatest distance covered
while in possession of the ball. Due to the fact that EM are the critical link between defense and
offense, the ability to repeatedly perform short bouts of intermittent activity near aerobic capacity
Sport Analysis for Program Development29

30
Chapter 2 NCSF Advanced Concepts of Strength & Conditioning
Sport Analysis for Program Development
(with minimal recovery) is fundamental. Furthermore, EM must develop a high sprint capacity
as they routinely perform explosive sprints covering anywhere from 5-20 m. This warrants
power-based training. It cannot be emphasized enough that comprehensive (aerobic/anaerobic)
conditioning is crucial for this position.
Forwards (F)
Key Actions:Carry out attacking technical skills at a fast pace, sprinting, physical challenges, and
vertical jump
Goals: Consistent with other field players, F require a high aerobic power level to support the
demands placed on the phosphagen system during the performance of positional-specific sprint
actions. Next to EM, forwards cover the greatest sprinting distance; they also engage in the great-
est number of total sprints per game, including leading sprints. Soccer-specific sprinting drills
are required for this position as F receive and control the ball while moving and sprinting at sig-
nificant intervals during a game. The need to develop high anaerobic power output is evident,
as F must perform various explosive movements as well as engage in aggressive jumping actions;
on average, they perform one vertical jump every five to six minutes. Olympic weight lifting, bal-
listic vertical and horizontal work, and resisted sprint exercise used with complex or contrast sets
(the combination of one high strength exercise followed by a high power exercise of similar bio-
mechanical characteristics) are the preferred methods of training. These methods as well as many
others will be addressed in a later chapter.
TennisAnalysis of the physical requirements suggests tennis is a sport characterized
by the repeated performance of intermittent, multidirectional activities. Tennis
is generally composed of short-duration periods of work performed at near-
maximal to maximal intensity, with relatively longer-duration recovery periods
involving moderate- to low-intensity activity. There is a wide range of near-maxi-
mal intensity activities performed during a tennis match, such as sprinting in dif-
ferent directions, acceleration and deceleration over short distances, jumping, and
execution of powerful overhead movements. The multidirectional nature and stop-
and-go actions require the recruitment of varying muscle groups; the serving stroke
used and position/direction of acceleration indicate the specific demands that must
be considered in a performance enhancement program. The physical requirements
of tennis are also intimately related to the type of surface it is played on (soft clay or
hard courts), which explains the variability in play duration and total work among
matches. Additionally, the strategies and tactics used on the different court surfaces
will affect the physical requirements during a given match; players normally have a
surface preference that is based on their ability to express their potential. When
playing on other surfaces, players change their strategy to adapt their playing style
to the surface, which sometimes focuses on minimizing the player’s weaknesses
associated with the particular surface.
Other variables, such as the length of the match (i.e., three or five sets), the type of ball used,
and the level of competition can also affect the player’s physical requirements. For example, the
qualifying games for a spot in the main bracket of a tournament can sometimes be more physically
and mentally demanding than the first round of the tournament itself. As competition increases,
Tennis is generally composed of short-duration periods of workperformed at near-maximal to maximal intensity, with relativelylonger-duration recovery periods involving moderate- to low-intensity activity.

31
NCSF Advanced Concepts of Strength & Conditioning Chapter 2
often so does the effort necessary to win. Due to the nature of one-on-one
competition, match-ups and style can also add to intensity variations over tour-
nament play.
The specific demands of the game are heavily rooted in the performance-
related components of fitness. While tennis requires power, agility, reaction
time, and speed, it is important to recognize that an ideal combination of these
variables may not exist. Rather, there are general characteristics that exist
among elite tennis players (Figure 2.5). On a side note, because tennis is
unilaterally dominant, measures of fitness do not always identify inherent
limitations associated with bilateral imbalances or common agitators such as
upper-cross syndrome. While these issues play a role in all sports, the repeti-
tiveness of specific actions in tennis makes movement restriction and imbalance
significantly relevant. Evaluations should include acceleration/deceleration
strength relationships and skeletal efficiency through postural and functional assessments.
Match Activity
The International Tennis Federation (ITF) rules provide for a five (5) minute warm-up pe-
riod prior to each match. However, when the first service of the match is put in play, play should
be continuous until the match finishes. Between points, a maximum 20-second break is allowed.
When the players change sides at the end of a game, a maximum 90-second break is allowed. At
the end of each set, there is a set break of a maximum 120 seconds [ITF Rules]. In general, the
duration of a tennis match ranges anywhere from one to more than five hours; with playing time
ranging by 20-30% on clay courts and 10-15% on the faster surfaces. The work-to-rest ratio dur-
ing tennis play is about 1:1 to 1:4. These values are surmised from the average duration of work
being 5-10 seconds and the average duration of breaks being 10-20 seconds. Although it is hard
to quantify, there are typically 300-500 high-intensity efforts in a three-set tennis match (more
in longer matches). This suggests each rally, in which players cover approximately 8-12 m, may
last approximately 8-10 seconds. The breakdown of distance covered during each rally identifies
that tennis players make four (4) directional changes while running an average of 3 m per shot;
this includes the performance of 2.5-3 different strokes per rally [13,14]. Certainly generalizations
can be made, but all of these reference values are subject to change depending on the surface,
length of the match, gender, specific player characteristics, playing situation (serving vs. returning)
and tactics (attacking vs. defending). For example, the longest rallies are seen on clay, (e.g., French
Open), while more offensive attacks and consequently the shortest rallies are seen on grass (e.g.,
Wimbledon).
Table 2.3 Player movement patterns
Even though the intensity of match play can be estimated using standard indicators such as
maximal oxygen consumption, HR, lactate, and RPE; an analysis of the movement characteristics
of the game provides a better understanding of true competitive intensity and physiological
Sport Analysis for Program Development
Speed
Agility
Strength
Power
MuscularEndurance
Anaerobic
AerobicCapacity
AerobicPower
Aerobic
Balance
Flexibility
ReactionTime
Auxilary
Figure 2.5 General characteristics of elite tennis players
Adapted from Kovac M, 2007.
DEFINITIONS
Upper-cross syndrome –
A condition in which the musculo -skeletal system experiences a loss infunction due to imbalances in theconnective tissue that acts on theshoulder complex observed as anundesirable joint positional change
% of distance covered per stroke Distance (m) Characteristic
80% 2.5 m Within player-ready position
10% 2.5 - 4.5 m Sliding actions
10% + 4.5 m Cross-court sprints
Ferrauti A, Weber K, Wright P R. Endurance: Basic, Semi Specific and Specific. In: Reid M, Quinn A, Crespo M, eds. Strength and Conditioning for Tennis. London: ITF Ltd, 2003. 93–111.
32
Chapter 2 NCSF Advanced Concepts of Strength & Conditioning
demands. Average intensity values of about 60–70% of VO2max , 60-80% of maximal heart rate,
2-4 mmol/L of lactate, and a RPE value of 4 on a 1-10 scale (or a 13-14 on a 6-20 scale) have
been previously documented, but provide limited transference to strength and conditioning
programs [13,15,16,17].
Physiological Characteristics of Tennis
Similar to soccer, the intermittent aspects of tennis define the competitive outcome and pro-
vide knowledge of the sport’s demands. As expected, it is the ability to engage in high-intensity
actions during competition that predict success as well as provide the details for training to im-
prove tennis performance. Recent demonstrations show that examining RPE values after selected
games can be a useful technique to quantify on-court intensity. This is based on the fact that
RPE and blood lactate concentration values have been shown to be significantly correlated with
rally duration time and strokes per rally; with higher values present when the athlete is serving
the ball (RPE=13.5/20 and 12.2/20; La=4.4 and 3.0 following serving and receiving games
respectively) [13,18]. Another viable option to quantify the intensity and demands of the game is
the use of performance measurement under work/recovery conditions similar to those seen
during an actual tennis match. When replicating the work demands of a game using on-court
tennis drills, researchers observed differences in physiological measurements/indicators both
during and after the event. These values indicate the high-intensity demands of the game, with
observed lactate and RPE values during (La=2.1-4.4 mmol/L; RPE=2.6-5.1/10) and after (La=4.4-
10.6 mmol/L; RPE=4.3-7.6/10) performance, respectively [13,19]. Other variables, such as measured
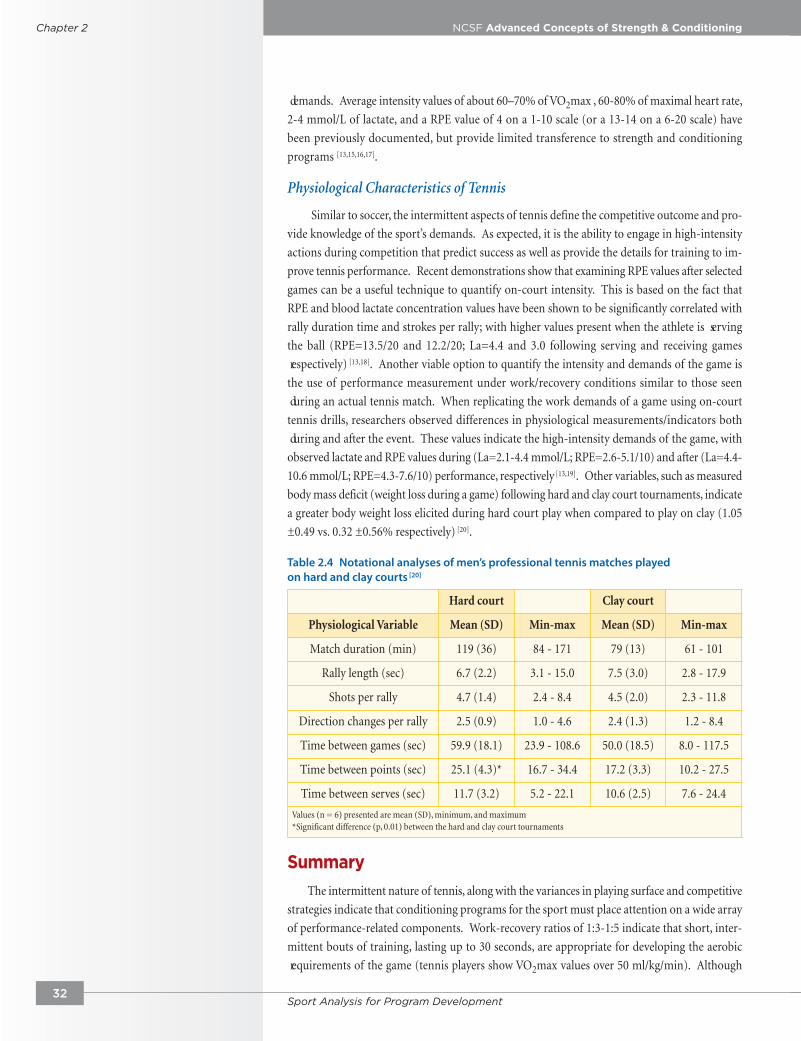
body mass deficit (weight loss during a game) following hard and clay court tournaments, indicate
a greater body weight loss elicited during hard court play when compared to play on clay (1.05
±0.49 vs. 0.32 ±0.56% respectively) [20].
Table 2.4 Notational analyses of men’s professional tennis matches playedon hard and clay courts [20]
SummaryThe intermittent nature of tennis, along with the variances in playing surface and competitive
strategies indicate that conditioning programs for the sport must place attention on a wide array
of performance-related components. Work-recovery ratios of 1:3-1:5 indicate that short, inter-
mittent bouts of training, lasting up to 30 seconds, are appropriate for developing the aerobic
requirements of the game (tennis players show VO2max values over 50 ml/kg/min). Although
Sport Analysis for Program Development
Hard court Clay court
Physiological Variable Mean (SD) Min-max Mean (SD) Min-max
Match duration (min) 119 (36) 84 - 171 79 (13) 61 - 101
Rally length (sec) 6.7 (2.2) 3.1 - 15.0 7.5 (3.0) 2.8 - 17.9
Shots per rally 4.7 (1.4) 2.4 - 8.4 4.5 (2.0) 2.3 - 11.8
Direction changes per rally 2.5 (0.9) 1.0 - 4.6 2.4 (1.3) 1.2 - 8.4
Time between games (sec) 59.9 (18.1) 23.9 - 108.6 50.0 (18.5) 8.0 - 117.5
Time between points (sec) 25.1 (4.3)* 16.7 - 34.4 17.2 (3.3) 10.2 - 27.5
Time between serves (sec) 11.7 (3.2) 5.2 - 22.1 10.6 (2.5) 7.6 - 24.4
Values (n = 6) presented are mean (SD), minimum, and maximum*Significant difference (p, 0.01) between the hard and clay court tournaments

NCSF Advanced Concepts of Strength & Conditioning Chapter 2
rallies last less than 10 seconds on average, games may last for more than five hours, which further
supports the need for a specific, high-intensity endurance capacity. The ability to perform
explosive strokes in combination with changes of direction place a central role on the development
of explosive power and repeat, short-distance sprint capacity. Movement wise, tennis is a classic
“chain sport,” meaning it relies heavily on efficient force coupling between motion segments and
provides repetitive demands of acceleration and deceleration. A chief goal of any performance
enhancement program should be the development of maximal and repetitive force development
while attempting to avoid gains in mass. This is relevant for multidirectional quickness as well
as sparing energy. High-velocity, multidirectional movements place a heavy drain on energy
stores compared to linear actions. Olympic weightlifting, multidirectional ballistic activities, and
resisted sprint exercises can all serve as means by which to obtain positive adaptations. Likewise,
the use of short, multidirectional agility and quickness drills are necessary to match the mobile
demands of the game; here it is important to incorporate the technical components (e.g., ap-
proaching and recovering steps, different strokes, etc.) of the game to obtain specific and trans-
ferable adaptations. The development of appropriate strength levels with an emphasis on muscle
balance is essential for both performance enhancement (i.e., ball velocity) and to reduce injuries
(i.e., protection of joints, ligaments, tendons). Stresses placed on the rotator cuff musculature
while performing explosive movements through extreme ranges of motion clearly indicate the
importance of adequate strength and flexibility training to prevent injuries. Coaches should en-
sure high levels of functionality in the shoulder and scapula to reduce restrictions and avoid an
impingement syndrome. The maintenance of a low percentage of body fat will also help tennis
players reduce their total relative workload and therefore extend anaerobic endurance capacity;
studies have shown values <12% for men and <23% for women are common of elite players [21,22].
Competition and Play on Hard Courts
Key Actions: Short explosive movements and attacking actions
Goals: The use of intermittent training focusing on short work-recovery ratios (recall that rallies
last up to 10 seconds) using varied action couples may be an effective methodology of training
to obtain the required level of aerobic power for optimal performance on this type of surface.
One of the goals should be to perform a relatively high volume of short, anaerobic-focused speed,
strength, and power activities as the duration of each rally (as well as playing times) are shorter
on hard surfaces. This is mostly due to the faster speed of the ball associated with reduced friction
upon ground contact. Tactics selected on this surface traditionally place high demands on
anaerobic systems as 58% of points won are at the net. Power training focusing on Olympic lifts,
multidirectional ballistics, short-distance agility drills, and resisted sprint exercises are requisite
training aspects. Additionally, function-based combinations of tennis-specific actions should be
incorporated to harmonize force couples and ensure strength balance across the collective chains.
To account for the physical drain of multidirectional velocity and change of direction, condition-
ing drills should include actions of varied length and height (e.g., center of mass changes) to
replicate the demands of match play. Likewise, the shoe-surface interface should be considered
for sticking versus sliding movements, a major contributing factor to injury on this type of
competitive surface.
Competition and Play on Clay Courts
Key Actions: Sliding, playing time, and defensive actions
Goals: The development of high-intensity, intermittent endurance capacity is necessary to match
Sport Analysis for Program Development
The duration of each rally as well asplaying times are shorter on hardsurfaces.
On clay courts, playing time is often 30% longer,based on the extended duration of each rally(~15 seconds).
33

Chapter 2 NCSF Advanced Concepts of Strength & Conditioning
DEFINITIONS
Frontal plane –
A vertical plane which passes throughthe midaxillary line, dividing the bodyinto ventral and dorsal sections
Sport Analysis for Program Development
the requirements of the elevated playing time common to this type of surface. Playing time is
often 30% longer, based on the extended duration of each rally (15 seconds). Therefore, work
periods during training should be extended to 10-30 seconds using tennis-specific drills, with
rest periods ranging from 30-60 seconds to emphasize intermittent endurance capacity. Although
the distance covered per rally is directly related to the playing strategy (i.e., attacking or defend-
ing), most of the points (~64%) are still won when playing at the net regardless of serving or
returning. This indicates that the development of power and speed are still crucial on these
surfaces. Again, the preferred methods include explosive drills, Olympic lifts, and resisted move-
ment exercises. Additionally, acceleration, deceleration and change of direction movements based
on sliding mechanics must be addressed; particularly the frontal plane musculature associated
with the hip and ankle. Furthermore, there is a higher muscular endurance requirement to match
the repetitive strokes and actions of the match. Crosslink exercises using unilateral, asymmetri-
cally-loaded movement patterns are relevant to aiding frequent directional changes. Improve-
ments in localized stability, as well as dynamic constancy (center of mass control) are paramount,
suggesting adjunct work on the vastus medialis, hip abductors and adductors, and obliques is
necessary for improved dynamic stabilization.
BasketballTo properly analyze the physiological demands of basketball, one must con-
sider the unique nature of the game and the specific environmental conditions
when compared with other team sports. Due to the fact that basketball is an
indoor sport, analysis of a player’s motions have been carried out using video
analysis and accelerometer technology, with limited use of GPS technology due
to the lack of satellite reception. While this limits the information available on
total distance covered during a game, it is of little consequence for properly
identifying relevant physiological demands. As with other team sports, the on-
court physical demands depend on a player’s position and size, but basketball is
fairly unique in that it requires all players on the court to play a fairly constant
and simultaneous role in both offense and defense.
Depending on the association that regulates the game of basketball, the rules
will vary. Total playing time, duration of each quarter, time between quarters and
halves, and the number and duration of time outs all differ significantly when
comparing leagues, be it the NBA, WNBA, NCAA or FIBA (Table 2.5). These rule
variations have implications not only at the tactical level, but also in the planning
of conditioning programs.
Analysis of actual playing time indicates that around 46% of the total time is
live play (approx 35 minutes ±1 minute), with a stoppage time close to 40 min-
utes. The motion analysis of basketball provides differing results depending on
the categorical emphasis of the analysis. Therefore, the typical actions in basket-
ball are grouped and evaluated using nine movement categories performed during
competition. These categories include: standing still, walking, jogging, running,
sprinting, jumping, and low-, moderate-, and high-intensity specific move-
ments[23]. The average total number of movements performed by players during a
game range from 950-1,100 [23], with a mean duration for all movements of less
than three (3) seconds and a change of action every two (2) seconds. The on-
34

35
NCSF Advanced Concepts of Strength & Conditioning Chapter 2
Sport Analysis for Program Development
Rule NBA WNBA FIBA NCAA
Playing Time 4 x 12 minute quarters;extra periods are 5 minutes
2 x 20 minute halves;extra periods are 5 minutes
4 x 10 minute quarters;extra periods are 5 minutes
2 x 20 minute halves;extra periods are 5 minutes
Time-Outs –Number AndDuration
• Six “full” time-outs perregulation time (withsome restrictions; somemandatory time-outsfor television are builtinto the 6); 3 time-outsper extra period
• Full time-outs are 60seconds, except the first2 time-outs in eachperiod and the extramandatory time-outs in2nd and 4th periods,which are 100 seconds
• Full time-outs do notaccumulate into over -time; one 20-secondtime-out per half,unused 20-second time-out in 2nd half may becarried into extraperiod
• One full time-out perhalf or extra period
• Four TV-type time-outsmust occur each half(none in extra period)
• Full time-outs are 120seconds in duration
• Full time-outs do notaccumulate into extraperiod
• One 20-second time-out in 1st half, two20-second time-outs in2nd half, one additional20-second time-out perextra period (one 20-second time-out cancarry over from 2ndhalf, for a maximum oftwo in extra period)
• Two time-outs in firsthalf, 3 in second half, 1per extra period
• All time-outs are 60seconds in duration
• Time-outs do notaccumulate
• Four 30-second time-outs and one 60-secondtime-out per game
• Maximum of three 30-second time-outs andone 60-second time-outmay be carried into 2ndhalf
• One additional 30-second time-out isadded per extra period(any time-outsremaining from 2ndhalf may be carried intoextra period)
• First 30-second time-out of 2nd half isextended to the lengthof a media time-out
• If coach requests 2consecutive 30-secondtime-outs, players maysit, so long as therequest is made whenthe first timeout isgranted; normally,players must remainstanding and on thefloor during a 30-second time-out
Field Goal inLast Minutes ofPlay (Stoppingthe GameClock)
Last minute of quarters1, 2 and 3; last 2 minutesof 4th quarter and anyextra period
Last minute of eachperiod
Last 2 minutes of 4thperiod and any extraperiod
Last minute of 2nd halfand any extra period
Shot Clock –Time AllowedTo Shoot
24 seconds 30 seconds 24 seconds -30 seconds (Men)
-30 seconds (Women)
Three-PointLine
7.24 m (23' 9") arc, which intersects withlines parallel to thesideline that are 6.7 m(22') from the basket attheir closest point
6.75 m (22' 1.75") arc 6.75 m (22' 1.75") arc 6.32 m (20' 9") arc
Table 2.5 Basketball game regulations based on governing league
Adapted from Reimer, A. (2005). *Current regulations at time of publishing.

36
Chapter 2 NCSF Advanced Concepts of Strength & Conditioning
court position also affects the number of actions performed during the game, as seen by the 1,103
(±32), 1,022 (±45), and 1,026 (±27) activities performed by guards, forwards, and centers,
respectively. Figure 2.6 shows the frequency of different activities performed during an average
game [23], as well as the total live time expended during each action. When analyzing the physical
demands of basketball by playing position, guards performed more total actions than forwards
and centers. A closer analysis of these actions demonstrates that guards sprint and perform more
high-intensity movements than other players. Figure 2.7 illustrates the breakdown of high-
intensity actions by position and quarter. Interestingly, there is a considerable decrease in the
time involved in intense activities in the last quarter, with centers showing an even more profound
decrease than guards and forwards. This provides a reference for the total volume, intensity, and
duration of basketball-specific actions. However, it is important to consider that the physiological
stress necessary to improve and achieve maximal performance will not necessarily match the
actual volume of actions performed during a game. The intensity provides a more direct reference
for applications in the training program.
Sport Analysis for Program Development
0 100 200 300 400 500 600 700
0 50 100 150 200 250 300 350
Sprint
High-specific movement
Jump
Total high intensity
Run
Medium-specific movement
Total moderate intensity
Jog
Low-specific movement
Total low intensity
Walk
Stand
Total recovery
Total Time per Action (Seconds)
Frequency (# of Actions)
Act
ivit
ies
Dur
ing
a B
aske
tbal
l Gam
e
Time Expended per Action
Frequency
Figure 2.6 Frequency and duration of activities during a basketball game
Adapted from Abdelkrim, 2007.
0
5
10
15
20
25
Q1 Q2 Q3 Q4 % o
f T
ime
at H
igh
Inte
nsit
y
Quarter
Time Performing High-Intensity Actions
Guard
Forward
Center
Figure 2.7 Breakdown of high-intensity actions by position and quarter
Adapted from Abdelkrim, 2007.

37
NCSF Advanced Concepts of Strength & Conditioning Chapter 2
Physiological Characteristics of Basketball
The physiological demands of a game expressed in terms of oxygen utilization identify that
during a practice game, players work at an intensity of ~65% of their VO2max; 66.7% (±7.5)
among men and 64.7% (±7.0) among women, respectively. A player’s VO2max value appears to
correlate well with VO2 during play (r=0.673) and the quantity of time expended engaging in
running and jumping actions (r=0.935 and 0.962 for females and males, respectively) [24]. The
mean HR for a given athlete during a basketball game can be as high as 91% of maximal HR,
while the mean plasma lactate concentration during the game was found to be ~5.5 mmol/L;
with even higher values seen during the first half of the game. Differences can also be observed
according to position; guards present with higher mean HR and plasma lactate concentrations
than centers. The performance environment (i.e., drills, scrimmage, or game) can clearly affect
the physiological responses of the player; for example, while there are no significant differences
in the HR and VO2 requirements between offensive and defensive drills, the physical load of
competitive games is far greater than that seen during scrimmage games [25]. This data provides
a reference for the metabolic pathways utilized during a basketball game and suggests that the
anaerobic pathways are more significant to energy production during a competitive event.
There are limited studies examining NBA athletes; European league studies are more
common. Table 2.6 shows some of the characteristics of elite Serbian players. Guards tend to be
older and more experienced than both forwards and centers, while centers have a higher percent-
age of body fat. Vertical jump height showed no significant differences between different
positional roles, while the estimated percentage of fast-twitch muscle fibers was similar among
all positions [26]. A negative correlation between weight and vertical jump and height and vertical
jump does seem to exist.
Sport Analysis for Program Development
Table 2.6 Characteristics of elite Serbian basketball players [26]
Variable Guard (n=20) Forwards (n=20) Centers (n=20) Total (n=60) Range
Age (y) 25.6 ±3.2 ‡§ 21.4 ± 2.8 23.2 ± 3.2 23.4 ± 3.5 16.8 - 32.4
Professional experience (y) 9.6 ± 3.2 ‡§ 5.0 ± 2.7 7.1 ± 3.3 7.2 ± 3.6 2.1 - 13.8
Height (cm) 190.7 ±6.0 ‡§ 200.0 ± 3.4 � 207.6 ± 2.9 199.5 ± 8.2 180.3 - 220.5
Weight (kg) 88.6 ± 8.1 ‡§ 95.7 ± 7.1 � 105.1 ± 11.5 96.5 ± 11.2 75.6 - 121.2
Body fat (%) 9.9 ± 3.1 § 10.1 ± 3.2 � 14.4 ± 5.6 11.5 ± 4.6 3.1 - 20.4
Hemoglobin (mmol.L-1) 131.7 ± 10.9 132.3 ± 10.4 132.1 ± 10.7 132.0 ± 10.7 119.2 - 145.7
Hematocrit (%) 0.41 ± 0.03 0.41 ± 0.04 0.41 ± 0.04 0.41 ± 0.04 0.39 - 0.44
Forced vital capacity (L) 6.5 ± 0.8 6.6 ± 1.0 6.6 ± 0.9 6.6 ± 0.9 5.5 - 7.6
Forced expiratory volume in 1 s (L) 5.4 ± 1.1 5.7 ± 0.9 5.8 ± 1.1 5.6 ± 1.0 4.9 - 6.8
Estimated VO2max (ml.kg-1.min-1) 52.5 ± 4.8 § 50.7 ± 2.3 � 46.3 ± 4.9 49.8 ± 4.9 41.3 - 63.9
HRmax (b.min-1) 193 ± 2 ‡§ 196 ± 5 195 ± 3 195 ± 3 186 - 208
Vertical jump height (cm) 59.7 ± 9.6 57.8 ± 6.5 54.6 ± 6.9 57.4 ± 7.7 31.1 - 89.6
Vertical jump power (W) 1,484.9 ± 200.0 § 1,578.6 ± 137.5 1,683.0 ± 191.7 1,5821.1 ± 193.6 1,256.1 - 1,889.5
Fast twitch† (%) 65.1 ± 10.2 64.7 ± 8.9 62.4 ± 9.1 64.1 ± 9.4 45.2 - 79.5
* Values are expressed as mean ± SD; HRmax = maximal heart rate obtained in the last minute of shuttle run test; VO2 = maximal oxygen uptake.† Estimated percentage of muscle fiber types (fast twitch) of leg extensor muscles. ‡ Statistically significant at p < 0.01 for guards vs. forwards.§ Statistically significant at p < 0.01 for guards vs. centers. Statistically significant at p < 0.01 for forwards vs. centers.

38
Chapter 2 NCSF Advanced Concepts of Strength & Conditioning
A recent study compared NBA starters to nonstarters on their ability to maintain strength,
power, and quickness during a competitive season. The starters played an average of 1813 ± 639
total minutes (27.8 ± 6.9 minutes per game) and nonstarters played an average of 543 ± 375 total
minutes (11.3 ± 7.0 minutes per game) over the competitive season[27]. Also over a season, starters
were able to maintain body mass (0.5 ± 1.2 kg), whereas nonstarters showed a significant loss in
body mass (-0.9 ± 3.1 kg) [27]. Starters additionally showed a significant increase in vertical jump
power (VJP) and measures of reaction time when compared to nonstarters [27]. All players were
able to improve their squat power during the course of the basketball season [27].
Table 2.7 Magnitude-based inferences on anthropometric and performance changesduring a season of competition in NBA starters vs. nonstarters [27]
Table 2.8 2012 NBA Draft Combine Results
SummaryStudies have shown different positional requirements in size, strength, speed, agility,
and intermittent aerobic endurance in basketball [24]. This suggests strength and conditioning
programs should be specifically suited to the position played. Key elements to all positions in-
clude muscular power, speed, agility, and aerobic power. Recent literature suggests basketball
performance is more dependent on a player’s anaerobic power and anaerobic endurance than
on aerobic endurance when relative strength is consistent [23,24,25]. Short-term anaerobic per-
Sport Analysis for Program Development
S vs. NSMean Increase
(%)Clinicalinference
% Beneficial/positive
% Negligible/trivial
% Harmful/negative
Body Mass 1.3 Possibly 59.6 30.1 10.3
Body Fat % -9.6 Possibly 57.6 30 12.4
VJP 17.15 Likely 94.5 4.8 0.8
Quickness -0.29 Unclear 33.3 30.6 36.1
Reaction Time -5.66 Possibly 57.6 30 12.4
SQT Power -3.28 Unclear 34 27.6 38.4
*NBA = National Basketball Association; S = starters; NS = nonstarters; VJP = vertical jump power; SQT = squat
Guards Forwards Centers
Height 5'11.75" - 6'7.5" 6'5.25" - 6'10.75" 6'11.5" - 7'1.25"
Weight (lbs) 174.4 - 221 196.6 - 268.2 241.2 - 278.6
Body Fat % 3.6 - 12.5 3.2 - 11.3 5.2 - 11.4
No-Step Vertical Jump (in) 26 - 34.5 25.5 - 38 26.5 - 34
Maximal Vertical Jump (in) 29.5 - 41.5 30 - 40 29.5 - 40.5
Bench Press (185lbs) 0 - 17 0 - 20 7 - 19
Lane Agility Test (s) 12.03 - 10.57 12.77 - 10.48 12.35 - 10.14
3-Quarter Court Sprint (s) 3.47 - 3.19 3.81 - 3.16 3.44 - 3.29
National Basketball Association (NBA). In 2012 NBA Combine: Athleticism Results. Retrieved July 10, 2013, fromhttp://nbadraft.net/2012-nba-combine-athleticism-results.
National Basketball Association (NBA). In 2012 NBA Combine: Measurements. Retrieved July 10, 2013, fromhttp://www.nbadraft.net/2012-nba-combine-measurements.

39
NCSF Advanced Concepts of Strength & Conditioning Chapter 2
formance (particularly speed at distances ranging from 5-30 m) explosive strength, and agility
should be the key elements in basketball conditioning programs as they have been found to be
defining variables among elite players and predict playing time in Division I college players [23,24,25].
Additionally, the ability to sustain high-intensity efforts is demonstrative of elite players and is
therefore another relevant variable to consider in athletic preparation [23,24,25,26,27]. To identify the
specific relevance of each variable for performance enhancement, basketball positions are com-
monly separated into three groups (guards, forwards, and centers) but a possible argument can
be made for separating positions into point guards, shooting guards and small forwards, and
power forwards and centers due to the speed, size, and physical contact differences.
Point Guards
Key Actions:Quick acceleration and deceleration with rapid turning, sliding, and change
of direction
Goals: Point Guards set the pace of the game, requiring the highest VO2max and fastest 5-
10 m sprint speeds. Due to the need for speed and agility with limited body contact, mass is
not a pertinent factor. In fact, slicing through potential contact with an opposing player is
a key element related to the position. This requires greater ability to produce rapid bodily
shifts during forward movements such as head fakes, rotational maneuvers, and “juking” ac-
tions. Training should emphasize anaerobic conditioning, improving hip power for speed,
and dynamic stability with specific planning for agility and scenario-specific improvements
in reaction time. Leg and hip strength is comparable to all other players relative to body mass,
suggesting closed-chain, compound hip/ leg actions, such as heavy squats, are relevant in the pro-
gram. Anaerobic capacity and explosive training are also important components; therefore, gly-
colytic-based ballistic activities can be effective. Due to the need for constant movement and
change of direction to gain positional advantages, guards require excellent center of mass control;
suggesting that an emphasis on dynamic equilibrium needs to be considered via incorporation
of multidirectional agility exercises with a range of loading variations.
Shooting Guards and Small Forwards
Key Actions: Long sprints, fast breaks, and transitional actions at high intensity
Goals: Shooting guards and small forwards demonstrate the fastest 30 m speed. Small forwards
spend the most time running and are fastest at 30 m distances; followed closely by shooting
guards, as much of the game is played in transition. Although repeat anaerobic bursts are highest
among point guards, these positions should be appropriately conditioned over longer distances
for higher levels of supportive aerobic endurance. Total body strength balance is relevant and
should be developed via closed-chain, compound activities. Of note, a player’s strength-to-weight
ratio is a key predictor of top performers. The multidirectional aspect of “under the basket” play,
along with the requirement to perform repeat, short-burst movements and sprints, underscores
the need for explosive and ballistic training with various loaded conditions. Basketball training,
particularly for guards, should encourage multiplanar conditions; a common error is overem-
phasizing sagittal plane activities.
Power Forwards and Centers
Key Actions: Screening, boxing out, posting-up, and rebounding
Goals: Power forwards and centers spend the most time in direct physical contact with other
Sport Analysis for Program Development
Guard play requires the highest VO2max and fastest 5-10 m sprint speeds.
DEFINITIONS
Sagittal plane –
A vertical plane which passes throughthe midline of the body, dividing it intoright and left halves

40
Chapter 2 NCSF Advanced Concepts of Strength & Conditioning
Sport Analysis for Program Development
players. Centers perform the most physical contact with opposing players, even
though they perform the least amount of total overall movements. Power for-
wards and centers are the strongest athletes on the team; thus justifying higher
levels of compound hip work in a training program. They also demonstrate a
need for greater mass for low-mid post positioning and attempts at ball possession.
Upon comparison, these positions should have the greatest absolute power, but due
to their size the players will likely have lower relative power (vertical and horizontal
directions). Centers possess the greatest mass and the highest body fat among play-
ers, which may explain the slower speeds and lower relative power compared to
power forwards as well as the greatest decline in intensity towards the end of the
game. This suggests body composition may warrant consideration for an improved
strength/power-to-weight ratio, even considering the fact that centers spend signif-
icantly less time in high-intensity movements and more time exerting isometric and
dynamic strength. Although total-body strength and closed-chain stability (inte-
grated strength) are relevant for all positions, centers and power forwards should
maintain superior measures of strength and power. Sustainable strength from
varied stance positions is important for post players, as is the integrity of hip/trunk
endurance due to the constant pressure of lean-contact (isometric force) from other players.
Improved force coupling within the hip and trunk, as well as ab/adductor stability, should be
emphasized for these athletes. Slide disc work helps to serve these purposes. When considering
basketball strength and power training, coaches must recognize challenges related to the physics
of body proportions (i.e., long limbs). Traditional movements may need to be modified to
accommodate observed difficulties among forwards or centers. For example, pulls from the floor
should be performed from blocks, and squat depths should be specific to functional ranges among
taller athletes. Furthermore, forward and lateral movements should account for limb length and
knee position. Unilateral-based work from a split stance can aid in exercises where the physics
of bilateral work becomes challenging. This is particularly applicable to very tall athletes who
need to perform overhead work as significant mechanical stress will be placed upon central
stabilizers due to the height of the center of mass relative to the base of support.
FootballThe United States does not allocate the same resources for clinical investi -
gations of athletic performance when compared to other countries. Consequently,
American football has not been thoroughly evaluated in controlled environ-
ments, with most of the existing data based on empirical observation. Only
recently has the relationship between strength, speed, power, and optimal per-
formance in the sport been scientifically confirmed [28]. Interestingly, the emphasis
of strength and conditioning in most university settings is placed heavily on
football. It could be argued that the existing foundations for the strength and
conditioning profession, as well as programming methodology in the United States,
is primarily based on America’s most popular sport. Part of the reason for its pop-
ularity and need for specialized training lies in the fact that the sport is collision-
based and played using repeated, maximally-intense bouts of activity. The sport
is also fairly unique in that two competitions occur simultaneously. There is an
offensive-defensive struggle at the line of scrimmage in concert with a downfield
Centers perform the most physical contact with opposing players,even though they perform the least amount of total overallmovements.

41
NCSF Advanced Concepts of Strength & Conditioning Chapter 2
Sport Analysis for Program Development
competition between receivers and backs. Likewise, the game can switch from an aerial to ground
attack at any time.
Compared to sports like soccer and tennis, which are played for longer durations, the entire
game of American football is one hour in length; split into four 15-minute quarters with a 12-20
minute (NFL-NCAA) half time period. Although the total playing time is 60 minutes, no single
player is ever on the field for this full duration; separate offensive and defensive players are used
and, in many cases, certain positional players are substituted on both sides based on strategic
adjustments made by the coaches. Additionally, a third aspect of the game occurs following a
scoring event or exchange of a possession; the group responsible for play at these transitions are
called special teams, and are comprised of an array of specialty players from both offensive and
defensive positions. Due to the need for three operational units and back-up players for each
positional role, American football teams are the largest of any sport and have the greatest number
of specialty players serving select roles.
Early investigation related to injury risk assessment suggested the maximum time a player
is exposed to play action in a complete football game is 13.5 minutes, with numerous players
spending less than half this duration on the field during a game. Football is played using short
action segments, or what is referred to as a series of plays. On average, football teams play around
14 offensive series in a game and between 4.6 (college) and 5.6 (NFL) plays per series; this equals
an approximate total of 70 offensive plays per game [29]. Each play in a series may last only 5
seconds before stoppage. Video analysis suggests that each play lasts between 1.87-12.88 seconds,
averaging 5.5 seconds for college and closer to 5.0 seconds in the NFL [30]. Once the referee has
designated the ball’s location following a play, the clock starts and the team (on offense) has 40
seconds to run the next play. It is estimated that collegiate athletes take on average 32.7 seconds
between plays, whereas the NFL rest interval ranges between 26.9 to 36.4 seconds. It should be
noted that during the final two minutes of the game the time interval between plays often
decreases significantly as losing teams rush to score. When rest between series is considered, the
average time between offensive possessions is 11.39 + 4.19 minutes [30].
Physiological Characteristics of Football
American football is defined as a high-intensity, anaerobic sport char-
acterized by intense bursts of work, followed by short rest intervals between
plays [31]. The game is played at near-maximal to maximal effort; with each
play requiring variations in movement and force output as determined by po-
sition or assignment. It is suggested that the physical demands on a player are
based on several factors, including position, the style of offense employed by a
team, and the defensive schematic presented by the opponent. For example,
running plays require less time (4.86 ± 1.41 seconds) compared to passing plays
(5.6 ± 1.71 seconds). Similarly, teams organize their offensive squad by using
either a run- or pass-dominant strategy, placing different requirements on
certain players. This certainly helps to explain why some players experience
significant performance decline, measured as loss of peak force and power, from
the first quarter to the halftime period. Players who are substituted throughout
the game demonstrate a less significant decline in force output as recovery time
aids intermittent performance requirements. This has become a common
strategy used by coaches to manage positions such as the defensive linemen, who experience max-
imal-intensity demands during every play, as well as switching offensive receivers to fatigue
The physical demands of football are based on several factors, includingthe position played, the style of offense employed by a team, and thedefensive schematic presented by the opponent.

42
Chapter 2 NCSF Advanced Concepts of Strength & Conditioning
Sport Analysis for Program Development
defensive secondary players who do not substitute as frequently and must perform repeated
sprints.
American football is clearly a phosphagen-driven sport. Reports suggest this immediate
metabolic system fulfills 90% of energy requirements, with secondary support from the glycolytic
pathway [30]. However, the published analysis suggesting the 9:1 ratio of phosphagen to glycolysis
may be slightly exaggerated as players examined in a post-game period demonstrated 3- to 5-
fold increases in serum lactate, suggesting a greater reliance on glycolytic pathways compared to
what was initially believed. Recent findings suggest that glycolytic activity may be more dominant
than originally proposed during all intense immediate work. The explosive nature of the sport-
specific movements, and the high intensities employed in each play, should be replicated in train-
ing for both power and metabolic conditioning. Additionally, due to the continual need for high
force output, football players must have sufficient aerobic support to quickly recover with short
rest durations. VO2max measurements of collegiate and professional football players have been
found to be similar, with peak values of VO2max recorded at 4.25 L/min (±0.27 L/min) [32]. This
suggests that aerobic conditioning may be a factor in the performance decline commonly seen
between subsequent quarters.
Although running distances as well as direction of movement varies by position, football is
played using acyclical movements, which require a functional integration to perform a single
action [33]. Players must be able to move efficiently in a direct course and control changes in body
positions at high velocities. For instance, an offensive lineman drops back while exerting forward
forces against a defensive tackle during a pass block; at the same time on the other side of the ball
a defensive corner may need to backpedal, change direction, and then immediately dive laterally
to block a pass thrown to the receiver in his zone. This integrated movement concept suggests
that more emphasis should be placed on movement efficiency and athleticism than on individual
muscle activity. It also speaks to the relevance of improving coordination between movement
segments, the role of dynamic stability, and the need for flexibility to optimize performance.
Unfortunately, these areas are often de-emphasized in traditional football programs in exchange
for heavy loading dominated by sagittal plane actions.
When divisions of college football are compared, notable variations between metrics of size,
strength, power, and speed can be observed [34]. Markers of strength, power, and speed have also
been demonstrated as criteria that separate starting position players from those who serve back-
up roles [35]. In the NFL, power, speed, and agility have been shown to be valid predictors of draft
status, as well as the likelihood a college player makes a professional team[36]. Furthermore, when
collegiate interdivision comparisons are made, measures of power are predictive of final NCAA
team ranking, demonstrating the importance of ballistic and Olympic-based training for the
sport [37].
Size and strength have historically been dominant variables related to player selection in
both recruitment for college and the NFL draft. Interestingly though, among size variables, body
composition plays a large role in successful performance [38]. In studies conducted on both
university and professional football players, results demonstrated a relationship between body
composition and strength, speed, and cardiovascular efficiency, suggesting players carrying excess
fat experience some level of performance decline. A study comparing current body mass of NFL
players showed that the most dramatic increases in body mass (compared to the 1970s) were
observed among offensive and defensive linemen (Table 2.9). Height, on the other hand has
essentially remained unchanged except for defensive backs [39].

43
NCSF Advanced Concepts of Strength & Conditioning Chapter 2
Sport Analysis for Program Development
It is believed that rule changes in drive-blocking style has changed dynamics of the game by
reducing body mass needed for such “old school” blocking methods (now illegal) as scramble
blocks, spearing, and posting with chop blocks [39]. Therefore, depending upon the offensive style,
plays requiring pulling, cross-blocks, change-ups in pass blocking, and no huddle offenses may
indirectly create differences in body mass among various NFL teams. Comparisons between data
from the 1998 Atlanta Falcons and the 2005 Indianapolis Colts showed that the Colts’ offensive
and defensive lines had lower body fat percentages due to different styles of play and training
factors [39]. It has been also theorized that defensive linemen could be lighter than offensive
linemen due to the need for greater movement in coverage zones and for pass rushing [39].
Table 2.9 Mean body size and body composition values by position (NFL)
Much of the associated research also points out that BMI is not a proper indicator of “health
status” for football players; further analyses are needed to determine true health profiles for these
athletes. This may be especially pertinent as players transition to more of a basic ‘health and fit-
ness lifestyle’ after their careers have ended. Table 2.10 clearly demonstrates the fact that BMI is
not a good indicator of health status for football players.
Table 2.10 Health status by BMI and percentage fat criteria and correlations betweenbody composition compartments and BMI
Position n Height (cm) Body mass (kg) % Fat BMI
RB 4 180.0 ± 3.0 96.5 ± 8.1 7.3 ± 7.3 29.8 ± 2.7
OL 11 193.3 ± 3.8 140.0 ± 7.5 25.1 ± 2.5 37.1 ± 1.9
QB 2 192.0 ± 5.8 104.2 ± 2.6 14.6 ± 9.3 28.3 ± 2.4
WR 7 180.5 ± 3.9 85.6 ± 6.5 8.1 ± 2.8 26.3 ± 2.0
TE 4 194.4 ± 4.0 115.6 ± 7.2 15.1 ± 5.4 30.6 ± 0.9
LB 5 186.9 ± 2.6 107.8 ± 2.9 15.7 ± 2.8 30.9 ± 0.6
DL 7 191.6 ± 2.5 126.8 ± 2.4 18.5 ± 3.8 34.6 ± 1.4
DB 11 179.7 ± 4.5 87.1 ± 5.6 6.3 ± 2.8 26.9 ± 1.6
K/P 2 191.4 ± 5.9 95.3 ± 0.0 11.4 ± 8.3 26.0 ± 3.4
BMI = body mass index; RB = running back; OL = offensive line; QB = quarterback;WR = wide reciever; TE = tight end; LB = linebacker; DL = defensive line; DB = defensive back; K/P = kicker/punter
From: Kraemer, W. J., Torine, J. C., Silvestre, R., French, D. N., Ratamess, N. A., Spiering, B. A., . . . Volek, J. S. (2005). Body size and composition of national football league players. Journal of Strength and Conditioning Research / National Strength & Conditioning Association, 19(3), 485.
Position BMI Percentage fat Body Compartment BMI
RB Obese Healthy Total mass 0.957†
OL Severly obese Poor Total lean mass 0.870†
QB Overweight Healthy Total fat mass 0.907†
WR Overweight Healthy Percentage fat 0.856†
TE Obese Healthy
LB Obese Healthy
DL Obese Good
DB Overweight Healthy
K/P Overweight Healthy
*BMI = body mass index; RB = running back; OL = offensive line; QB = quarterback; WR = wide reciever; TE = tight end; LB = linebacker; DL = defensive line; DB = defensive back; K/P = kicker/punter. † = p = .05
From: Kraemer, W. J., Torine, J. C., Silvestre, R., French, D. N., Ratamess, N. A., Spiering, B. A., . . . Volek, J. S. (2005). Body size and composition of national football league players. Journal of Strength and Conditioning Research / National Strength & Conditioning Association, 19(3), 485.

44
Chapter 2 NCSF Advanced Concepts of Strength & Conditioning
Sport Analysis for Program Development
These morphological changes in the average player by position have also occurred among
Division I players. Total body mass, skin-fold thicknesses, and body fat were greater in Division
I players during the early 2000s than the early 1980s and early 1990s [40]. Body fat varied according
to playing position; with the defensive backs, offensive backs, and receivers being the leanest while
the offensive linemen and tight ends had the greatest quantities of body fat [40]. As detailed in the
previous examples, these values are likely due to newer training techniques and changes to the
rules and strategies of the game.
Offensive and some defensive lineman, as well as some tight ends, have demonstrated an
ability to play at the professional level with body fat values much higher than previously recom-
mended. This may seem contradictory, as successful performance by linemen is associated with
power production over repeated plays during a football game, and body fat is negatively correlated
with this requirement. Additionally, when strength-to-weight values for linemen are compared
to linebackers and running backs, linemen demonstrate lower values despite the higher strength
demands of their positions. One consistency found in the literature is the negative impact excess
body fat plays on performance measures, suggesting overall mass is not as relevant as composition
relative to size. Furthermore, from a fitness perspective, the prevalence of metabolic syndrome
associated with excess body fat was significantly higher among linemen compared to skill-position
players (46% vs. 0%). Additionally, 20% of the players examined in research have demonstrated
mildly abnormal ventricular wall thickness, despite no significant differences in vascular function
between groups [41].
Another study evaluated the performance of 326 collegiate football players attending the
2000 National Football League combine and looked at whether draft status could be predicted
from this event [42]. Height and weight were measured and the 225-lb bench press test, 10-yd
dash, 20-yd dash, 40-yd dash, 5-10-5 (Pro agility), 60-yd shuttle, 3-cone drill, broad jump, and
vertical jump assessments were used. Table 2.11 shows that the first and second round draft picks
were (in general) taller , heavier, stronger, faster in all 3 linear running distances as well as in the
3 agility shuttles, and could jump both higher and farther when compared with the sixth and sev-
enth round draft picks [42].
The data from this analysis is useful in multiple ways.
First, the abilities of the sixth and seventh round draft picks
demonstrates to coaches an idea of the minimal test require-
ments for playing in the NFL. Also, it can help coaches iden-
tify which tests are most important for athletic success. For
example, it appears that the vertical jump was the most
important test to determine draft success in the RB position,
whereas the 225-lb bench press test had little to no effect on
any position [42].
Rounds 1 and 2 Rounds 6 and 7
Characteristics Mean ± SD Mean ± SD
Height 74.15 ± 2.57 73.8 ± 2.35
Weight 247.93 ± 49.86 245.56 ± 48.58
Bench Press (225-lb) 21.83 ± 6.75 20.59 ± 6.95
10-yd dash 1.68 ± 0.11 1.71 ± 0.11
20-yd dash 2.79 ± 0.18 2.85 ± 0.19
40-yd dash 4.81 ± 0.31 4.93 ± 0.34
Vertical jump 33.31 ± 3.26 31.23 ± 4.15
Broad jump 113.39 ± 9.18 109.18 ± 9.84
5-10-5 (Pro agility) 4.38 ± 0.29 4.45 ± 0.29
60-yd shuttle 11.39 ± 0.26 11.53 ± 0.22
3-cone drill 7.23 ± 0.41 7.46 ± 0.46
Table 2.11 Characteristics of round 1 and 2 draft picks vs. round 6 and 7 draft picks [42]

45
NCSF Advanced Concepts of Strength & Conditioning Chapter 2
Sport Analysis for Program Development
Table 2.12 Top 15 combine results (by position) for the 2013 NFL draft
SummaryKey performance areas in football include appropriate categorical measures of strength,
speed, agility, endurance, and body composition. All football players have requisite strength by
position, but sport success is more correlated with speed, agility, and power. This suggests, beyond
injury prevention, resistance exercises should reflect strength training for speed and power.
Anaerobic conditioning should work in a coordinated fashion with this effort to transfer weight
room activities to on-the-field speed, agility, and endurance. Although positional requirements
vary, football players should have a well-balanced musculoskeletal system with a powerful and
functional trunk-hip relationship. Too often the programming emphasizes absolute strength
over sport-specific strength – an error for athletic development. The use of heavy loading without
the requisite skeletal foundations is another common error in programming for football.
Excessive loading without first ensuring balanced musculature across joints, ef-
ficient trunk stability, and optimal flexibility leads to compensatory actions and
faulty recruitment patterns. This is a real issue for many athletes, and coaches
must therefore be cognizant of signs and symptoms of musculoskeletal dysfunc-
tion. A strong and efficient trunk combined with adequate flexibility is requisite
to sprint speed and correct performance of compound and Olympic lifts. In-
dividuals with deficiencies in these areas may require closed-chain, unilateral
lifts during initial phases of periodization. Once baseline strength and segment
connectivity is developed in a manner that allows for the effective transfer of
force, training emphasis should shift to power and speed development. There
are three primary categories related to position by which athletes can be
grouped for comparison and training emphasis.
Group #1: Offensive and Defensive Lineman
Key Actions: Instantaneous starts to collision, blocking, charging and tackling
40-ydDash (s)
Bench Press(225-lb)
VerticalJump (in)
BroadJump
3-ConeDrill (s)
5-10-5(Pro agility)
60-ydShuttle (s)
QB 5.11-4.59 15* 34.0-26.5 8'4"-10'4" 7.49-6.69 4.55-3.99 NR**
RB 4.60-4.34 20-36 33.5-43.0 9'11"-10'10" 7.12-6.69 4.31-4.02 12.12-11.33
WR 4.50-4.27 13-26 34.5-39.5 10'1"-11'4" 6.93-6.53 4.29-3.96 12.14-10.87
TE 4.99-4.5 16-31 30.5-37.5 9'2"-10'5" 7.48-6.92 4.57-4.27 12.2-11.5
S 4.65-4.42 14-28 35.0-40.5 10'11"-11'2" 7.07-6.64 4.34-4.00 11.62-11.53
DL 4.84-4.57 28-38 33.0-38.0 9'6"-10'8" 7.20-6.84 4.51-4.26 NR
LB 4.75-4.47 21-36 32.0-41.5 9'9"-11'7" 7.49-6.71 4.53-4.18 12.39-11.28
CB 4.48-4.36 14-22 35.5-40.5 10'5"-11'0" 6.92-6.52 4.18-3.84 11.56-11.06
OL 5.11-4.71 28-36 28.5-34.5 8'11"-9'0" 7.65-7.26 4.70-4.44 NR
K/P 5.05-4.74 11-24 29.0-33.5 8'10"-9'8" NR NR NR
*One QB reported **NR = No data reported.NFL (February 26, 2013), 2013 COMBINE TRACKER. In NFL.COM Retrieved July 10, 2013, from http://www.nfl.com/combine/tracker
Linemen should be conditioned for quick-start power, while performingadjunct work to promote appropriate leanness and endurance for rapidrecovery between plays.

46
Chapter 2 NCSF Advanced Concepts of Strength & Conditioning
Sport Analysis for Program Development
Goals: Offensive and defensive linemen should seek to increase closed-chain force production
capabilities, increase the rate of force production (power), improve anaerobic/aerobic endurance,
and optimize body composition. Size is relevant; however, increased mass should not be attained
at the cost of speed or endurance. An optimal strength/power-to-weight ratio is imperative.
Linemen must produce high levels of force in a very rapid manner; program activities should
therefore employ a building-block approach to develop optimal strength which can then be
applied to power movements, and subsequently produce enhanced speed on the field. Linemen
should be conditioned for quick-start power, with adjunct conditioning for appropriate leanness
and endurance to promote rapid recovery between plays. Sports nutrition-related education is
also warranted for this population to avoid excess body fat relative to size. Conditioning metrics
should be employed to prevent the notable decline in force output between the start of a game
and the end of the first half. Programmatic emphasis should be based on the fact that the position
is highly anaerobic with the understanding that inefficient re-phosphorylation is associated with
suboptimal VO2 levels. This may be most relevant for defensive ends that repeatedly rush the
quarterback.
Group #2: Linebackers and Tight Ends
Key Actions: Linebackers: Short distance; high speed collision, pursuit, tackling
Tight ends: Moderate distance; mod-high speed agility routes, blocking
Goals: Linebackers and tight ends are considered transitional players as the requirements of the
positions warrant size, strength, and speed rankings that fall between linemen and offensive/
defensive backs. Both positions require size and strength to manage routine impacts aimed at
either taking down or breaking away from opponents. These athletes cover greater distances than
required of linemen, and they exert higher levels of power during a run. A tight end may run,
cut, and jump to receive a pass and then immediately drive through another player to break a
tackle. This suggests dynamic stability should be added to enhance power generated while on
the move, whether lateral, diagonal, backward, or forward. Backpedaling into a vertical jump to
knock down a pass is one example of the many diverse movement combinations required of a
linebacker. Linebackers see heavy contact and make many of the tackles, so they need size and
strength to deal with the collisions. They also have to drop into coverage on certain defensive
schematics, so they must also be fast and be able to change direction efficiently.
These positions may demand the most balanced performance measures related to
strength, power, speed, agility, and endurance. Emphasis should be placed on a high
strength-to-weight ratio as well as positional speed and power. Conditioning should stress
agility, short distance speed, and repeat speed endurance. Tight ends statistically tend to
present with greater body fat than linebackers; therefore, specific considerations for con-
ditioning and nutrition should be individually applied. Their role in blocking supports
a requisite size, so similar to linebackers there should be a hypertrophy component to the
training. Unlike some other sports, American football requires mass and the ability to
manage collisions as an element of success; therefore, endurance-hypertrophy and
strength-hypertrophy phases are often necessary.
Quarterbacks may be grouped independently, or with tight ends and linebackers, due
to anthropometric and strength similarities; however, the necessary actions associated
with the position are notably different. Quarterbacks need to be quick and have the
capacity to escape defenders moving at high speed, but they do not present with the fastest
Quarterbacks can also be grouped according to type of playor skill set.

47
NCSF Advanced Concepts of Strength & Conditioning Chapter 2
Sport Analysis for Program Development
absolute speeds over most distances, similar to tight ends. Quarterbacks at the collegiate level
are often smaller and slower than those in the NFL, as the speed of the game is slower by com-
parison. At the professional level, quarterbacks may have 4.5-4.6 second 40-yard dash speed, or
faster. Due to positional variations in speed, quarterbacks can also be grouped according to type
of play or skill set. Quarterbacks like Michael Vick, for example, are smaller and much faster than
the NFL average, making them more active in the backfield. They will commonly leave the pocket,
presenting a significant ground threat to defenses but are also more susceptible to injury. Others,
like Peyton Manning, are larger athletes who stand tall in the pocket and rarely run down field.
The pocket passers must be stronger and larger as they are subject to more aggressive assaults by
large outside linebackers, defensive ends, and tackles. Additionally, due to the high number of
awkward hits quarterbacks endure, it is important to ensure attention is placed on flexibility and
muscle balance specific to the position.
Group #3: Offensive and Defensive Backs and Wide Receivers
Key Actions: Pursuit/breakaway speed and agility
Offensive and defensive backs are fairly similar in size; however, more notable dissimilarities
exist at the elite level. Defensive backs are often leaner, whereas offensive backs are often stronger.
Receivers are often taller than defensive backs, but their strength measures are consistent with
offensive backs. Receivers and defensive backs are the fastest sprinters on the team and are often
the most athletic.
Goals: The role of resistance training should focus on developing speed and power, with the use
of compound strength exercises to support an Olympic-based program. An emphasis on flexi-
bility and movement segment connectivity will support speed, multidirectional quickness, and
agility. Offensive and defensive backs may require more lean mass as offensive backs must block
and take repeated hits, whereas defensive backs must tackle, often struggling with larger receivers
and tight ends. Size should not compromise speed, but smaller backs have been anecdotally
criticized in their ability to stop large receivers and tight ends, making upper body strength more
relevant by position.
Important note: It has been well documented that football players who have reduced
their body fat to a more ideal playing percentage and/or improved their cardiovascular
condition enhanced their performance over the previous year. These areas must be
emphasized for optimal performance as significant negative correlations have been
found between percent body fat and 40-yard sprint times; and the simple fact exists
that excess fat results in wasted energy during any movement. An improvement in
oxygen utilization from anaerobic sprint training was associated with improved energy
substrate resynthesis and lactic acid buffering. Improved conditioning in turn is
associated with more rapid recovery for intense, repeatable performances during a
series. Of further relevance, improved conditioning is also associated with a reduced
risk of injury associated with fatigue in the second half of play, when more injuries
commonly occur. Optimizing body fat percentage by position carries one caveat: it
is important the weight loss occur in the off season and progress slowly to maintain
lean mass. Significant decline rates and becoming overly lean can often be more
detrimental than beneficial.

48
Chapter 2 NCSF Advanced Concepts of Strength & Conditioning
Sport Analysis for Program Development
BaseballCoined the national pastime, baseball has been criticized for its highly paid
athletes who seemingly spend most of their time in a resting state. Baseball,
much like football, is performed at maximal levels; however, the total work per-
formed and the work-to-rest intervals represent a major difference between the
two. A defensive player may go an entire inning without being required to perform
game speed work if the ball is not hit to him and he does not get up to bat. For this
reason, many games are viewed as a battle between pitchers and hitters more so
than as a constant full-team competition. This places most of the stress and re-
sponsibility on the pitcher and catcher, as they are the only players required to per-
form an action every play. Even with the significant difference between the
requirements of a starting pitcher and a back-up, the position clearly demands the greatest
amount of work in a game.
Pitchers
Although during baseball’s early times, the pitcher was expected to throw complete games,
in the 2014 Major League Baseball (MLB) season, only 2.4% of starters threw for a complete game
according to the MLB. On average, a starting pitcher will now perform into the 6th inning before
a relief pitcher is called in, and in many cases, he will be followed by a 9th inning closer. MLB
starting pitchers throw about 95 pitches per game, or about 15 pitches per inning. As a team, the
expected pitch count averages 146 pitches per game. The position demands both anaerobic power
and endurance, as pitch speeds range from around 70 mph for a curve ball to more than 90 mph
for a fastball. As we have seen in other sports, defining a set work requirement using general
physical measures like VO2 is complicated by the intermittent actions of the position. A clinical
assessment of physical measures of six college pitchers (following a game scenario) demonstrated
that the physiological stress of pitching corresponds with work intensity similar to continuous
exercise at 45% of VO2max for around 60 minutes. To the contrary, postgame enzyme response
identifies the violent nature of the movements involved in pitching. Research has shown an
increase in the muscle enzymes associated with significant muscle damage over the 24-hour
period following competition [43]. This may explain the obvious need to rest starting pitchers
appropriately between games.
Among pitchers, physical consistencies have been identified and analyzed over the matura-
tion process from high school to college and from college to the professional level. Research sug-
gests that pitching form also encompasses specific kinematic commonalities, as well as kinetic
differences among quality pitchers in the different stages of development [44]. Of the 16 kinetic
parameters measured, six appeared to notably differentiate performance capabilities among
pitchers. Interestingly, five of these six key factors were velocity-specific, whereas only one was
related to positional technique. This information demonstrates the relevance of proper throwing
technique, but more importantly the role joint forces and torque play in pitching effectiveness.
Measured differences suggest elite pitchers maintain longer arm length and greater relative
strength [44]. These findings indicate that muscle, tendon, and ligament strength, as well as balance
within force couples, are essential to performance. Additionally, the powerful forces generated
from the positional shifts that occur while throwing should be developed appropriately with
consideration for accelerators and decelerators. This will enhance velocity while minimizing
the risk for injury. In many cases, the abilities of the global accelerators and internal rotators far
When pitching, global accelerators andinternal rotators far exceed the decele -ration capabilities of the posteriormusculature and external rotators. Thispromotes compensatory adjustments inscapular and capsule function, conse -quently increasing risk for injury.
DEFINITIONS
Accelerators –
Global movers active during theconcentric phase of movement
Decelerators –
Global movers active during theeccentric phase of movement

NCSF Advanced Concepts of Strength & Conditioning Chapter 2
Sport Analysis for Program Development
exceed the deceleration capabilities of the posterior musculature and external rotators. This
promotes compensatory adjustments in scapular and capsule function, consequently increasing
risk for injury.
Table 2.13 Kinetic differences among pitchers throughout the maturation process
Catchers
Secondary to the pitcher, the catcher is the most active defensive player due to the position’s
involvement in each pitch and the assigned role of managing the defensive game from the field.
Catchers experience significant stress on the low back, hips, and lower extremities due to routine
variations in receiving and throwing stances as well as positional shifts from squatting to standing
throughout the game. In most cases, a catcher will complete a full game without the relief of
substitution. In addition to the 200 throws per game, catchers are expected to prevent and throw
out stealing attempts by on-base runners. This requires an immediate high-speed throw (for a
distance of 127 feet) to second base. To a lesser degree, the catcher must also perform the same
task to first or third base as well as react to and pursue the occasional pop-fly. Catchers are nor-
mally heavier athletes relative to height as it is the only position on the field that must endure
impact from runners during plays at home plate. Catchers can be expected to play between 8-10
minutes per inning, in addition to the warm-up periods between innings. This equates to more
than an hour and a half of activity per game. As stated, the requirements for hip, knee, and back
health are relevant; muscle balance and stabilization training must be emphasized for this position
along with specific power enhancements.
Outfielders and Infielders
Outfielders and infielders are required to engage in varying activities
at near-maximal speed depending on the position and number of balls hit
into their respective zone per inning. The distance traveled by infield players is
often short and rapid as the ball comes off the bat very quickly, requiring im-
mediate response time. Therefore, second and third basemen and shortstops
must have excellent reaction time and be able to position themselves in front of
the ball. The ball movement angles and velocity often require lateral reaches
on the move, outstretched dives, and vertical jumps to catch balls hit above their
position. They must also be adept at catching the ball on the move and in com-
promised positions. Once the ball is received, infielders must be able to com-
plete throws from awkward positions and jumps, a feat requiring dynamic
stability. This is often associated with base runners in their throwing lanes who
High School College Professional
Acceleration (Nm)
Elbow torque 48 ±13 55 ±12 64 ±15
Deceleration (Nm)
Elbow proximal force 630 ±140 770 ±120 910 ±140
Shoulder proximal force 750 ±170 910 ±130 1070 ±190
Shoulder posterior force 280 ±100 350 ±160 390 ±240
(Nm) = Newton-metre Adapted from Fleisig et al., 1999
Infielders must have excellent reaction time and be able to positionthemselves in front of the ball.
49

Chapter 2 NCSF Advanced Concepts of Strength & Conditioning
Sport Analysis for Program Development
attempt to impede them to prevent double plays. A first baseman has a less dependent role in field-
ing but must be able to respond effectively to varied throws and have excellent flexibility (particularly
in the groin and adductors) to manage base contact on off-target throws. Infielders may also be
required to perform high-speed, short distance sprints to field bunts as well as back up throw
attempts to prevent erroneous throws from going out of play.
Outfielders are often characterized by superior visual acuity; the best are generally fast and
have good reaction time and game sense associated with experience. That being said, a slower
fielder may actually play over a better defensive player due to the need for offense in baseball. Base-
ball requires defenders to also play offense, which is often considered the more important skill.
An excellent batter that performs as an average fielder will see more game time than another player
demonstrating the reverse skill set. The number of play attempts in the outfield is usually between
0-4 per inning, and last less than three seconds. Therefore, field players must emphasize power
for reaction, hitting, and multidirectional starts. Outfielders must cover more distance than in-
fielders and should therefore work on 10-30 m acceleration. Additionally, while all baseball players
throw the ball, outfielders must throw long distances and consequently should focus on strength
and accelerator/decelerator muscle balance to prevent injury when throwing from the outfield to
home plate or a specific base.
Physiological Characteristics of Baseball
Since each player also plays offense, the ability to hit the ball is often the defining skill for elite
players. This ability has more to do with visual characteristics, reaction time, and technique than
any specific physical parameter. While height seems to be a preferred aspect for performance, the
literature fails to identify a single requisite size that fits all positions when it comes to hitting profi-
ciency. However, analysis of physical characteristics does suggest that certain profiles are consistent
for defense [45]. Pitchers were found to be the tallest and generally maintain higher body fat than
other players; whereas outfielders tend to be leaner and more muscular. First basemen were found
to be the tallest of the infield players, and shortstops were consistently taller than second basemen
who tend to be the smallest by measures of mass among infield groups. First basemen and catchers
were found to be the heaviest of the infielders and are often key batters on the team. Cross-divisional
comparisons suggest that lower divisions have the leanest players, possibly due to a younger age
range, but demonstrate significantly less lean mass than AAA and MLB players. The MLB players
were stronger, as determined by hand grip dynamometry, more powerful (vertical jump), and faster
than all lower divisions; demonstrating a greater relevance of power over anthropometric compar-
isons between players [46].
The ability to hit a game-speed baseball is considered one of the most challenging skills in
competitive sports. It is suggested that one must see and judge the ball in less than 0.25 seconds to
hit it. Due to the fact that a major league pitcher can throw a baseball almost 100 miles per hour, a
fast ball will reach the plate in about four-tenths of a second, traveling a distance of 60.5 feet from
the pitcher's mound to home plate. The ability to hit the moving object is determined by the batter’s
timing. Consequently, a batter must identify the ball in less than 15 feet, judge its velocity and spin,
and then start to swing in the next 20 feet of travel. A fastball will arrive at the plate about 0.25 sec-
onds later, and the bat must already be there to make contact. This suggests the ability to hit a major
league fast ball is close to the limits of human reaction time. A few thousandths of a second off
in the timing and the ball is missed or hit foul. Similarly, hitting the ball only a few millimeters
too high or too low results in a fly ball or a grounder. Many are surprised to hear that the visual
aspect of the game explains why steroids are so relevant to disparities in baseball performance.
DEFINITIONS
Hand grip dynamometry –
The use of a specific instrumentintended to predict total body muscularstrength based on known correlations of grip strength
50

51
NCSF Advanced Concepts of Strength & Conditioning Chapter 2
Sport Analysis for Program Development
Certainly, greater strength, power, and size will move the bat faster and consequently increase the
number of home runs a batter achieves, but the effects of steroids are most pronounced for sports
specificity through improvements in visual acuity. It has been proposed that steroids/HGH
increase cone function and therefore enable a batter to pick the ball up sooner; with the incorpo-
ration of faster bat speed, the significantly greater home run numbers of recent years maybe easier
to understand.
The best hitters have three
things in common: excellent vi-
sion, the ability to read the body
language of pitchers to predict
ball action, and the ability to pro-
duce high bat speed. Vision is so
intimately tied to hitting that
baseball legend Wade Boggs’ bat-
ting average dropped when his
vision declined to normal human
levels, from 20:15 to 20:20. The
location of human eyes suggests
that we use tracking as part of
our predatory instinct, therefore,
those with better visio nary
ca pa c ity have an advantage. Get-
ting a base hit 33% of the time is
considered excellent, equaling that of a cheetah’s success rate in
predation. It is no surprise that both have very similar requisites
for vision-directed neural signaling for success.
A batter’s performance improves with experience and quan-
tifiable increases in power output; repetitions in training are
therefore relevant to optimize form and improve neuromuscular
efficiency, both of which contribute to higher bat speed. This
being said, batters of equal skill may have different techniques.
When analyzed for kinematics, lead elbow speed and knee
extension angle were defining differences between high-caliber
and average hitters [47]. The same investigators suggest that faster
hip speed likely accounts for more pronounced elbow velocity
between hitters. The correlation of hip power to improved hit-
ting capability has also been supported in other studies. In an
evaluation of 343 professional baseball players, the largest deter-
mining factors between divisional levels of competition was
power-based performance as pre dicted by agility, speed, and
lower body power measures[46]. When examining anthropomet-
ric and performance comparisons among the different levels of
play in professional baseball (Table 2.14), and how these meas-
ures correlate to home runs, total bases, slugging percentage and stolen bases (Table 2.15); it is clear
that there are major differentiating characteristics among players which increase their chances of
success and reaching an elite status [46].
Table 2.14 Anthropometric and performance comparisons among levels of play in professional baseball
Table 2.15 Selected correlations (bivariate) between fitness components andbaseball performance
Variable Rookie (n=90) A (n=84) AA (n=50) AAA (n=52) MLB (n=62)
Age (yr) 21.3 ± 2.5 † 22.9 ± 2.1 † 24.9 ± 2.2 † 26.8 ± 2.7† 28.7 ± 4.2†
Height (cm) 185.2 ± 5.8 185.4 ± 6.1 185.5 ± 5.8 187.5 ± 6.9§†† 186.7 ± 6.1
Body mass (kg) 92.0 ± 9.8 92.0 ± 9.6 96.0 ± 7.9§†† 99.5 ± 12.0§†† 101.2 ± 10.5§††¶
Body fat (%) 12.0 ± 3.5 12.4 ± 3.6 12.8 ± 2.9 13.7 ± 3.4§†† 13.8 ± 3.0§††
Lean body mass (kg) 80.8 ± 7.0 80.8 ± 7.0 83.6 ± 5.8§†† 85.7 ± 9.3§†† 87.1 ± 7.9§††¶
Vertical jump (cm) 70.1 ± 7.6 70.1 ± 7.1 69.1 ± 7.1 71.1 ± 8.4 71.9 ± 8.2
Vertical jump peak power (w) 10,798 ± 791 10,823 ± 737 11,127 ± 622§†† 11,435 ± 957§†† 11,542 ± 539§††¶
Vertical jump mean power (w) 3835 ± 499 3850 ± 475 4052 ± 393§†† 4235 ± 605§†† 4298 ± 539§††¶
Grip strength (kg) 103.5 ± 12.5 105.2 ± 12.6 111.6 ± 12.7§†† 115.6 ± 12.6§†† 111.0 ± 16.0§††
10-yard sprint (s) 1.57 ± 0.09 1.59 ± 0.07 1.58 ± 0.07 1.55 ± 0.09 1.52 ± 0.10§††¶
5-10-5 (Pro agility) (s) 4.54 ± 0.19 4.48 0.54 4.42 ± .068 4.53 ± 0.20 4.42 ± 0.90
*§p ≤ 0.05 compared with rookie league. ††p ≤ 0.05 compared with A league; ¶p ≤ 0.05 compared with AA league.†p ≤ 0.05 compared with all other groups.Hoffman, J. R., Vazquez, J., Pichardo, N., & Tenenbaum, G. (2009). Anthropometric and performance comparisons in professional baseball players. The Journal of Strength and Conditioning Research, 23(8), 2173-2178
Home runs(r, r2)
Total bases(r, r2)
Sluggingpercentage (r, r2)
Stolen bases(r, r2)
Lean body mass 0.478† 0.292† 0.474† -0.188
0.228 0.085 0.225 0.035
Grip strength 0.317† 0.213† 0.273† 0.099
0.100 0.045 0.074 0.01
10-yard sprint -0.089 -0.251† -0.064 -0.422†
0.008 0.063 0.004 0.178
5-10-5 (Pro agility) 0.001 -0.153 0.033 -0.482†
0.000 0.023 0.001 0.232
VJ PP 0.481† 0.281† 0.471† -0.216
0.231 0.079 0.222 0.047
VJ MP 0.476† 0.270† 0.465† -0.246†
0.227 0.073 0.216 0.061
*VJ PP = vertical jump peak power; VJ MP = vertical jump mean power. † p ≤ 0.05.
Hoffman, J. R., Vazquez, J., Pichardo, N., & Tenenbaum, G. (2009). Anthropometric and performance comparisonsin professional baseball players. The Journal of Strength and Conditioning Research, 23(8), 2173-2178

52
Chapter 2 NCSF Advanced Concepts of Strength & Conditioning
Sport Analysis for Program Development
Summary
Batting
The action of swinging a bat at the velocity necessary to hit a fastball requires a synchronized
kinetic chain. This provides efficient transfer of energy across joint segments, particularly in the
hips and trunk. Hitting is ballistic in nature; ground reaction force is accelerated from the com-
bination of stable hip extension and fluid trunk rotation, which when combined with rotational
inertia creates significant power. The energy must transfer across multiple segments to manifest
in the hands; therefore, stable force couples and coordinated shoulder/limb action are paramount
to hitting success. An emphasis should be placed on compound lifts (not machines) for pelvic/
spine force coupling, strength training for pushing and pulling, and a key focus on leg/hip power
and rotational speed. Baseball players should experience heavy loading in the hips and Olympic-
based training. Hitters often place too much emphasis on upper body strength training and open-
chain activities; but it must be understood that baseball is a power-based sport that primarily relies
on hip acceleration with trunk cooperation. The upper body is secondary in force management.
Likewise, musculoskeletal balance is relevant as the sport is asymmetrical and requires violent joint
actions. This information lends itself to programming for contralateral balance and focusing on
muscles that decelerate throws and swings. It is not uncommon for bilateral disparities to exist
even among elite players. An emphasis on muscle balance should be employed to optimize skeletal
movements to decrease the risk for injury. Major issues in baseball include joint capsule tightness
and scapular dysfunction. Excessive pressing, particularly bench pressing, can actually decrease
shoulder efficiency. More emphasis should be placed on closed-chain exercises like squats and
kinetic chain interaction with rotation drills that incorporate the hips.
Important note: While criticisms can be made for an alarming level of antiquation
in training programs for most sports, baseball may be the worst in this category. Many
programs mirror bodybuilding-derived movements and are shrouded in superstition.
Athletes are often told not to perform overhead actions, but commonly perform series
of rotator cuff exercises and wrist curls. Certainly pitchers require a higher level of
consideration, but overall baseball training should be more athletic, with less concern
for upper body strength. A strength coach that is overly concerned with injury or
overuse in the shoulder can rectify concerns by correcting movement restrictions,
instructing proper technique in the lifts, and programming for muscle balance and
movement synergy.
Sprinting
As has been clearly illustrated, baseball is a game of extremely fast action followed by longer
periods of intermittent rest. Sprinting speed makes a substantial difference during on-base efforts
and the capacity for stealing bases. Outfielder speed can be the difference in a game where one
run is frequently the deciding factor in a win or loss. Speed training should be emphasized in
moderately-short distances as neural efficiency is more important than metabolic recovery
between plays. Ballistic lifts and plyometric training should be emphasized to enhance stride
frequency. Multidirectional starts should also be practiced, as much of the game stems from a
fairly static position to an explosive initial movement.
Baseball is a power-based sport thatprimarily relies on hip acceleration withtrunk cooperation. The upper body issecondary in force management.

53
NCSF Advanced Concepts of Strength & Conditioning Chapter 2
Sport Analysis for Program Development
Fielding
Reaction time is extremely important for infielders and, to a slightly lesser extent, outfielder
positions. Drills for lateral and forward explosiveness, as well as an improved vertical jump,
should be utilized to improve reaction time and movement speed. Additional considerations
for maximal overhand throwing should be included in the plan to expedite muscle balance and
effective limb deceleration. Hand-eye reaction should also be practiced in conjunction with
multidirectional movements as the ball may change trajectory upon a “hop” and require rapid
adjustments to field.
Pitching
Pitching requires a unique set of coordinated actions stemming from the ground, but man-
ifesting in the throwing limb. Elbow torque and shoulder force are cited as relevant differences
between good and great pitchers. Although endurance is often emphasized in pitchers, the real
value lies in repeated power output. Pitchers should be trained to be explosive while paying
attention to flexibility and muscle deceleration balance. It is also important to note that pitchers
must develop high levels of dynamic balance as their actions are asymmetrical and stem from a
small base of support. Activities emphasizing kinetic chain coordination and central stability are
also relevant considerations. Specifically, a focus on hip and trunk training as well as foot-to-
foot acceleration (asymmetrical/unilateral exercises) should be included in the training program.
Pitchers should strengthen the hip from both bilateral and split stance positions to encourage
sagittal and frontal plane hip stability, and perform primarily closed-chain trunk exercises.
Conditioning focused on improved oxygen consumption should place greater emphasis on
substrate rephosphorylation rather than steady-state aerobic activity common of the sport. A
relevant concept for strength coaches working with pitchers is to understand that while strength
correlates to anaerobic endurance, so does musculoskeletal efficiency: muscles fatigue slower
when they function synergistically and under reduced musculoskeletal restriction.
Sport-Specific Needs Analysis in SummaryThe root of any strength and conditioning program lies in developing actions that win games
and prevent injury. Observational data points to the fact that multidirectional movements at
high speeds often dominate sports outcomes and varied directional movements are performed
more often than linear actions. The physiological aspects of these movements inherently make
them more difficult to perform, and changes in the center of mass make them much more
fatiguing to manage compared to linear actions. Therefore, weight room activities and condi-
tioning drills should reflect the athletic demands of the sport rather than fit into a traditional
approach to strength training or bodybuilding. A needs analysis constructed from sport and
player profiles will present the defining characteristics of the program, including relevant com-
ponents of each training cycle. A periodized approach to foundational development of joint
stability and connectivity (through a full range of motion) leading into strength and power based
training will provide dramatic improvements to athletic performance. In most cases, siding with
movement efficiency, quickness, and speed as well as other defining characteristics that make the
elite athletes successful will most effectively serve the goals of athletic development.
Although endurance is often emphasized amongpitchers, greater value lies in repeated poweroutput.
DEFINITIONS
Steady-state –
A period during which the bodyfunctions using aerobic metabolismwhere oxygen utilization matchesdemands; heart rate does not vary bymore than 5 bpm

54
Chapter 2 NCSF Advanced Concepts of Strength & Conditioning
Sport Analysis for Program Development
REFERENCES:
1. Bradley, P. S., Sheldon, W., Wooster, B., Olsen, P., Boanas, P., & Krustrup, P. (2009). High-
intensity running in english FA premier league soccer matches. Journal of Sports Sciences,
27(2), 159-168.
2. Carling, C., Williams, A. M., & Reilly, T. (2005). Handbook of soccer match analysis: A
systematic approach to improving performance. New York: Routledge.
3. Di Salvo, V., Baron, R., Tschan, H., Calderon Montero, F. J., Bachl, N., & Pigozzi, F. (2007).
Performance characteristics according to playing position in elite soccer. International
Journal of Sports Medicine, 28(3), 222-227.
4. Carling, C. (2010). Analysis of physical activity profiles when running with the ball in a
professional soccer team. Journal of Sports Sciences, 28(3), 319-326.
5. Mohr, M., Krustrup, P., & Bangsbo, J. (2003). Match performance of high-standard soccer
players with special reference to development of fatigue. Journal of Sports Sciences, 21(7),
519-528.
6. Bradley, P. S., Sheldon, W., Wooster, B., Olsen, P., Boanas, P., & Krustrup, P. (2009). High-
intensity running in english FA premier league soccer matches. Journal of Sports Sciences,
27(2), 159-168.
7. Helgerud, J., Engen, L. C., Wisloff, U., & Hoff, J. (2001). Aerobic endurance training
improves soccer performance. Medicine and Science in Sports and Exercise, 33(11), 1925-
1931.
8. Rhode HC, Espersen T. Work intensity during soccer training and match play. In: Reilly
T, Lees A, David K, Murphy W (eds). Science and Football. London: E & FN Spon, 1988:
68 – 75.
9. Bloomfield, J., Polman, R., & O’Donoghue, P. (2007). Physical demands of different
positions in FA Premier League soccer. Journal of Sports Science and Medicine, 6(1), 63-70.
10. Stølen, T., Chamari, K., Castagna, C., & Wisløff, U. (2005). Physiology of soccer. Sports
Medicine, 35(6), 501-536.
11. Bangsbo, J., Iaia, F. M., & Krustrup, P. (2007). Metabolic response and fatigue in soccer.
International Journal of Sports Physiology and Performance, 2(2), 111.
12. Bloomfield, J., Polman, R., & O’Donoghue, P. (2007). Physical demands of different
positions in FA Premier League soccer. Journal of Sports Science and Medicine, 6(1), 63-70
13. Mendez-Villanueva, A., Fernandez-Fernandez, J., & Bishop, D. (2007). Exercise-induced
homeostatic perturbations provoked by singles tennis match play with reference to
development of fatigue. British Journal of Sports Medicine, 41(11), 717-722.
14. Fernandez, J., Mendez-Villanueva, A., & Pluim, B. M. (2006). Intensity of tennis match
play. British Journal of Sports Medicine, 40(5), 387-391.
15. Kovacs, M. S. (2004). Energy system-specific training for tennis. Strength and
Conditioning Journal, 26(5), 10-13.

55
NCSF Advanced Concepts of Strength & Conditioning Chapter 2
Sport Analysis for Program Development
16. Mendez-Villanueva, A., Fernandez-Fernandez, J., Bishop, D., Fernandez-Garcia, B., &
Terrados, N. (2007). Activity patterns, blood lactate concentrations and ratings of
perceived exertion during a professional singles tennis tournament. British Journal of
Sports Medicine, 41(5), 296-300.
17. Smekal, G., von Duvillard, S. P., Rihacek, C., Pokan, R.m, Hofmann, P., Baron, R., ... &
Bachl, N. (2001). A physiological profile of tennis match play. Medicine and Science in
Sports and Exercise, 33(6), 999-1005.
18. Mendez-Villanueva, A., Fernandez-Fernández, J., Bishop, D., & Fernandez-Garcia, B.
(2010). Ratings of perceived exertion-lactate association during actual singles tennis
match play. The Journal of Strength and Conditioning Research, 24(1), 165-170.
19. Reid, M., Duffield, R., Dawson, B., Baker, J., & Crespo, M. (2008). Quantification of the
physiological and performance characteristics of on-court tennis drills. British Journal of
Sports Medicine, 42(2), 146-151.
20. Hornery, D. J., Farrow, D., Mujika, I., & Young, W. (2007). An integrated physiological
and performance profile of professional tennis. British Journal of Sports Medicine, 41(8),
531-536.
21. Girard, O., & Millet, G. P. (2009). Neuromuscular fatigue in racquet sports. Physical
Medicine and Rehabilitation Clinics of North America, 20(1), 161-173.
22. Hornery, D. J., Farrow, D., Mujika, I., & Young, W. (2007). Fatigue in tennis. Sports
Medicine, 37(3), 199-212.
23. Abdelkrim, N. B., El Fazaa, S., & El Ati, J. (2007). Time–motion analysis and physiological
data of elite under-19-year-old basketball players during competition. British Journal of
Sports Medicine, 41(2), 69-75.
24. Ziv, G., & Lidor, R. (2009). Physical attributes, physiological characteristics, on-court
performances and nutritional strategies of female and male basketball players. Sports
Medicine, 39(7), 547-568.
25. Montgomery, P. G., Pyne, D. B., & Minahan, C. L. (2010). The physical and physiological
demands of basketball training and competition. International Journal of Sports
Physiology and Performance, 5(1), 75-86.
26. Ostojic, S. M., Mazic, S., & Dikic, N. (2006). Profiling in basketball: Physical and
physiological characteristics of elite players. Journal of Strength and Conditioning
Research, 20(4), 740.
27. Gonzalez, A. M., Hoffman, J. R., Rogowski, J. P., Burgos, W., Manalo, E., Weise, K., …
Stout, J. R. (2013). Performance changes in NBA basketball players vary in starters vs.
nonstarters over a competitive season. Journal of Strength and Conditioning Research,
27(3), 611.
28. Hoffman, J. R. (2008). The applied physiology of american football. International Journal
of Sports Physiology and Performance, 3(3), 387.

56
Chapter 2 NCSF Advanced Concepts of Strength & Conditioning
Sport Analysis for Program Development
29. Hoffman, J. R., Ratamess, N. A., Kang, J., Kraemer, W. J., Maresh, C. M., Newton, R. U., …
Gómez, A. L. (2002). Performance, biochemical, and endocrine changes during a
competitive football game. Medicine and Science in Sports and Exercise, 34(11), 1845-
1853.
30. Garrett, W. E., & Kirkendall, D. T. (Eds.). (2000). Exercise and Sport Science. Wolters
Kluwer Health.
31. Iosia, M. F., & Bishop, P. A. (2008). Analysis of exercise-to-rest ratios during division IA
televised football competition. The Journal of Strength and Conditioning Research, 22(2),
332-340.
32. Rankovi�, G., Mutavdži�, V., Toski�, D., Preljevi�, A., Koci�, M., Nedin-Rankovi�, G., &
Damjanovi�, N. (2010). Aerobic capacity as an indicator in different kinds of sports.
Bosnian Journal of Basic Medical Sciences, 10(1), 44-48.
33. Bompa, T. O. (1994). Theory and methodology of training: the key to athletic performance.
Kendall Hunt Publishing Company.
34. Black, W., & Roundy, E. (1994). Comparisons of size, strength, speed, and power in
NCAA Division 1-A football players. The Journal of Strength and Conditioning Research,
8(2), 80-85.
35. Garstecki, M. A., Latin, R. W., & Cuppett, M. M. (2004). Comparison of selected physical
fitness and performance variables between NCAA Division I and II football players. The
Journal of Strength and Conditioning Research, 18(2), 292-297.
36. Sierer, S. P., Battaglini, C. L., Mihalik, J. P., Shields, E. W., & Tomasini, N. T. (2008). The
National Football League Combine: performance differences between drafted and
nondrafted players entering the 2004 and 2005 drafts. The Journal of Strength and
Conditioning Research, 22(1), 6-12.
37. Berg, K., Latin, R. W., & Baechle, T. (1990). Physical and performance characteristics of
NCAA Division I football players. Research Quarterly for Exercise and Sport, 61(4), 395-
401.
38. Pincivero, D. M., & Bompa, T. O. (1997). A physiological review of American football.
Sports Medicine, 23(4), 247-260.
39. Kraemer, W. J., Torine, J. C., Silvestre, R., French, D. N., Ratamess, N. A., Spiering, B. A., …
Volek, J. S. (2005). Body size and composition of national football league players.
The Journal of Strength and Conditioning Research, 19(3), 485.
40. Noel, M. B., Vanheest, J. L., Zaneteas, P., & Rodgers, C. D. (2003). Body composition in
Division I football players. The Journal of Strength and Conditioning Research, 17(2), 228-
237.
41. Dobrosielski, D. A., Rosenbaum, D., Wooster, B. M., Merrill, M., Swanson, J., & Moore, B.
(2011). STUDENT HEALTH.
42. McGee, K. J., & Burkett, L. N. (2003). The National Football League combine: a reliable
predictor of draft status? The Journal of Strength and Conditioning Research, 17(1), 6-11.
57
NCSF Advanced Concepts of Strength & Conditioning Chapter 2
Sport Analysis for Program Development
43. Potteiger, J. A., Blessing, D. L., & Wilson, G. D. (1992). Effects of varying recovery periods
on muscle enzymes, soreness, and performance in baseball pitchers. Journal of Athletic
Training, 27(1), 27.
44. Fleisig, G. S., Barrentine, S. W., Zheng, N., Escamilla, R. F., & Andrews, J. R. (1999).
Kinematic and kinetic comparison of baseball pitching among various levels of
development. Journal of Biomechanics, 32(12), 1371-1375.
45. Carda, R. D., & Looney, M. A. (1994). Differences in physical characteristics in collegiate
baseball players. A descriptive position by position analysis. The Journal of Sports
Medicine and Physical Fitness, 34(4), 370.
46. Hoffman, J. R., Vazquez, J., Pichardo, N., & Tenenbaum, G. (2009). Anthropometric and
performance comparisons in professional baseball players. The Journal of Strength and
Conditioning Research, 23(8), 2173-2178.
47. Inkster, B., Murphy, A., Bower, R., & Watsford, M. (2010). Differences in the kinematics of
the baseball swing between hitters of varying skill. Journal of Science and Medicine in
Sport, 12, e12-e13.

58
Chapter 2 NCSF Advanced Concepts of Strength & Conditioning
Sport Analysis for Program Development


![IMPROVING THE PERFORMANCE OF SPORT’S ULTIMATE …€¦ · 2011] Improving the Performance of Sport’s Ultimate Umpire 3 sporting disputes, Judge Kéba Mbaye, an IOC member and](https://img.dokumen.tips/doc/110x75/5ec4aa0deccf907e366fed20/improving-the-performance-of-sportas-ultimate-2011-improving-the-performance.jpg)