Embed Size (px)
Citation preview
SPINE Volume 34, Number 1, pp 91–99©2008, Lippincott Williams & Wilkins
Three-Dimensional Classification of ThoracicScoliotic Curves
Archana P. Sangole, PhD,*† Carl-Eric Aubin, PhD,*† Hubert Labelle, MD,†Ian A. F. Stokes, PhD,‡ Lawrence G. Lenke, MD,§ Roger Jackson, MD,¶and Peter Newton, MD�
Study Design. Three-dimensional (3D) characteriza-tion of the thoracic scoliotic spine (cross-sectional study).
Objectives. To investigate the presence of subgroupswithin Lenke type-1 curves by evaluating the thoracic seg-ment indices extracted from 3D reconstructions of the spine,and to propose a new clinically relevant means (the daVincirepresentation) to report 3D spinal deformities.
Summary of Background Data. Although scoliosis isrecognized to be a 3D deformity of the spine its measure-ment and classification have predominantly been basedon radiographs which are 2D projections in the coronaland sagittal planes.
Methods. Thoracic segment indices derived from 3Dreconstructions of coronal and sagittal standing radio-graphs of 172 patients with right thoracic adolescent id-iopathic scoliosis, reviewed by the 3D Classification Com-mittee of the Scoliosis Research Society, were analyzedusing the ISOData unsupervised clustering algorithm.Four curve indices were analyzed: Cobb angle, axial rota-tion of the apical vertebrae, orientation of the plane ofmaximum curvature of the main thoracic curve, and ky-phosis (T4–T12). No assumptions were made regardinggrouping tendencies in the data nor were the number ofclusters predefined.
Results. Three primary groups were revealed whereinkyphosis and the orientation of the PMC of the mainthoracic curve were the major discriminating factors withslight overlap between groups. A small group (G1) of 22patients having smaller, nonsurgical (minor) curves wasidentified. Although the remaining patients had similarCobb angles they were split into 2 groups (G2: 79 patients;G3: 71 patients) with different PMC (G2: 65°–81°; G3: 76°–104°) and kyphotic measures (G2: 23°–43°; G3: 7°–25°).
Conclusion. Two distinct subgroups within the surgi-cal cases (major curves) of Lenke type-1 curves werefound thus suggesting that thoracic curves are not alwayshypokyphotic. The ISOData cluster analysis techniquehelped to capture inherent 3D structural curve complexi-ties that were not evident in a 2D radiographic plane. ThedaVinci representation is a new clinically relevant meansto report 3D spinal deformities.
Key words: cluster analysis, adolescent idiopathic scoli-osis, classification, pattern recognition, daVinci representa-tion. Spine 2009;34:91–99
Scoliosis is recognized to be a three-dimensional (3D)deformity of the spine. It has components not only in thecoronal plane but also in the sagittal and transverseplanes.1,2 Yet, its measurement and classification havepredominantly been based on radiographic assessmentswhich are two-dimensional (2D) projections of the spinein the coronal and sagittal planes. Evaluating these pro-jections requires a sense of abstraction and visualizationto generate a 3D perspective not only of the spine curva-ture that is going to be treated but also of the curvaturethat could possibly result from a particular surgical in-strumentation strategy. The inability to describe thethird dimension of scoliosis makes the task all the moredifficult. Hence the efforts of the Scoliosis Research So-ciety (SRS) 3D Classification Working Group (1994) to-wards developing more descriptive indices of the scoli-otic spine helped to better characterize the spinaldeformity and subsequently describe the third dimensionof scoliosis. Recent advances in technology now allow usto have access to more sophisticated algorithms andcomputing techniques that can be used to facilitate ourunderstanding of scoliosis as a 3D deformity and thuscreate more clinically relevant representations of the de-formity.3–5
The initial attempts at classification of adolescent id-iopathic scoliosis (AIS) began in the 1950s, one beingPonseti and Friedman.6 Classification of thoracic AISwas first presented in the classic article by King et al7
wherein 5 types of curves were described. Based on thisclassification they proposed recommendations for select-ing fusion levels in patients with thoracic idiopathic sco-liosis. Stokes and Aronsson8,9 reported better reliabilityin the King classification if a computer-assisted rule-based algorithm is used as opposed to a subjective eval-uation of radiographic features.
Since the King classification, several others have fol-lowed and proposed ways to classify scoliotic curves in a
From the *Department of Mechanical Engineering, Ecole Polytech-nique de Montreala, Quebec, Canada; †Sainte-Justine University Hos-pital Centre, Quebec, Canada; ‡Department of Orthopedics and Re-habilitation, University of Vermont, Burlington, VT; §Department ofOrthopedic Surgery, WA University, St. Louis, MO; ¶Department ofSpine Surgery, North Kansas City Hospital, North Kansas City, MO;and �Department of Orthopedics, Rady Children’s Hospital, San Di-ego, CA.Acknowledgment date: May 16, 2008. Acceptance date: May 26,2008.The manuscript submitted does not contain information about medicaldevice(s)/drug(s).Federal (Natural Sciences and Engineering Research Council of Can-ada) and Other (Scoliosis Research Society) funds were received insupport of this work. No benefits in any form have been or will bereceived from a commercial party related directly or indirectly to thesubject of this manuscript.Supported by grants from Federal (Natural Sciences and EngineeringResearch Council of Canada) and other (Scoliosis Research Society)funds received for this work.Address correspondence and reprint requests to Archana P. Sangole,PhD, PEng, Ecole Polytechnique, Department of Mechanical Engineer-ing, P.O. Box 6079, Station Centre-ville, Montreal (Quebec), H3C3A7, Canada; E-mail: [email protected]
91
clinically meaningful manner. A few of these were stilllimited by the fact that only coronal radiographs weretaken into consideration.10 The Lenke classification sys-tem that uses measurements in both coronal and sagittalplanes was introduced in 1997, and has reasonably goodreproducibility rating11–15 as compared with the Kingclassification system.16 It is now used extensively andcontinues to be further developed with the addition ofnew indices such as the deformity score or the Lenke-Harms score.17 Although the King classification primar-ily focused on thoracic curves, the Lenke classificationapproaches the issue in a more global sense by proposinga generic classification scheme that also considers thethoracolumbar/lumbar (TL/L) curves.
In an attempt to improve on visual pattern recognitionby employing automated classification, Duong et al 18
proposed an unsupervised clustering technique called theFuzzy k-means technique to classify the spine curves us-ing shape descriptors derived from 3D reconstructionmodels of the spine. They identified 5 basic classes ofspine curve patterns, which are also present in the Kingand Lenke classifications and the respective subtypes ac-cordingly divided to reflect clinically identifiable changesin the sagittal plane. The classification method however,is quite complex because it requires knowledge aboutsignal processing techniques and involves the computa-tion of additional parameters that are not intuitiveenough to be easily interpreted from the current spinecurvature evaluation procedures.
Finding a clinically relevant classification scheme thatproperly reflects the 3D nature of scoliosis deformity re-quires defining better indices to characterize the thirddimension of scoliosis. Examples such as the torsionalcomponent19 and axial rotation (Stokes)20 have not yetbeen used in the clinics because of the need for additionalmeasurement tools and the complexity in interpretation.Despite all these efforts to employ classifications of spinalshape and deformity to standardize surgical decisions,there remains substantial variability in surgical planning,primarily due to the surgeon-specific surgical instrumen-tation preferences.21 These efforts should however, bedirected towards defining a classification system that per-ceives scoliosis as a 3D spinal deformity and that whichrelies on indices of curve patterns derived from coronal andsagittal radiographs so that it is intuitive to the surgeons.
The success of a classification scheme largely dependson the characterization of the deformity and thus theindices used to describe it. The current methods are pri-marily based on indices defined in 2D planes. The prob-lem is not so much with the indexes used but rather thefundamental nature of the classification schemes i.e., theselective use of an index by projecting the spine onto asingle plane and using that as a basis for classification. Ifthe same indices are considered collectively, then to-gether, they represent a 3D characterization of the defor-mity and the classification scheme thus defined will nowbe based on the 3D definition of the deformity.
In view of the findings from existing studies, the SRSrecognizes the need for 3D classification and mandatesthe 3D classification working group to continue theirefforts towards developing a 3D scheme for characteriz-ing scoliosis. This study is part of the same effort and thearticle presents some of the recent work completed by thecommittee. The objectives are to analyze the presence ofsubgroups within Lenke type-1 curves by evaluating thethoracic segment indices extracted from 3D reconstruc-tions of the spine, and to propose a new clinically rele-vant means (the daVinci representation) to report 3Dspinal deformities.
Materials and Methods
Patients and Spine IndicesOne hundred seventy-two patients with right thoracic AIS clas-sified as Lenke type 1 by members of the 3D ClassificationCommittee of the SRS were studied. The average age at the timeof the visit was 15 � 2 years and the mean thoracic Cobb anglewas 43 � 14° (range, 10°–76°). For each patient, a 3D recon-struction of the spine was obtained from calibrated biplanarradiographs.3 The reconstructed models were then used tocompute 4 indices of the thoracic segment: the Cobb angle,thoracic kyphosis (measured from T4–T12), axial rotation ofthe apical vertebra, and the orientation of the plane of maxi-mum curvature with respect to the sagittal plane.22,2 Measure-ments of coronal and sagittal plane curvature were based on acurve fitted mathematically through the centers of the verte-brae. For the scoliosis measurement, inflection points of thisline were identified in the coronal plane, and the angle betweenperpendicular lines at these points provided a measure of sco-liosis analogous to the Cobb angle.23 For the kyphosis measure
Figure 1. Planes of maximum curvature (PMC) for the proximalthoracic, main thoracic, and lumbar segments.
92 Spine • Volume 34 • Number 1 • 2009
in the sagittal plane, the angle between tangents at the positionsof T4 and T12 were used. Axial rotation of the apical vertebraewas measured about the z-axis in the local XY-plane.24 Foreach segment of the spine, the plane of maximum curvature(PMC) was constructed using the 2 end vertebrae and the apexand their orientation was computed with respect to the sagittalplane (see Figure 1). These 4 indices, when considered collec-tively represent a “signature” of the scoliotic spine. The 4 pa-
rameters can be considered as defining the shape (vector) ofthat patient’s spine in 3D space.
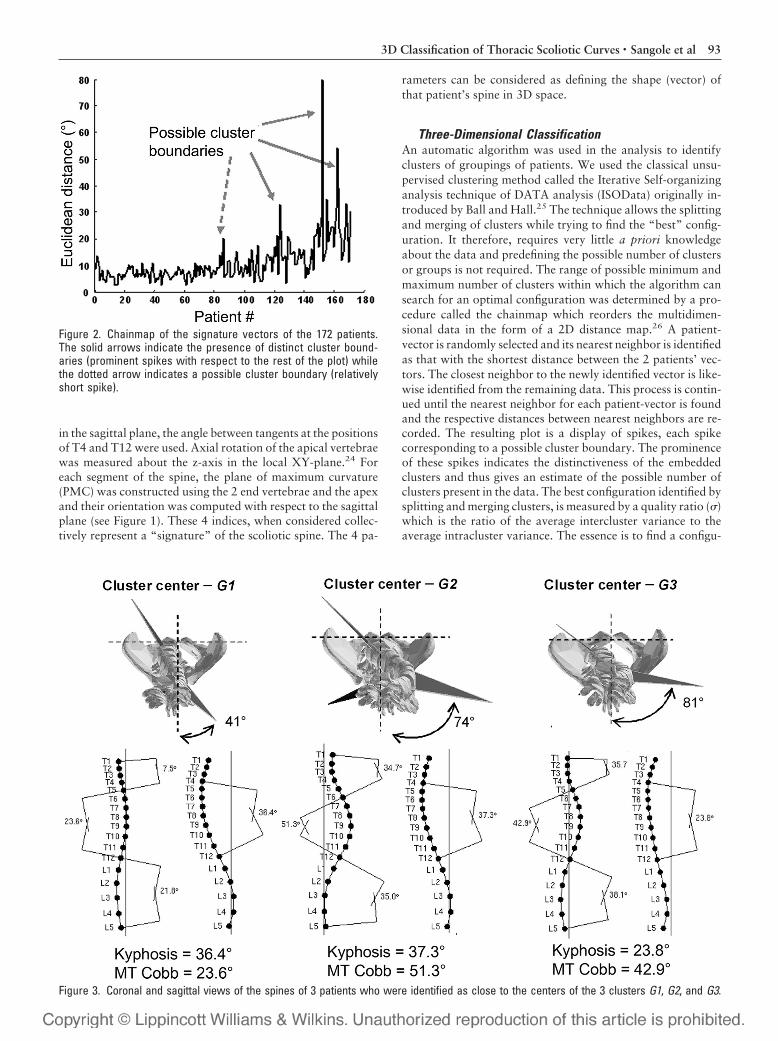
Three-Dimensional ClassificationAn automatic algorithm was used in the analysis to identifyclusters of groupings of patients. We used the classical unsu-pervised clustering method called the Iterative Self-organizinganalysis technique of DATA analysis (ISOData) originally in-troduced by Ball and Hall.25 The technique allows the splittingand merging of clusters while trying to find the “best” config-uration. It therefore, requires very little a priori knowledgeabout the data and predefining the possible number of clustersor groups is not required. The range of possible minimum andmaximum number of clusters within which the algorithm cansearch for an optimal configuration was determined by a pro-cedure called the chainmap which reorders the multidimen-sional data in the form of a 2D distance map.26 A patient-vector is randomly selected and its nearest neighbor is identifiedas that with the shortest distance between the 2 patients’ vec-tors. The closest neighbor to the newly identified vector is like-wise identified from the remaining data. This process is contin-ued until the nearest neighbor for each patient-vector is foundand the respective distances between nearest neighbors are re-corded. The resulting plot is a display of spikes, each spikecorresponding to a possible cluster boundary. The prominenceof these spikes indicates the distinctiveness of the embeddedclusters and thus gives an estimate of the possible number ofclusters present in the data. The best configuration identified bysplitting and merging clusters, is measured by a quality ratio (�)which is the ratio of the average intercluster variance to theaverage intracluster variance. The essence is to find a configu-
Figure 2. Chainmap of the signature vectors of the 172 patients.The solid arrows indicate the presence of distinct cluster bound-aries (prominent spikes with respect to the rest of the plot) whilethe dotted arrow indicates a possible cluster boundary (relativelyshort spike).
Figure 3. Coronal and sagittal views of the spines of 3 patients who were identified as close to the centers of the 3 clusters G1, G2, and G3.
933D Classification of Thoracic Scoliotic Curves • Sangole et al
ration that gives maximal separation between clusters and min-imal variance within clusters.
� ��average(inter � cluster variance)
�average(intra � cluster variance)(1)
Clusters are merged if (1) there are very few samples assigned toit, (2) if the number of clusters exceeds the maximal range, or(3) if the clusters are too close to each other. Clusters are split if(1) the size of a cluster is too large, or (2) if the number ofclusters falls below the minimal range. Only criterion 2 wasused in merging and splitting clusters because this reduced theneed for a priori assumptions about the data. Additional detailsabout the methods can be found in Ball and Hall, Levinson et aland Memarsadeghi et al.25–27
The ISOData clustering algorithm was applied to only mainthoracic curves and grouping tendency was evaluated by exam-ining the indices of representative cases from each group. The objec-tive was to examine the presence of subtypes within the Lenke-1curves. The default initial number of clusters, in all the tests, wasset at 10. No a priori assumptions were made concerning un-derlying grouping tendencies or the predefined number of
groups. A 1-way ANOVA was done to examine the influence ofthe various parameters on the grouping tendency.
Results
A chainmap of the thoracic indices shows 3 prominentspikes relative to the rest of the plot thus indicating thepresence of at least 3 clusters and a possible fourth clus-ter indicated by a shorter spike (Figure 2). The ISODatacluster analysis revealed a small group of patients havingsmaller, nonsurgical (minor) curves (G1 � 22 cases) and2 groups of surgical (major curves) cases with distinctkyphosis and plane of maximum curvature parameters(G2 � 79 cases, G3 � 71 cases). Coronal and sagittalspine profiles of the representative cases that were iden-tified as the cluster centers are illustrated in Figure 3. Thefigure shows the coronal and sagittal profiles of the pa-tients and the respective kyphosis, MT Cobb angle andthe thoracic plane of maximum curvature orientation.The average values of the thoracic indices within eachcluster differed (Table 1) and indicated the presence of anonsurgical group (G1) and 2 surgical groups (G2 andG3).
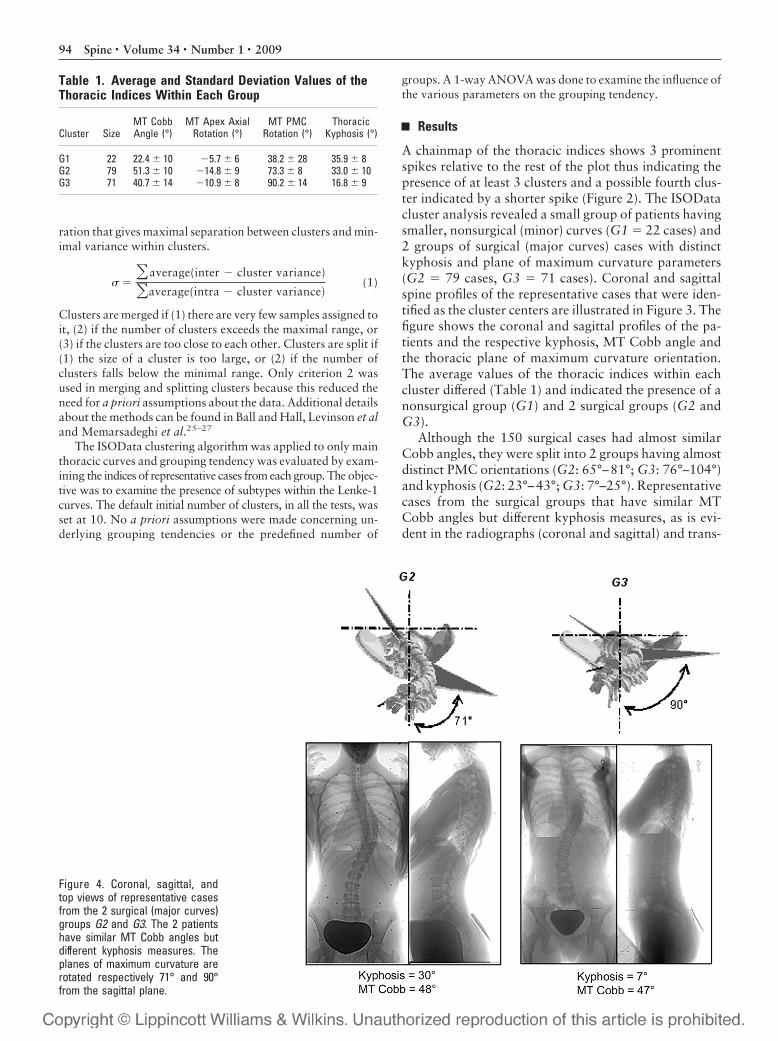
Although the 150 surgical cases had almost similarCobb angles, they were split into 2 groups having almostdistinct PMC orientations (G2: 65°–81°; G3: 76°–104°)and kyphosis (G2: 23°–43°; G3: 7°–25°). Representativecases from the surgical groups that have similar MTCobb angles but different kyphosis measures, as is evi-dent in the radiographs (coronal and sagittal) and trans-
Figure 4. Coronal, sagittal, andtop views of representative casesfrom the 2 surgical (major curves)groups G2 and G3. The 2 patientshave similar MT Cobb angles butdifferent kyphosis measures. Theplanes of maximum curvature arerotated respectively 71° and 90°from the sagittal plane.
Table 1. Average and Standard Deviation Values of theThoracic Indices Within Each Group
Cluster SizeMT CobbAngle (°)
MT Apex AxialRotation (°)
MT PMCRotation (°)
ThoracicKyphosis (°)
G1 22 22.4 � 10 �5.7 � 6 38.2 � 28 35.9 � 8G2 79 51.3 � 10 �14.8 � 9 73.3 � 8 33.0 � 10G3 71 40.7 � 14 �10.9 � 8 90.2 � 14 16.8 � 9
94 Spine • Volume 34 • Number 1 • 2009
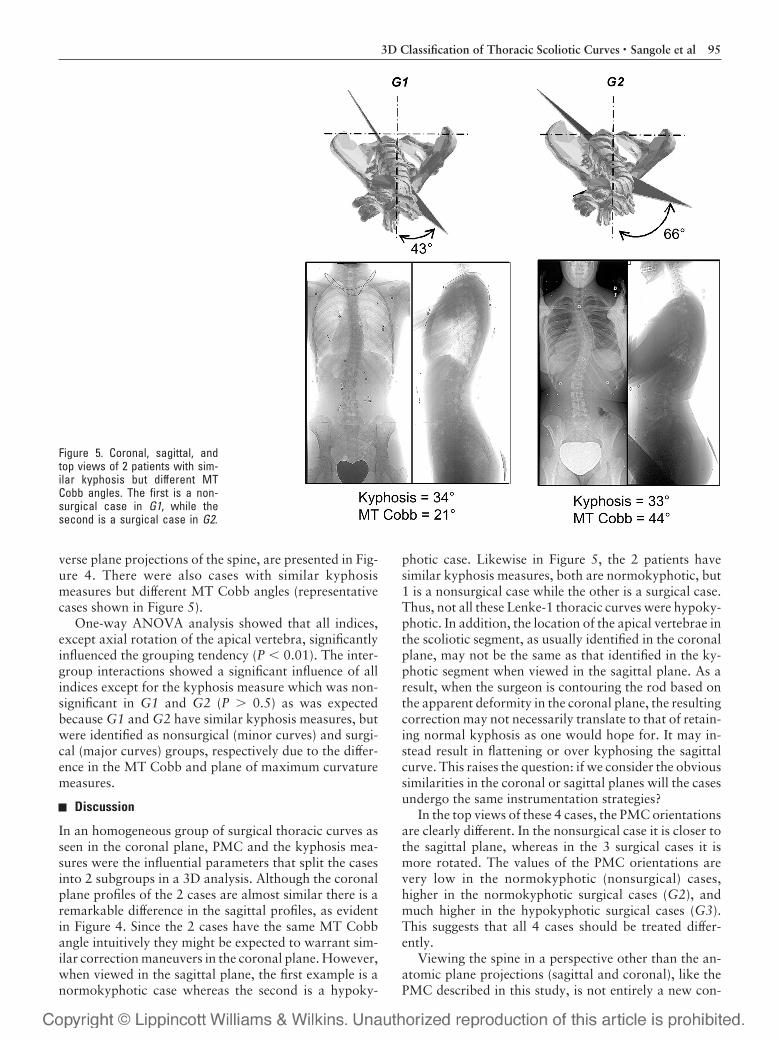
verse plane projections of the spine, are presented in Fig-ure 4. There were also cases with similar kyphosismeasures but different MT Cobb angles (representativecases shown in Figure 5).
One-way ANOVA analysis showed that all indices,except axial rotation of the apical vertebra, significantlyinfluenced the grouping tendency (P � 0.01). The inter-group interactions showed a significant influence of allindices except for the kyphosis measure which was non-significant in G1 and G2 (P � 0.5) as was expectedbecause G1 and G2 have similar kyphosis measures, butwere identified as nonsurgical (minor curves) and surgi-cal (major curves) groups, respectively due to the differ-ence in the MT Cobb and plane of maximum curvaturemeasures.
Discussion
In an homogeneous group of surgical thoracic curves asseen in the coronal plane, PMC and the kyphosis mea-sures were the influential parameters that split the casesinto 2 subgroups in a 3D analysis. Although the coronalplane profiles of the 2 cases are almost similar there is aremarkable difference in the sagittal profiles, as evidentin Figure 4. Since the 2 cases have the same MT Cobbangle intuitively they might be expected to warrant sim-ilar correction maneuvers in the coronal plane. However,when viewed in the sagittal plane, the first example is anormokyphotic case whereas the second is a hypoky-
photic case. Likewise in Figure 5, the 2 patients havesimilar kyphosis measures, both are normokyphotic, but1 is a nonsurgical case while the other is a surgical case.Thus, not all these Lenke-1 thoracic curves were hypoky-photic. In addition, the location of the apical vertebrae inthe scoliotic segment, as usually identified in the coronalplane, may not be the same as that identified in the ky-photic segment when viewed in the sagittal plane. As aresult, when the surgeon is contouring the rod based onthe apparent deformity in the coronal plane, the resultingcorrection may not necessarily translate to that of retain-ing normal kyphosis as one would hope for. It may in-stead result in flattening or over kyphosing the sagittalcurve. This raises the question: if we consider the obvioussimilarities in the coronal or sagittal planes will the casesundergo the same instrumentation strategies?
In the top views of these 4 cases, the PMC orientationsare clearly different. In the nonsurgical case it is closer tothe sagittal plane, whereas in the 3 surgical cases it ismore rotated. The values of the PMC orientations arevery low in the normokyphotic (nonsurgical) cases,higher in the normokyphotic surgical cases (G2), andmuch higher in the hypokyphotic surgical cases (G3).This suggests that all 4 cases should be treated differ-ently.
Viewing the spine in a perspective other than the an-atomic plane projections (sagittal and coronal), like thePMC described in this study, is not entirely a new con-
Figure 5. Coronal, sagittal, andtop views of 2 patients with sim-ilar kyphosis but different MTCobb angles. The first is a non-surgical case in G1, while thesecond is a surgical case in G2.
953D Classification of Thoracic Scoliotic Curves • Sangole et al

cept. For instance, Stagnara’s plan d’election,28 an oldconcept introduced a long time ago, viewed the spineusing an oblique perspective, according to the most ro-tated vertebra along the local vertebral frontal plane.However, the PMC is a different concept as it is a re-gional viewing of the spine according to the relative po-sition of the apical vertebra with respect to the end ver-tebrae of a given spine segment. In a symmetrical spinePMC lies in the sagittal plane. In the presence of scoliosis,its orientation represents a composition of the coronalplane deformity and of the sagittal plane physiologic ky-phosis (Figure 6), which may not always correspond toprojections in the sagittal and coronal planes that arenormally used in surgical planning.
In this analysis as well as in that by Aubin et al and byVillemure et al,22,2 the PMC orientation has been iden-tified as an influential parameter descriptive of the scoli-otic deformity. However, it is not a measure that is usedin the clinics primarily because of the difficulty in obtain-ing images of the PMC, or the need for 3D reconstructionsoftware dedicated for evaluating the PMC and in quan-tifying it.
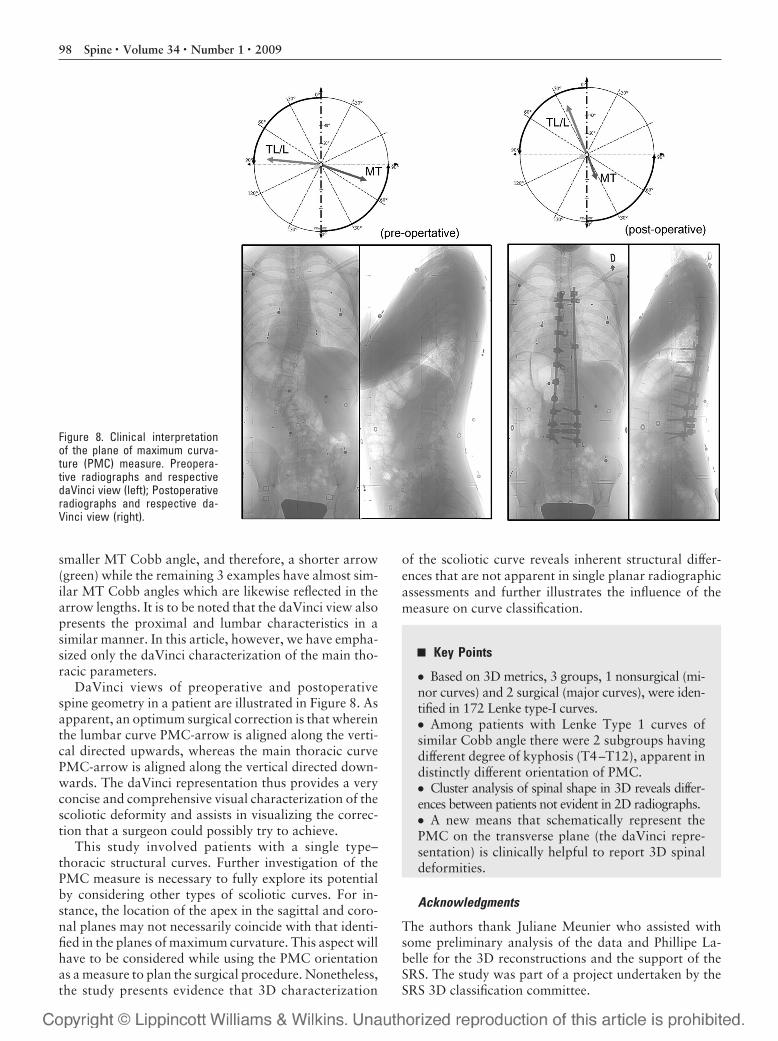
Careful attention must be given to the interpretationof the perceived spine curvature in the PMC plane. Onepossible strategy to derive clinically meaningful informa-tion from the PMC measure is to examine the spine pro-jections in the transverse view and relate the measure tothe more commonly used sagittal and coronal projectionsto establish its clinical relevance. The SRS committee recentlyintroduced a schematic representation called the daVinciview (see Figure 6). The “daVinci representation” (rightpanel of Figure 6) is a comprehensive visual representa-tion of the scoliotic spine that illustrates the orientation
of the planes of maximum curvature of the 3 spine seg-ments in the transverse view. The center of the circularplot is the point where the central hip vertical axis(CHVA, CHVA is a true vertical bisecting the bi-femoralhead axis, often considered to represent the physiologicalcenter of balance of the spine-pelvic unit) intersects thetransverse plane and every arrow radiating from the cen-ter represents a spine segment (PT, MT, and TL/L). Thelength of the arrow is proportional to the amplitude ofthe curve, its coronal projection reflects coronal defor-mity (measured using the Cobb method) while its sagittalprojection reflects the sagittal curvature. Thus Cobb an-gles and sagittal curvature measures of the PT, MT, andTL/L spine segments are reflected in the respective coro-nal and sagittal components as illustrated in Figure 6(right panel). The orientation of the arrows relative tothe sagittal plane is a measure of the PMC orientationfor the different spine segments. The position of the cen-tral sacral vertical line (CSVL, CSVL is a true vertical inthe coronal plane drawn through the posterior center ofthe S1 endplate) relative to the CHVA can also be viewedby their respective projections [CSVL: black dot con-nected to the origin (CHVA)] in the transverse planeprojection of the spine (illustrated in the left panel ofFigure 6). The relative orientation of the CSVL andCHVA reflects the pivotal balance between the spine andthe pelvis.
If we revisit the cases illustrated in Figures 4 and 5,and examine the respective daVinci views (Figure 7), thenonsurgical example (Figure 7A) has low PMC orienta-tion, moderate PMC values for the 2 examples from G2(Figure 7B, C) and relative high PMC value in the exam-ple from G3 (Figure 7D). The nonsurgical example has a
Figure 6. The daVinci view rep-resentation. The picture on theleft shows the coronal and sag-ittal radiographs, the splinecurve representing the spine andthe planes of maximum curvature(PMC) for the proximal thoracic(PT), main thoracic (MT), andthoracolumbar/lumbar (TL/L)segments. The true daVinci viewis a top view projection of the 3planes of maximum curvature.The simplified daVinci represen-tation is illustrated on the rightwherein the triangles are re-placed by an arrow projectingfrom the center to the apex of thetriangle. The length of the arrowis proportional to the curvature,its horizontal projection reflectsthe magnitude of coronal defor-mity while its vertical projectionreflects sagittal component ofthe deformity. Position of theCSVL (black dot) with respect toCHVA (origin) is also illustrated inthe true daVinci view on the left.
96 Spine • Volume 34 • Number 1 • 2009

Figure 7. Top views (left column)of the representative cases fromFigures 4 and 5 the respectivedaVinci representations (rightcolumn). A, Representative casefrom G1, B, C, Representativecase from G2, D, Representativecase from G3. The dotted arrowshows the PMC orientation as in-dicated in the respective topviews in the left column.
973D Classification of Thoracic Scoliotic Curves • Sangole et al
smaller MT Cobb angle, and therefore, a shorter arrow(green) while the remaining 3 examples have almost sim-ilar MT Cobb angles which are likewise reflected in thearrow lengths. It is to be noted that the daVinci view alsopresents the proximal and lumbar characteristics in asimilar manner. In this article, however, we have empha-sized only the daVinci characterization of the main tho-racic parameters.
DaVinci views of preoperative and postoperativespine geometry in a patient are illustrated in Figure 8. Asapparent, an optimum surgical correction is that whereinthe lumbar curve PMC-arrow is aligned along the verti-cal directed upwards, whereas the main thoracic curvePMC-arrow is aligned along the vertical directed down-wards. The daVinci representation thus provides a veryconcise and comprehensive visual characterization of thescoliotic deformity and assists in visualizing the correc-tion that a surgeon could possibly try to achieve.
This study involved patients with a single type–thoracic structural curves. Further investigation of thePMC measure is necessary to fully explore its potentialby considering other types of scoliotic curves. For in-stance, the location of the apex in the sagittal and coro-nal planes may not necessarily coincide with that identi-fied in the planes of maximum curvature. This aspect willhave to be considered while using the PMC orientationas a measure to plan the surgical procedure. Nonetheless,the study presents evidence that 3D characterization
of the scoliotic curve reveals inherent structural differ-ences that are not apparent in single planar radiographicassessments and further illustrates the influence of themeasure on curve classification.
Key Points
● Based on 3D metrics, 3 groups, 1 nonsurgical (mi-nor curves) and 2 surgical (major curves), were iden-tified in 172 Lenke type-I curves.● Among patients with Lenke Type 1 curves ofsimilar Cobb angle there were 2 subgroups havingdifferent degree of kyphosis (T4–T12), apparent indistinctly different orientation of PMC.● Cluster analysis of spinal shape in 3D reveals differ-ences between patients not evident in 2D radiographs.● A new means that schematically represent thePMC on the transverse plane (the daVinci repre-sentation) is clinically helpful to report 3D spinaldeformities.
Acknowledgments
The authors thank Juliane Meunier who assisted withsome preliminary analysis of the data and Phillipe La-belle for the 3D reconstructions and the support of theSRS. The study was part of a project undertaken by theSRS 3D classification committee.
Figure 8. Clinical interpretationof the plane of maximum curva-ture (PMC) measure. Preopera-tive radiographs and respectivedaVinci view (left); Postoperativeradiographs and respective da-Vinci view (right).
98 Spine • Volume 34 • Number 1 • 2009
References
1. Carpineta L, Labelle H. Evidence of three-dimensional variability in scolioticcurves. Clin Orthop Relat Res 2003;412:139–48.
2. Villemure I, Aubin CE, Grimard G, et al. Progression of vertebral and spinalthree-dimensional deformities in adolescent idiopathic scoliosis: a longitudi-nal study. Spine 2001;26:2244–50.
3. Delorme S, Petit Y, DeGuise JA, et al. Assessment of the 3D reconstruntionand high-resolution geometric modeling of the human skeletal trunk from2D radiographic images. IEEE Trans Biomed Eng 2003;50:989–98.
4. Cheriet F, Laporte C, Kadoury S, et al. A novel system for the 3D reconstruc-tion of the human spine and rib cage from biplanar X-ray images. IEEETrans Biomed Eng 2007;54:1356–8.
5. Kadoury S, Cheriet F, Laporte C, et al. A versatile 3D reconstruction systemof the spine and pelvis for clinical assessment of spinal deformities. Med BiolEng Comput 2007;45:591–602.
6. Ponseti IV, Friedman B. Prognosis in idiopathic scoliosis. J Bone Joint Surg1950;32A:381–95.
7. King HA, Moe JH, Bradford DS, et al. The selection of fusion levels inthoracic idiopathic scoliosis. J Bone Joint Surg 1983;65:1302–13.
8. Stokes IA, Aronsson DD. Identifying sources of variability in scoliosis clas-sification using a rule-based automated algorithm. Spine 2002;27:2801–5.
9. Stokes IA, Aronsson DD. Computer-assisted algorithms improve reliabilityof King classification and cobb angle measurement of scoliosis. Spine 2006;31:665–70.
10. Coonrad RW, Murell GAC, Mothey G. A logical coronal pattern classifica-tion of 2000 consecutive idiopathic scoliosis cases based on the scoliosisresearch society-defined apical vertebra. Spine 1998;1380–1391.
11. Lenke LG, Betz RR, Bridwell KH, et al. Intraobserver and interobserverreliability of the classification of thoracic adolescent idiopathic scoliois.J Bone Joint Surg 1998;80A:1097–106.
12. Lenke LG, Betz RR, Harms J, et al. Adolescent idiopathic scoliosis: a newclassification to determine extent of spinal arthrodesis. J Bone Joint Surg2001;83:1169–81.
13. Lenke LG, Betz RR, Clements D, et al. Curve prevelance of a new classifica-tion of operative adolescent idiopathic scoliosis. Spine 2002;27:604–11.
14. Puno RM, An KC, Puno RL, et al. Treatment recommendations for idio-pathic scoliosis: an assessment of the Lenke classification. Spine 2003;28:2102–15.
15. Cil A, Pekmezci M, Yazici M, et al. The validity of Lenke criteria for defining
structural proximal thoracic curves in patients with adolescent idiopathicscoliosis. Spine 2005;30:2550–5.
16. Cummings RJ, Loveless EA, Campbell J, et al. Interobserver reliability andintraobserver reproducibility of the system of King et al. for the classificationof adolescent idiopathic scoliosis. J Bone Joint Surg 1998;80A:1107–11.
17. D’Andrea LP, Betz RR, Lenke LG, et al. Do radiographic parameters corre-late with clinical outcomes in adolescent idiopathic scoliosis. Spine 2000;25:1795–802.
18. Duong L, Cheriet F, Labelle H. Three-dimensional classification of spinaldeformities using fuzzy clustering. Spine 2006;31:923–30.
19. Poncet P, Dansereau J, Labelle H. Geometric torsion in idiopathic scoliosis:three-dimensional analysis and proposal for a new classification. Spine 2001;26:2235–43.
20. Stokes IA. Axial rotation component of thoracic scoliois. J Orthop Res2005;7:702–8.
21. Robitaille M, Aubin CE, Labelle H. Intra and interobserver variability ofpreoperative planning for surgical instrumentation in adolescent idiopathicscoliosis. Eur Spine J 2007;16:1604–14.
22. Aubin CE, Lobeau D, Labelle H, et al. Planes of maximum deformity in thescoliotic spine. In: Stokes IAF, ed. Research into Spinal Deformities. Amster-dam, The Netherland: IOS Press; 1999;45–48.
23. Stokes IA, Bigalow LC, Moreland MS. Three-dimensional spinal curvaturein idiopathic scoliosis. J Orthop Res 1987;5:102–13.
24. Stokes IA. Three-dimensional terminology of spinal deformity. A reportpresented to the Scoliosis Research Society by the Scoliosis Research SocietyWorking Group on 3D terminology of spinal deformity. Spine 1994;19:236–48.
25. Ball GH, Hall DJ. ISOData – an iterative method of multivariate analysis andpattern classification. Proc IFIPS Congr. 1965.
26. Levinson SE, Rabiner LR, Rosenberg AE, et al. Interactive clustering tech-nique for selecting speaker-independent reference templates for isolatedword recognition. IEEE Trans Acoust 1979;27:134–41.
27. Memarsadeghi N, Mount DM, Netanyahu NS, et al. A fast implementationof the ISOData clustering algorithm. In: Proceedings of the IEEE Interna-tional Geoscience and Remote Sensing Symposium (IGARSS’03); 2003;vol.III:2057–2059; Toulouse, France.
28. du Peloux J, Fauchet R, Faucon B, et al. Le plan d’election pour l’examenradiologique des cyphoscolioses. Rev Chir Orthop Reparatrice Appar Mot1965;51:517–24.
993D Classification of Thoracic Scoliotic Curves • Sangole et al


![SPINE Volume 27, Number 17, pp 1896–1910 ©2002, Lippincott ... · systematic review, low back pain, massage, efficacy, ef-fectiveness, Cochrane Collaboration] Spine 2002;27:1896-1910](https://img.dokumen.tips/doc/110x75/5f9940da04686f155267207b/spine-volume-27-number-17-pp-1896a1910-2002-lippincott-systematic-review.jpg)