Embed Size (px)
Citation preview

Therapeutics, Targets, and Chemical Biology
Sphingosine Kinase 2 Promotes Acute LymphoblasticLeukemia by Enhancing MYC Expression
Craig T.Wallington-Beddoe1, JasonA. Powell3, DaochenTong1, StuartM.Pitson3, Kenneth F. Bradstock2, andLinda J. Bendall1
AbstractSphingosine kinase 2 (SK2) may have utility as a prognostic marker in inflammatory diseases such as
cancer in which it has been rationalized as a candidate therapeutic target. Here, we show that SK2 has anoncogenic role in acute lymphoblastic leukemia (ALL) by influencing expression of MYC. Genetic ablationof SK2 impaired leukemia development in a mouse model of ALL and pharmacologic inhibition extendedsurvival in mouse xenograft models of human disease. SK2 attenuation in both the settings reduced MYCexpression in leukemic cells, with reduced levels of acetylated histone H3 within the MYC gene associatedwith reduced levels of MYC protein and expression of MYC-regulated genes. Our results demonstratedthat SK2 regulates MYC, which has a pivotal role in hematologic malignancies, providing a preclinical proofof concept for this pathway as a broad-based therapeutic target in this setting. Cancer Res; 74(10); 2803–15.�2014 AACR.
IntroductionSphingosine kinases (SK) 1 and 2 catalyze the synthesis of
sphingosine 1-phosphate (S1P) from sphingosine (1). Over-expression of SK1 has indisputable tumor-promoting proper-ties (2) and has been associated with poor survival in patientswith solid tumor (3–5), resistance to imatinib in chronicmyeloid leukemia (CML; refs. 6–8), and to daunorubicin inacute myeloid leukemia cells (9). In contrast, the role of SK2 incancer is less clear. While overexpression suppressed cellgrowth and induced apoptosis (1), knockdown of SPHK2 inglioblastoma cells inhibited proliferation more effectively thanknockdown of SPHK1, and SPHK2-deficient breast cancer cellsproliferated poorly in vivo (5, 10, 11). SK2 has basal activity thatis enhanced by extracellular signal–regulated kinase (ERK)–mediated phosphorylation (12), placing it downstream of thesignaling pathways frequently activated in malignancies,including B-Raf, Ras, Jak, and Flt3 (13, 14), all of which canactivate ERK (15).S1P is best known for its extracellular effects mediated
through G protein–coupled receptors, S1P1 to S1P5. S1P can
also act intracellularly by direct modulation of histonedeacetylase (HDAC) activity and the ubiquitin ligase activityof tumor necrosis factor receptor–associated factor 2(TRAF2; ref. 1). In the nucleus, SK2 binds directly to HDACswhere locally produced S1P inhibits HDAC1 and 2, increas-ing acetylation of histone H3 on Lys9, H4 on Lys5, and H2B onLys12 (16). Gene expression of the cell-cycle inhibitor p21 andtranscriptional regulator c-fos is subsequently increased,providing an explanation for the reported growth-inhibitoryeffects of SK2.
The Myc proto-oncogene protein (c-Myc) is overexpressedacross a diverse range of human cancers (17), includinghematologic malignancies, playing a role in both tumorinitiation and maintenance (18). In acute lymphoblasticleukemia (ALL), the role of c-Myc has not been extensivelyexplored; however, translocations involving MYC have beenreported in some cases (19, 20). Normally MYC expression istightly controlled by transcriptional regulatory motifs in itsproximal promoter region (21); however, epigenetic mod-ifications can also influence the expression of MYC, includ-ing in ALL (22).
We demonstrate that a gene signature consistent withincreased SK2 activity is present in ALL patient diagnosticsamples and that SK2 protein is overexpressed and activated inALL cells. Inhibition of SK2 kills B-lineage ALL cells andsynergizes with the proteasome inhibitor bortezomib and withimatinib in Philadelphia chromosome–positive (Phþ) cells invitro. SK2 inhibition reduced expression of MYC mRNA, pro-tein, and c-Myc target genes. Reduced association of acetylatedhistone H3 with MYC was observed, a finding consistent withthe effect being mediated by the role of SK2 in histoneacetylation. In vivo, SK2 inhibition showed significant antileu-kemic effects in a human xenograft model of ALL, andenhanced the efficacy of imatinib, resulting in increased
Authors' Affiliations: 1Westmead Institute for Cancer Research, West-meadMillennium Institute,University of Sydney; 2HematologyDepartment,Westmead Hospital, Westmead, Sydney, New South Wales; and 3Centrefor Cancer Biology, University of South Australia and SA Pathology,Adelaide, South Australia, Australia
Note: Supplementary data for this article are available at Cancer ResearchOnline (http://cancerres.aacrjournals.org/).
Corresponding Author: Linda J. Bendall, Westmead Institute for CancerResearch, Westmead Millennium Institute, University of Sydney, PO Box412, Westmead New South Wales 2145, Australia. Phone: 61-2-9845-9069; Fax: 61-2-9845-9102; E-mail: [email protected]
doi: 10.1158/0008-5472.CAN-13-2732
�2014 American Association for Cancer Research.
CancerResearch
www.aacrjournals.org 2803
on May 25, 2018. © 2014 American Association for Cancer Research. cancerres.aacrjournals.org Downloaded from
Published OnlineFirst March 31, 2014; DOI: 10.1158/0008-5472.CAN-13-2732

survival in mice bearing a Phþ xenograft. Furthermore, dele-tion of Sphk2 significantly reduced leukemia development in amurine model of BCR/ABL–driven ALL.
Materials and MethodsCells
Cell lines used were ALL1 (Dr. J. Radich, Fred HutchinsonCancer Research Center, Seattle, OR), 2070 (23), TOM1 (Prof.J. Melo, IMVS, Adelaide, South Australia), REH, K562 (bothfrom American Type Culture Collection), NALM6 (DeutscheSammlung von Mikroorganismen und Zellkulturen GmbH),LK63 (Prof. A. Boyd, QIMR, Brisbane, Queensland), and stro-mal-dependent ALL lines derived in our laboratory frompatient samples (2032, 1345, 2070, and 1809). Leukemic blastswere obtained from patients with ALL with informed consentand institutional ethics committee approval from the SydneyWest Area Health Service Human Research Ethics Committee.Spleen cells from previously xenografted animals were usedin the in vivo experiments except sample 2070, in which cryo-preserved patient cells were used. Patient details are in Sup-plementary Table S1 and previous articles (23, 24).
Antibodies and reagentsABC294640 was obtained from Enzo Life Sciences, the
SK1 inhibitor PF543 was obtained from Merck Millipore,and SK1-I from Tocris Bioscience, the c-Myc inhibitor,10058-F4, and 3-methyladenine (3MA) from Sigma-Aldrich,bortezomib from Selleck Chemicals, and Z-VAD-FMK fromBD Biosciences. The specificity of ABC294640 and PF543was determined in isoform specific assays (SupplementaryFig. S1). Antibodies to the following were purchased: cleavedcaspase-3-FITC, CD19-PE, mCD45R/B220-PE-Cy5, mCD19-PE, mCD11b-FITC (BD Biosciences), mCD45-FITC (Invitro-gen), LC3, histone H3 acetylated on Lys9, c-Myc from CellSignaling Technology, and SK2, phospho(Thr578)-SK2 fromECM Biosciences.
Gene expression analysisTotal RNA extracted from cells using the Qiagen RNeasy
Mini Kit was amplified and biotinylated with the TargetAmp-Nano Labeling Kit (Epicentre Biotechnologies), and geneexpression analyzed using the Illumina HumanHT-12 v4.0Whole-Genome Gene Expression BeadChip and Genome-Studio software.
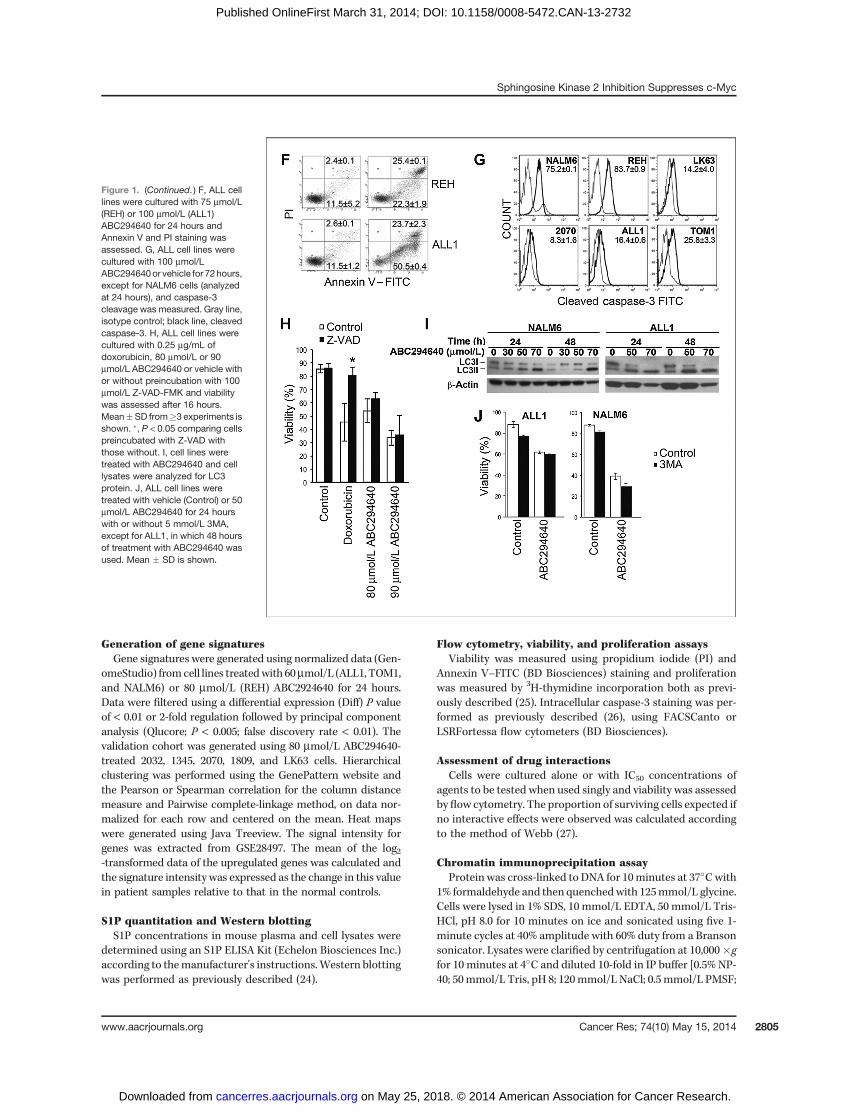
Figure 1. SK2 inhibition suppressesproliferation and induces caspase-independent cell death in ALL cells.A, ALL cell lines were cultured with60 mmol/L ABC294640 or vehiclefor 24 or 48 hours and cellular S1Pconcentrations were determined.Mean� SD from three cell lines areshown; �, P < 0.05. B–E, ALL celllines (B, C, andE) or patient cells (D)were cultured with ABC294640 orvehicle for 48 hours (B), 72 hours(C), or 16 hours (D). Theproliferation (B) or viability (C–E)was normalized to control cultures.(Continued on the following page.)
Wallington-Beddoe et al.
Cancer Res; 74(10) May 15, 2014 Cancer Research2804
on May 25, 2018. © 2014 American Association for Cancer Research. cancerres.aacrjournals.org Downloaded from
Published OnlineFirst March 31, 2014; DOI: 10.1158/0008-5472.CAN-13-2732
Generation of gene signaturesGene signatures were generated using normalized data (Gen-
omeStudio) fromcell lines treatedwith 60mmol/L (ALL1, TOM1,and NALM6) or 80 mmol/L (REH) ABC2924640 for 24 hours.Data were filtered using a differential expression (Diff) P valueof < 0.01 or 2-fold regulation followed by principal componentanalysis (Qlucore; P < 0.005; false discovery rate < 0.01). Thevalidation cohort was generated using 80 mmol/L ABC294640-treated 2032, 1345, 2070, 1809, and LK63 cells. Hierarchicalclustering was performed using the GenePattern website andthe Pearson or Spearman correlation for the column distancemeasure and Pairwise complete-linkage method, on data nor-malized for each row and centered on the mean. Heat mapswere generated using Java Treeview. The signal intensity forgenes was extracted from GSE28497. The mean of the log2-transformed data of the upregulated genes was calculated andthe signature intensity was expressed as the change in this valuein patient samples relative to that in the normal controls.
S1P quantitation and Western blottingS1P concentrations in mouse plasma and cell lysates were
determined using an S1P ELISA Kit (Echelon Biosciences Inc.)according to themanufacturer's instructions.Western blottingwas performed as previously described (24).
Flow cytometry, viability, and proliferation assaysViability was measured using propidium iodide (PI) and
Annexin V–FITC (BD Biosciences) staining and proliferationwas measured by 3H-thymidine incorporation both as previ-ously described (25). Intracellular caspase-3 staining was per-formed as previously described (26), using FACSCanto orLSRFortessa flow cytometers (BD Biosciences).
Assessment of drug interactionsCells were cultured alone or with IC50 concentrations of
agents to be tested when used singly and viability was assessedby flow cytometry. The proportion of surviving cells expected ifno interactive effects were observed was calculated accordingto the method of Webb (27).
Chromatin immunoprecipitation assayProtein was cross-linked to DNA for 10minutes at 37�Cwith
1% formaldehyde and then quenchedwith 125mmol/L glycine.Cells were lysed in 1% SDS, 10 mmol/L EDTA, 50 mmol/L Tris-HCl, pH 8.0 for 10 minutes on ice and sonicated using five 1-minute cycles at 40% amplitude with 60% duty from a Bransonsonicator. Lysates were clarified by centrifugation at 10,000�gfor 10 minutes at 4�C and diluted 10-fold in IP buffer [0.5% NP-40; 50mmol/L Tris, pH 8; 120mmol/L NaCl; 0.5 mmol/L PMSF;
Figure 1. (Continued. ) F, ALL celllines were cultured with 75 mmol/L(REH) or 100 mmol/L (ALL1)ABC294640 for 24 hours andAnnexin V and PI staining wasassessed. G, ALL cell lines werecultured with 100 mmol/LABC294640or vehicle for 72hours,except for NALM6 cells (analyzedat 24 hours), and caspase-3cleavage was measured. Gray line,isotype control; black line, cleavedcaspase-3. H, ALL cell lines werecultured with 0.25 mg/mL ofdoxorubicin, 80 mmol/L or 90mmol/L ABC294640 or vehicle withor without preincubation with 100mmol/L Z-VAD-FMK and viabilitywas assessed after 16 hours.Mean�SD from�3 experiments isshown. �, P < 0.05 comparing cellspreincubated with Z-VAD withthose without. I, cell lines weretreated with ABC294640 and celllysates were analyzed for LC3protein. J, ALL cell lines weretreated with vehicle (Control) or 50mmol/L ABC294640 for 24 hourswith or without 5 mmol/L 3MA,except for ALL1, in which 48 hoursof treatment with ABC294640 wasused. Mean � SD is shown.
Sphingosine Kinase 2 Inhibition Suppresses c-Myc
www.aacrjournals.org Cancer Res; 74(10) May 15, 2014 2805
on May 25, 2018. © 2014 American Association for Cancer Research. cancerres.aacrjournals.org Downloaded from
Published OnlineFirst March 31, 2014; DOI: 10.1158/0008-5472.CAN-13-2732

complete protease inhibitor cocktail (Roche)]. Lysates wereprecleared for 1 hour at 4�C with protein G magnetic beads(Invitrogen) and then incubated with primary antibody andprotein G magnetic beads overnight at 4�C. Beads weresequentially washed with IP buffer, high-salt wash buffer (IPbuffer containing 500 mmol/L NaCl), lithium wash buffer (250mmol/L LiCl; 0.5% NP-40; 1% sodium deoxycholate; 1 mmol/LEDTA, and 10 mmol/L Tris-HCl, pH 8.0), and Tris/EDTA (10mmol/L Tris and 1 mmol/L EDTA, pH 8.0). The protein–DNAcomplexes were eluted with 1% SDS in 0.1 mol/L NaHCO3 atroom temperature for 15 minutes, cross-links were reversed in50 mmol/L NaCl at 65�C for 6 hours, and DNA was purifiedusing QIAquick PCR columns (Qiagen).
PCR, quantitative PCR, and quantitative real-time PCRBCR/ABL was amplified from genomic DNA using Takara
Taq HS (Takara Bio Inc.) and primers specific for the e1a2transcript of BCR/ABL and Sphk2 using primers (see Supple-mentary Data). Products were separated on agarose gels andstained with ethidium bromide (Amresco; BCR/ABL) or MidoriGreen (NipponGenetics) and visualized usingMolecular Imag-er Gel Doc XR (Bio-Rad).
RNA was extracted, reverse transcribed, and quantitativeRT-PCR performed using SYBR Green Real-Time PCR MasterMix (Invitrogen). Products were normalized to glyceraldehyde-3-phosphate dehydrogenase (GAPDH) and analyzed on Rotor-Gene software. Further details are in Supplementary Data andSupplementary Table S2.
Leukemia modelsMice were used with permission from the Westmead Hos-
pital Animal Ethics committee and experiments were per-formed under guidelines from the Australian code of practicefor the care and use of animals for scientific purposes 7thEdition, 2004.
Induction of BCR/ABL–positive ALL in mice. pMSCVretroviral vectors containing a 50-LTR–driven p185 BCR/ABLand internal ribosome entry site (IRES) enhanced GFP (pro-vided byDr. C.Mullighan, St Jude Children's ResearchHospital,Memphis, TN) were used to generate helper-free retrovirusafter transient transfection of HEK293T cells using FuGENE 6Transfection Reagent (Roche). B-cell progenitors were isolatedby fluorescence-activated cell sorting (FACS) analysis fromwild-type (WT) and B6N.129S6-Sphk2tm1Rlp (SK2�/�; Prof.R. Proia, Bethesda, MD) C57Bl6 mouse bone marrow (BM;Supplementary Fig. S2). The number did not significantly differbetween WT and SK2�/� mice (Supplementary Fig. S3). B-cellprogenitors were transduced with four additions of retroviralsupernatants over 24 hours on OP9 murine BM stroma in thepresence of 20 ng/mL interleukin (IL)-3, 30 ng/mL IL-7, 20ng/mL SCF, and 10 ng/mL Flt-3 ligand (R&D Systems). Trans-duced cells were injected into sublethally (5 Gy) irradiatedWT mice (ARC). The transduction efficiency of WT andSK2�/� B-cell progenitors using the p185 BCR/ABL viral par-ticles was 13.2 � 4.3% and 13.6 � 3.8, respectively.
Assessment of in vivo ABC294640 efficacy. NOD.Cg-Prkdcscid Il2rgtm1Wjl/SzJ (NOD/SCIDgc�/�) mice were given2 to 5 � 106 ALL cells by tail-vein injection. Three (xenograft
1345) or 7 (xenografts 1999 and 2070) days post injection ofleukemic cells, 50 mg/kg (xenograft 2070), 100 mg/kgABC294640 (xenografts 1345 and 1999), or vehicle (PBS) wereadministered daily for 21 days by intraperitoneal injection andthe animals were sacrificed. The percentage of human cells inthe peripheral blood (assessed weekly), BM, and spleen wasassessed by flow cytometry as described (28). Total leukemiawas calculated on the basis of the BM from one femurrepresenting 5.8% of the total BM and a blood volume of 80mL/kg of body weight.
For survival studies, mice engrafted with ALL as above weretreated for 21 days with 100 mg/kg of ABC294640 whenapproximately 1% leukemiawas detected in the blood. Animalswere sacrificed as required due to deteriorating health scores.
Statistical analysisThe expression of the gene signatures in ALL cells was
performed using the Mann–Whitney test. The fractional prod-uct method (27) was used to discriminate between synergisticand antagonistic effects of drug combinations with a value of>0.1 indicating antagonism and <�0.1 indicating synergy.Comparisons between two groups were performed using theStudent t test and between multiple groups using ANOVAanalysis. A level of significance of < 0.05 was deemed signif-icant. For survival studies, Kaplan–Meier analysis was per-formed and a log-rank test used to determine significance withBonferoni's correction for multiple comparisons.
ResultsPharmacologic inhibition of SK2 reduces ALL cellproliferation and survival in vitro and induces caspase-independent cell death
Here, we show that ABC294640 reduced SK2 activity andS1P production in leukemic cell lines but did not affect SK1activity or protein expression (Fig. 1A and SupplementaryFigs. S1 and S4A). SK2 inhibition consistently reduced cellproliferation (Fig. 1B and data not shown), and induced celldeath (Fig. 1C) in a time-dependent manner (Fig. 1E) withIC50 values at 24 hours being significantly higher than thosemeasured at later time points (P < 0.001, ANOVA test withrepeated measures). Furthermore, SK2 inhibition alsoinduced cell death in patient ALL cells (Fig. 1D) while IC50
concentrations for normal BM mononuclear cells and B-cellprogenitors were not achieved even after 72 hours (Supple-mentary Fig. S5).
Inhibition of SK2 resulted in externalization of phos-phatidylserine (Fig. 1F); however, a transition from AnnexinVþ/PI� (early apoptosis) to Annexin Vþ/PIþ (late apoptosis)was not clear (Fig. 1F). Apoptotic cells, as defined by nuclearcondensation and apoptotic bodies on examination by lightmicroscopy, were largely absent in ABC294640-treated cul-tures (Supplementary Fig. S6) despite cleavage of caspase-3(Fig. 1G). Although caspase inhibition significantly inhibitedapoptosis induced by doxorubicin, it did not significantlyreduce ABC294640-induced cell death (P ¼ 0.18; n ¼ 8; Fig.1H). Although LC3-I was processed to LC3-II following SK2inhibition (Fig. 1I), the autophagy inhibitor 3MA did notdiminish ABC294640-induced cell death (Fig. 1J), despite
Wallington-Beddoe et al.
Cancer Res; 74(10) May 15, 2014 Cancer Research2806
on May 25, 2018. © 2014 American Association for Cancer Research. cancerres.aacrjournals.org Downloaded from
Published OnlineFirst March 31, 2014; DOI: 10.1158/0008-5472.CAN-13-2732

reducing LC3 processing (data not shown). Overall, celldeath following SK2 inhibition was largely caspase-inde-pendent and lacked morphologic features of apoptosis.Although autophagy was occurring following ABC294640treatment, this was not the mechanism of cell death.
SK expression in ALLTo establish a gene signature for activation of SK2, we
treated ALL cell lines with the SK2-specific inhibitorABC294640 and analyzed gene expression by microarray. ADiff P value filter produced a list of 12 probes representing 11genes, and principal component analysis identified 40 probesrepresenting 35 genes (Fig. 2A). Notably, a gene signaturecould not be generated from cells treated with the SK1-specific inhibitor SK1-I (29) and the genes regulated by theSK2 inhibitor were not altered in cells treated with the SK1inhibitor SK1-I (Supplementary Fig. S7), demonstrating spec-ificity of the signature to SK2. Regulation of selected geneswas confirmed by quantitative real time (qRT-PCR; Supple-mentary Fig. S8). Both SK2 gene signatures segregated con-trol and ABC294640-treated cell lines using hierarchical
clustering and Qlucore software (Fig. 2A and data not shown)and were validated using an additional five cell lines (Sup-plementary Fig. S9). In contrast, these signatures could notseparate cells treated with SK1-I from control-treated cells(Supplementary Fig. S7). The SK2 signatures were used tointerrogate a large publicly available gene expression datasetobtained from pediatric patients with ALL at the time ofdiagnosis (GSE28497; ref. 30). SK2 activity signatures werehigher in ALL samples (P ¼ 0.001 and P ¼ 0.027; Fig. 2B anddata not shown) than normal B-cell progenitors. The SPHK2gene was not overexpressed; however, increased SK2 proteinwas detected (Fig. 2C) with increased phosphorylation, sug-gesting increased enzymatic activity (Fig. 2C). Together,these data show activation of SK2 without increased geneexpression.
SK2 inhibition in ALL inhibits expression of MYC and c-Myc–regulated genes
To determine the mechanism by which inhibition of SK2induced cell death in ALL, we undertook microarray analysisof control and ABC294640-treated cells at the earlier time
Figure 2. Expression and activityof SKs in ALL. A, hierarchicalclustering of control and SK2inhibitor–treated ALL cell linesusing gene expression changesresulting from inhibition of SK2detected by filtering on the Diff Pvalue (left) or principal componentanalysis (right). B, gene expressionarray data from ALL samples wereinterrogated for the presence of theSPHK2 gene signature relative tonormal B-cell progenitors. Thesignature intensity is shown andpatient subtypes are indicated. C,expression of phosphorylated andtotal SK2 in ALL cell lines, 5 patientsamples, peripheral bloodmononuclear cells (PBMC) fromnormal donors and normal CD34þ
CD19þ bone marrow B-cellprogenitors.
Sphingosine Kinase 2 Inhibition Suppresses c-Myc
www.aacrjournals.org Cancer Res; 74(10) May 15, 2014 2807
on May 25, 2018. © 2014 American Association for Cancer Research. cancerres.aacrjournals.org Downloaded from
Published OnlineFirst March 31, 2014; DOI: 10.1158/0008-5472.CAN-13-2732
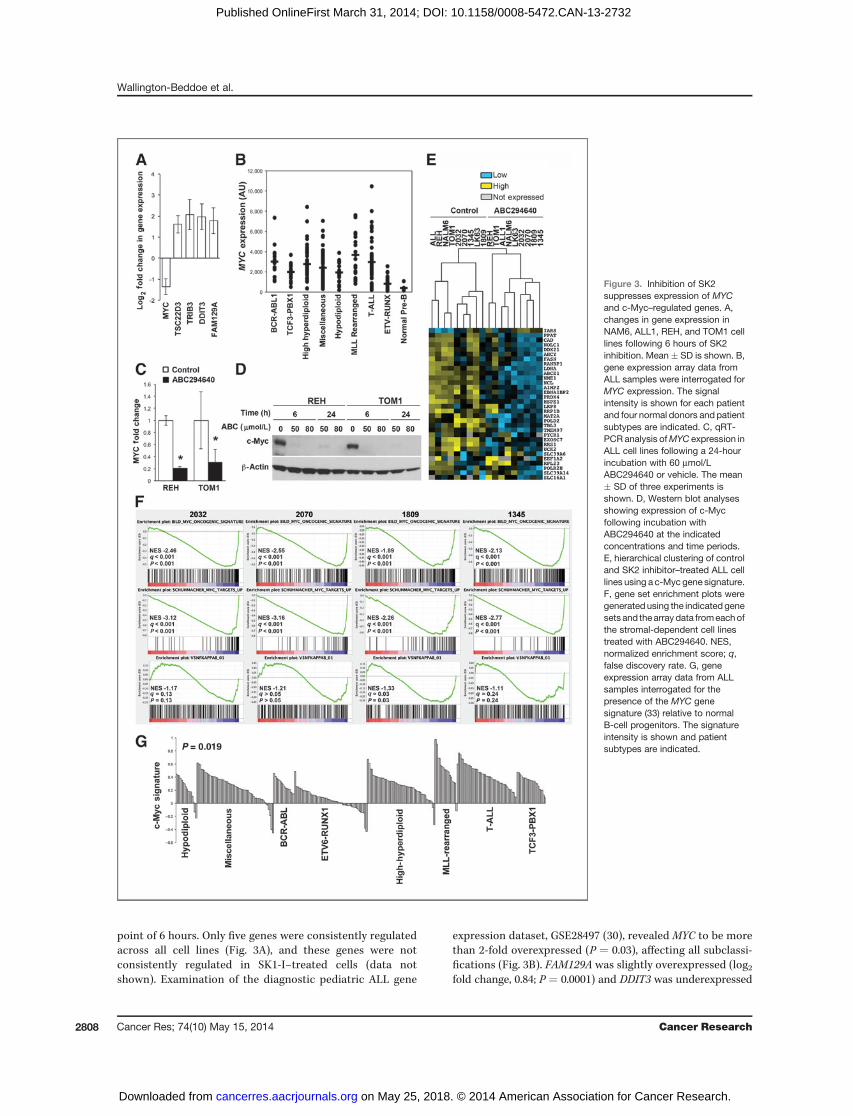
point of 6 hours. Only five genes were consistently regulatedacross all cell lines (Fig. 3A), and these genes were notconsistently regulated in SK1-I–treated cells (data notshown). Examination of the diagnostic pediatric ALL gene
expression dataset, GSE28497 (30), revealed MYC to be morethan 2-fold overexpressed (P ¼ 0.03), affecting all subclassi-fications (Fig. 3B). FAM129A was slightly overexpressed (log2fold change, 0.84; P ¼ 0.0001) and DDIT3 was underexpressed
Figure 3. Inhibition of SK2suppresses expression of MYCand c-Myc–regulated genes. A,changes in gene expression inNAM6, ALL1, REH, and TOM1 celllines following 6 hours of SK2inhibition. Mean � SD is shown. B,gene expression array data fromALL samples were interrogated forMYC expression. The signalintensity is shown for each patientand four normal donors and patientsubtypes are indicated. C, qRT-PCR analysis ofMYC expression inALL cell lines following a 24-hourincubation with 60 mmol/LABC294640 or vehicle. The mean� SD of three experiments isshown. D, Western blot analysesshowing expression of c-Mycfollowing incubation withABC294640 at the indicatedconcentrations and time periods.E, hierarchical clustering of controland SK2 inhibitor–treated ALL celllines using a c-Myc gene signature.F, gene set enrichment plots weregenerated using the indicated genesets and thearray data fromeachofthe stromal-dependent cell linestreated with ABC294640. NES,normalized enrichment score; q,false discovery rate. G, geneexpression array data from ALLsamples interrogated for thepresence of the MYC genesignature (33) relative to normalB-cell progenitors. The signatureintensity is shown and patientsubtypes are indicated.
Wallington-Beddoe et al.
Cancer Res; 74(10) May 15, 2014 Cancer Research2808
on May 25, 2018. © 2014 American Association for Cancer Research. cancerres.aacrjournals.org Downloaded from
Published OnlineFirst March 31, 2014; DOI: 10.1158/0008-5472.CAN-13-2732
(log2 fold change, �0.73; P ¼ 0.001) while TSC22D3 andTRIB3 were within normal limits. MYC remained significant-ly decreased at 24 hours in all nine cell lines and metacoreanalysis identified c-Myc as the transcription factor mostsignificantly associated with the changes in gene expressionin these cell lines (P < 1.0e�250; z-Score ¼ 90.57; g-Score ¼93.07; Supplementary Table S3). Downregulation of MYCexpression was confirmed by qRT-PCR (Fig. 3C), but wasnot observed following treatment with the SK1-selectiveinhibitor PF543 (Supplementary Fig. S10). c-Myc proteinwas also markedly reduced by ABC294640 (Fig. 3D) and wasalso decreased following knockdown of SK2 by siRNA (Sup-plementary Fig. S11). Despite recent reports of increasedSphk1 expression in the absence of Sphk2 (31), SPHK1 geneexpression was not increased by SK2 inhibition as deter-mined by microarray analysis.
We questioned whether changes in c-Myc–regulatedgenes could segregate SK2 inhibitor–treated ALL cells fromtheir respective controls. To this end, we extracted threepreviously published c-Myc gene signatures (22, 32, 33) fromthe original and the validation microarray data sets. Unsu-pervised hierarchical clustering separated the SK2 inhibitor–treated cells from control-treated cells (Fig. 3E and Supple-mentary Fig. S12). Gene Set Enrichment Analysis (GSEA)demonstrated a significant negative enrichment of both theBild and Schuhmacher c-Myc signatures in SK2-inhibitedcells. The specificity of this effect was apparent from the lackof any consistent association between NF-kB or PI3K/AKTpathway members or SP1 targets (Fig. 3F and SupplementaryTable S4) and the absence of these signatures in SK1-I–treated cells (P ¼ 0.17 and 0.08, respectively; SupplementaryFig. S10). This suggests that regulation of MYC plays asignificant role in the response of ALL cells to SK2 but notSK1 inhibition. Interrogation of the GSE28497 data set usingthe Schuhmacher and colleagues' (33) c-Myc signature foundc-Myc targets to be increased in diagnostic patient samples(P ¼ 0.019) consistent with the overexpression of MYC inthese patient samples (Fig. 3G).
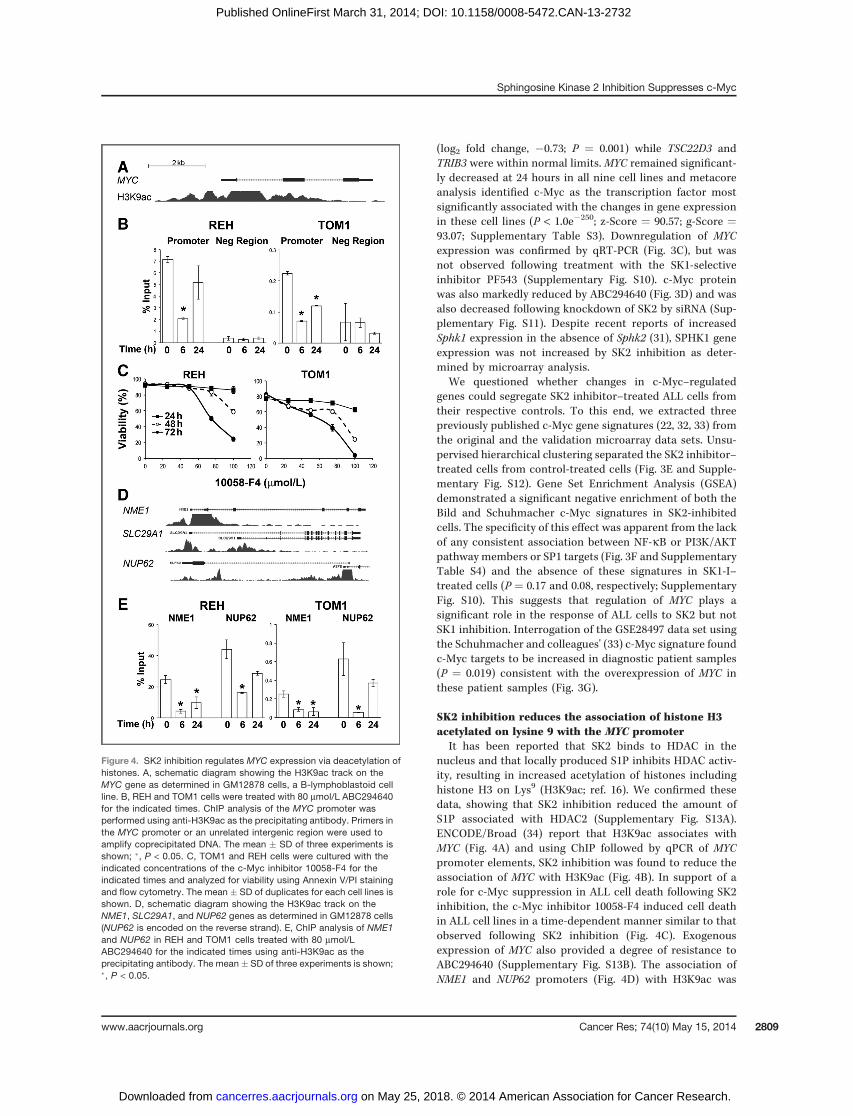
SK2 inhibition reduces the association of histone H3acetylated on lysine 9 with the MYC promoter
It has been reported that SK2 binds to HDAC in thenucleus and that locally produced S1P inhibits HDAC activ-ity, resulting in increased acetylation of histones includinghistone H3 on Lys9 (H3K9ac; ref. 16). We confirmed thesedata, showing that SK2 inhibition reduced the amount ofS1P associated with HDAC2 (Supplementary Fig. S13A).ENCODE/Broad (34) report that H3K9ac associates withMYC (Fig. 4A) and using ChIP followed by qPCR of MYCpromoter elements, SK2 inhibition was found to reduce theassociation of MYC with H3K9ac (Fig. 4B). In support of arole for c-Myc suppression in ALL cell death following SK2inhibition, the c-Myc inhibitor 10058-F4 induced cell deathin ALL cell lines in a time-dependent manner similar to thatobserved following SK2 inhibition (Fig. 4C). Exogenousexpression of MYC also provided a degree of resistance toABC294640 (Supplementary Fig. S13B). The association ofNME1 and NUP62 promoters (Fig. 4D) with H3K9ac was
Figure 4. SK2 inhibition regulates MYC expression via deacetylation ofhistones. A, schematic diagram showing the H3K9ac track on theMYC gene as determined in GM12878 cells, a B-lymphoblastoid cellline. B, REH and TOM1 cells were treated with 80 mmol/L ABC294640for the indicated times. ChIP analysis of the MYC promoter wasperformed using anti-H3K9ac as the precipitating antibody. Primers inthe MYC promoter or an unrelated intergenic region were used toamplify coprecipitated DNA. The mean � SD of three experiments isshown; �, P < 0.05. C, TOM1 and REH cells were cultured with theindicated concentrations of the c-Myc inhibitor 10058-F4 for theindicated times and analyzed for viability using Annexin V/PI stainingand flow cytometry. The mean � SD of duplicates for each cell lines isshown. D, schematic diagram showing the H3K9ac track on theNME1, SLC29A1, and NUP62 genes as determined in GM12878 cells(NUP62 is encoded on the reverse strand). E, ChIP analysis of NME1and NUP62 in REH and TOM1 cells treated with 80 mmol/LABC294640 for the indicated times using anti-H3K9ac as theprecipitating antibody. The mean � SD of three experiments is shown;�, P < 0.05.
Sphingosine Kinase 2 Inhibition Suppresses c-Myc
www.aacrjournals.org Cancer Res; 74(10) May 15, 2014 2809
on May 25, 2018. © 2014 American Association for Cancer Research. cancerres.aacrjournals.org Downloaded from
Published OnlineFirst March 31, 2014; DOI: 10.1158/0008-5472.CAN-13-2732
significantly reduced following inhibition of SK2 (Fig. 4F)consistent with their reduced expression.
Concurrent Bcr/Abl and SK2 inhibition producessynergistic effects in Phþ ALL
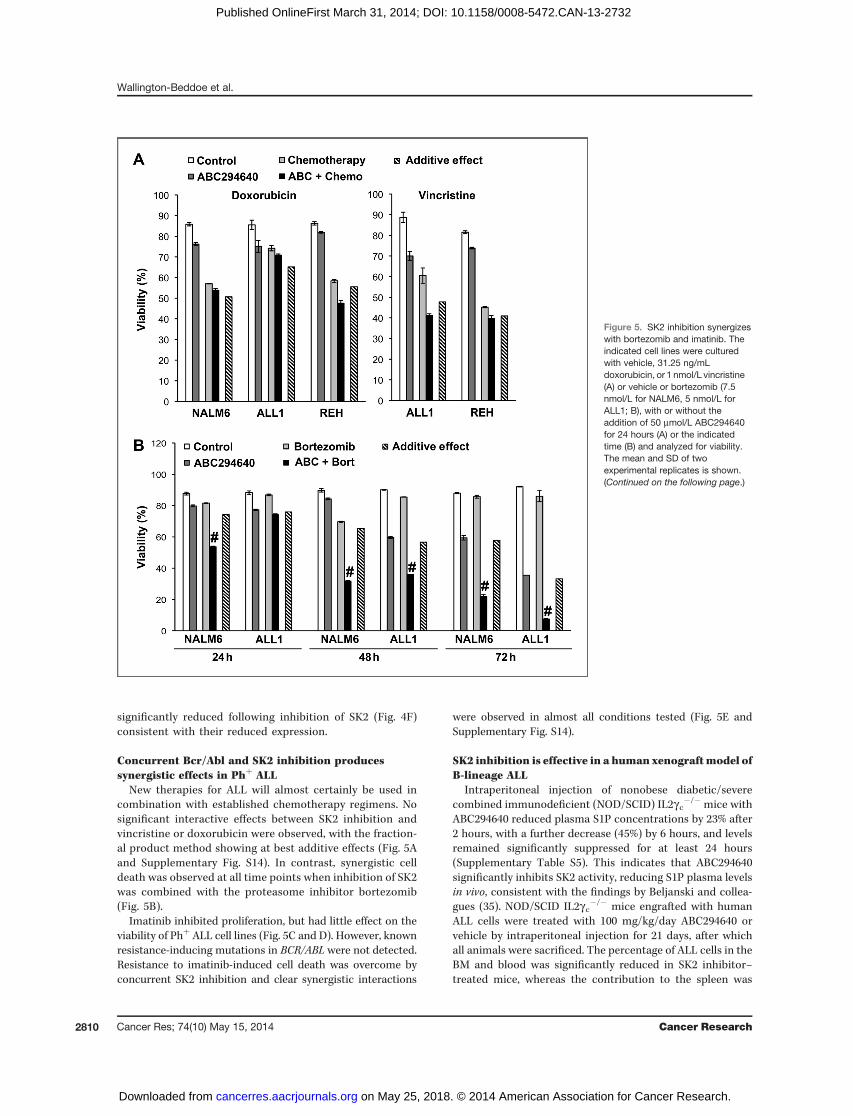
New therapies for ALL will almost certainly be used incombination with established chemotherapy regimens. Nosignificant interactive effects between SK2 inhibition andvincristine or doxorubicin were observed, with the fraction-al product method showing at best additive effects (Fig. 5Aand Supplementary Fig. S14). In contrast, synergistic celldeath was observed at all time points when inhibition of SK2was combined with the proteasome inhibitor bortezomib(Fig. 5B).
Imatinib inhibited proliferation, but had little effect on theviability of Phþ ALL cell lines (Fig. 5C and D). However, knownresistance-inducing mutations in BCR/ABL were not detected.Resistance to imatinib-induced cell death was overcome byconcurrent SK2 inhibition and clear synergistic interactions
were observed in almost all conditions tested (Fig. 5E andSupplementary Fig. S14).
SK2 inhibition is effective in a human xenograftmodel ofB-lineage ALL
Intraperitoneal injection of nonobese diabetic/severecombined immunodeficient (NOD/SCID) IL2gc�/� mice withABC294640 reduced plasma S1P concentrations by 23% after2 hours, with a further decrease (45%) by 6 hours, and levelsremained significantly suppressed for at least 24 hours(Supplementary Table S5). This indicates that ABC294640significantly inhibits SK2 activity, reducing S1P plasma levelsin vivo, consistent with the findings by Beljanski and collea-gues (35). NOD/SCID IL2gc�/� mice engrafted with humanALL cells were treated with 100 mg/kg/day ABC294640 orvehicle by intraperitoneal injection for 21 days, after whichall animals were sacrificed. The percentage of ALL cells in theBM and blood was significantly reduced in SK2 inhibitor–treated mice, whereas the contribution to the spleen was
Figure 5. SK2 inhibition synergizeswith bortezomib and imatinib. Theindicated cell lines were culturedwith vehicle, 31.25 ng/mLdoxorubicin, or 1 nmol/L vincristine(A) or vehicle or bortezomib (7.5nmol/L for NALM6, 5 nmol/L forALL1; B), with or without theaddition of 50 mmol/L ABC294640for 24 hours (A) or the indicatedtime (B) and analyzed for viability.The mean and SD of twoexperimental replicates is shown.(Continued on the following page.)
Wallington-Beddoe et al.
Cancer Res; 74(10) May 15, 2014 Cancer Research2810
on May 25, 2018. © 2014 American Association for Cancer Research. cancerres.aacrjournals.org Downloaded from
Published OnlineFirst March 31, 2014; DOI: 10.1158/0008-5472.CAN-13-2732

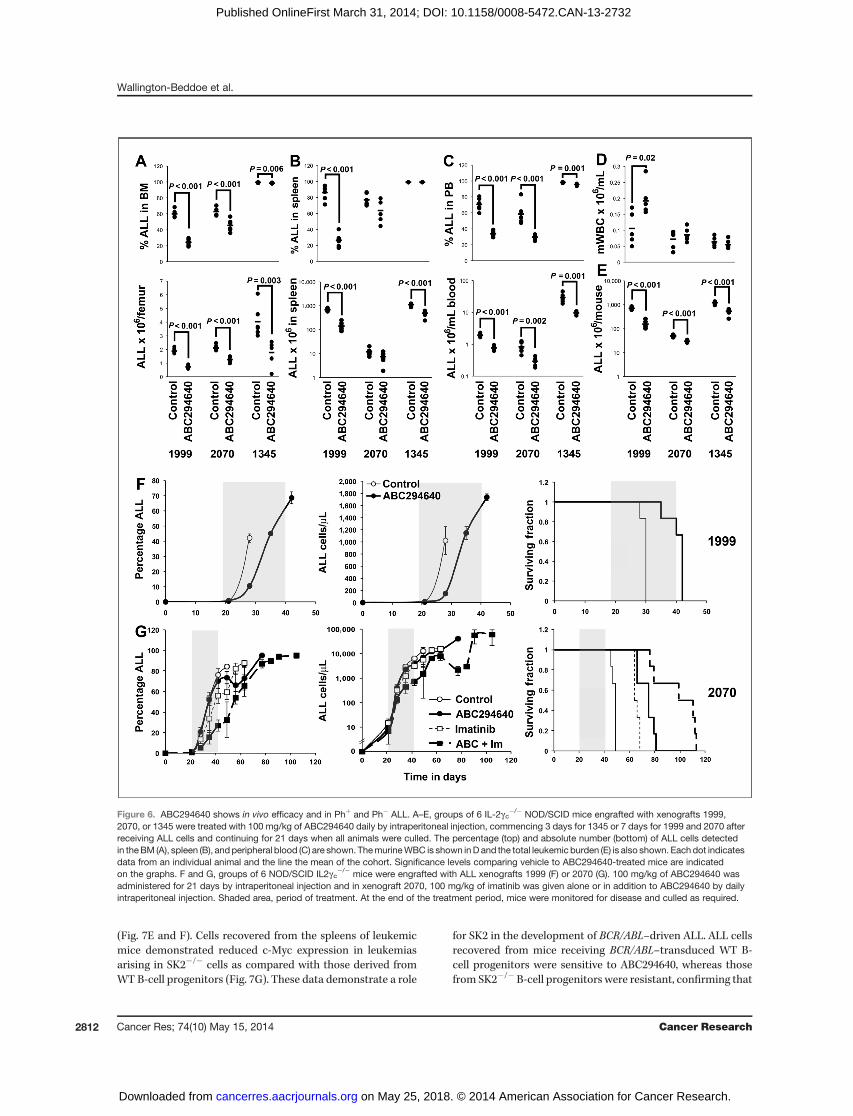
significantly reduced in xenograft 1999 only (Fig. 6A–C, top).Average absolute levels of leukemia in the BM of SK2inhibitor–treated mice were reduced by between 40% and60% (P � 0.004; Fig. 6A, bottom). Reductions in the bloodwere between 60% and 67% (P < 0.002) and in the spleen by38% and 79% (P < 0.0001) for xenografts 1999 and 1345 (Fig.6B and C, bottom). Overall, inhibition of SK2 decreased thelevel of disease in all xenografts between 40% and 78% (P �0.00005; Fig. 6E). No overt toxicity was noted, with themurine white blood cell (WBC) count being higher in SK2inhibitor–treated animals bearing xenograft 1999 (P¼ 0.018),consistent with reduced disease, and not significantly dif-ferent in the other xenografts (Fig. 6D).Inhibition of SK2 significantly slowed the increase in
circulating ALL cells, prolonging the survival of mice bearingxenograft 1999 (P ¼ 0.0012; Fig. 6F and G) from a median of30 days for control mice [95% confidence intervals (CI), 29–30 days] to 41 days (95% CI, 32–38 days) for the treatedgroup. Concurrent inhibition of SK2 and Bcr/Abl with ima-tinib also significantly improved the survival of miceengrafted with a Phþ ALL (2070; Fig. 6G). In this experiment,
the median survival of control mice was 49 days (95% CI,47.5–50.5 days) with imatinib extending survival to a medianof 65 days (95% CI, 63.4–96.6 days). Concurrent inhibition ofSK2 further extended the survival to a median of 104.5 days(95% CI, 91.1–117.9 days; P ¼ 0.004 compared with imatinibalone and P ¼ 0.044 compared with ABC294640 alone).
SK2 contributes to ALL development in miceTwenty-two of 29 mice receiving BCR/ABL–transduced B-
cell progenitors from WT animals developed ALL, with amedian survival of 42 days (95% CI, 32–52 days). Absence ofSK2 reduced the incidence of BCR/ABL–driven ALL to 16 of 29animals (median survival of 58 days; 95% CI, 47–69 days; P ¼0.002; Fig. 7A). In contrast with reports by Liang and colleagues(31), the absence of SK2 did not result in increased SK1expression (Supplementary Fig. S4B). The presence of BCR/ABL and the expected deletion of Sphk2were confirmed by PCRin allmurine leukemias examined (Fig. 7B andC). All leukemiasdemonstrated a B-cell progenitor phenotype (Fig. 7D), with themajority being pre-B-ALL, lacking CD43 expression. Lympho-blasts were present in blood films and livers from all animals
Figure 5. (Continued. ) The indicatedcell lines were incubated withincreasing concentrations ofimatinib for 72 hours and assessedfor proliferation (C) or survival (D).The mean and SD of four (C) andtwo (D) experimental replicates isshown. E, the indicated cell lineswere cultured with vehicle or 50mmol/L ABC294640 with or withoutthe addition of 5 mmol/L imatinib for48 hours or 72 hours and analyzedfor viability. The mean and SD oftwo experimental replicates isshown. A, B, and E, hatched bar,calculated additive effect based onthe effect of each agent alone; #,synergistic interaction between theagents as determined by afractional product method.
Sphingosine Kinase 2 Inhibition Suppresses c-Myc
www.aacrjournals.org Cancer Res; 74(10) May 15, 2014 2811
on May 25, 2018. © 2014 American Association for Cancer Research. cancerres.aacrjournals.org Downloaded from
Published OnlineFirst March 31, 2014; DOI: 10.1158/0008-5472.CAN-13-2732
(Fig. 7E and F). Cells recovered from the spleens of leukemicmice demonstrated reduced c-Myc expression in leukemiasarising in SK2�/� cells as compared with those derived fromWT B-cell progenitors (Fig. 7G). These data demonstrate a role
for SK2 in the development of BCR/ABL–driven ALL. ALL cellsrecovered from mice receiving BCR/ABL–transduced WT B-cell progenitors were sensitive to ABC294640, whereas thosefrom SK2�/� B-cell progenitors were resistant, confirming that
Figure 6. ABC294640 shows in vivo efficacy and in Phþ and Ph� ALL. A–E, groups of 6 IL-2gc�/� NOD/SCID mice engrafted with xenografts 1999,2070, or 1345 were treated with 100 mg/kg of ABC294640 daily by intraperitoneal injection, commencing 3 days for 1345 or 7 days for 1999 and 2070 afterreceiving ALL cells and continuing for 21 days when all animals were culled. The percentage (top) and absolute number (bottom) of ALL cells detectedin theBM (A), spleen (B), and peripheral blood (C) are shown. ThemurineWBC is shown inD and the total leukemic burden (E) is also shown. Eachdot indicatesdata from an individual animal and the line the mean of the cohort. Significance levels comparing vehicle to ABC294640-treated mice are indicatedon the graphs. F and G, groups of 6 NOD/SCID IL2gc�/� mice were engrafted with ALL xenografts 1999 (F) or 2070 (G). 100 mg/kg of ABC294640 wasadministered for 21 days by intraperitoneal injection and in xenograft 2070, 100 mg/kg of imatinib was given alone or in addition to ABC294640 by dailyintraperitoneal injection. Shaded area, period of treatment. At the end of the treatment period, mice were monitored for disease and culled as required.
Wallington-Beddoe et al.
Cancer Res; 74(10) May 15, 2014 Cancer Research2812
on May 25, 2018. © 2014 American Association for Cancer Research. cancerres.aacrjournals.org Downloaded from
Published OnlineFirst March 31, 2014; DOI: 10.1158/0008-5472.CAN-13-2732
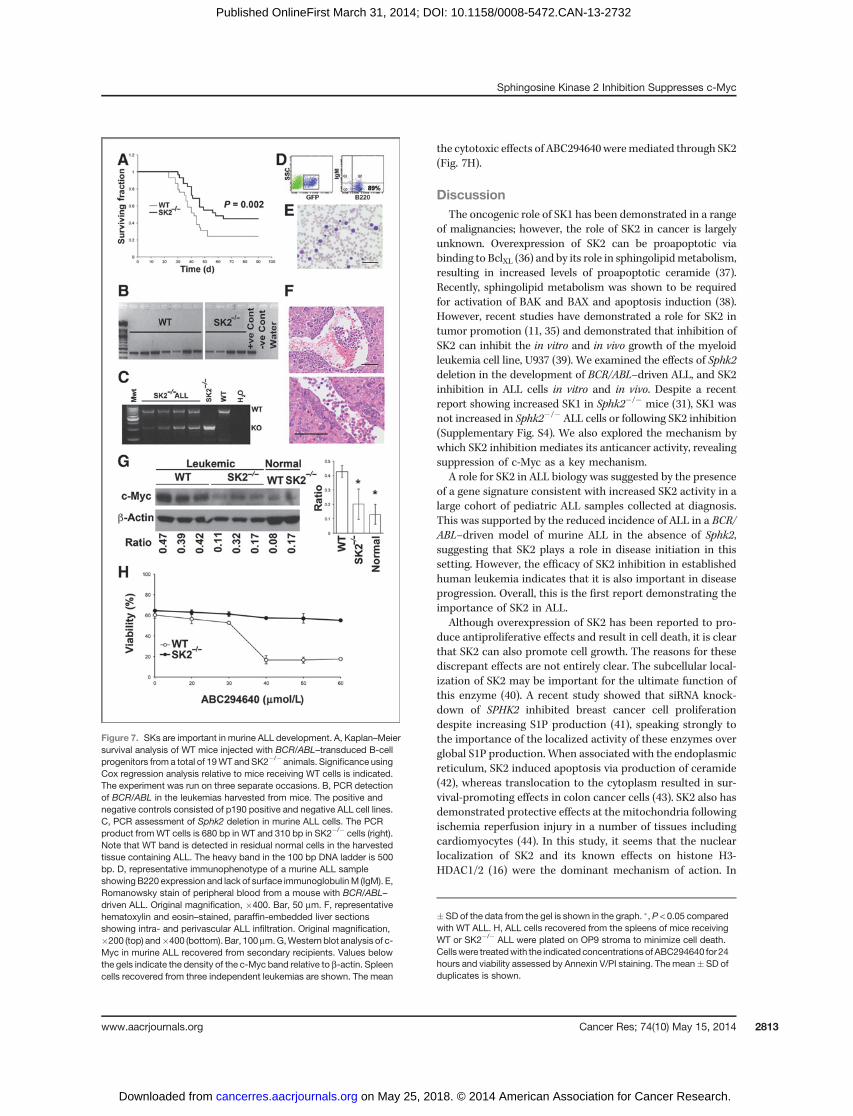
the cytotoxic effects of ABC294640weremediated through SK2(Fig. 7H).
DiscussionThe oncogenic role of SK1 has been demonstrated in a range
of malignancies; however, the role of SK2 in cancer is largelyunknown. Overexpression of SK2 can be proapoptotic viabinding to BclXL (36) and by its role in sphingolipidmetabolism,resulting in increased levels of proapoptotic ceramide (37).Recently, sphingolipid metabolism was shown to be requiredfor activation of BAK and BAX and apoptosis induction (38).However, recent studies have demonstrated a role for SK2 intumor promotion (11, 35) and demonstrated that inhibition ofSK2 can inhibit the in vitro and in vivo growth of the myeloidleukemia cell line, U937 (39). We examined the effects of Sphk2deletion in the development of BCR/ABL–driven ALL, and SK2inhibition in ALL cells in vitro and in vivo. Despite a recentreport showing increased SK1 in Sphk2�/� mice (31), SK1 wasnot increased in Sphk2�/� ALL cells or following SK2 inhibition(Supplementary Fig. S4). We also explored the mechanism bywhich SK2 inhibition mediates its anticancer activity, revealingsuppression of c-Myc as a key mechanism.
A role for SK2 in ALL biology was suggested by the presenceof a gene signature consistent with increased SK2 activity in alarge cohort of pediatric ALL samples collected at diagnosis.This was supported by the reduced incidence of ALL in a BCR/ABL–driven model of murine ALL in the absence of Sphk2,suggesting that SK2 plays a role in disease initiation in thissetting. However, the efficacy of SK2 inhibition in establishedhuman leukemia indicates that it is also important in diseaseprogression. Overall, this is the first report demonstrating theimportance of SK2 in ALL.
Although overexpression of SK2 has been reported to pro-duce antiproliferative effects and result in cell death, it is clearthat SK2 can also promote cell growth. The reasons for thesediscrepant effects are not entirely clear. The subcellular local-ization of SK2 may be important for the ultimate function ofthis enzyme (40). A recent study showed that siRNA knock-down of SPHK2 inhibited breast cancer cell proliferationdespite increasing S1P production (41), speaking strongly tothe importance of the localized activity of these enzymes overglobal S1P production. When associated with the endoplasmicreticulum, SK2 induced apoptosis via production of ceramide(42), whereas translocation to the cytoplasm resulted in sur-vival-promoting effects in colon cancer cells (43). SK2 also hasdemonstrated protective effects at the mitochondria followingischemia reperfusion injury in a number of tissues includingcardiomyocytes (44). In this study, it seems that the nuclearlocalization of SK2 and its known effects on histone H3-HDAC1/2 (16) were the dominant mechanism of action. In
Figure 7. SKs are important in murine ALL development. A, Kaplan–Meiersurvival analysis of WT mice injected with BCR/ABL–transduced B-cellprogenitors from a total of 19WT andSK2�/� animals. Significance usingCox regression analysis relative to mice receiving WT cells is indicated.The experiment was run on three separate occasions. B, PCR detectionof BCR/ABL in the leukemias harvested from mice. The positive andnegative controls consisted of p190 positive and negative ALL cell lines.C, PCR assessment of Sphk2 deletion in murine ALL cells. The PCRproduct fromWT cells is 680 bp in WT and 310 bp in SK2�/� cells (right).Note that WT band is detected in residual normal cells in the harvestedtissue containing ALL. The heavy band in the 100 bp DNA ladder is 500bp. D, representative immunophenotype of a murine ALL sampleshowingB220 expression and lack of surface immunoglobulinM (IgM). E,Romanowsky stain of peripheral blood from a mouse with BCR/ABL–driven ALL. Original magnification, �400. Bar, 50 mm. F, representativehematoxylin and eosin–stained, paraffin-embedded liver sectionsshowing intra- and perivascular ALL infiltration. Original magnification,�200 (top) and�400 (bottom). Bar, 100mm.G,Western blot analysis of c-Myc in murine ALL recovered from secondary recipients. Values belowthe gels indicate the density of the c-Myc band relative to b-actin. Spleencells recovered from three independent leukemias are shown. The mean
� SD of the data from the gel is shown in the graph. �, P < 0.05 comparedwith WT ALL. H, ALL cells recovered from the spleens of mice receivingWT or SK2�/� ALL were plated on OP9 stroma to minimize cell death.Cellswere treatedwith the indicated concentrations of ABC294640 for 24hours and viability assessed by Annexin V/PI staining. The mean� SD ofduplicates is shown.
www.aacrjournals.org Cancer Res; 74(10) May 15, 2014 2813
Sphingosine Kinase 2 Inhibition Suppresses c-Myc
on May 25, 2018. © 2014 American Association for Cancer Research. cancerres.aacrjournals.org Downloaded from
Published OnlineFirst March 31, 2014; DOI: 10.1158/0008-5472.CAN-13-2732

ALL cells, SK2 increases expression of oncogenic c-Myc, pre-sumably through localized SIP production, promoting survivaland proliferation. Consistent with this, ALL patient sampleshave increased MYC expression, increased expression of c-Myc–regulated genes, and are killed by c-Myc inhibition.Furthermore, exogenous expression of MYC resulted in adegree of resistance to SK2 inhibition by ABC294640.
SK2 inhibition has been associated with both caspase-dependent (45) and -independent cell death (46), with autop-hagy being involved in the latter. Autophagy also has cellsurvival roles (47) and although SK2 inhibition induced autop-hagy in ALL cells, this was not the cause of cell death, asituation similar to that following FTY720 exposure (48).Consistent with the lack of apoptosis, genes involved in apo-ptosis were not overrepresented in the microarray data (datanot shown). Inhibition of SK2 has been shown to synergizewithchemotherapeutic agents in breast cancer cell lines in vitro, viainhibition of NF-kB–mediated survival signals (49). However,our attempts at combining conventional chemotherapeuticagents such as vincristine and doxorubicinwere disappointing,with no significant synergy seen. The lack of an effect onNF-kBsignaling in ALL cells when SK2 is inhibited (SupplementaryTable S4) may explain this result. We, therefore, turned ourattention to the biologic response modifier bortezomib, afterreports of efficacy in lymphoidmalignancies (50, 51), and foundthe combination of ABC294640with this agent to be superior toconventional drugs. In addition, inhibition of SK2 also syner-gized with imatinib in Phþ disease, reminiscent of workpublished with SK1 inhibitors (7). Overall, this suggests thatcombination treatments including SK2 inhibitors may havepotential as therapeutic strategies.
A major novel finding in this study is the downregulation ofthe MYC gene and c-Myc target genes as a result of SK2inhibition. This effect on MYC expression was specific for SK2with SK1 inhibition failing to influence expression ofMYC or c-myc target genes in ALL cells. IncreasedMYC and c-Myc targetgene expression in ALL samples frompatients and the ability ofa c-Myc inhibitor to kill ALL cells provides evidence for a rolefor c-Myc inALL cell biology. These data potentially explain theoften opposing roles of SK2 in cell growth and survival,inhibiting growth and survival via effects on p21 and fos, whilepromoting these features by increasing expression of c-Myc.
They also highlight a potentially underappreciated role of c-Myc in ALL biology and identify potential therapeutic strat-egies for the treatment of ALL and other c-Myc–drivenmalignancies.
Disclosure of Potential Conflicts of InterestNo potential conflicts of interest were disclosed.
Authors' ContributionsConception and design: C.T. Wallington-Beddoe, S.M. Pitson, K.F. Bradstock,L.J. BendallDevelopment of methodology: C.T. Wallington-Beddoe, S.M. Pitson, L.J.BendallAcquisition of data (provided animals, acquired and managed patients,provided facilities, etc.): C.T. Wallington-Beddoe, J.A. Powell, D. Tong, S.M.Pitson, L.J. BendallAnalysis and interpretation of data (e.g., statistical analysis, biostatistics,computational analysis): C.T. Wallington-Beddoe, S.M. Pitson, L.J. BendallWriting, review, and/or revision of the manuscript: C.T. Wallington-Bed-doe, S.M. Pitson, K.F. Bradstock, L.J. BendallAdministrative, technical, or material support (i.e., reporting or orga-nizing data, constructing databases): C.T. Wallington-Beddoe, S.M. PitsonStudy supervision: C.T. Wallington-Beddoe, L.J. Bendall
AcknowledgmentsThe authors thank Dr. W. Wang (Flow Cytometry Centre, supported by the
Westmead Millennium Institute for Medical Research, NHMRC, and CancerInstitute New South Wales) for flow sorting; Oksana Mirochnik, MolecularDiagnostics, ICPMR Westmead Hospital, for her assistance with the BCR/ABLPCR assay; Joey Lai for assistance with labeling, hybridization, and scanning ofIllumina sentrix arrays that were performed at the Westmead MillenniumInstitute Genomics Facility; Lorena Davies, Centre for Cancer Biology, Universityof SouthAustralia and SAPathology for her assistancewith the SK assays; and theChildren's Hospital at Westmead Tumour Bank for their assistance with theprovision of clinicalmaterial. The authors also thankDrs. Helen Rizos and JustineGraham for valuable discussions, and Dr. Karen Byth for assistance withstatistical analysis of the data.
Grant SupportThis study was supported by the Leukaemia Foundation of Australia PhD
Research Scholarship, Cancer Institute, NSW, Research Scholar Award, RoyalCollege of Pathologists of Australasia Research Award, and aNational Health andMedical Research Council (NHMRC) Peter Doherty Biomedical Early CareerFellowship (1071945; C.T. Wallington-Beddoe); NHMRC Senior Research Fel-lowship (511965), Cancer Council NSW (RG 13-02; L.J. Bendall); NHMRC SeniorResearch Fellowship (508098; S.M. Pitson); and Fay Fuller Foundation Fellowship(J.A. Powell).
The costs of publication of this article were defrayed in part by the payment ofpage charges. This article must therefore be hereby marked advertisement inaccordance with 18 U.S.C. Section 1734 solely to indicate this fact.
Received September 24, 2013; revised February 5, 2014; accepted February 24,2014; published OnlineFirst March 31, 2014.
References1. Pitson SM. Regulation of sphingosine kinase and sphingolipid signal-
ing. Trends Biochem Sci 2011;36:97–107.2. Pyne NJ, Pyne S. Sphingosine 1-phosphate and cancer. Nat Rev
Cancer 2010;10:489–503.3. Li J, Guan HY, Gong LY, Song LB, Zhang N, Wu J, et al. Clinical
significance of sphingosine kinase-1 expression in human astrocyto-mas progression and overall patient survival. Clin Cancer Res2008;14:6996–7003.
4. Ruckhaberle E, Rody A, Engels K, Gaetje R, von Minckwitz G, Schiff-mann S, et al. Microarray analysis of altered sphingolipid metabolismreveals prognostic significance of sphingosine kinase 1 in breastcancer. Breast Cancer Res Treat 2008;112:41–52.
5. Van Brocklyn JR, Jackson CA, Pearl DK, Kotur MS, Snyder PJ, PriorTW. Sphingosine kinase-1 expression correlates with poor survival ofpatients with glioblastoma multiforme: roles of sphingosine kinase
isoforms in growth of glioblastomacell lines. JNeuropathol ExpNeurol2005;64:695–705.
6. Baran Y, Salas A, Senkal CE, Gunduz U, Bielawski J, Obeid LM, et al.Alterations of ceramide/sphingosine 1-phosphate rheostat involved inthe regulation of resistance to imatinib-induced apoptosis in K562human chronic myeloid leukemia cells. J Biol Chem 2007;282:10922–34.
7. Bonhoure E, Lauret A, Barnes DJ, Martin C, Malavaud B, Kohama T,et al. Sphingosine kinase-1 is a downstream regulator of imatinib-induced apoptosis in chronic myeloid leukemia cells. Leukemia2008;22:971–9.
8. Salas A, Ponnusamy S, Senkal CE, Meyers-Needham M, Selvam SP,Saddoughi SA, et al. Sphingosine kinase-1 and sphingosine 1-phos-phate receptor 2 mediate Bcr-Abl1 stability and drug resistance bymodulation of protein phosphatase 2A. Blood 2011;117:5941–52.
Cancer Res; 74(10) May 15, 2014 Cancer Research2814
Wallington-Beddoe et al.
on May 25, 2018. © 2014 American Association for Cancer Research. cancerres.aacrjournals.org Downloaded from
Published OnlineFirst March 31, 2014; DOI: 10.1158/0008-5472.CAN-13-2732

9. Sobue S, Nemoto S, Murakami M, Ito H, Kimura A, Gao S, et al.Implications of sphingosine kinase 1 expression level for the cellularsphingolipid rheostat: relevance as a marker for daunorubicin sensi-tivity of leukemia cells. Int J Hematol 2008;87:266–75.
10. Sankala HM, Hait NC, Paugh SW, Shida D, Lepine S, Elmore LW, et al.Involvement of sphingosine kinase 2 in p53-independent induction ofp21 by the chemotherapeutic drug doxorubicin. Cancer Res 2007;67:10466–74.
11. Weigert A, Schiffmann S, Sekar D, Ley S, Menrad H, Werno C, et al.Sphingosine kinase 2 deficient tumor xenografts show impairedgrowth and fail to polarize macrophages towards an anti-inflammatoryphenotype. Int J Cancer 2009;125:2114–21.
12. Hait NC, Bellamy A, Milstien S, Kordula T, Spiegel S. Sphingosinekinase type 2 activation by ERK-mediated phosphorylation. J BiolChem 2007;282:12058–65.
13. Baines AT, Xu D, Der CJ. Inhibition of Ras for cancer treatment: thesearch continues. Future Med Chem 2011;3:1787–808.
14. Zhang J,Mullighan CG, Harvey RC,WuG, Chen X, EdmonsonM, et al.Key pathways are frequently mutated in high-risk childhood acutelymphoblastic leukemia: a report from the Children's Oncology Group.Blood 2011;118:3080–7.
15. Steelman LS, Pohnert SC, Shelton JG, Franklin RA, Bertrand FE,McCubrey JA. JAK/STAT, Raf/MEK/ERK, PI3K/Akt and BCR-ABL incell cycle progression and leukemogenesis. Leukemia 2004;18:189–218.
16. Hait NC, Allegood J, Maceyka M, Strub GM, Harikumar KB, Singh SK,et al. Regulation of histone acetylation in the nucleus by sphingosine-1-phosphate. Science 2009;325:1254–7.
17. Dang CV. MYC on the path to cancer. Cell 2012;149:22–35.18. Arvanitis C, Felsher DW. Conditional transgenic models define how
MYC initiates and maintains tumorigenesis. Semin Cancer Biol2006;16:313–7.
19. Seo JY, Lee SH, Kim HJ, Yoo KH, Koo HH, Cho YG, et al. MYCrearrangement involving a novel non-immunoglobulin chromosomallocus in precursor B-cell acute lymphoblastic leukemia. Ann Lab Med2012;32:289–93.
20. Meeker ND, Cherry AM, Bangs CD, Frazer JK. A pediatric B lineageleukemia with coincident MYC and MLL translocations. J PediatrHematol Oncol 2011;33:158–60.
21. Levens D. You Don't Muck with MYC. Genes Cancer 2010;1:547–54.22. Ott CJ, Kopp N, Bird L, Paranal RM, Qi J, Bowman T, et al. BET
bromodomain inhibition targets both c-MYC and IL7R in high-riskacute lymphoblastic leukemia. Blood 2012;120:2843–5.
23. Gaundar SS, Bradstock KF, Bendall LJ. p38MAPK inhibitors attenuatecytokine production by bonemarrow stromal cells and reduce stroma-mediated proliferation of acute lymphoblastic leukemia cells. CellCycle 2009;8:2975–83.
24. Crazzolara R, Cisterne A, Thien M, Hewson J, Baraz R, Bradstock KF,et al. Potentiating effects of RAD001 (Everolimus) on vincristine ther-apy in childhood acute lymphoblastic leukemia. Blood 2009;113:3297–306.
25. Juarez J, Bradstock K, Gottlieb D, Bendall L. Effects of inhibitors of thechemokine receptor CXCR4 on acute lymphoblastic leukemia cells invitro. Leukemia 2003;17:1294–300.
26. Saunders P, Cisterne A, Weiss J, Bradstock KF, Bendall LJ. Themammalian target of rapamycin inhibitor RAD001 (everolimus) syner-gizes with chemotherapeutic agents, ionizing radiation and protea-some inhibitors in pre-B acute lymphocytic leukemia. Haematologica2011;96:69–77.
27. Webb J. Effect of more than one inhibitor. In:Hochster R, Quastel J,editors. Enzymes andmetabolic inhibitors, vol. 1. New York:AcademicPress; 1963, p. 487–512.
28. Juarez J, Dela Pena A, Baraz R, Hewson J, Khoo M, Cisterne A, et al.CXCR4 antagonists mobilize childhood acute lymphoblastic leukemiacells into the peripheral blood and inhibit engraftment. Leukemia2007;21:1249–57.
29. PaughSW,PaughBS,RahmaniM,KapitonovD, Almenara JA,KordulaT, et al. A selective sphingosine kinase 1 inhibitor integrates multiplemolecular therapeutic targets in human leukemia. Blood 2008;112:1382–91.
30. Coustan-Smith E, Song G, Clark C, Key L, Liu P, Mehrpooya M, et al.New markers for minimal residual disease detection in acute lympho-blastic leukemia. Blood 2011;117:6267–76.
31. Liang J, Nagahashi M, Kim EY, Harikumar KB, Yamada A, Huang WC,et al. Sphingosine-1-phosphate links persistent STAT3 activation,chronic intestinal inflammation, and development of colitis-associatedcancer. Cancer Cell 2013;23:107–20.
32. Bild AH, YaoG,Chang JT,WangQ, Potti A, ChasseD, et al. Oncogenicpathway signatures in human cancers as a guide to targeted therapies.Nature 2006;439:353–7.
33. SchuhmacherM, Kohlhuber F, Holzel M, Kaiser C, Burtscher H, JarschM, et al. The transcriptional program of a human B cell line in responseto Myc. Nucleic Acids Res 2001;29:397–406.
34. ENCODE Project Consortium. A user's guide to the encyclopedia ofDNA elements (ENCODE). PLoS Biol 2011;9:e1001046.
35. Beljanski V, Lewis CS, Smith CD. Antitumor activity of sphingosinekinase 2 inhibitor ABC294640 and sorafenib in hepatocellular carci-noma xenografts. Cancer Biol Ther 2011;11:524–34.
36. Liu H, Toman RE, Goparaju SK,MaceykaM, Nava VE, Sankala H, et al.Sphingosine kinase type 2 is a putative BH3-only protein that inducesapoptosis. J Biol Chem 2003;278:40330–6.
37. Maceyka M, Sankala H, Hait NC, Le Stunff H, Liu H, Toman R, et al.SphK1 and SphK2, sphingosine kinase isoenzymes with opposingfunctions in sphingolipidmetabolism. JBiol Chem2005;280:37118–29.
38. Chipuk JE,McStayGP,Bharti A, KuwanaT,ClarkeCJ, Siskind LJ, et al.Sphingolipid metabolism cooperates with BAK and BAX to promotethe mitochondrial pathway of apoptosis. Cell 2012;148:988–1000.
39. Liu K, Guo TL, Hait NC, Allegood J, Parikh HI, Xu W, et al. Biologicalcharacterization of 3-(2-amino-ethyl)-5-[3-(4-butoxyl-phenyl)-propylidene]-thiazolidine-2,4-dione (K145) as a selective sphingosinekinase-2 inhibitor and anticancer agent. PLoS ONE 2013;8:e56471.
40. Wattenberg BW, Pitson SM, Raben DM. The sphingosine and diacyl-glycerol kinase superfamily of signaling kinases: localization as a key tosignaling function. J Lipid Res 2006;47:1128–39.
41. Gao P, Smith CD. Ablation of sphingosine kinase-2 inhibits tumor cellproliferation and migration. Mol Cancer Res 2011;9:1509–19.
42. Okada T, Ding G, Sonoda H, Kajimoto T, Haga Y, Khosrowbeygi A,et al. Involvement of N-terminal-extended form of sphingosine kinase2 in serum-dependent regulation of cell proliferation and apoptosis.J Biol Chem 2005;280:36318–25.
43. Xiao M, Liu Y, Zou F. Sensitization of human colon cancer cells tosodium butyrate-induced apoptosis by modulation of sphingosinekinase 2 and protein kinase D. Exp Cell Res 2012;318:43–52.
44. Gomez L, Paillard M, Price M, Chen Q, Teixeira G, Spiegel S, et al. Anovel role for mitochondrial sphingosine-1-phosphate produced bysphingosine kinase-2 in PTP-mediated cell survival during cardiopro-tection. Basic Res Cardiol 2011;106:1341–53.
45. French KJ, Zhuang Y, Maines LW, Gao P, Wang W, Beljanski V, et al.Pharmacology and antitumor activity of ABC294640, a selective inhib-itor of sphingosine kinase-2. J Pharmacol Exp Ther 2010;333:129–39.
46. Beljanski V, Knaak C, Smith CD. A novel sphingosine kinase inhibitorinduces autophagy in tumor cells. J Pharmacol Exp Ther 2010;333:454–64.
47. Levine B, Kroemer G. Autophagy in the pathogenesis of disease. Cell2008;132:27–42.
48. Wallington-Beddoe CT, Hewson J, Bradstock KF, Bendall LJ. FTY720produces caspase-independent cell death of acute lymphoblasticleukemia cells. Autophagy 2011;7:707–15.
49. Antoon JW, White MD, Slaughter EM, Driver JL, Khalili HS, Elliott S,et al. Targeting NFkB mediated breast cancer chemoresistancethrough selective inhibition of sphingosine kinase-2. Cancer Biol Ther2011;11:678–89.
50. Dai Y, Chen S, Wang L, Pei XY, Kramer LB, Dent P, et al. Bortezomibinteracts synergistically with belinostat in human acute myeloid leu-kaemia and acute lymphoblastic leukaemia cells in association withperturbation in NF-kappaB and Bim. Br J Haematol 2011;153:222–35.
51. Lucas DM, Alinari L, West DA, Davis ME, Edwards RB, Johnson AJ,et al. The novel deacetylase inhibitor AR-42 demonstrates pre-clinicalactivity in B-cell malignancies in vitro and in vivo. PLoS ONE 2010;5:e10941.
www.aacrjournals.org Cancer Res; 74(10) May 15, 2014 2815
Sphingosine Kinase 2 Inhibition Suppresses c-Myc
on May 25, 2018. © 2014 American Association for Cancer Research. cancerres.aacrjournals.org Downloaded from
Published OnlineFirst March 31, 2014; DOI: 10.1158/0008-5472.CAN-13-2732

2014;74:2803-2815. Published OnlineFirst March 31, 2014.Cancer Res Craig T. Wallington-Beddoe, Jason A. Powell, Daochen Tong, et al.
ExpressionMYCEnhancing Sphingosine Kinase 2 Promotes Acute Lymphoblastic Leukemia by
Updated version
10.1158/0008-5472.CAN-13-2732doi:
Access the most recent version of this article at:
Material
Supplementary
http://cancerres.aacrjournals.org/content/suppl/2014/04/01/0008-5472.CAN-13-2732.DC1
Access the most recent supplemental material at:
Cited articles
http://cancerres.aacrjournals.org/content/74/10/2803.full#ref-list-1
This article cites 50 articles, 19 of which you can access for free at:
Citing articles
http://cancerres.aacrjournals.org/content/74/10/2803.full#related-urls
This article has been cited by 3 HighWire-hosted articles. Access the articles at:
E-mail alerts related to this article or journal.Sign up to receive free email-alerts
Subscriptions
Reprints and
To order reprints of this article or to subscribe to the journal, contact the AACR Publications Department at
Permissions
Rightslink site. Click on "Request Permissions" which will take you to the Copyright Clearance Center's (CCC)
.http://cancerres.aacrjournals.org/content/74/10/2803To request permission to re-use all or part of this article, use this link
on May 25, 2018. © 2014 American Association for Cancer Research. cancerres.aacrjournals.org Downloaded from
Published OnlineFirst March 31, 2014; DOI: 10.1158/0008-5472.CAN-13-2732