Embed Size (px)
Citation preview

18 August 2014
SpeedCast International Limited (ASX: SDA)
2014 half-year results presentation for SpeedCast Acquisitions Limited Group
SpeedCast International Limited provides the attached 2014 half-year results
presentation for SpeedCast Acquisitions Limited Group based upon the half year
financial results for the six months ended 30 June 2014.
CONFERENCE CALL DETAILS
The company has scheduled a Conference call as follows:
• Time: 10:30am (Australian Eastern Standard time), 18 August 2014
• Dial-In: Toll Free Australia: 1-800-505-544;
• International Dial-In: Toll Free HK: 800-963-316; USA: 866-830-1721;
• Conference Passcode: 6196180
For further information please contact:
Andrew Metcalfe
Company Secretary
Phone: +61 (0)3 9867 7199
Email: [email protected]
SpeedCast International Limited, ACN 600 699 241 Level 2 / 470 Collins Street, Melbourne VIC 3000, Australia Ph. +61 (3) 9867 7199
For
per
sona
l use
onl
y

1H FY2014 RESULTS PRESENTATION
18 August 2014
For
per
sona
l use
onl
y

2
Important notice Forward-looking statements
This presentation is issued by SpeedCast International Limited ACN 600 699 241 (the Company). The presentation includes certain forward-looking statements that
are based on information and assumptions known to date and are subject to various risks and uncertainties. Actual results, performance or achievements could be
significantly different from those expressed in, or implied by, these forward-looking statements. Such forward-looking statements are not guarantees of future
performance and involve known and unknown risks, uncertainties and other factors, many of which are beyond the control of SpeedCast, which may cause actual
results to differ materially from those expressed in the statements contained in these presentations. For example, the factors that are likely to affect the results of
SpeedCast include competition from satellite network service industry participants, competitive pressures from different methods of communication transmission,
reduced channels to customers as a result of vertical integration in the satellite network industry, the inability to secure sufficient satellite bandwidth to meet
anticipated future requirements and the loss of key customers. A number of these factors are described in SpeedCast’s replacement prospectus dated 5 August 2014
(Prospectus).
SpeedCast
The Company was incorporated on 14 July 2014. The Company acquired the SpeedCast satellite services business from SpeedCast Acquisitions Limited, the former
parent company of the SpeedCast group, under a restructure which completed on 14 August 2014 (Restructure). Refer to the Prospectus for further details of the
Restructure.
In this presentation, references to ‘SpeedCast’ means:
in the period before completion of the Restructure, SpeedCast Acquisitions Limited and its controlled entities and the business carried on by them; and
in the period after completion of the Restructure, the Company and its controlled entities and the business carried on by them.
Basis of Preparation
At 30 June 2014 SpeedCast International Limited has not been incorporated or admitted to the Official List of the ASX. It was incorporated on 14 July 2014 and
commenced trading on the ASX on 12 August 2014. It does not have a requirement to prepare statutory interim financial information before it prepares its first annual
financial report for the period ended 31 December 2014. However, in order to provide an update to shareholders, the directors have prepared this half year results
presentation for the six months to June 2014.
The financial information as at ,and for the six months to 30 June 2014 has been subject to a limited assurance review by PricewaterhouseCoopers Securities
Limited, which has issued an unqualified report in accordance with the Standard on Review Engagements ASRE 2400 Review of a Financial Report Performed by an
Assurance Practitioner Who is Not the Auditor of the Entity. The pro forma basis reflects a consolidation of SpeedCast Acquisitions Limited (“the Company”) and the
subsidiaries it controlled at 30 June 2014 as if they had been a consolidated group on 1 January 2014 and for the six months ended 30 June 2014. The financial
Information as at, and for the six months ended 30 June 2014 has been prepared in accordance with the recognition and measurement principles contained in
Australian Accounting Standards and the Company's adopted accounting policies as disclosed in Appendix A of the Prospectus lodged with ASIC on 5 August 2014
applied to the historic financial information and the events or transactions to which the pro forma adjustments relate, as described in section 3 of the Prospectus, as if
those events or transactions had occurred as at 1 January 2014.
Financial Information
Certain financial data included in this presentation, is ’non-IFRS financial information’. The Company believes that this non-IFRS financial information provides useful
information to users in measuring the financial performance and condition of SpeedCast. Readers are cautioned not to place undue reliance on any non-IFRS
financial information and ratios included in this presentation.
Currency
All amounts are in U.S. Dollars unless otherwise stated.
No offer of securities
Nothing in this presentation should be construed as either an offer to sell or a solicitation of an offer to buy or sell SpeedCast securities in any jurisdiction.
For
per
sona
l use
onl
y

3
Agenda
Overview of SpeedCast
1H FY2014 Results and Outlook
Appendices
For
per
sona
l use
onl
y

Overview of SpeedCast
1H FY2014 Results and Outloook
Appendices For
per
sona
l use
onl
y

5
Designs, implements, integrates, operates and maintains predominantly satellite–based communication networks
Serves over 1,000 customers across over 3,000 terrestrial sites, predominantly in Asia Pacific, and approximately 1,700 offshore rigs and vessels with satellite services
Operates a communications network with global reach, comprised of leased space segment on 41 different satellites and utilizing 26 teleports
A leading operator in the Asia Pacific region and the global maritime industry — headquartered in Hong Kong
Focuses on tailored solutions to five customer segments: telecom, maritime, natural resources, government and NGO and enterprise
Overview of SpeedCast
A leading provider of satellite-based communication networks and services in the Asia Pacific region and the global maritime industry
For
per
sona
l use
onl
y

6
Overview of SpeedCast (cont.)
Strong competitive position
5
A strong and sustainable competitive position
– Global network and infrastructure footprint and relationships
– Established brand and reputation
– Economies of scale
Strong track record of growth
2
A strong track record of revenue and earnings growth
– 36% FY2011-FY2013 pro forma EBITDA CAGR
High operating leverage and benefits from increasing scale
– 5 percentage point increase in EBITDA margins from FY2011 (11%) to FY2013 (16%)
Fragmented industry dynamics
4
SpeedCast operates in highly fragmented markets, comprised largely of providers focused on either specific countries or particular customer segments
SpeedCast considers that it is well positioned to benefit from future strategic acquisition opportunities as they arise
Demonstrated track record of successful
integration of acquisitions 3
Demonstrated ability to successfully integrate acquisitions and drive capability and scale benefits
– Three material acquisitions (ASC/Elektrikom/Pactel) in 2012 and 2013 and two small bolt-ons this year
Strong underlying fundamentals and high
growth end markets
1
Growing internet usage globally and additional bandwidth requirements
Increasing automation and sophistication of mission critical systems
Growing focus from governments and international organisations to bridge the "digital divide"
Regulatory and operational requirements in maritime driving adoption of services
Highly experienced management team
6
Led by PJ Beylier, who has been with SpeedCast for 14 years, including 10 years as Chief Executive Officer
For
per
sona
l use
onl
y

A focus on five key customer verticals
7
The common theme across verticals — increasing demand for data connectivity as the way businesses use technology changes
Telecom Maritime Natural
Resources
Government &
NGO
Enterprise
Example
customer
industries
ISPs
Telcos
Resellers
Shipping
Oil & Gas
Government
Yachting
Oil & Gas
Mining
Construction
Engineering
Military &
Defense
Emergency
services
Education
Rural
connectivity
Large
Enterprises
Banking sector
For
per
sona
l use
onl
y

Carrier grade, high quality global network
8
One of the largest buyers of satellite capacity in Asia Pacific. Bandwidth requirements are actively managed and scale drives significant operating efficiency
SpeedCast's satellite coverage, teleports and offices
For
per
sona
l use
onl
y

Overview of SpeedCast
1H FY2014 Results and Outlook
Appendices For
per
sona
l use
onl
y

10
Basis of preparation
At 30 June 2014 SpeedCast International Limited has not been incorporated or admitted to the Official List of the ASX. It was incorporated on 14 July 2014 and
commenced trading on the ASX on 12 August 2014. It does not have a requirement to prepare statutory interim financial information before it prepares its first
annual financial report for the period ended 31 December 2014. However, in order to provide an update to shareholders, the directors have prepared this half year
results presentation for the six months to 30 June 2014.
The financial information as at and for the six months to 30 June 2014 has been subject to a limited assurance review by PricewaterhouseCoopers Securities
Limited, which has issued an unqualified report in accordance with the Standard on Review Engagements ASRE 2400 Review of a Financial Report Performed by
an Assurance Practitioner Who is Not the Auditor of the Entity. The pro forma basis reflects a consolidation of SpeedCast Acquisitions Limited (“the Company”)
and the subsidiaries it controlled at 30 June 2014 as if they had been a consolidated group on 1 January 2014 and for the six months ended 30 June 2014. The
financial information as at, and for the six months ended 30 June 2014 has been prepared in accordance with the recognition and measurement principles
contained in Australian Accounting Standards and the Company's adopted accounting policies as disclosed in Appendix A of the Prospectus lodged with ASIC on
5 August 2014 applied to the historic financial information and the events or transactions to which the pro forma adjustments relate, as described in section 3 of
the Prospectus, as if those events or transactions had occurred as at 1 January 2014.
For
per
sona
l use
onl
y

11
1H FY2014 Highlights
Strong financial performance continuing:
– 1H FY2014 EBITDA of $9.6 million
– 1H FY2014 EBITA1 of $7.4 million
– 1H FY2014 NPATA2 of $4.8 million
Balanced contribution from customer verticals and geographies:
– Solid growth momentum in maritime, with strong backlog for 2H FY2014
– Afghanistan ahead of forecast with reduced churn
– Strong performance in Wholesale VoIP services due to increased prices, growing traffic and two
new customers
– Equipment sales stronger than expected in government & NGO and maritime
Acquisition of Satcomms Australia (June 2nd) and Oceanic (July 1st)
– Satcomms owns and operates a strategically located teleport in Perth and has their main office in
Queensland, where growth is expected from gas exploration activities
– Oceanic is PNG-focused with sales and engineering staff in Port Moresby, and operates a
telecom infrastructure comprised of a teleport and a wireless network
Integration of acquired businesses progressing as expected
Notes
1. EBITA is earnings before interest, tax and amortisation of acquisition related intangibles
2. NPATA is net profit after tax but prior to the amortisation of acquisition related intangibles (net of tax effect)
For
per
sona
l use
onl
y

12
Summary performance
(US$m)
Pro Forma 1H FY2014 actual (6 months ending
30 June 2014)
Prospectus Pro Forma
1H FY2014 forecast (6 months ending
30 June 2014)
Pro Forma actual vs. Prospectus Pro Forma forecast
(6 months ending 30 June 2014)
Service (ex. Afghanistan) 42.1 42.3 (0.2) Service (Afghanistan) 3.1 2.9 0.2 Equipment 7.2 6.4 0.8 Wholesale VoIP 5.9 5.4 0.4 Total revenue 58.2 57.0 1.2 Total Operating expenses (48.6) (47.8) (0.8) EBITDA 9.6 9.2 0.4 EBITDA margin 16.4% 16.1% 0.3%
Depreciation (2.1) (2.1) (0.1) EBITA1 7.4 7.1 0.3 Amortisation of acquired intangibles (2.9) (2.9) (0.0) EBIT 4.5 4.2 0.3 Net interest expense (1.0) (1.0) 0.0 Share of profits of Joint Ventures 0.1 0.1 0.0 Net profit/(loss) before tax 3.7 3.3 0.3 Income tax expense (1.2) (1.0) (0.1) NPAT 2.5 2.3 0.2
Amortisation of acquired intangibles after tax
2.3 2.3 0.0
NPATA2 4.8 4.6 0.2
Notes
1. EBITA is earnings before interest, tax and amortisation of acquisition related intangibles
2. NPATA is net profit after tax but prior to the amortisation of acquisition related intangibles (net of tax effect)
Three large contracts won in maritime
in Europe and a new global
partnership signed, as well as a
number of small/mid-sized wins in
Asia-Pacific and the Middle East
– Strong momentum going into
2H FY2014 with backlog of over
100 vessels
Natural resources growing ahead of
forecasts
Afghanistan churn has declined and
one significant new win in June;
positive outlook for 2H FY2014
Equipment sales 12% ahead of
Prospectus forecast:
– Renewal of a large Government
contract in Australia with
upgrade of remote equipment to
support additional bandwidth
– Continuous growth in maritime
with several wins in Europe
resulting in higher equipment
sales than expected
For
per
sona
l use
onl
y
13
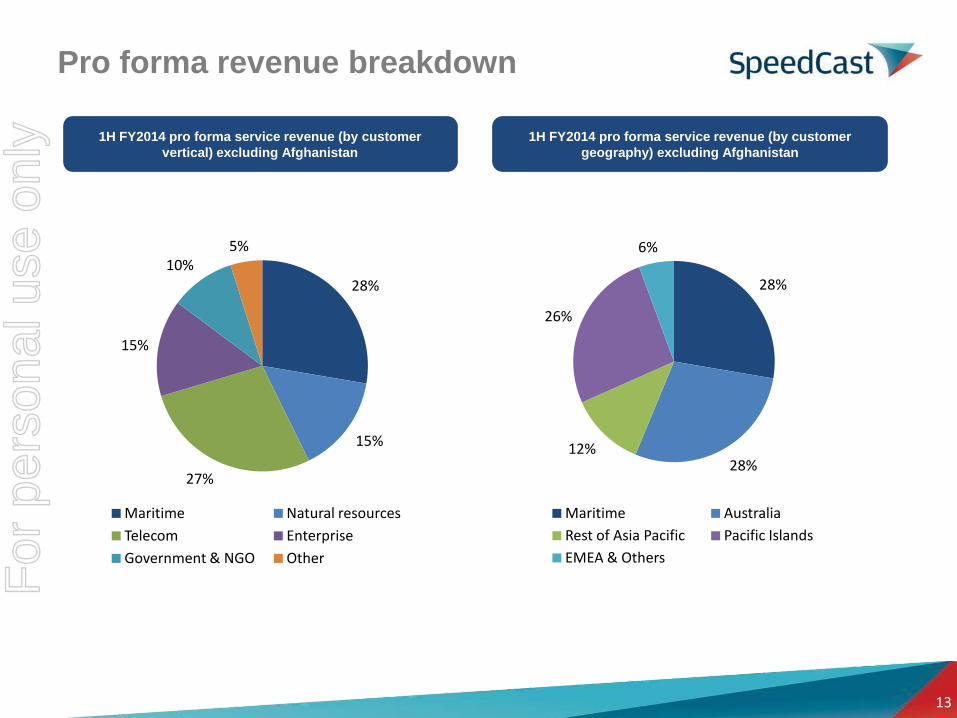
Pro forma revenue breakdown
1H FY2014 pro forma service revenue (by customer
vertical) excluding Afghanistan
1H FY2014 pro forma service revenue (by customer
geography) excluding Afghanistan
28%
15%
27%
15%
10% 5%
Maritime Natural resources
Telecom Enterprise
Government & NGO Other
28%
28% 12%
26%
6%
Maritime Australia
Rest of Asia Pacific Pacific Islands
EMEA & Others
For
per
sona
l use
onl
y

14
Pro forma income statement
(US$m)
Pro Forma 1H FY2014 actual (6 months ending
30 June 2014)
Prospectus Pro Forma FY2014 forecast
(12 months ending 31 December 2014)
Service (ex. Afghanistan) 42.1 89.7 Service (Afghanistan) 3.1 5.4 Equipment 7.2 12.7 Wholesale VoIP 5.9 11.2 Total revenue 58.2 119.0 Total Operating expenses (48.6) (98.4) EBITDA 9.6 20.6 EBITDA margin 16.4% 17.3% Depreciation (2.1) (4.5) EBITA1 7.4 16.1 Amortisation of acquired intangibles (2.9) (5.9) EBIT 4.5 10.2 Net interest expense (1.0) (2.0) Share of profits of Joint Ventures 0.1 0.2 Net profit/(loss) before tax 3.7 8.5 Income tax expense (1.2) (2.4) NPAT 2.5 6.1
Amortisation of acquired intangibles after tax 2.3 4.7 NPATA2 4.8 10.8
Notes
1. EBITA is earnings before interest, tax and amortisation of acquisition related intangibles
2. NPATA is net profit after tax but prior to the amortisation of acquisition related intangibles (net of tax effect)
For
per
sona
l use
onl
y

Strategy and Outlook
15
SpeedCast remains committed to the growth strategy outlined in the Prospectus
Strong underlying fundamentals High growth end markets Underlying market growth
Strategic acquisitions /
bolt-ons in a fragmented market
Highly fragmented markets Track record of M&A execution Cost and revenue synergies
Market share gains in targeted verticals
Maritime Natural resources (oil and gas) Partnerships with global telecom operators
Geographic and customer diversification /
penetration
Strong strategic position in Asia Pacific from which to grow Opportunities for growth across specific countries in Asia Existing satellite coverage in Africa and Middle East—following Asia Pacific
customers wherever they operate Aeronautical market
Continued product innovation and value-added
services
In-house product and software development capabilities Established partnerships with technology vendors
Outlook
We remain highly confident of achieving FY2014 pro forma actual results in line with the FY2014 pro forma financial forecasts in the Prospectus
12 months to June 2015 pro forma financial forecasts remain unchanged from the Prospectus
For
per
sona
l use
onl
y

Overview of SpeedCast
1H FY2014 Results and Outlook
Appendices For
per
sona
l use
onl
y

17
Pro forma to Statutory reconciliation
US$m Note 1H FY2014 Statutory revenue 54.4 Pro forma impact of acquisitions 1 3.8 Pro forma revenue 58.2
US$m Note 1H FY2014 Statutory NPAT (5.5) Pro forma impact of acquisitions 1 0.3 Pro forma share of profit of joint ventures 2 0.1 Acquisitions transactions costs 3 0.5 Non-recurring foreign exchange net gain 4 (1.6) Amortisation 5 2.0 Share based payments 6 (0.0) Net finance costs adjustment 7 5.3 Public company costs 8 (0.4) IPO transaction costs 9 2.8 Tax effect of pro forma adjustments 10 (1.0) Pro forma NPAT 2.5
Notes
1. Pro forma impact of acquisitions - represents the pre-acquisition revenue and NPAT of SatComms (acquired effective 2 June 2014) and Oceanic (acquired effective 1 July 2014), and the add
back of a non recurring salary arrangement.
2. Pro forma share of profit of joint ventures - represents the pre-acquisition share of the NPAT of the joint ventures of SatComms.
3. Acquisitions transactions costs - represents due diligence and other transaction costs incurred by SpeedCast primarily in relation to SatComms and Oceanic.
4. Non recurring foreign exchange net gain - represents the pro forma add back of non-recurring foreign exchange net translation gains primarily in relation to debt held prior to the new banking
facilities, reflecting a stronger AUD exchange rate in 1H FY2014 compared to 31 December 2013.
5. Amortisation - represents the pro forma add back of historical amortisation expense to exclude accelerated amortisation charges for acquired trademarks and brand names following a
rebranding of group companies to SpeedCast.
6. Share based payments - represents the pro forma difference between the share based payments expense arising from the previous equity-settled ownership based compensation scheme and
the Long-term Incentive Plan which commenced upon the IPO of SpeedCast, as if the LTIP had commenced on 1 January 2014.
7. Net finance costs adjustment - represents the pro forma add back of net finance costs together with accelerated amortisation of borrowing costs on the debt held prior to the new banking
facilities, less the pro forma inclusion of net finance costs on the new banking facilities, as if the new banking facilities commenced on 1 January 2014.
8. Public company costs - represents the pro forma inclusion of the incremental costs that SpeedCast expects to incur as a public company, as if these costs were being incurred from 1 January
2014. These incremental costs will include Non-executive Director remuneration, additional audit and legal costs, listing fees, share registry fees, Directors' and officers' insurance premiums,
annual general meeting and annual report costs.
9. IPO transaction costs - represents the pro forma add back of costs of the offer which were accrued as at 30 June 2014, being 100% of all such costs which were not contingent on the IPO
proceeding as at that date. Total costs of the offer accrued as at 30 June 2014 amounted to $4.3m, of which $1.5m is attributable to contributed equity and the balance of $2.8m expensed in
statutory NPAT.
10. Tax effect of pro forma adjustments - represents the tax effect of the above pro forma adjustments. The pro forma effective tax rate for 1H FY2014 is consistent with the Prospectus forecast
for this period.
For
per
sona
l use
onl
y

18
Strong track record of growth
Notes
1. EBITA is earnings before interest, tax and amortisation of acquisition related intangibles
2. NPATA is net profit after tax but prior to the amortisation of acquisition related intangibles (net of tax effect)
SpeedCast prepares its financial information in United States Dollars as its reporting currency
Pro Forma Historical Results Prospectus Pro Forma
Forecast Results
12 months ending 31 December 12 months ending 30 June
2015 December year end (US$m) FY2011 FY2012 FY2013 FY2014
Service revenue (ex. Afghanistan) 51.2 63.4 76.2 89.7 99.5
Service revenue (Afghanistan) 13.6 14.9 11.1 5.4 4.4
Equipment revenue 12.5 15.7 12.7 12.7 12.7
Wholesale VOIP revenue 9.7 8.9 11.4 11.2 11.9
Total revenue 87.0 102.9 111.3 119.0 128.5
Total revenue (ex Afghanistan) 73.5 87.9 100.2 113.6 124.1
EBITDA 9.5 15.9 17.5 20.6 24.0
EBITA1 6.6 12.5 13.8 16.1 18.9
NPAT 3.6 6.1 8.4
NPATA2 8.3 10.8 13.1
Key financial characteristics F
or p
erso
nal u
se o
nly

19
Strong track record of growth
Pro Forma Historical Results Prospectus Pro Forma
Forecast Results
12 months ending 31 December 12 months ending 30 June
20153 December year end (US$m) FY2011 FY2012 FY2013 FY2014
Service revenue (ex. Afghanistan) growth 24% 20% 18% 11%
Service revenue (Afghanistan) growth 10% (26%) (51%) (19%)
Equipment revenue growth 25% (19%) 0% 0%
Wholesale VOIP revenue growth (9%) 28% (1%) 6%
Total revenue growth 18% 8% 7% 8%
Total revenue (ex Afghanistan) growth 20% 14% 13% 9%
EBITDA
growth 67% 10% 17% 17%
EBITDA
margin 11% 15% 16% 17% 19%
EBITA growth1 90% 10% 17% 18%
EBITA margin1 8% 12% 12% 14% 15%
NPAT growth 68% 38%
NPATA
growth2 29% 21%
Notes
1. EBITA is earnings before interest, tax and amortisation of acquisition related intangibles
2. NPATA is net profit after tax but prior to the amortisation of acquisition related intangibles (net of tax effect)
3. 12 months ending 30 June 2015 compared to FY2014 (12 months ending 31 December 2014)
Key financial characteristics (cont.) F
or p
erso
nal u
se o
nly

20
Satellite service providers are a critical link in
the satellite industry value chain
Satellite service providers
Design, source, install, configure, integrate, operate and maintain the components required to provide a satellite communications solution to end users
Consumer market
customers
Satellite operators
Natural resources
Telecom Enterprise Broadcasters
Distributors/ network
integrators
Government and NGO
Maritime
Pay-television platforms
Broadband platforms
Application developers
Equipment/ hardware
manufacturers
Fibre owners/ operators
Teleport owners/ operators
Technology vendors
End users
Satellite industry value chain
For
per
sona
l use
onl
y

21
Satellite service providers such as SpeedCast provide the necessary infrastructure and capabilities to turn satellite capacity into a useful service for a wide range of end users
Satellite service providers are a critical link in
the satellite industry value chain (cont.)
Illustrative SpeedCast VSAT network setup
Remote: Outdoor unit is a signal converter, for converting signals from high to low frequencies, and a signal amplifier fitted to a dish. Transmits to and Receives from the satellite.
Router, modem and server: communicate with the Hub System, manage the routing of various types of traffic and host specific applications for that customer
Teleport: A datacenter and a large “Earth Station”
Data
Video
VoIP
Network Management System: the Network Operations Centre Interface to control the Hub System, monitor its activity and report on its performance. Online login also available to customers for observation.
Internet
Hub System: a central IT system to control bandwidth to the many remotes and the traffic within the links
Satellite: SpeedCast leases transponder capacity from satellite operators
Core Router
Cloud
The Managed Network Is extendable to the customer’s other sites
For
per
sona
l use
onl
y

22
Acquisitions
Business model evolution
A significant investment in platform and capabilities
Generalist satellite
service provider offering
primarily internet access
services to the small-
medium enterprise
market to capitalise on
the growing internet
usage
Specialised provider and
targeting larger
enterprise customers in
specific industries that
demand high reliability,
significant support and
complex, often
customised, solutions
Ongoing investment in networks,
technology enhancement and
platforms to provide greater
bandwidth, flexibility and
sophistication
Australian Satellite
Communications
(acquired 2012)
Eletrikom
(acquired 2013)
Pactel
(acquired 2013)
SatComms
(acquired June
2014)
Oceanic
(acquired July
2014)
Early days….. Today….. Adaptability
Diverse end markets
Diverse geographies
Enhanced capabilities
Product capability investment
For
per
sona
l use
onl
y

23
Industry growth drivers
Growing internet usage globally
Demand for data connectivity driving demand for VSAT systems and increased volumes
Growing internet usage globally generally via satellite in countries with no access to fibre
Satellite adopted as a reliable back-up to fibre broadband
User experience and requirement for fast, dedicated networks encouraging adoption of enterprise network systems
Increasing automation and sophistication of mission critical systems
Increasing remote operation of critical machinery, systems management and data collection
Natural resources companies increasingly reliant on data to optimise operations
Emergence of the "digital oil field"
Bridging the "digital divide"
Growing focus from Governments and international organisations on bridging the digital divide in rural areas and developing nations
Need for cellular operators to expand regional coverage (either by regulation or in search of customer growth)
Notes
1. Mobile data traffic includes handset-based data traffic, such as text messaging, multimedia messaging, and handset video services, as well as data used by wireless cards for portable computers
2. VSAT units includes Ku-band, C-band, O3b and HTS in-service units
-
50
100
150
200
-
1,000
2,000
3,000
4,000
5,000
6,000
2013 2014 2015 2016 2017 2018 2019 2020 2021 2022 2023
Serv
ice
reve
nu
es (
U$
m)
In-s
ervi
ce U
nit
s
Asia (LHS) Rest of the World (LHS)
Asia (RHS) Rest of the World (RHS)
2013-23 CAGR (revenues)
Rest of the World: 16.6%
Rest of the World: 16.1%
Asia: 18.8% Asia: 23.3% 2013-23 CAGR (units)
Source: Cisco, Visual Networking Index: Forecast and Methodology, 2013–2018 (2014)
Source: NSR, Energy Markets via Satellite, 4th Edition (2014)
Mobile data traffic, Asia, 2013–20181
Mining VSAT units and service revenue: Asia and rest of the world, 2013-20232
-
2,000
4,000
6,000
8,000
2013 2014 2015 2016 2017 2018
PB
per
mo
nth
For
per
sona
l use
onl
y

24
Industry growth drivers (cont.)
VAST addressing growing data connectivity requirements in maritime
Operational requirements
Regulatory requirements
High data requirements of core navigational systems
A communication tool to co-ordinate efforts to tackle piracy
0
10,000
20,000
30,000
40,000
50,000
2010 2011 2012 2013 2014E 2015F 2016F 2017F 2018F 2019F 2020F 2021F 2022F 2023F
0
200
400
600
800
1,000
2010 2011 2012 2013 2014E 2015F 2016F 2017F 2018F 2019F 2020F 2021F 2022F 2023F
Source: Euroconsult, Maritime Telecom Solutions by Satellite, 3rd Edition (2014)
Note
1. Includes revenue to satellite operators for the provision of satellite bandwidth used in maritime
VSAT service provision only. Does not include revenues to the VSAT service provider industry for
the provision of the services
Source: Euroconsult, Maritime Telecom Solutions by Satellite, 3rd Edition (2014)
On-board IT systems becoming more complex
Remote controlling of ship functions via satellite (e.g. "digital oil fields") cost effective for ship owners
Older communication technologies cannot support applications such as weather forecasting and video surveillance
Active maritime VSAT terminals 2010-2023
Total maritime VSAT revenue to satellite operators (US$m)
2010-20231
Crew welfare
Access to social media, entertainment and phone calls important to attract and retain new generation of seafarers
VSAT fixed fee model for unlimited usage model more financially feasible than MSS cost per usage model commonly used in MSS services
For
per
sona
l use
onl
y

Thank You
For
per
sona
l use
onl
y