Embed Size (px)
Citation preview

Science Journal of Circuits, Systems and Signal Processing 2015; 4(1): 1-8
Published online April 25, 2015 (http://www.sciencepublishinggroup.com/j/cssp)
doi: 10.11648/j.cssp.20140401.11
ISSN: 2326-9065 (Print); ISSN: 2326-9073 (Online)
Speech Enhancement Using Hilbert Spectrum and Wavelet Packet Based Soft-Thresholding
Md. Ekramul Hamid1, 2
, Md. Khademul Islam Molla1, Md. Iqbal Aziz Khan
1, 2, Takayoshi Nakai
2
1Dept. of Computer Science and Engineering, University of Rajshahi, Rajshahi, Bangladesh 2Dept. of Electric and Electronic Engineering, Shizuoka University, Hamamatsu-shi, Japan
Email address: [email protected] (Md. E. Hamid), [email protected] (Md. K. I. Molla), [email protected] (Md. I. A. Khan),
[email protected] (T. Nakai)
To cite this article: Md. Ekramul Hamid, Md. Khademul Islam Molla, Md. Iqbal Aziz Khan, Takayoshi Nakai. Speech Enhancement Using Hilbert Spectrum
and Wavelet Packet Based Soft-Thresholding. Science Journal of Circuits, Systems and Signal Processing. Vol. 1, No. 1, 2015, pp. 1-8.
doi: 10.11648/j.cssp.20140401.11
Abstract: A method of and a system for speech enhancement consists of Hilbert spectrum and wavelet packet analysis is
studied. We implement ISA to separate speech and interfering signals from single mixture and wavelet packet based soft-
thresholding algorithm to enhance the quality of target speech. The mixed signal is projected onto time-frequency (TF) space
using empirical mode decomposition (EMD) based Hilbert spectrum (HS). Then a finite set of independent basis vectors are
derived from the TF space by applying principal component analysis (PCA) and independent component analysis (ICA)
sequentially. The vectors are clustered using hierarchical clustering to represent the independent subspaces corresponding to
the component sources in the mixture. However, the speech quality of the separation algorithm is not enough and contains
some residual noises. Therefore, in the next stage, the target speech is enhanced using wavelet packet decomposition (WPD)
method where the speech activity is monitored by updating noise or unwanted signals statistics. The mode mixing issue of
traditional EMD is addressed and resolved using ensemble EMD. The proposed algorithm is also tested using short-time
Fourier transform (STFT) based spectrogram method. The simulation results show a noticeable performance in the field of
audio source separation and speech enhancement.
Keywords: Speech Enhancement, Ensemble Empirical Mode Decomposition, Source Separation,
Independent Subspace Analysis, Hilbert Spectrum, Wavelet Packet Decomposition
1. Introduction
The problem of separating different sound sources can be
classified as a denoising or enhancement problem, where the
“signal” is the important part of the audio stream, and the
“noise” is everything else. Although this is simple task for
human auditory system, the automated audio source
separation for speech enhancement can be considered as one
of the most challenging topics in current research. Audio
source separation or speech enhancement has many
applications including robust automatic speech recognition,
music transcription, surveillance applications, remixing of
studio recording etc.
Speech quality may significantly deteriorate in the
presence of interfering noise signals. The modern
communications systems, such as cellular phones, employ
some speech enhancement procedure at the preprocessing
stage, prior to further processing [1]. One approach to
separate the mixed audio signals is microphone array
processing [2]. The array processing requires hug
computation and inefficient to be used in real world
applications. Hence, present research trend is to reduce the
number of microphones used in recording of the intended
acoustical environment. Several noise reduction schemes
have been developed which try to suppress the signal
components corresponding to noise and enhance the target
component. This technique corresponds to the use of only
one microphone. For instance, in the application of spectral
noise suppression schemes [3, 4, 5] to speech enhancement
it is assumed that the signal of interest is the speech with its
typical speech pauses while the noise signal is regarded as
stationary and uninterrupted. Therefore, it is possible to
estimate the noise spectrum during speech pauses and
subsequently subtract it from the spectrum of the noise
contaminated speech segments in order to obtain the

2 Md. Ekramul Hamid et al.: Speech Enhancement Using Hilbert Spectrum and Wavelet Packet Based Soft-Thresholding
enhanced speech signal. Computational Auditory Scene
Analysis (CASA) is one of the first methods that tried to
decrypt the human auditory system in order to perform an
automatic audio source separation system [6]. A recent
advancement of single mixture audio separation is the
independent subspace analysis (ISA) method [7, 8]. The
study [8] describes a single stage source separation using
EMD and ICA. The method proposed KLD based clustering
algorithm to group the independent basis vectors and
experimental results show a good source separation
performance. The implementation of ISA is the extension of
basic ICA by decomposing an audio mixture into
independent source subspaces. Westner [7] implemented ISA
method to decompose a mixture spectrogram into
independent source subspaces and inverting them to yield
source separation. They employed short-time Fourier
transformation (STFT) to produce the time-frequency (TF)
representation (spectrogram) of the mixed signal and derived
a set of frequency-independent basis vectors to represent the
source subspaces. The STFT employed in TF representation
includes a certain amount of cross-spectral energy during the
overlap of the window between the successive time frames.
Two major limitations of STFT degrade the disjoint
orthogonality of the audio sources in TF domain. Another
study by Ghanbariet all in [9] presents a speech
enhancement algorithm based on adaptive thresholding
wavelet packet decomposition. A new VAD is designed in
wavelet domain and the method shows high performance in
speech enhancement.
The proposed method of speech enhancement consists of
two stages processing. In the first stage a source separation
algorithm is implemented using Hilbert spectrum where ISA
is used to separate audio sources from a single mixture and
in the second stage, a adaptive denoising algorithm is
implemented based on wavelet packet decomposition which
further enhance the target speech quality. The Hilbert
spectrum (HS) is employed for the TF representation of the
audio signals. The HS does not include noticeable amount of
cross-spectral energy terms. It is able to represent the
instantaneous spectral information of any time series without
windowing. The mode mixing issue of traditional EMD [10]
is addressed and resolved using ensemble EMD and Hilbert
transformation are employed together to derive HS. The
decomposition of the mixed signal in spectral domain is
obtained by the spectral projection between the mixture and
each IMF component. This vector space is used to derive a
set of independent basis vectors by applying PCA and ICA.
The hierarchical clustering algorithm is used to group the
basis vectors into the given number of component sources. A
further removal of background noise is obtained in the
second stage by wavelet packet decomposition (WPD)[9].
The enhancement process consists of a simple voice activity
detection (VAD) followed by noise estimation on the basis
of calculated subband SNR. From these values an adaptive
soft thresholding parameter is derived to update the wavelet
coefficients. This technique works well in cascade with the
source separation method. The waveforms, ISNR as well as
OSSR values show that this new multistage technique highly
improves the performance of speech enhancement results.
Regarding the organization of this paper, the basics of
EMD and HS are described in section 2, the separation and
enhancement algorithm are described in section 3 and 4, the
experimental results are presented in section 5, and finally
Section 6 contains conclusion of the study.
2. EMD Based Hilbert Spectrum (HS)
The principle of the EMD technique is to decompose any
signal x(t) into a set intrinsic mode functions Cm(t) (IMFs).
Each IMF satisfies two basic conditions: in the whole data
set the number of extrema and the number of zero crossing
must be same or differ at most by one, (ii) at any point, the
mean value of the envelope defined by the local maxima and
the envelope defined by the local minima is zero. At the end
of the decomposition the signal x(t) is represented as:
1
( ) ( ) ( )M
m M
m
x t C t r t=
= +∑ (1)
where M is the number of IMFs and rM(t) is the final residue.
Due to the presence of noise, traditional EMD is survived by
mode mixing problem. Mode mixing problem is defined as
an IMF that includes oscillations of dramatically disparate
scales or a component of similar scale residing in different
IMFs [11]. This issue is resolved by introducing ensemble
EMD algorithm.
Figure 1. IMFs of an audio mixture.First six IMFs out of total 16 IMFs.
2.1.Instantaneous Frequency
Instantaneous frequency (IF) is defined as the rate of
change of the phase. Every IMF is a real valued signal. The
discrete Hilbert transform (HT) is used to compute the
analytic signal for an IMF. The discrete HT denoted by
Hd[.]of the signal x(t)is given by:
,
1 ( )[ ( )]d
t
xH x t
tδ δ
δπ δ
∞
=−∞ ≠
=−∑ (2)
Then the analytic version of the mth
IMF ˆ ( )mC t is defined
as:
( )ˆ ˆ( ) ( ) [ ( )] ( ) mj t
m m d m mz t C t jH C t a t eθ= + = (3)
where am(t) and θm(t) are instantaneous amplitude and phase

Science Journal of Circuits, Systems and Signal Processing 2015; 1(1): 1-8 3
respectively of the mth
IMF. The analytic signal can be used
in determining the instantaneous quantities such as energy,
phase and frequency. The discrete-time IF of mth
IMF is then
given as the derivative of the phase θm(t) i.e.
( )( ) m
m
d tt
dt
θω =%
(4)
where ( )m tθ% represents the unwrapped version of
instantaneous phase θm(t).
2.2. Hilbert Spectrum
Hilbert Spectrum represents the distribution of the signal
energy as a function of time and frequency. Hilbert
transform on each IMF, the time series data can be expressed
as:
( )
1
( ) ( )m
Mj t dt
m
m
x t a t eω
=
∫= ℜ ∑ (5)
where ℜ(.) represents the real part of the complex number
and only M number of IMFs are taken into consideration
leaving the residue. To construct the Hilbert spectrum, the IF
values are first normalized between 0 to 0.5, then each IF
vector is multiplied by a scaling factor η [8].
The overall HS H(n,t) is defined as the weighted sum of
the instantaneous amplitudes of all the IMFs at nth
frequency
bin.
( )
1
( , ) ( ) ( )M
n
m m
m
H n t a t w t=
=∑ (6)
where the weight factor ( ) ( )n
mw t takes 1 if η×ωm(t) falls
within nth
band, otherwise is 0. After computing the elements
over the frequency bins, H represents the instantaneous
signal spectrum in TF space as a 2D table shown in figure 2.
Figure 2. Hilbert spectrum (HS) of an audio mixture using 256 frequency
bins.
Figure 3. The original signal (top), reconstructed signal (middle) and the
error signal (bottom).
2.3. Signal Reconstruction from HS
With step-by-step summing up the IMFs, it is possible to
build up the original signal with a minimum error. During
the Hilbert transform the real part of the signal remains
unchanged. The time domain signal xr(t) is easily be
reconstructed by filtering out the imaginary part from the HS
and summing over frequency bins as:
( ) ( , ) cos[ ( , )]r
n
x t H n t n tϕ= ⋅∑ (7)
where φ(n,t) is the phase matrix of Hilbert spectrum. The
phase matrix is saved during the construction of Hilbert
spectrum to be used in re-synthesis. The signal xr(t) is
reconstructed from the Hilbert spectrum given in figure 3.
The error between the original signal x(t) and xr(t) is also
shown.
3. Subspace Decomposition of Hilbert
Spectrum
The single mixture blind source separation BSS technique
decomposes the TF space of the mixture as the sum of
independent source subspaces. The ensemble empirical
mode decomposition (EMD) and Hilbert transformation are
employed together to derive HS. The Hilbert Spectrum of
the mixture signal is constructed by properly arranging the
frequency responses of the individual IMF along time and
frequency axes with preferred number of frequency bins.
3.1. Algorithm for Source Separation
The block diagram of the overall enhancement technique
is shown in figure 4. In this work, only the mixture of two
audio sources are taken into account and hence k=2. One
source is the speech signal and the other corresponds to the
interfering signal, which can be any noise source. The

4 Md. Ekramul Hamid et al.: Speech Enhancement Using Hilbert Spectrum and Wavelet Packet Based Soft-Thresholding
proposed single mixture source separation algorithm is
based on decomposing the Hilbert spectrum H of mixture
signal into a number of subspaces corresponding to each
independent source. It is assumed that the H can be
expressed as the weighted sum of p independent basis
vectors fi. The Hilbert spectrum can be represented in terms
of temporal basis vector zi as:
1
pT
i i
i
H f z=
=∑ (8)
where T stands here as transpose operator, each fi and zi is a
column vector of length equal to the number of frequency
bins and the number of time slices in H, respectively. The
subspaces are composed of a matrix with spectral
independent basis vectors in the columns as, ( ) ( ) ( )
1 2[ , , ],i
i i i
i b iF f f f F F= ⊆L , where bi is the required
number of basis vectors to represent the ith subspace. The
time-varying weight coefficients, i.e. temporal basis vectors
can be obtained from matrix multiplication of the pseudo-
inverse of the basis vectors spanned by Fi with H as: 1T
i iZ F H−= ,whereZi is the matrix containing the temporal
coefficients corresponding to Fi, and is represented as ( ) ( ) ( )
1 1, , ,
i
i i i
i b iZ z z z Z Z = ⊆ L . The Hilbert spectrum H of
the mixture signal can be decomposed as the sums of k
independent source subspaces,
( ) ( )
1 1 2 2
1 1
( )ibk
T T T T i i T
k k i i j j
i j
H F Z F Z F Z F Z f z= =
= + + + = =∑ ∑L (9)
The principal objective of the proposed separation method
is to derive some independent basis vectors and to group
them into k subsets (Fi; i=1, 2, …, k) representing the spectra
of the individual audio sources.
Figure 4. Block diagram of the enhancement algorithm using proposed
technique.
3.2. Basis Vector Selection
Singular value decomposition (SVD) is a well-
definedgeneralization of the PCA and becomes an important
tool in statistical data analysis and signal processing. SVD of
Xn×l is the factorization of the form T
n l n n n l l lX U D V× × × ×= ,
where U and V are orthogonal matrices (with orthogonal
columns) and D is a diagonal matrix of M singular values.
The spectral projection (coherence) vectors of the mixture
on to individual IMF components are used to derive the
spectral independent basis vectors. The spectral projection of
the mixture signal x(t)on to the mth IMF is defined as:
2( )
( ) ; 1,2,....,( ) ( )
xm
xm
x m
nn n N
n n
χζ
ψ ψ= = (10)
where χxm(n) is the cross spectrum of the mixture and the mth
IMF, ψx(n) and ψm(n) are the marginal power spectra of the
mixture signal and the mth IMF respectively at frequency
index n. The term ζxm(n) is a quantitative measure of how
much the mixture is correlated with mth IMF at nth frequency
bin.
3.3. Independent Basis Vectors
The basis vectors obtained by SVD are not statistically
independent but they are uncorrelated. The selected basis
vectors ui∈U or vi∈V will undergo the ICA process to derive
the independent source subspaces. ICA yields the
observation vector γ as the product of mixing matrix Γ and
the vectors of statistically independent signals as γ α= Γ ,
where Γ is an q×r (pseudo-) invertible mixing matrix with
orthogonal columns, α is the random vector of r signals, and
γ is the q-dimensional vector of observations with q≥r [12].
In this model, γ is the reduced set of basis vectors, i.e., T
n pUγ ×= if selected from U or T
l pVγ ×= if selected from V,
and p is the number of required basis vectors determined by
the dimension reduction method. The principle of the ICA
algorithm is to determine the recovery (unmixing) matrix 1−Λ ≈ Γ such that
ϑ γ α= Λ = ΛΓ (11)
where ϑ is the vector containing the statistically independent
signals which are very similar to α. The JadeICA algorithm
[13] is used here to estimate matrix Λ from the reduced set
of selected basis vectors. The resulting vector ϑ corresponds
to the spectral-independent basis vector FT=[f1, f2, f3……fp]or
temporal-independent basis vector ZT=[z1, z2, z3……zp]
depending on the selection of γ from U or V, respectively.
3.4. Clustering of Independent Basis Vectors
Once the spectral independent basis vectors are obtained,
the basis vectors are then grouped into the number of
sources. The proposed hierarchical clustering algorithm for
finding the clusters around the mixing vectors is tested. We
follow bottom-up (agglomerative) strategy that the starting
point is the single samples, considering them as clusters that
contain only one object. Clusters are then combined, so that
the number of clusters decreases while the average number
of objects per cluster increases. The clustering algorithm to
gather the independent basis vectors into k groups (here,
k=2). To measure the distance between clusters, we use the
Euclidean distance based on the normalized samples. Given

Science Journal of Circuits, Systems and Signal Processing 2015; 1(1): 1-8 5
a set of N items to clustered and an N*N distance (or
similarity) matrix and D=[d(i,j)] is the proximity matrix. The
algorithm is summarized bellow [14]:
1) Start with the disjoint clustering having level L(0) = 0
and sequence number m=0.
2) Find the least dissimilar pair (r), (s) of clusters in the
current clustering ����, ���� � min�∈�,�∈� �����, ���� ,
where the minimum is over all pairs of clusters in the
current clustering.
3) Increment the sequence number: m=m+1. Merge
clusters (r) and (s) into a single cluster to form next
clustering m. Set the level of this clustering to ���� ������, ����. 4) Update the proximity matrix, D, by deleting the rows
and columns corresponding to clusters (r) and (s) and
adding new rows and columns to the new formed
cluster (k). Then the proximity between the new and
old cluster is defined as �����, ��, ��� � min �����, ����, �����, ���� if all
objects are in one cluster, stop. Otherwise, go to step 2.
We have implemented a reversible process from Hilbert
spectrum to get back the time domain target speech signal as
discussed in the previous section 2.3.
4. Speech Enhancement using Wavelet
Packet Decomposition (WPD)
The wavelet packet transform (WPT) is a generalization
of the decomposition process that offers a better
performance compared to the ordinary wavelet methods [9].
In the wavelet analysis, a signal is split into an
approximation and a detail. The approximation is then itself
split into a second-level approximation and detail and the
process is repeated. By applying WPT on each input frame
we produce 2Jsubband wavelet packets, where J is the
number of levels for WPT. If W denotes the wavelet
transform matrix, then the separated speech y(t) after the
first stage in wavelet domain is defined as Y=Speech+Noise.
The proposed enhancement system consists of the following
sections:
4.1. SNR Estimation
We calculate signal-to-noise ratio (SNR) for each subband
which provides information about the noise in the current
subband of wavelet packets using the relation:
����,� � 10�� !" ∑ €%,&' �(�)*+,-./∑ £%,&' �(�)*+,-./ (12)
where € is the wavelet packet coefficients in the level J of
the k-th subband and £ is the estimated noise. The estimated
noise £ is updated during the silence segment as detected by
the Voice Activity Detector (VAD). We have used a simple
VAD based on adaptive linear energy measures [15]. For
that a full-band energy measure calculates the wavelet
packets energy of the incoming frames. Then the threshold
value is calculated to estimate the background noise. The
initial threshold is defined as 1� � !2∑ 13234" , where v is
the number of frames and Em is energy of m-th frame. Now
if the frame of the incoming frame is greater than the
threshold, the frame is judged as a speech frame. The new
threshold is calculated as 1�,567 � �1 8 9�1�,:(; < 91��(65=6,
where Esilence is the energy calculated from the silence frames
which is calculated from the variance >? � @A��1��(65=6� of
the observed speech. The coefficient p (0<p<1) is taken
adaptively from the ratio of the variance of the incoming
frame and variance of the silence frame.
Figure 5. Block diagram of the speech enhancement method in stage-2
using WPD based soft-thresholding.
4.2. Noise Update
During the silence segments, we update the estimated
subband noise energy as:
∁�,5� C∁�,5D! < �1 8 C�∑ £�?���E*D!(4" (13)
where ∁ denotes the k-th subband energy of n-th silence
segment and coefficient β is 0.9 which is selected by
experiment.
4.3. Adaptive Soft-Thresholding Function
We estimate node wise threshold to handle non-stationary
noise segment present in the separated target speech. When
the input frame is detected as a silence frame, the node
depended threshold A is updated. Then we update the
threshold adaptively on the basis of the SNR for each
subband is defined as
F�,� � G H�,�,5 < IJ�,�,5 8 H�,�,5KLM)N%,&O ����,� P 0,J�,�,5,����,� R 0,(14)
where
H�,�,5 � � S�,�,50.6745�Y2[\���� J�,�,5 � 2H�,�,5
and n is the index of the silence segments, M represents the
median absolute estimated on the scale j and subband k and
A represents the estimated threshold value of the scale j and
the subband k updated at the n-th detected silence segment.
The factor τ is a factor to make the threshold approximately
equal to Aj,k,n. The factor 2< τ seems to be adequate so that
for SNR>10dB where the threshold values equal to Aj,k,n.
Then the proposed non linear soft-thresholding function is
Noise
Update

6 Md. Ekramul Hamid et al.: Speech Enhancement Using Hilbert Spectrum and Wavelet Packet Based Soft-Thresholding
determined as
F]I^, F�,�K � _ ^,|^| P F�,��� \�^�. |a|bc*,&b+, , |^| R F�,� (15)
where γ=3 which is used for optimization and Y in the target
speech in wavelet domain. This value is used for
thresholding the wavelet packet coefficients of the separated
target speech in each subband [9].
5. Experimental Results
The efficiency of the proposed enhancement technique is
tested in two steps, 1) separate the signals from the mixture
of two audio sources and 2) enhance the quality of the target
source. Both mix1 (speech with telephone ring sound) and
mix2 (speech with flute sound) mixtures are used in the
experiments. The two recorded signals with normalized
amplitudes are added to make 0dB SNRs. The speech signal
of each mixture comprises utterances of several words
spoken by the same speaker. The audio signals are sampled
at 16 kHz sampling rate and 16-bit amplitude resolution. The
mixed signal is divided into blocks of 0.25s by using Tukey
window with 50% overlapping. The average value of the
running short-term relative energy between the original and
separated signals is used to measure the separation
efficiency is termed as the original-to-separated-signal ratio
(OSSR) and defined mathematically as
2
1
21
1
( )1
log10
( )
w
Tj
wt
r
j
x t j
OSSRT
x t j
=
=
=
+ = +
∑∑
∑ (16)
where x(t) and xr(t) are the original and separated
(reconstructed) signals, respectively, T is the total time
length, w is a 10ms square window. The OSSR values show
the similarity between two signals. If the two signals are
exactly equal, the OSSR value will be 0, that is a smaller
deviation of OSSR from 0 indicates a higher degree of
separation. Henceforth, the male speech is denoted as
Signal1 and instrument signals as Signal2.
Table 1 shows the average OSSR of each signal for both
mixtures. The separation efficiency is compared between the
Hilbert-based method and the Fourier-based one; it shows
that the performance is higher for the Hilbert-based method.
Table 1. Experimental results (in terms of OSSR) of the proposed separation
algorithm using Fourier and Hilbert based methods.
Mixtures OSSR of Signal1 OSSR of Signal2
Fourier Hilbert Fourier Hilbert
mix1 (speech+ring) 0.37 0.26 0.04 0.02
mix2 (speech+flute) 0.44 0.36 0.25 0.14
The degradation of separation performance using Fourier-
based is increased due to overlapping in spectrum results a
lower TF resolution. Figure 6 and figure 7 show the
separation and enhancement results of speech flute mixture
using Fourier-based method. Figure 8 shows the same
experimental result of speech ring mixture using Hilbert-
based method.
Figure 6. Spectrograms: mixed signal (TL), Separated signals -flute (BL), speech (BR), Error (TR) using Fourier-based method.

Science Journal of Circuits, Systems and Signal Processing 2015; 1(1): 1-8 7
Figure 7. Waveforms (from top): mixed signal, Separated signals -flute,
speech and enhanced target speech using Fourier-based method.
To study the quantitative analysis of enhancement
performance in two stages, we have employed an
improvement of signal to noise ratio (ISNR) measure. The
ISNR [ISNR (dB)=SNRin-SNRout] represents the degree of
enhancement of the target signal when it is degraded by
interfering noise. Here SNRinand SNRout represent the input
and output SNRs, respectively. Table 2 shows the ISNR of
target signal for three mixtures using Fourier and Hilbert
based methods in two stages. The higher value of ISNR
indicates better quality signal and it is observed that Hilbert
based method is better than Fourier based method (in stage 1)
and a further improvement is obtained after WPD based soft
thresholding method (in stage 2). It is observed that the
separated speech from stage-1 contains some residual noise
which is successfully reduced in stage-2.
Figure 8. Waveforms (from top): Mixed signal, Clean signal- speech and ring tone, Separated signal- speech and ring tone and lastly the enhanced target
speech using Hilbert-based method.
Table 2. Experimental results (in terms of ISNR) of the proposed two stages
enhancement algorithm using Fourier and Hilbert based methods in two
stages.
Mixture Method signal1
Stage-1 (ISNR) Stage-2 (ISNR)
mix1 (speech+ring) Fourier 7.2 7.5
Hilbert 8.9 9.5
mix2 (speech+flute) Fourier 6.8 7.0
Hilbert 8.0 8.8
mix3 (speech+white
noise)
Fourier 6.0 7.4
Hilbert 8.1 9.2
6. Conclusion
We have presented a two stage method for speech
enhancement. It describes the effectiveness of Hilbert
spectrum (HS) in time-frequency (TF) representation of
audio signals. The efficiency of HS has been compared with
short-time Fourier transform (STFT) as a method of TF
representation with the consideration of disjoint
orthogonality of audio signals and the experimental results
show that Hilbert spectrum performs better than STFT based
spectrogram for TF representation. Usually, the higher
resolution in TF representation demonstrates the signal in
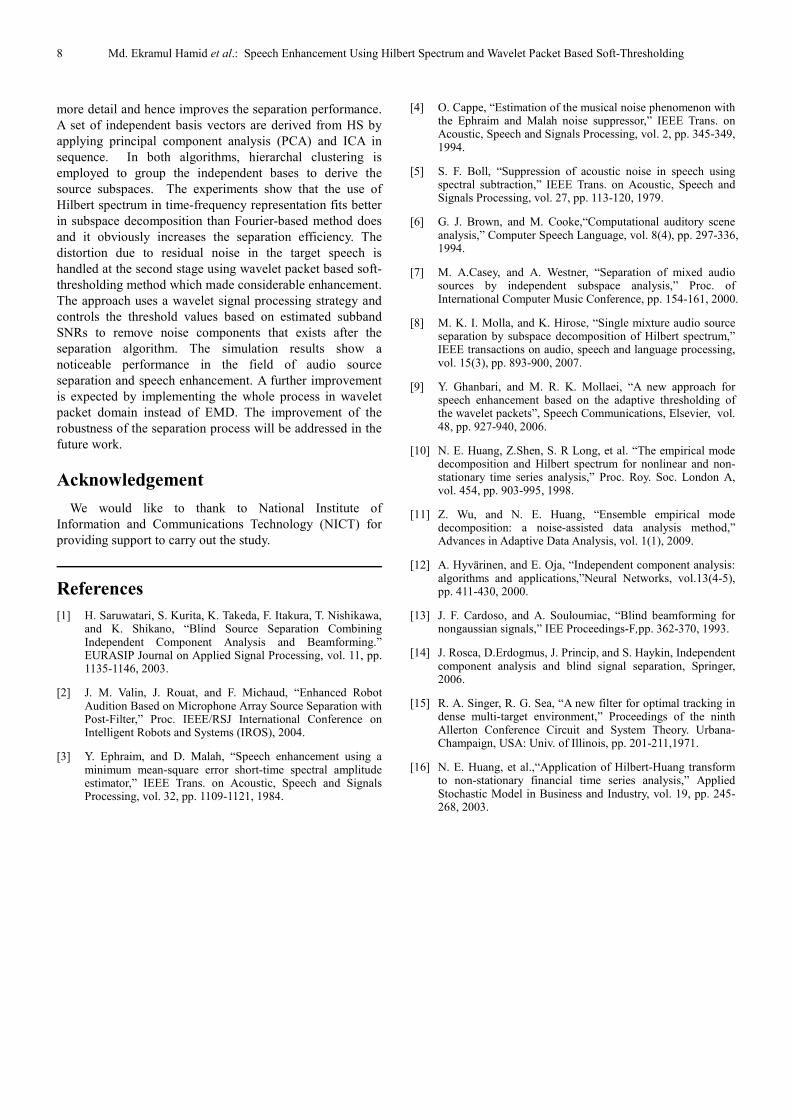
8 Md. Ekramul Hamid et al.: Speech Enhancement Using Hilbert Spectrum and Wavelet Packet Based Soft-Thresholding
more detail and hence improves the separation performance.
A set of independent basis vectors are derived from HS by
applying principal component analysis (PCA) and ICA in
sequence. In both algorithms, hierarchal clustering is
employed to group the independent bases to derive the
source subspaces. The experiments show that the use of
Hilbert spectrum in time-frequency representation fits better
in subspace decomposition than Fourier-based method does
and it obviously increases the separation efficiency. The
distortion due to residual noise in the target speech is
handled at the second stage using wavelet packet based soft-
thresholding method which made considerable enhancement.
The approach uses a wavelet signal processing strategy and
controls the threshold values based on estimated subband
SNRs to remove noise components that exists after the
separation algorithm. The simulation results show a
noticeable performance in the field of audio source
separation and speech enhancement. A further improvement
is expected by implementing the whole process in wavelet
packet domain instead of EMD. The improvement of the
robustness of the separation process will be addressed in the
future work.
Acknowledgement
We would like to thank to National Institute of
Information and Communications Technology (NICT) for
providing support to carry out the study.
References
[1] H. Saruwatari, S. Kurita, K. Takeda, F. Itakura, T. Nishikawa, and K. Shikano, “Blind Source Separation Combining Independent Component Analysis and Beamforming.” EURASIP Journal on Applied Signal Processing, vol. 11, pp. 1135-1146, 2003.
[2] J. M. Valin, J. Rouat, and F. Michaud, “Enhanced Robot Audition Based on Microphone Array Source Separation with Post-Filter,” Proc. IEEE/RSJ International Conference on Intelligent Robots and Systems (IROS), 2004.
[3] Y. Ephraim, and D. Malah, “Speech enhancement using a minimum mean-square error short-time spectral amplitude estimator,” IEEE Trans. on Acoustic, Speech and Signals Processing, vol. 32, pp. 1109-1121, 1984.
[4] O. Cappe, “Estimation of the musical noise phenomenon with the Ephraim and Malah noise suppressor,” IEEE Trans. on Acoustic, Speech and Signals Processing, vol. 2, pp. 345-349, 1994.
[5] S. F. Boll, “Suppression of acoustic noise in speech using spectral subtraction,” IEEE Trans. on Acoustic, Speech and Signals Processing, vol. 27, pp. 113-120, 1979.
[6] G. J. Brown, and M. Cooke,“Computational auditory scene analysis,” Computer Speech Language, vol. 8(4), pp. 297-336, 1994.
[7] M. A.Casey, and A. Westner, “Separation of mixed audio sources by independent subspace analysis,” Proc. of International Computer Music Conference, pp. 154-161, 2000.
[8] M. K. I. Molla, and K. Hirose, “Single mixture audio source separation by subspace decomposition of Hilbert spectrum,” IEEE transactions on audio, speech and language processing, vol. 15(3), pp. 893-900, 2007.
[9] Y. Ghanbari, and M. R. K. Mollaei, “A new approach for speech enhancement based on the adaptive thresholding of the wavelet packets”, Speech Communications, Elsevier, vol. 48, pp. 927-940, 2006.
[10] N. E. Huang, Z.Shen, S. R Long, et al. “The empirical mode decomposition and Hilbert spectrum for nonlinear and non-stationary time series analysis,” Proc. Roy. Soc. London A, vol. 454, pp. 903-995, 1998.
[11] Z. Wu, and N. E. Huang, “Ensemble empirical mode decomposition: a noise-assisted data analysis method,” Advances in Adaptive Data Analysis, vol. 1(1), 2009.
[12] A. Hyvärinen, and E. Oja, “Independent component analysis: algorithms and applications,”Neural Networks, vol.13(4-5), pp. 411-430, 2000.
[13] J. F. Cardoso, and A. Souloumiac, “Blind beamforming for nongaussian signals,” IEE Proceedings-F,pp. 362-370, 1993.
[14] J. Rosca, D.Erdogmus, J. Princip, and S. Haykin, Independent component analysis and blind signal separation, Springer, 2006.
[15] R. A. Singer, R. G. Sea, “A new filter for optimal tracking in dense multi-target environment,” Proceedings of the ninth Allerton Conference Circuit and System Theory. Urbana-Champaign, USA: Univ. of Illinois, pp. 201-211,1971.
[16] N. E. Huang, et al.,“Application of Hilbert-Huang transform to non-stationary financial time series analysis,” Applied Stochastic Model in Business and Industry, vol. 19, pp. 245-268, 2003.


![[FisTum] Hilbert](https://img.dokumen.tips/doc/110x75/577ccefd1a28ab9e788e96f5/fistum-hilbert.jpg)