Embed Size (px)
Citation preview
Spectrum-based Fault Localization: A Pair
Scoring Approach
Patrick Daniel and Kwan Yong Sim Faculty of Engineering, Computing and Science, Swinburne University of Technology Kuching, Sarawak, Malaysia
E-mail: [email protected]; [email protected]
Abstract—Spectrum-based Fault Localization (SBFL) is a
popular fault localization technique that ranks statements in
a program according to their suspiciousness to be faulty
based on the statement execution records (spectra) of pass
and fail test cases. Many SBFL metrics have been proposed
with varying accuracies in ranking of faulty statement. In
this paper we proposed a new SBFL metric based on a pair
scoring approach. We evaluated the performance of the
proposed metric and compare it with other existing SBFL
metrics. Despite its simplicity, we found the proposed metric
outperformed majority of the existing SBFL metrics.
Index Terms—Software Engineering, Software Testing,
Debugging, Spectrum-based Fault Localization
I. INTRODUCTION
Software testing and debugging are the most expensive
but necessary activity in software development life cycle
for software quality assurance [1] and [2]. In the software
development process, faulty statement in software code
may lead the software failures such as crash or incorrect
outputs and results. The task to determine and find the
faulty statement is called fault localization. In a software
system with thousands of lines of code, it will be very
time consuming for the software developer to locate the
faulty statement. Researchers in software debugging have
designed effective ways to find the fault statement
through fault localization approaches.
One of the popular in software debugging approaches
is Spectrum-based Fault Localization (SBFL) [3]-[8]. In
SBFL, the statement execution record (spectra) of pass
and fail test cases are analyzed to assist software
developer to locate the faulty statement. SBFL metrics
have been formulated to rank the statements in software
code according to their likeliness to be the faulty
statement. In SBFL, statement with the highest score
calculated by the SBFL metric will be ranked first for
inspection as it is the most suspected statement that might
be the faulty statement. On the other hand, the statement
with the lowest score is the safest statement as it is most
unlikely to be the faulty statement. Through this ranking,
software developer can inspect the top ranking statement
first to locate the faulty statement rather than checking
Manuscript received June 25, 2013; revised August 23, 2013.
statement by statement from the beginning until the end
of the software code.
The performance of SBFL metric is measured by how
fast it leads software developer to the faulty statement.
This is determined by how high it ranks the faulty
statement based on the score calculated from the SBFL
metric. Every SBFL metric is designed differently to rank
the suspected statement. This makes every SBFL metric
unique and has different capability in fault localization.
In this paper we propose a new SBFL metric named
pair scoring. This technique works by comparing the
execution paths of a pair of pass and fail test cases and
assign score to each statement according to its likeliness
to be the faulty statement. All possible combinations of
pass and fail test cases are paired for scoring and the total
score for each statement is used to rank the statement for
its likeliness to be faulty. We evaluated the performance
of the proposed metric on real life software artifacts and
compare it with other existing SBFL metrics. Despite its
simplicity, we found the proposed metric outperformed
majority of the existing SBFL metrics.
The remaining of this paper is organized as follow:
Section II outlines the preliminaries of Spectra-based
Fault Localization (SBFL), the test objected used and the
existing SBFL metrics studied in this paper for
comparison with the proposed SBFL metric. The new
SBFL is presented in Section III. Section IV describes the
experiments conducted to evaluate the performance of the
proposed metric and compares it with other existing
SBFL metrics. Section V discusses the findings and
Section VI concludes the paper.
II. PRELIMINARIES
Program spectra refer to information about statement
executions by test cases. Four common coefficients are
computed as the spectrum for each statement. These
coefficients are aef, anf, aep, and anp. The first
coefficient, aef, represents the number of fail test cases
that have executed the statement, whereas the second
coefficient, anf, represents the number of fail test cases
that have not executed the statement. Similarly, the third
coefficient, aep, represents the number of pass test cases
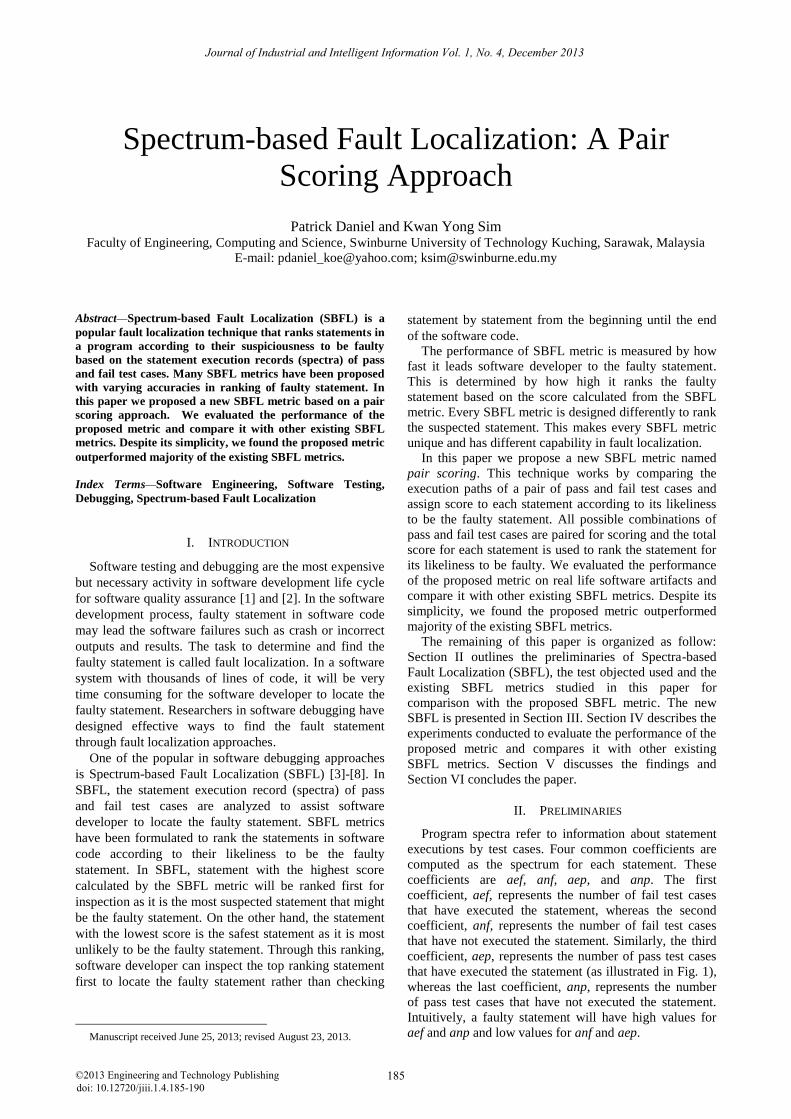
that have executed the statement (as illustrated in Fig. 1),
whereas the last coefficient, anp, represents the number
of pass test cases that have not executed the statement.
Intuitively, a faulty statement will have high values for
aef and anp and low values for anf and aep.
185
Journal of Industrial and Intelligent Information Vol. 1, No. 4, December 2013
©2013 Engineering and Technology Publishingdoi: 10.12720/jiii.1.4.185-190
Figure 1. Illustration of aef coefficient.
Based on coefficients aef, anf, aep, and anp, a SBFL
metric is used to compute a score for every statement to
rate its likeliness to be faulty. The statements are then
ranked from the highest score to the lowest score. To
locate the faulty statement, a software developer will
inspect the highest ranked statement first followed by the
lower ranked statements until the faulty statement is
located. Therefore, a good SBFL metric will rank faulty
statement high so that only few statements need to be
inspected before the faulty statement is successfully
located. Hence the performance of a SBFL metric is
commonly measured with the percentage of code
inspected (pci) before the faulty statement is successfully
located.
(1)
A. Testing Subject
The programs in Siemens Test Suite have been
selected as our subject programs to evaluate the
performance of the new SBFL metric. Programs in
Siemens Test Suite are commonly used to benchmark the
performance of SBFL metrics [9]-[12]. It is
downloadable from the Software Information Repository
[13]. Siemens Test Suite contains seven programs. Each
program has one original correct version and multiple
faulty versions of the program. The test case execution
scripts are included for each program. Table I shows the
specifications of programs in Siemens Test Suite which
include names of the programs, total faulty versions, total
lines of code, number of test cases, description of the
program, and list of the excluded versions.
In our experiment, all test cases will be executed for
each program. We exclude print_tokens {v4, v6} because
these versions are identical with the original correct
version of the program, where no faulty statement exists.
As we are focusing this study on single fault programs,
print_tokens {v1}, replace {v21}, schedule {v2, v7}, and
tcas {v10, v11, v15, v31, v32, v33, v40} are excluded
because the multiple faulty statements exist in these
versions. We also exclude print_tokens {v2}, replace
{v12}, tcas {v13, v14, v36, v38}, tot_info {v6, v10, v19,
v21} where the faulty statement is a non-executable
statement. In addition, some of the faulty versions do not
produce any failure output even though faulty statement
existed in program code. As a results, we exclude
print_tokens2 {v10}, replace {v32}, and schedule2 {v9}.
We use GCC version 4.6.1 Gcov(GNU-GCC), running on
Ubuntu 11.10 to gather the spectra from Siemens Test
Suite.
B. SBFL Metrics
Software debugging researchers have proposed various
number of SBFL metrics [3], [14]-[16] to produce the
best ranking for fault statement. The aim is to save
software developers’ time to locate the faulty statement in
real life situation by inspecting as little statement as
possible. Table II lists of existing SBFL metrics which
are evaluated in this paper.
TABLE I. SIEMENS TEST SUITE SPECIFICATIONS.
Program Faulty Versions LOC Number of Test
Cases Description Versions excluded in experiments
print_tokens 7 563 4130 Lexical analyser 1, 2, 4, 6
print_tokens2 10 508 4115 Lexical analyser 10
replace 32 563 5542 Pattern recognition 12, 21, 32
schedule 9 410 2650 Priority scheduler 2, 7
schedule2 10 307 2710 Priority scheduler 9
tcas 41 173 1608 Altitude separation 10, 11 ,13, 14, 15, 31, 32, 33, 36, 38, 40
tot_info 23 406 1052 Information measure 6, 10, 19, 21
186
Journal of Industrial and Intelligent Information Vol. 1, No. 4, December 2013
©2013 Engineering and Technology Publishing
TABLE II. SBFL METRICS
Name Formula Name Formula
Naish1
Zoltar
Naish2
Simple
Matching
Jaccard
Sokal
Anderberg
Rogers &
Tanimoto
Sorensen-
Dice Russel & Rao
Dice
AMPLE
qe
Tarantula
Wong1 CBI Inc.
Hamming etc. Ochiai
M1
M2
Kulczynski1
AMPLE2
Binary
Euclid
Wong3
Ochiai2
Arithmetic
Mean
Geometric
Mean
Harmonic
Mean
Rogot2
Cohen
III. METHODOLOGY OF NEW SBFL METRIC
The new SBFL metric is based on Pair Scoring, This
technique works by assigning score to each statement
based on the execution coverage of a pair of pass test case
and fail test case. An example is shown in Fig. 2.
Consider test case f and g for example. Scores are
assigned to each statement based on whether or not the
statement is executed by f and g. The highest score (2) is
given to the statement which is executed by fail test case f
but not executed by pass test case g because this coverage
combination to suggest that the statement is of high risk
and is likely to be faulty. The lowest score (0) is given to
the statement which is executed only by pass test case g
but not executed by fail test case f and also for the
statement which is not executed by both f and g. An
uncertain score (1) is given to statement which are
187
Journal of Industrial and Intelligent Information Vol. 1, No. 4, December 2013
©2013 Engineering and Technology Publishing
executed by both f and g. This pair scoring process is
repeated for all possible paring combinations of pass test
cases and fails test cases in the test suite. The sum of
scores for each statement is then used to rank the
statement for its likeliness to be faulty. The example in
Fig. 2 shows the faulty statement is ranked in the fifth out
of 25 based on the result of pair f and g. Based on this
illustration of how Pair Scoring works for a pair of test
case, we design a new SBFL metric which can be applied
to a set of test cases by taking all possible combinations
of pairing a past and a fail test cases based on the
execution or non-execution of a statement and multiply it
with the scores in Fig. 2.
Executed Fail 0 1 0 1
Executed Pass 0 0 1 1
Score 0 2 0 1
Line of Code 1 2 3 4 5 6 7 8 9 10 11 12 13 14 15 16 17 18 19 20 21 22 23 24 25
Fail TC [f] - - 1 - - 1 1 1 1 - # # - - - # # - # # - - - 1 1
Pass TC [g] - - 1 - - 1 1 # # - # # - - - 1 # - 1 # - - - 1 1
Fail TC [f] 0 0 1 0 0 1 1 1 1 0 0 0 0 0 0 0 0 0 0 0 0 0 0 1 1
Pass TC [g] 0 0 1 0 0 1 1 0 0 0 0 0 0 0 0 1 0 0 1 0 0 0 0 1 1
|2| Score 0 0 1 0 0 1 1 2 2 0 0 0 0 0 0 0 0 0 0 0 0 0 0 0 0
|3| Rank 6 7 3 8 9 4 5 1 2 10 11 12 13 14 15 16 17 18 19 20 21 22 23 24 25
|1|
Rules
Figure 2. Basic of Pair Scoring metrics.
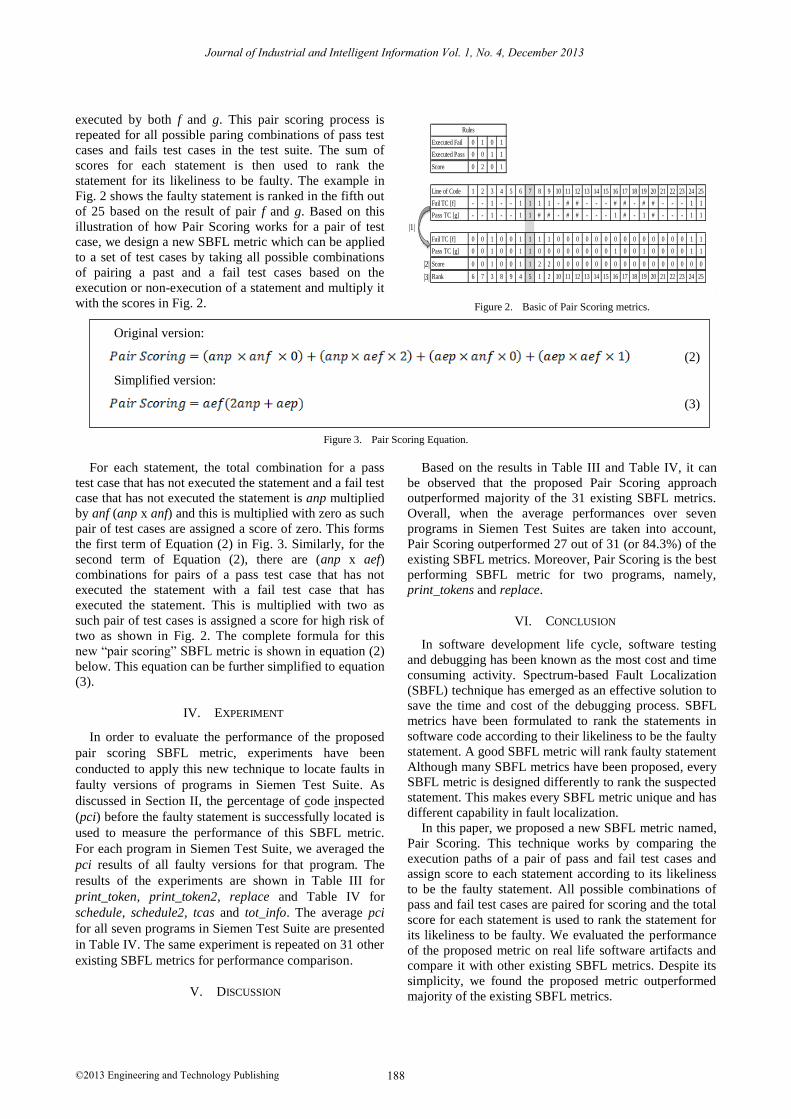
Figure 3. Pair Scoring Equation.
For each statement, the total combination for a pass
test case that has not executed the statement and a fail test
case that has not executed the statement is anp multiplied
by anf (anp x anf) and this is multiplied with zero as such
pair of test cases are assigned a score of zero. This forms
the first term of Equation (2) in Fig. 3. Similarly, for the
second term of Equation (2), there are (anp x aef)
combinations for pairs of a pass test case that has not
executed the statement with a fail test case that has
executed the statement. This is multiplied with two as
such pair of test cases is assigned a score for high risk of
two as shown in Fig. 2. The complete formula for this
new “pair scoring” SBFL metric is shown in equation (2)
below. This equation can be further simplified to equation
(3).
IV. EXPERIMENT
In order to evaluate the performance of the proposed
pair scoring SBFL metric, experiments have been
conducted to apply this new technique to locate faults in
faulty versions of programs in Siemen Test Suite. As
discussed in Section II, the percentage of code inspected
(pci) before the faulty statement is successfully located is
used to measure the performance of this SBFL metric.
For each program in Siemen Test Suite, we averaged the
pci results of all faulty versions for that program. The
results of the experiments are shown in Table III for
print_token, print_token2, replace and Table IV for
schedule, schedule2, tcas and tot_info. The average pci
for all seven programs in Siemen Test Suite are presented
in Table IV. The same experiment is repeated on 31 other
existing SBFL metrics for performance comparison.
V. DISCUSSION
Based on the results in Table III and Table IV, it can
be observed that the proposed Pair Scoring approach
outperformed majority of the 31 existing SBFL metrics.
Overall, when the average performances over seven
programs in Siemen Test Suites are taken into account,
Pair Scoring outperformed 27 out of 31 (or 84.3%) of the
existing SBFL metrics. Moreover, Pair Scoring is the best
performing SBFL metric for two programs, namely,
print_tokens and replace.
VI. CONCLUSION
In software development life cycle, software testing
and debugging has been known as the most cost and time
consuming activity. Spectrum-based Fault Localization
(SBFL) technique has emerged as an effective solution to
save the time and cost of the debugging process. SBFL
metrics have been formulated to rank the statements in
software code according to their likeliness to be the faulty
statement. A good SBFL metric will rank faulty statement
Although many SBFL metrics have been proposed, every
SBFL metric is designed differently to rank the suspected
statement. This makes every SBFL metric unique and has
different capability in fault localization.
In this paper, we proposed a new SBFL metric named,
Pair Scoring. This technique works by comparing the
execution paths of a pair of pass and fail test cases and
assign score to each statement according to its likeliness
to be the faulty statement. All possible combinations of
pass and fail test cases are paired for scoring and the total
score for each statement is used to rank the statement for
its likeliness to be faulty. We evaluated the performance
of the proposed metric on real life software artifacts and
compare it with other existing SBFL metrics. Despite its
simplicity, we found the proposed metric outperformed
majority of the existing SBFL metrics.
Original version:
(2)
Simplified version:
(3)
188
Journal of Industrial and Intelligent Information Vol. 1, No. 4, December 2013
©2013 Engineering and Technology Publishing
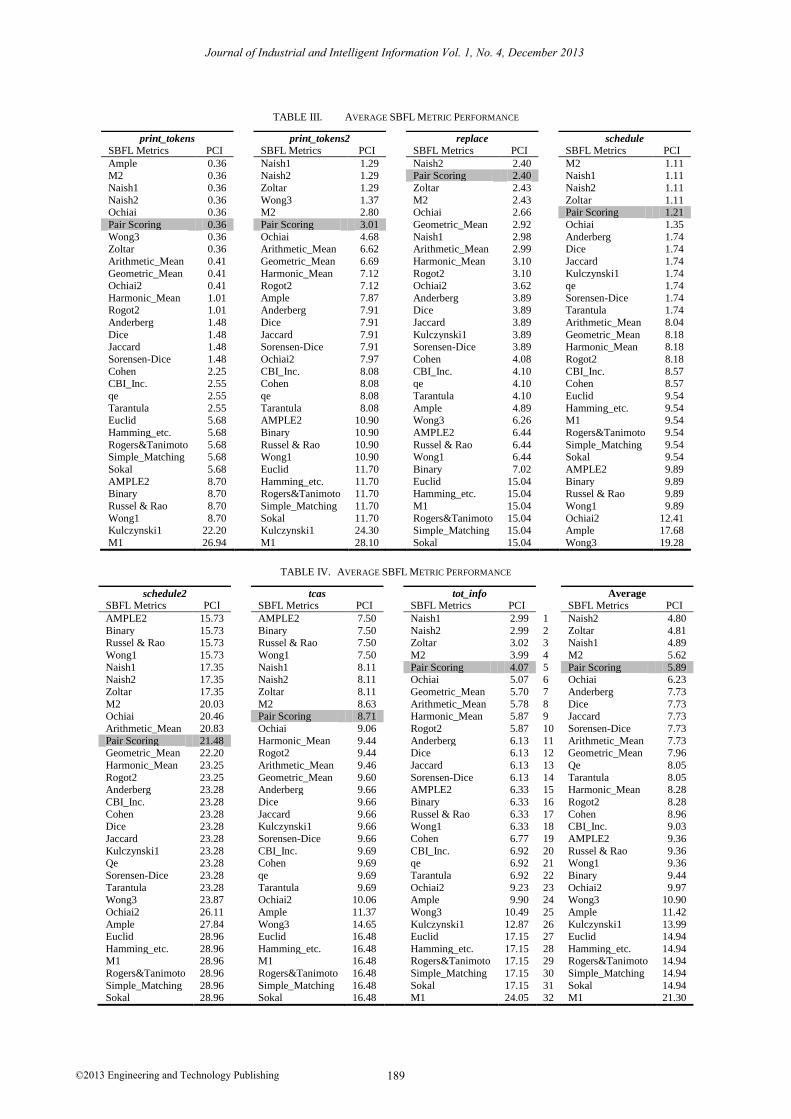
TABLE III. AVERAGE SBFL METRIC PERFORMANCE
print_tokens
print_tokens2
replace
schedule
SBFL Metrics PCI
SBFL Metrics PCI
SBFL Metrics PCI
SBFL Metrics PCI
Ample 0.36
Naish1 1.29
Naish2 2.40
M2 1.11 M2 0.36
Naish2 1.29
Pair Scoring 2.40
Naish1 1.11
Naish1 0.36
Zoltar 1.29
Zoltar 2.43
Naish2 1.11
Naish2 0.36
Wong3 1.37
M2 2.43
Zoltar 1.11 Ochiai 0.36
M2 2.80
Ochiai 2.66
Pair Scoring 1.21
Pair Scoring 0.36
Pair Scoring 3.01
Geometric_Mean 2.92
Ochiai 1.35
Wong3 0.36
Ochiai 4.68
Naish1 2.98
Anderberg 1.74 Zoltar 0.36
Arithmetic_Mean 6.62
Arithmetic_Mean 2.99
Dice 1.74
Arithmetic_Mean 0.41
Geometric_Mean 6.69
Harmonic_Mean 3.10
Jaccard 1.74
Geometric_Mean 0.41
Harmonic_Mean 7.12
Rogot2 3.10
Kulczynski1 1.74 Ochiai2 0.41
Rogot2 7.12
Ochiai2 3.62
qe 1.74
Harmonic_Mean 1.01
Ample 7.87
Anderberg 3.89
Sorensen-Dice 1.74 Rogot2 1.01
Anderberg 7.91
Dice 3.89
Tarantula 1.74
Anderberg 1.48
Dice 7.91
Jaccard 3.89
Arithmetic_Mean 8.04
Dice 1.48
Jaccard 7.91
Kulczynski1 3.89
Geometric_Mean 8.18 Jaccard 1.48
Sorensen-Dice 7.91
Sorensen-Dice 3.89
Harmonic_Mean 8.18
Sorensen-Dice 1.48
Ochiai2 7.97
Cohen 4.08
Rogot2 8.18
Cohen 2.25
CBI_Inc. 8.08
CBI_Inc. 4.10
CBI_Inc. 8.57 CBI_Inc. 2.55
Cohen 8.08
qe 4.10
Cohen 8.57
qe 2.55
qe 8.08
Tarantula 4.10
Euclid 9.54
Tarantula 2.55
Tarantula 8.08
Ample 4.89
Hamming_etc. 9.54 Euclid 5.68
AMPLE2 10.90
Wong3 6.26
M1 9.54
Hamming_etc. 5.68
Binary 10.90
AMPLE2 6.44
Rogers&Tanimoto 9.54
Rogers&Tanimoto 5.68
Russel & Rao 10.90
Russel & Rao 6.44
Simple_Matching 9.54 Simple_Matching 5.68
Wong1 10.90
Wong1 6.44
Sokal 9.54
Sokal 5.68
Euclid 11.70
Binary 7.02
AMPLE2 9.89
AMPLE2 8.70
Hamming_etc. 11.70
Euclid 15.04
Binary 9.89 Binary 8.70
Rogers&Tanimoto 11.70
Hamming_etc. 15.04
Russel & Rao 9.89
Russel & Rao 8.70
Simple_Matching 11.70
M1 15.04
Wong1 9.89
Wong1 8.70
Sokal 11.70
Rogers&Tanimoto 15.04
Ochiai2 12.41 Kulczynski1 22.20
Kulczynski1 24.30
Simple_Matching 15.04
Ample 17.68
M1 26.94 M1 28.10 Sokal 15.04 Wong3 19.28
TABLE IV. AVERAGE SBFL METRIC PERFORMANCE
schedule2
tcas
tot_info
Average
SBFL Metrics PCI
SBFL Metrics PCI
SBFL Metrics PCI
SBFL Metrics PCI
AMPLE2 15.73
AMPLE2 7.50
Naish1 2.99 1 Naish2 4.80
Binary 15.73
Binary 7.50
Naish2 2.99 2 Zoltar 4.81 Russel & Rao 15.73
Russel & Rao 7.50
Zoltar 3.02 3 Naish1 4.89
Wong1 15.73
Wong1 7.50
M2 3.99 4 M2 5.62
Naish1 17.35
Naish1 8.11
Pair Scoring 4.07 5 Pair Scoring 5.89 Naish2 17.35
Naish2 8.11
Ochiai 5.07 6 Ochiai 6.23
Zoltar 17.35
Zoltar 8.11
Geometric_Mean 5.70 7 Anderberg 7.73
M2 20.03
M2 8.63
Arithmetic_Mean 5.78 8 Dice 7.73 Ochiai 20.46
Pair Scoring 8.71
Harmonic_Mean 5.87 9 Jaccard 7.73
Arithmetic_Mean 20.83
Ochiai 9.06
Rogot2 5.87 10 Sorensen-Dice 7.73
Pair Scoring 21.48
Harmonic_Mean 9.44
Anderberg 6.13 11 Arithmetic_Mean 7.73 Geometric_Mean 22.20
Rogot2 9.44
Dice 6.13 12 Geometric_Mean 7.96
Harmonic_Mean 23.25
Arithmetic_Mean 9.46
Jaccard 6.13 13 Qe 8.05
Rogot2 23.25
Geometric_Mean 9.60
Sorensen-Dice 6.13 14 Tarantula 8.05 Anderberg 23.28
Anderberg 9.66
AMPLE2 6.33 15 Harmonic_Mean 8.28
CBI_Inc. 23.28
Dice 9.66
Binary 6.33 16 Rogot2 8.28
Cohen 23.28
Jaccard 9.66
Russel & Rao 6.33 17 Cohen 8.96 Dice 23.28
Kulczynski1 9.66
Wong1 6.33 18 CBI_Inc. 9.03
Jaccard 23.28
Sorensen-Dice 9.66
Cohen 6.77 19 AMPLE2 9.36
Kulczynski1 23.28
CBI_Inc. 9.69
CBI_Inc. 6.92 20 Russel & Rao 9.36 Qe 23.28
Cohen 9.69
qe 6.92 21 Wong1 9.36
Sorensen-Dice 23.28
qe 9.69
Tarantula 6.92 22 Binary 9.44
Tarantula 23.28
Tarantula 9.69
Ochiai2 9.23 23 Ochiai2 9.97 Wong3 23.87
Ochiai2 10.06
Ample 9.90 24 Wong3 10.90
Ochiai2 26.11
Ample 11.37
Wong3 10.49 25 Ample 11.42
Ample 27.84
Wong3 14.65
Kulczynski1 12.87 26 Kulczynski1 13.99 Euclid 28.96
Euclid 16.48
Euclid 17.15 27 Euclid 14.94
Hamming_etc. 28.96
Hamming_etc. 16.48
Hamming_etc. 17.15 28 Hamming_etc. 14.94 M1 28.96
M1 16.48
Rogers&Tanimoto 17.15 29 Rogers&Tanimoto 14.94
Rogers&Tanimoto 28.96
Rogers&Tanimoto 16.48
Simple_Matching 17.15 30 Simple_Matching 14.94
Simple_Matching 28.96
Simple_Matching 16.48
Sokal 17.15 31 Sokal 14.94 Sokal 28.96
Sokal 16.48
M1 24.05 32 M1 21.30
189
Journal of Industrial and Intelligent Information Vol. 1, No. 4, December 2013
©2013 Engineering and Technology Publishing
ACKNOWLEDGMENT
This work is supported via Malaysian Government
MOHE Fundamental Research Grant Scheme
(FRGS/2/2010/TK/SWIN/02/03).
REFERENCES
[1] B. Hailpern and P. Santhanam, “Software debugging, testing, and
verification,” IBM Systems Journal, 2002, vol. 40, no1. [2] G. J. Myers, The Art of Software Testing, 2nd edn. John Wiley and
Sons, Revised and updated by T.Badgett and T. M. Thomas with
C. Sandler: Hoboken, 2004. [3] H.J. Lee, L. Naish, and K. Ramamohanarao, “A model for spectra-
based software diagnosis,” ACM Transactions on Software
Engineering and Methodology, 2011, vol. 20, no. 3.
[4] X.Y. Xie, T. Y. Chen, and B. W. Xu, “Isolating suspiciousness
from spectrum-based fault localization techniques,” in Proc. 10th International Conference on Quality Software, 2010, pp. 385–392.
[5] X. Y. Xie, W .E. Wong, T. Y. Chen, and B. W. Xu, “Spectrum-
Based fault localization: testing oracles are no longer mandatory,” in Proc. 11th International Conference on Quality Software, 2011,
pp. 1–10.
[6] R. Abreu, P. Zoeteweij, and A. van Gemund, “On the accuracy of spectrum-based fault localization,” TAICPARTMUTATION, 2007,
pp. 89–98.
[7] H. J. Lee, L. Naish, and K. Ramamohanarao, “The effectiveness of using non redundant test cases with program spectra for bug
localization,“ in Proc. 2nd IEEE international Conference,
Computer Science and Information Technology, 2009, pp. 127–134.
[8] R. Abreu, P. Zoeteweij, and A. van Gemund, “An evaluation of
similarity coefficients for software fault localization,” in Proc. 12th PRDC, 2006, pp. 39–46.
[9] C. Gong, Z. Zheng, W. Li, and P. Hao, “Effects of class imbalance
in test suites: An empirical etudy of spectrum-based fault localization,” in Proc. IEEE 36th International Conference on
Computer Software and Applications Workshops, 2012, pp.470–
475. [10] R. Abreu, A. Gonzalez, P. Zoeteweij, and A. Van Gemund,
“Automatic software fault localization using generic program
invariants,” in Proc. SAC, Brazil, 2008, pp. 712–717.
[11] A. Bandyopadhyay, “Improving spectrum-based fault localization using proximity-based weighting of test cases,” in Proc. ASE,
USA, 2011, pp. 660–664.
[12] A. Bandyopadhyay, “Mitigating the effect of coincidental correctness in spectrum based fault localization,” in Proc. IEEE 5th
International Conference on Software Testing, Verification and
Validation, 2012, pp. 479–482. [13] H. Do, S. Elbaum, and G. Rothermel, “Supporting controlled
experimentation with testing techniques: An infrastructure and its
potential impact,” Empirical Software Engineering, 2005, vol. 10, no. 4, pp. 405–435.
[14] R. Abreu, W. Mayer, M. Stumptner and A. Van Gemund,
“Refining spectrum-based fault localization rankings,” in Proc. SAC, USA, 2009, pp.409–414.
[15] R. Abreu, A. Gonzalez, and A. Van Gemund, “Exploiting count
spectra for bayesian fault localization,” in Proc. PROMISE, Romania, 2010, pp. 1–10.
[16] A. Bandyopadhyay and S. Ghosh, “Proximity based weighting of
test cases to improve spectrum based fault localization,” in Proc. ASE, USA, 2011, pp. 420–423.
Patrick Daniel received his Bachelor of Science
(CSSE) from Swinburne University of
Technology in 2011. He is currently a Master of Science candidate at Swinburne University of
Technology, Sarawak Campus, Malaysia. His
research interest is software testing and debugging.
Kwan Yong Sim received his BEng (Hons)
from the National University of Malaysia in
1999 and Masters of Computer Science from University of Malaya, Malaysia in 2001. He is
currently a Senior Lecturer at the Faculty of
Engineering, Computing and Science, Swinburne University of Technology, Sarawak
Campus, Malaysia. His research interests are
software testing and analysis.
190
Journal of Industrial and Intelligent Information Vol. 1, No. 4, December 2013
©2013 Engineering and Technology Publishing