Embed Size (px)
Citation preview

Spectroscopy
The Light Spectrum
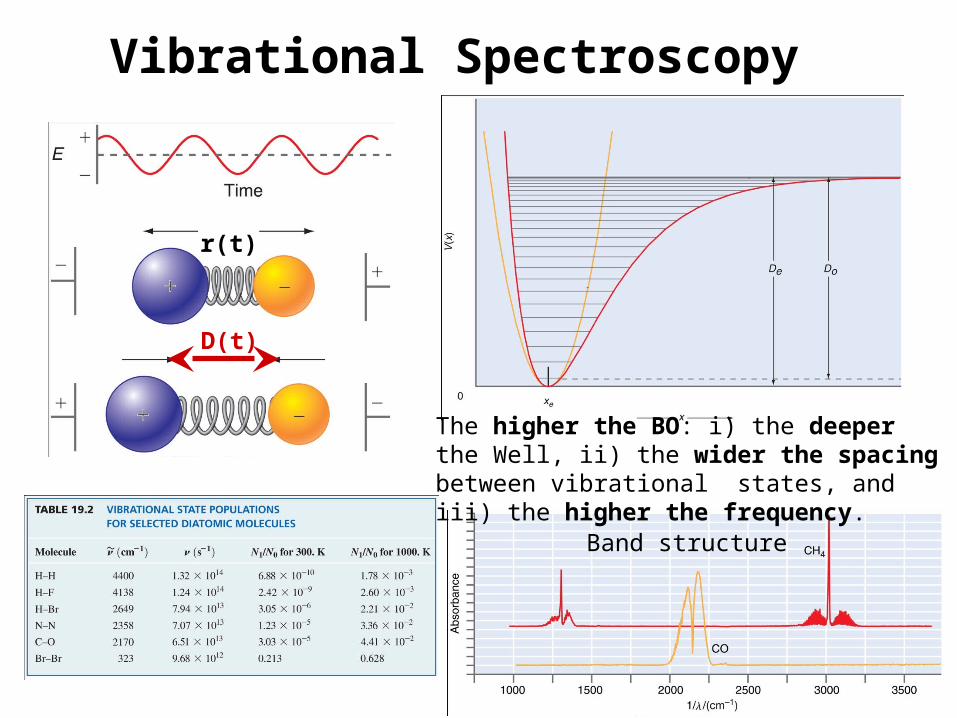
Vibrational Spectroscopy
D(t)
r(t)
Band structure
The higher the BO: i) the deeper the Well, ii) the wider the spacing between vibrational states, and iii) the higher the frequency.

Scanning Infrared Spectrometer
Grating Orientation (q)
Abso
rpti
on
0
( ) logI
AI
I0 = Blank
I = Sample
qq = Determines wavelength selected

Vibrational Spectra of Molecules
1 2
1 2
mmk
m m
k related to Bond Order
Reduced Mass
w= frequency ~ 1/l (1/cm) Wave numbers
l = wave length (cm)
C-H
C=O
O-H
C-CC-H

5
Photoelectron Spectroscopy
Another form of spectroscopy can be used to corroborate the orbital occupancies predicted by MO theory – photoelectron spectroscopy (PES). The principles behind photoelectron spectroscopy are the same as those behind the photoelectric effect:

6
As the energies of interest typically correspond to that of ultraviolet light PES is often referred to as UPES (ultraviolet photoelectron spectroscopy) spectrometer.
Similar to a mass spectrometer.
Photoelectron Spectroscopy
UV to X-ray
K.E. (electron) = hnUV - IE
IE = Ionization Energy
KE = Kinetic Energy= 1/2 mv2

The PES spectrum Neon is very simple, showing only one line for each orbital.
Photoelectron Spectroscopy of Neon
Unbound State
2s
2p
High KE
LowKE
High IE
Low IE
hn
O

Photoelectron Spectroscopy of Neon
Unbound State
2s
2p
High KE
LowKE
High IE
Low IE
hn
O
If in this UV PES a source with wavelength of 20 nm is used what would be thekinetic energy of an electron removed from the 2s and 2porbitals. Would 30 nm still work?
K.E. (electron) = hnUV – IE We need nuv and EI from 2s and 2p orbitals

9
Photoelectron Spectroscopy of Neonn = c/ = (l 3.0*108 m/s)/(20*10-9 m) = 1.5*1016 s-1
From the PES Spectrum: EI (2s) = 4750 kJ/mol & EI (2p) = 2100 kJ/molK.E.(2s) = hnUV – IE(2s)
= (6.626*10-34 Js)(1.5*1016 s-1) – (4,750,000 J/mol)/(6.02*1023 mol-1) = 9.93*10-18 J – 7.89*10-18 J
= 2.05*10-18 J 1 eV = 1.602*10-19 J
= (2.05*10-18 J) / (1.602*10-19 J/eV)
= 12.8 eV
K.E.(2p) = hnUV – IE(2p)
= 9.93*10-18 J – (2,100,000 J/mol)/(6.02*1023 mol-1)
= 9.93*10-18 J – 3.49*10-18 J
= 6.44*10-18 J
= (6.44*10-18 J)/ (1.602*10-19 J/eV) = 40.2 eV
1s
2s*
3s
1p
2p*
3s
1p
2s*
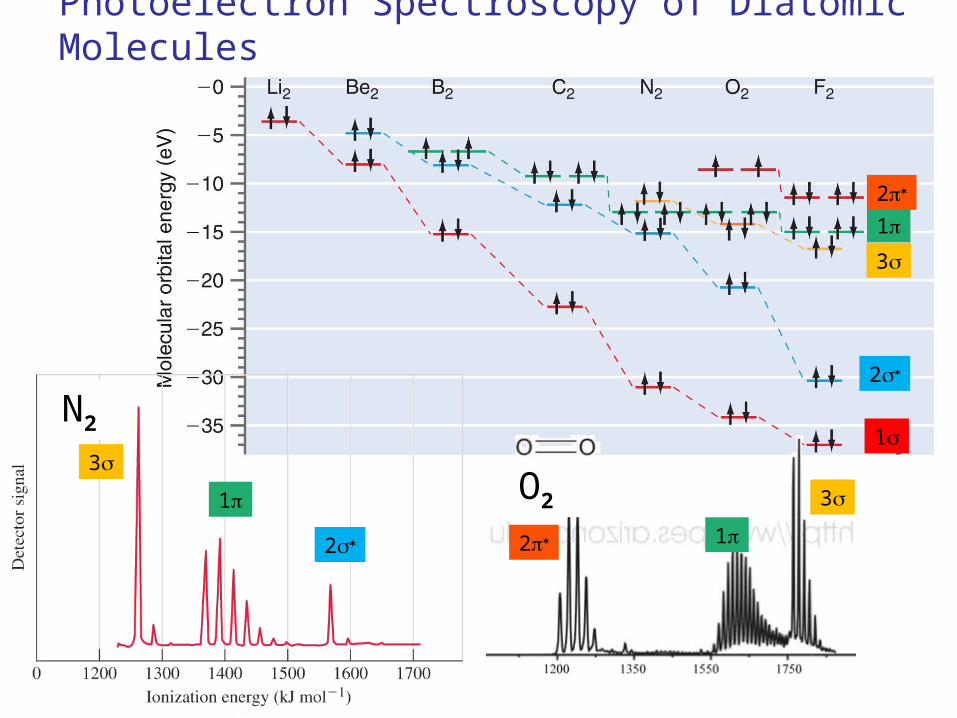
Photoelectron Spectroscopy of Diatomic Molecules
N2
O2
2p* 1p
3s

The PES spectrum of diatomics are more complex resulting from the are vibrational energy levels.
Without vibrational energy levels the lines in the PES spectrum would not be split as seen with neon.
When the UV photon is absorbed, and as the electron is emitted transitions take place from the ground state vibrational state of the molecule to an excited vibrational state of the cation.
The change in vibrational state reduces the KE of the electron ejected as a consequence of the conservation of energy.
Hence there is a distribution of KE’s of the electron from a particular MO is according to the vibrational transitions that are possible.
18
17
16
15
0Io
niza
tion
Ene
rgy
(eV
)
H2+
r (Å)0 1 2
H2
Vibrational Fine Structure

12
Vibrational fine structure indirectly gives the vibrational spectrum for the cation produced.
Comparison of the two vibrational spectra tells us how the bond was affected:
i) Loss of a nonbonding electron: the shape of the potential energy diagram for the molecule changes little.
ii) Loss of a bonding electron: the shape of the potential energy diagram changes dramatically – indicating weakening of the bond.
iii) Loss of an antibonding electron is removed: the shape of the potential energy diagram again changes dramatically – this time, indicating strengthening of the bond.
Photoelectron spectroscopy allows us to measure energies of orbitals – as well as confirming behaviour predicted by MO.
Vibrational Fine Structure

Experimental Evidence for MO Predictions
1s
2 *p
1p
2 s
3s
4s* N2 CO
1s2 * s
1p
1s2s
1p*
1p
2s*2s
3sp
3s*p 1s
2s*
1p
PES shows N2 and CO are isoelectronic.
As the vibrational frequency of N2+ is higher than CO+, the splitting is
wider. Increase in BO of the cation leads to large spacing in the 2s* signal. What is the vibrational frequency of N2
+ and CO+?

![Vibrational spectroscopy - start [CTCC wiki]wiki.ctcc.no/lib/exe/fetch.php?media=public:teaching:vib... · Vibrational spectroscopy Kenneth Ruud ... Some notable differences ... The](https://img.dokumen.tips/doc/110x75/5b0add5f7f8b9adc138ccaac/vibrational-spectroscopy-start-ctcc-wikiwikictccnolibexefetchphpmediapublicteachingvibvibrational.jpg)