Embed Size (px)
Citation preview
Spectroscopic Studies of Nano-Structures of Al and Fe Phases,
Bauxite and Their Thermally Activated Products
Huada Ruan B.Sc. Ag.(Hons.) South China Agricultural University, 1982
Ph.D. The University of Western Australia, 1996
This thesis is presented for the Degree of Doctor of Philosophy
of Queensland University of Technology
Centre for Instrumental and Developmental Chemistry
2005

This thesis is dedicated to my wife Suining Wang Ruan

ACKNOWLEDGEMENTS
I deeply express my sincere thanks to Associate Professor, Dr. Ray L. Frost, my supervisor
and Associate Lecturer, Dr. J. Theo Kloprogge, my co-supervisor, for their constant interest,
invaluable advice, encouragement and guidance throughout this research work.
I am grateful to Associate Professor, Dr. Peter Fredericks, for his advice, suggestions and
comments on this work, Dr. L. Rintoul for his assistance and comments on infrared and Raman
experiments, Dr. Thor Bostrom for his assistance in transmission electron microscopy, Mr. Loc
Duong, for his assistance and comments on scanning electron microscopy, the research group of
inorganic and material chemistry, Centre for Instrumental and Developmental Chemistry, for their
assistance and encouragement in many aspects of this work.
I gratefully acknowledge the Comalco Pty Ltd and the Australian Research Council for their
financial support of this research through an ARC (SPIRT) grant. The Centre for Instrumental and
Developmental Chemistry, Queensland University of Technology; the Agronomy Department,
Purdue University; the X26A beamline, NSLS, Brookhaven National Laboratory, Upton, New
York; are acknowledged for providing the infrastructure.
Finally I thank my wife Suining Wang Ruan, my son, Haoxiang Henry Ruan for their
understanding, assistance and support.

ABSTRACT
This thesis is made as it is submitted as a sum of published papers by the candidate. Aluminium hydroxides
including gibbsite, boehmite and diaspore, are the major components, while iron hydroxides/oxides and kaolinite are the
major impurities in bauxite. The dehydroxylation pathways during thermal activation of bauxite have been debated for
decades. Phase transformation during thermal activation or calcination of bauxite to achieve high yields of alumina has
been an important goal for the refining industry. This study deals with natural and synthetic aluminium and iron
hydroxides using vibrational spectroscopy in conjunction with X-ray diffraction and electron microscopy, followed by
the characterisation of the phase transformation in activated bauxite.
In the Raman spectra, gibbsite shows four bands at 3617, 3522, 3433 and 3364 cm-1, and bayerite shows seven
bands at 3664, 3652, 3552, 3542, 3450, 3438 and 3420 cm-1 in the hydroxyl stretching region. Five bands at 3445,
3363, 3226, 3119 and 2936 cm-1 for diaspore and four at 3371, 3220, 3085 and 2989 cm-1 for boehmite are present. The
far infrared spectrum of boehmite resembles that of diaspore in the 300-400 cm-1 region. Boehmite has two
characteristic bands at 366 and 323 cm-1 while diaspore has five at 354, 331, 250, 199 and 158 cm-1. The far infrared
spectrum of gibbsite resembles that of bayerite in the 230-300 cm-1 region. Gibbsite shows three characteristic bands at
371, 279 and 246 cm-1 whereas bayerite shows six at 383, 345, 326, 296, 252 and 62 cm-1. The far infrared spectra are
in-harmony with the FT-Raman spectra, allowing the study and differentiation of the stretching of AlO4 units to
characterize these four alumina phases. The surface properties of kaolinite and gibbsite are studied using Fourier
transform infrared photoacoustic spectroscopy (FTIR-PAS). The FTIR-PAS spectra of kaolinite are recorded at mirror
velocities of 0.05, 0.1, and 0.2 cm s-1, and compared to the gibbsite spectra recorded at mirror velocity of 0.2 cm s-1. It
is found that the hydroxyl surface spectra are a function of depth. For the FTIR spectroscopy of thermal
dehydroxylation of goethite to form hematite, the intensity of hydroxyl stretching and bending vibrations decreased
with the extent of dehydroxylation of goethite. Infrared absorption bands clearly show the phase transformation
between goethite and hematite, in particular the migration of excess hydroxyl units from goethite to hematite. Data
from the band component analysis of FT-IR spectra indicate that the hydroxyl units mainly affect the a- plane in
goethite and the equivalent c- plane in hematite. A larger amount of non-stoichiometric hydroxyl unit is found to be
associated with a higher aluminium substitution. A shift to a higher wavenumber of bending and hydroxyl stretching
vibrations is attributed to the effects of aluminium substitution associated with non-stoichiometric hydroxyl units on the
a-b plane relative to the b-c plane of goethite. The dehydroxylation pathways of both the aluminium hydroxides and the
impurities are intensively studied. Gibbsite completely decomposed at 250 °C, followed by boehmite and kaolinite at

500 °C. No phase transformations were observed for hematite, anatase, rutile or quartz up to 800 °C. Small amounts of
gibbsite transformed to boehmite but the majority transformed to chi (χ) alumina, a disordered transition alumina phase,
after dehydroxylation at 250 °C. The dehydroxylation pathways of crystalline gibbsite follow the orders: (a) gibbsite
(<250 °C) to boehmite (250-450 °C) to gamma alumina (γ) (500-800 °C); or (b) gibbsite (<250 °C) to chi alumina (χ)
(250-800 °C) to chi (χ) + kappa alumina (κ) (700-800 °C). Boehmite completely altered to gamma alumina (γ), while
kaolinite altered to metakaolinite at 500 °C.
The vibrational spectroscopy including FT-IR and FT-Raman, is a rapid, accurate and non-destructive
technique in characterising both single and mixed mineral phases. In particular, the vibrational spectroscopy has shown
its advantages over other techniques in terms of its sensitivity to hydroxyl groups. Future work on the simulation of
bauxite dehydroxylation with emphasis on the studies of transition aluminas is proposed. The application of the
advanced technique synchrotron x-ray spectroscopy, in addition to those techniques used in the present study, is
recommended.

LIST OF PUBLICATIONS DERIVED FROM THIS WORK
1. Ruan, H.D., Schulze, D. G., Johnston, C. T., Frost, R.L. and Kloprogge, J.T. (2005) Fourier
transform infrared spectroscopy and x-ray diffraction of activated bauxite. Clays Clay Miner. (submitted).
2. Ruan, H.D., Schulze, D.G., Guest, C.A. and Lanzirotti, A. (2005) Advantages of synchrotron X-ray diffraction and X-ray fluorescence in determining trace metal phases in Mn-Fe nodules from heterogeneous soil matrix. Clays Clay Miner. (submitted).
3. Ruan, H.D., Frost, R.L., Kloprogge, J.T., Schulze, D. G. and Duong, L. (2003) FT-IR photoacoustic spectroscopy of kaolinite and gibbsite surfaces. 2001 a Clay Odyssey, Proceedings of the International Clay Conference, 12th, Bahia Blanca, Argentina, July 22-28, 2001, Meeting Date 2001, 537-543.
4. Ruan, H.D., Frost, R.L., Kloprogge, J.T., Schulze, D. G. and Duong, L. (2003) FT-Raman spectroscopy of gibbsite, bayerite, boehmite and diaspore in relation to the characterization of bauxite. 2001 a Clay Odyssey, Proceedings of the International Clay Conference, 12th, Bahia Blanca, Argentina, July 22-28, 2001, Meeting Date 2001, 545-552.
5. Ruan, H.D., Frost, R.L., Kloprogge, J.T. and Duong, L (2002) Infrared spectroscopy of goethite dehydroxylation: III. FT-IR microscopy of in situ study of the thermal transformation of goethite to hematite. Spect. Acta Part A. 58 (5), 967-981.
6. Ruan, H.D., Frost, R.L., Kloprogge, J.T. and Duong, L (2002) Infrared spectroscopy of goethite dehydroxylation: II. Effect of aluminium substitution on the behaviour of hydroxyl units. Spect. Acta Part A. 58(3), 479-491.
7. Ruan, H.D., Frost, R.L., Kloprogge, J.T. and Duong, L (2002) Far-infrared spectroscopy of alumina phases. Spect. Acta Part A. 58, 265-272.
8. Ruan, H.D., Frost, R.L. and Kloprogge, J.T. (2001) The behavior of hydroxyl units of synthetic goethite and its dehydroxylated product hematite. Spect. Acta. Part A, 57, 2575-2586.
9. Ruan, H.D., Frost, R.L. and Kloprogge, J.T. (2001) Comparison of Raman spectra in characterizing gibbsite, bayerite, diaspore and boehmite. J. Raman Spectr. 32 745-750.
10. Ruan, H.D., Frost, R.L. and Kloprogge, J.T. (2001) Application of near-infrared spectroscopy to the study of alumina phases. App. Spect. 55, 190-196.
LIST OF PUBLICATIONS RELATED TO THIS WORK 1. Frost, R.L., Oliver, B. Ruan, H.D. and Kloprogge, J.T. (2005) Near-infrared spectroscopic
study of nontronites and ferruginous smectite. Vibrational Spect. (accepted). 2. Kloprogge, J.T., Schuiling, R.D., Ding, Z., Hickey, L., Ruan, H.D., Wharton, D. and Frost,
R.L. (2005) Vibrational spectroscopic study of syngenite formed during the treatment of liquid manure with sulphuric acid. Vibrational Spect. (submitted).
3. Kloprogge, J.T., Ruan, H.D., van der Eerden, A.J.M. and Frost, R.L. (2005) Near-infrared spectroscopy of hydrothermally synthesized 2:1 phyllosilicates in the system Na2O-Al2O3-SiO2-H2O. Am. J. Sci., (accepted).
4. Xiong Han Feng, Fan Liu, Wen Feng Tan, Jian Bo Wang and Huada Daniel Ruan (2004) Synthesis of Todorokite at Atmospheric Pressure. Chemistry of Materials (in press).
5. Frost, R.L., Ding, Z. and Ruan, H.D. (2003) Thermal analysis of goethite, relevance to Australian indigenous art. J. Thermal Analysis and Calorimetry 71, 783-797.
6. Kloprogge, J.T., Ruan, H.D. and Frost, R.L. (2002) Thermal decomposition of bauxite minerals: infrared emission spectroscopy of gibbsite, boehmite and diaspore. J. Mater. Sci. 37(6), 1121-1129.
7. Kloprogge, J.T., Ruan, H.D. and Frost, R.L. (2002) FT-IR and Raman microscopic study at 293 K and 77 K of celestine, SrSO4, from the middle traissic limestone (Muschelkalk) in Winterswijk, the Netherlands. Geologie en Mijnbouw/Netherlands Journal of Geosciences, 80 (2), 41-47.
8. Kloprogge, J.T., Visser, D. Ruan, H.D. and Frost, R.L. (2001) Infrared and Raman spectroscopy of holmquistite, Li2(Mg,Fe2+)3(Al,Fe3+)2(Si,Al)8O22(OH)2. J. Materials Science Lett. 20, 1497-1499.
9. Frost, R.L., Locos, O.B. Ruan, H.D. and Kloprogge, J.T. (2001) Near-Infrared and Mid-infrared spectroscopic study of sepiolites and palygorskites. Vibrational. Spect. 27, 1-13.
10. Kloprogge, J.T., Ruan, H.D. and Frost, R.L. (2001) Near-infrared spectroscopic study of basic aluminium sulfate and nitrate. J. Mat. Sci. 36, 603-607.
11. Ruan, H.D., Frost, R.L., Kloprogge, J.T. and Cox, M. (2000) Phosphorus accumulation in farm dams and streams: The applicability of findings from southern Western Australia to the Pumicestone catchment. Proceedings of PASSCON 2000, Pumicestone Passage & Deception Bay Catchment Conference, November , 22-23, Brisbane. 67-68.
12. Frost, R.L., Ruan, H.D. and Kloprogge, J.T. (2000) Application of infrared emission spectroscopy to the study of natural and synthetic inorganic materials. Internet J. Vibrational spect. 4, 1-5.
13. Ruan, H.D. and Gilkes, R.J. (2000) Accumulation of phosphorus in farm ponds and dams in South-Western Australia. J. Environ. Qual. 29, 1875-1881.
14. Kloprogge, J.T., Ruan, H.D. and Frost, R.L. (2000) Near-infrared spectroscopic study of [AlO4 Al12(OH)23(H2O)12]7+-O-Si(OH)3 nitrate crystals formed by forced hydrolysis of Al3+ in the presence of teos. Spect. Acta. Part A 56, 2405-2411.
15. Kloprogge, J.T., Ruan, H.D. and Frost, R.L. (2000) Near-infrared spectroscopic study of synthetic and natural pyrophyllite. J. Jb. Miner. Mh. 8, 337-347.
16. Frost, R.L., Ruan, H.D. Kloprogge, J.T. and Gates, W.P. (2000) Dehydroxylation and dehydroxylation of nontronites and ferruginous smectite. Thermochimica Acta 346, 63-72.

PRESENTATIONS DERIVED FROM OR RELATED TO THIS WORK 1. Ruan, H.D., Schulze, D.G. (2003) Dehydroxylation of bauxite characterized by Fourier
transform infrared spectroscopy and X-ray diffraction. Classic Clay and Minerals, A Joint CMS/MSA Meeting, June 7-12, Athens, Georgia.
2. Schulze, D.G., Ruan, H.D., Guest, C.A., Ross, D. and Lanzirotti, A. (2002) Synchrotron Micro X-ray Diffraction Analysis of Soil Materials. ASA-CSSA-SSSA 2002 Annual Meetings, November 10-14, Indianapolis, Indiana.
3. Ruan, H.D., Schulze, D.G., Guest, C.A., Ross, D. and Lanzirotti, A. (2002) Synchrotron micro X-ray diffraction of heterogeneous soil materials. Synchrotron Environmental Science II Conference. May 6-8, Agonne National Laboratory, Agonne IL.
4. Ruan, H.D., Frost, R.L and Kloprogge, J.T. (2001). FT-Raman spectroscopic study of bayerite, boehmite, diaspore and gibbsite. 12th International Clay Conference. July 22-28, Bahia Blance, Argentina.
5. Ruan, H.D., Frost, R.L and Kloprogge, J.T. (2001). FT-IR spectroscopic study of the effect of Al-substitution on thermal dehydroxylation of synthetic goethite. 12th International Clay Conference. July 22-28, Bahia Blance, Argentina.
6. Ruan, H.D., Frost, R.L and Kloprogge, J.T. (2001). FT-IR photoacoustic spectroscopy of kaolinite and gibbsite surfaces. 12th International Clay Conference. July 22-28, Bahia Blance, Argentina.
7. Ruan, H.D., Frost, R.L and Kloprogge, J.T. (2001). Clay mineral as a carrier for phosphorus transfer from soil to sediment in South-western Australia. 12th International Clay Conference. July 22-28, Bahia Blance, Argentina.
8. Ruan, H.D., Frost, R.L and Kloprogge, J.T. (2001). FT-IR microscopy of in situ thermal dehydroxylation of goethite. 4th Australian Conference of Vibrational Spectroscopy. July 9-11, Queensland University of Technology, Brisbane, Australia.
9. Ruan, H.D., Frost, R.L and Kloprogge, J.T. (2001). Far-infrared spectroscopy of boehmite, diaspore, gibbsite and bayerite. IUPAC 38th World Chemistry Congress, July 1-6, Brisbane, Australia, PA13, 271.
10. Ruan, H.D., Frost, R.L and Kloprogge, J.T. (2000). Application of FT-Raman spectroscopy in characterisation of bayerite, boehmite, diaspore and gibbsite. ICORS 2000 Conference, August 20-25, Beijing, P. R. China, 1128.
11. Frost, R.L., Kloprogge, J.T. and Ruan, H.D. (2000). Do the nontronites hold the key to life on Mars? - A Raman spectroscopic study. ICORS 2000 Conference, August 20-25, Beijing, P. R. China, 1138.
12. Ruan, H.D., Frost, R.L and Kloprogge, J.T. (2000). FT-Raman spectroscopy study of bayerite, boehmite, diaspore and gibbsite. The 17th Biennial Australian Clay Minerals Society Conference, April 10-12, Adelaide.
13. Ruan, H.D., Kloprogge, J.T. and Frost, R.L (2000). FT-infrared spectroscopic study of the effect of aluminium substitution on dehydroxylation of synthetic goethite. The 17th Biennial Australian Clay Minerals Society Conference, April 10-12, Adelaide.
14. Frost, R.L., Kloprogge, J.T., Ruan, H.D. and Gates, W. P. (2000). Do the Garfield and Uley nontronites hold the key to life on Mars? - A Raman spectroscopic study. The 17th Biennial Australian Clay Minerals Society Conference, April 10-12, Adelaide.

TABLE OF CONTENTS
ACKNOWLEDGEMENTS………………………………………………………..….ii ABSTRACT…………………………………………………………………...………iii LIST OF PUBLICATIONS DERIVED FROM THIS WORK………………….....iv LIST OF PUBLICATIONS RELATED TO THIS WORK…………………...…....v PRESENTATIONS DERIVED FROM OR RELATED TO THIS WORK……...vii TABLE OF CONTENTS……………………………………………………………viii LIST OF TABLES………………………………………………………………...….xii LIST OF FIGURES………………………………...……………………..………....xiv 1. BACKGROUNG AND LITERATURE REVIEW ON BAUXITE, ALUMINA PASES,
AND VIBRATIONAL SPECTROSCOPY……………………………..1 1.1. Occurrence of Bauxite……………………………………………………...…1
1.1.1. Composition of bauxite……………………………………………….…7 1.2. Alumina Phases…………………………………………………………...…...9
1.2.1. Gibbsite……………………………………..……..………………….....9 1.2.2. Bayerite……………………………………………..…………..….…..12 1.2.3. Diaspore………………………………………………………….….....15 1.2.4. Boehmite…………………………………………..…………..…….....19
1.3. Impurities………………………………………………………...…….….....21 1.3.1. Iron oxides…………………………………………………….….……21 1.3.2. Kaolinite…………………………………………………..……….…..25 1.3.3. Other minerals of impurities………………………………………..….26
1.4. Thermal activation of bauxite……………………………………………....26 1.4.1. Aluminium hydroxides…………………………………….…….…….26
1.4.1.1. Crystal size distribution and crystallinity……………………......30 1.4.1.2. Water vapour pressure (PH2O)………………………………..…..31 1.4.1.3. Heating rate…………………………………………………...….31
1.5. Review of vibrational spectroscopic studies…………..……………….…...32 1.5.1. Infrared spectroscopy……………………………………..……..…......32 1.5.2. Raman spectroscopy………………………………….………………..37 1.5.3. Infrared photoacoustic spectroscopy………………………………..…41
1.6. Summary……………………………………….……...…………………..…43 1.7. References……………………………...…………………………….…...…..45
2. GENERAL INTRODUCTION…………………………………………………..52 2.1. Objectives and Aims of This Research……………………………………..52 2.2. Format and Organisation of Thesis………………………………………...53
3. COMPARISON OF RAMAN SPECTRA IN CHARACTERISING GIBBSITE, BAYERITE, DIASPORE AND BOEHMITE RELATING TO BAUXITE…...…………………………………………………………………….54 3.1. Abstract…………………………………………………...…………….…....54 3.2. Introduction………………………………………………………..…….…..55 3.3. Materials and methods…………………………………………..……….….57 3.4. Results and discussion…………………………………………………….....58
3.4.1. Gibbsite……………………………………………..………..………...59 3.4.2. Bayerite………………………………………………………………...63 3.4.3. Diaspore……………………………………………………….....….....64
3.4.4. Boehmite…………………………………………………………….....65 3.4.5. Bauxite…………………………………………………………….…...68
3.5. Conclusions…………………………………………………………....…...…69 3.6. References…………………………………………………………..…..….....71
4. FAR-INFRARED SPECTROSCOPY OF ALUMINA PHASES………..….…73 4.1. Abstract………………………………………….…………………...……....73 4.2. Introduction…………………………………………………………..….…..74 4.3. Materials and methods…………………..…………………………………..79 4.4. Results and discussion……………………………………………………….80
4.4.1. Boehmite………………………………………………………….……80 4.4.2. Diaspore……………………………………………………………..…83 4.4.3. Gibbsite………………………………………………………....…...…86 4.4.4. Bayerite……………………………………………………………...…88
4.5. Conclusions…………………………………………………………..…….…89 4.6. References……………………………………………………………….…....89
5. FT-IR PHOTOACOUSTIC SPECTROSCOPY OF KAOLINITE AND GIBBSITE SURFACES……………………………………………………...………………..92 5.1. Abstract………………………………………………………………………92 5.2. Introduction…………………………………………………………..….…..93 5.3. Experimental……………………………………………………..…………..95 5.4. Results and discussion…………………………………………………….....97
5.4.1. Hydroxyl stretching……………………………………………...…….97 5.4.2. Hydroxyl deformation and water bending……………………………100 5.4.3. Low frequency region…………………………………………..…….103
5.5. References…………………………………………………………....…...…105
6. INFRARED SPECTROSCOPY OF GOETHITE DEHYDROXYLATION. I. THE BEHAVIOUR OF HYDROXYL UNITS OF SYNTHETIC GOETHITE AND ITS DEHYDROXYLATED PRODUCT HEMATITE…………..………………...106 6.1. Abstract……………………………………………………….…...…..……106 6.2. Introduction…………………………………………………………..…….107 6.3. Experimental…………………………………...………………………...…108 6.4. Results and discussion………………………………………………...…....109
6.4.1. X-ray diffraction and thermal analysis…………………………..…...109 6.4.2. FT-IR spectroscopy……………………………………..………...…..111 6.4.3. Effect of dehydroxylation on IR band properties………………..…...116
6.5. Conclusions………………………………………………………..…….......123 6.6. References……………………………………………………………….…..124
7. INFRARED SPECTROSCOPY OF GOETHITE DEHYDROXYLATION. II. EFFECT OF ALUMINIUM SUBSTITUTION OF THE BEHAVIOUR OF HYDROXYL UNITS……………………………………………………….…………………...127 7.1. Abstract……………………………………………………………..…....…127 7.2. Introduction…………………………………………………………......….128 7.3. Experimental…………………………………………………………......…130 7.4. Results and discussion………………………………………...………..…..132
7.4.1. Changes in the hematite/(goethite + hematite) ratio and unit cell dimensions during dehydroxylation………………………………......132
7.4.2. Effect of aluminium substitution on weight loss and temperature of dehydroxylation maximum………………………………………..….137

7.4.3. Effect of aluminium substitution on FT-IR spectra of goethite and hematite……………………………………………………..…......….138
7.5. Conclusion……………………………………………………………......…149 7.6. References………………………………………………………………...…150
8. INFRARED SPECTROSCOPY OF GOETHITE DEHYDROXYLATION. III. FT-IR MICROSCOPY OF IN SITU STUDY OF THE THERMAL TRANSFORMATION OF GOETHITE TO HEMATITE………………...………………………………..152 8.1. Abstract…………………………………………………………...……...…152 8.2. Introduction………………………………………………………………...153 8.3. Experimental………………………………………………...………....…...157 8.4. Results and discussion……………………………………………………...158
8.4.1. Hydroxyl stretching………………………………………………......158 8.4.2. Hydroxyl deformation and water bending…………………………....165 8.4.3. Hematite vibrations…………………………………………...……....172 8.4.4. Additional vibrations………………………………………………....176
8.5. Conclusions…………………………………………………..………..….....177 8.6. References…………………………………………………………..…….…178
9. FOURIER TRANSFORM INFRARED SPECTROSCOPY AND X-RAY DIFFRACTION OF ACTIVATED BAUXITE…………………………..……………………....180 9.1. Abstract………………………………………………………...……...……180 9.2. Introduction……………………………………...………………….….…..181 9.3. Experimental…………………...………………………………………...…185
9.3.1. Fourier transform infrared spectroscopy (FT-IR)………………….....185 9.3.2. X-ray diffraction (XRD)…………………………………………..….190
9.4. Results and discussion……………………………………..…………….....190 9.4.1. Dehydroxylation of gibbsite, boehmite and kaolinite……………...…192 9.4.2. Behaviour of hematite, anatase, rutile and quartz………………….....195 9.4.3. Formation of aluminas…………………………………...………..….197
9.5. General discussion and conclusions…………………………………..…...200 9.5.1. Dehydroxylation and transformation of impurities………………..…200 9.5.2. Dehydroxylation and transformation of aluminium oxyhydroxides….201 9.5.3. Pathways of dehydroxylation of aluminium hydroxides in bauxite….204
9.6. References……………………………………………………..………..…...206
10. SUMMARY OF RESULTS AND FINDINGS, AND SUGGESTIONS FOR FUTURE WORK.……………………………………………..…………..….......................209 10.1. Brief summary of results and findings……………………………..209 10.2. Suggestions for future work……………………………………...…211
10.2.1. Data collection, manipulation and interpretation of transition aluminas………………………………….………………………...…211
10.2.2. Simulation of dehydroxylation of bauxite under different conditions of controlled experiments……………………………………….….…....................212
10.2.3. Application of synchrotron radiation X-ray techniques……………...213 10.2.3.1. Advantages of synchrotron radiation X-ray techniques………..213 10.2.3.2. Synchrotron micro X-ray diffraction experimentation………....227
10.3. References…………………….…………..……………………….…228

LIST OF TABLES
Table 1.1. Concentration of elements in bauxites and in the earth’s crust…………..…8 Table 1.2. Structural relationships between analogous oxides of aluminium and iron…………………………………………………………………………………..…18 Table 3.1. FT-Raman spectral data (wavenumbers) assigned to vibrational modes for gibbsite, bayerite, diaspore and boehmite…………………………………………...…………...60 Table 4.1. Band component analysis of the far infrared spectra of gibbsite, bayerite, boehmite and diaspore…………………………………………..…………………..…………………85 Table 6.1. Characteristics of goethite (Gt) and hematite (Hm) formed by dehydroxylation of goethite…………………………………………………...……....................................111 Table 6.2. Band component analysis of the infrared absorption spectra of the hydroxyl stretching region of goethite/hematite transformation over the dehydroxylation temperature range 180 to 270 °C………………………………………………………………………………………115 Table 6.3. Band component analysis of the infrared absorption spectra of the hydroxyl deformation and water bending region of goethite over the dehydroxylation temperature range 180 to 210 °C……………………………………………………………………………………….116 Table 6.4. Band component analysis of the infrared absorption spectra of the low-frequency region of goethite/hematite transformation over the dehydroxylation temperature range 180 to 270 °C…………………………………………………..…………………………………..122 Table 7.1. The effect of aluminium substitution on the ratio of hematite/(goethite + hematite) derived from XRD lines…………………………………………….……………..…..132 Table 7.2. Unit cell dimensions and unit cell volume of goethite………………..….133 Table 7.3. Unit cell dimensions and unit cell volume of hematite………………..…134 Table 7.4. Correlation matrix (r2 values) for unit cell parameters of goethite and hematite as affected by dehydroxylation temperature……………………………..………………135 Table 7.5. Selected band component analysis of the infrared absorption spectra of hematite (270 °C) as affected by aluminium substitution…………………………............................140 Table 8.1. Band component analysis of the FT-IR microscopic spectra of the hydroxyl stretching region of the unheated goethite and goethite/hematite transformation over the dehydroxylation temperature range 110 to 300 °C……………………………………………………...163 Table 8.2. Band component analysis of the FT-IR microscopic spectra of the hydroxyl deformation and water bending region of goethite over the dehydroxylation temperature range 110 to 240 °C……………………………………………………………………………………...174 Table 9.1. The properties of gibbsite, boehmite and diaspore in bauxite ores……....182 Table 9.2. Vibrational band positions and XRD lines of bauxite prior to thermal activation…………………………………………………………….…………..…....191

LIST OF FIGURES Figure 1.1. A conveyor stacker, moving bauxite into stockpiles at the Weipa mine (Far North Queensland), ready for shipping to Queensland Alumina Limited refinery at Gladstone, Queensland, Australia………………………………………………………………….5 Figure 1.2. An aerial shot of the Weipa plant and wharf (Far North Queensland). The stockpiles of bauxite are moved via conveyor belts to the wharf and shipped to alumina refineries………………………………...………………………………………………5 Figure 1.3. SEM micrographs of bauxite……………………………………………….6 Figure 1.4. SEM micrograph of gibbsite……………………………………...…..…..10 Figure 1.5. (A and B) Model of the structure of gibbsite with orientations in the ab and bc plane……………………………………….………………………….……….………11 Figure 1.6. Ball and spoke model of the gibbsite structure…………………..…....….11 Figure 1.7. Polyhedral description of the gibbsite structure…………………..………12 Figure 1.8. SEM micrograph of bayerite…………………………………...…………13 Figure 1.9. Polyhedral description of the bayerite structure…………………...……...14 Figure 1.10. SEM micrograph of diaspore……………………………………………16 Figure 1.11. Polyhedral description of the diaspore structure…………………..….…17 Figure 1.12. SEM micrograph of boehmite……………………………………..……19 Figure 1.13. Polyhedral representation of the boehmite structure………………...…..20 Figure 1.14. A bulk bauxite aggregate showing the mixture of hematite (dark and red colour), goethite (yellow to orange colour) and aluminas (light colour)…………...…………..22 Figure 1.15. Hematite structure…………………...………………………….…..…...23 Figure 1.16. SEM image of kaolinite……………………………………...…..…...….24 Figure 1.17. Kaolinite structure…………………………….……………………..…..25 Figure 1.18. Thermodynamics of alumina phases………………………………..…...29 Figure 3.1. Raman spectra of (a) the low-wavenumber region and (b) the hydroxyl stretching region of gibbsite, bayerite, diaspore and boehmite…………………..….....................61 Figure 3.2. Band component analysis of the hydroxyl stretching region of (a) gibbsite, (b) bayerite, (c) diaspore and (d) boehmite…………………………………………........................67

Figure 3.3. Characterisation of Raman spectrum of (a) bauxite by comparing with spectra of (b) boehmite and (c) gibbsite………………………………...…………..……………….68 Figure 4.1. Far infrared spectra of (a) boehmite, (b) diaspore, (c) bayerite, and (d) gibbsite…………………………………………..…………………………….…….…82 Figure 4.2. Band component analysis of far infrared spectra of diaspore (a, b), gibbsite (c, d) and bayerite (e, f)…………………………………………………………………………...84 Figure 4.3. FT-Raman spectra of (a) gibbsite, (b) bayerite, (c) diaspore, and (d) boehmite in the low frequency region……………………………………………..………………………....87 Fig. 5.1. Scanning electron micrographs of kaolinite (a, b), and gibbsite (c, d)……....96 Fig. 5.2. FTIR-PAS spectra of kaolinite at various mirror velocities. Spectra are plotted with an offset on the y-axes……………………….…………………………………………….98 Fig. 5.3. FTIR-PAS spectra of (a) kaolinite, and (b) gibbsite in the hydroxyl stretching region. Kaolinite spectra of Figures 4.3, 4.4 and 4.5 are plotted with an offset on the y-axes………………………...………….…………….………………………………....99 Fig. 5.4. FTIR-PAS spectra of (a) kaolinite, and (b) gibbsite in the hydroxyl deformation and water bending region……………………………….………………………………………..101 Fig. 5.5. FTIR-PAS spectra of (a) kaolinite, and (b) gibbsite in the low frequency region…………………………………...……………………………………….……104 Figure 6.1. The ratio of hematite/goethite at dehydroxylation temperatures between 180 and 270 °C…………………………………………………….……….………….…………..110 Figure 6.2. Infrared spectra of goethite (110 °C) and its dehydroxylated products obtained from heating goethite between 180 and 270 °C for one hour……………...........................113 Figure 6.3. Band component analysis of goethite and hematite derived from goethite heated at 270 °C for one hour……………………………………………………………………….114 Figure 6.4. (a) variation in the band centre, (b) bandwidth, and (c) relative intensity of the hydroxyl stretching frequencies during goethite/hematite transformation as a function of dehydroxylation temperature…………………………………..……………………………………….118 Figure 6.5. Band intensity of goethite as a function of dehydroxylation temperature…………………………………………………………………………...120 Figure 6.6. Relationships between unit cell dimension a of goethite and band intensities in the deformation region………………………………………………................................121 Figure 7.1. Weight loss at TGA dehydroxylation maximum (a), and dehydroxylation maximum temperature of DTGA (b) as a function of aluminium substitution……....................136 Figure 7.2. Fourier transform infrared spectra of goethite, (a) 0 mole%, (b) 10 mole%, (c) 20 mole%, and (d) 30 mole% aluminium substitution, respectively….………………...138

Figure 7.3. Band component analysis of 10 mole% aluminium substituted goethite (110 °C, a-c) and its resultant hematite (270 °C, d-f)……………………………………………..139 Figure 7.4. Changes in hydroxyl stretching bands of unheated goethite (110°C) as affected by aluminium substitution…………………………………………..………………….141 Figure 7.5. Shift of the goethite band centre as a function of aluminium substitution.………………………………………………………………………...…144 Figure 7.6. Shift of the hematite band centre as a function of aluminium substitution…………………………………………………………………………....146 Figure 8.1. The octahedral model of goethite structure. The apexes of the octahedra represent the centre of oxygen atoms and the small, thin bars represent the hydrogen bonds…………..…..……………………………………………………..………...…153 Figure 8.2. The structure of goethite projected onto the a-b and c-b planes. Iron atoms are represented by small, solid circles, oxygen atoms by large, open circles. Large circles with solid lines lie above the plane of the figure, circles with dashed lines below. The OI are sites where oxygens are shared between octahedra in two different double chains, and the OII are sites where oxygens are shared by octahedra in the same chain…………………………………………………………………………………..154 Figure 8.3. A model of the real goethite structure projected onto the a-b plane. Iron atoms are represented by small, open circles; oxygen atoms by large, open circles; hydrogen atoms by small, dark circles. Hydrogen bonds are indicated by dotted lines and tilting between adjacent double-chains is shown on the right hand side of the figure………………………………………………………………………………….156 Figure 8.4. FT-IR microscopic spectra of goethite in the hydroxyl stretching region, (a) unheated, (b) heated at 110 °C, and (c-o) heated from 180 to 300 °C at 10 °C intervals for 10 minutes……………………..……………………………..…………………………..159 Figure 8.5. FT-IR microscopic spectra of goethite in the hydroxyl bending region, (a) unheated, (b) heated at 110 °C, and (c-o) heated from 180 to 300 °C at 10 °C intervals for 10 minutes……………………………………………………………………………....161 Figure 8.6. FT-IR microscopic spectra of goethite in the hydroxyl deformation region, (a) unheated, (b) heated at 110 °C, and (c-o) heated from 180 to 300 °C at 10 °C intervals for 10 minutes……………………………………………………………………………...164 Figure 8.7. Band component analysis of the (a) hydroxyl stretching, (b) hydroxyl bending, and (c) hydroxyl deformation regions of unheated goethite………………………………...166 Figure 8.8. Band component analysis of the (a) hydroxyl stretching, (b) hydroxyl bending, and (c) hydroxyl deformation regions of goethite heated at 110 °C for 10 minutes…..…………………………………………………..………………………..167 Figure 8.9. Band component analysis of the (a) hydroxyl stretching, (b) hydroxyl bending, and (c) hydroxyl deformation regions of goethite heated at 240 °C for 10 minutes…………………………………………………………………………….….168

Figure 8.10. Band component analysis of the (a) hydroxyl stretching, (b) hydroxyl bending, and (c) hydroxyl deformation regions of goethite heated at 300 °C for 10 minutes………………………………………………………………….………...…..169 Figure 8.11. Changes in (a) band centre, (b) band width, and (c) band relative intensity of the hematite vibration at 916 cm-1 as affected by dehydroxylation temperature…....………………………………………………………………..…….175 Figure 9.1. A raw bauxite particle from Weipa, Queensland, Australia…………......182 Figure 9.2. Spectra of bauxite, (a) unheated, (b – m) heated from 250 to 800 °C at 50 °C intervals……………….………………………………………………………...........186 Figure 9.3. Spectra of bauxite in the hydroxyl stretching region……………………187 Figure 9.4. Spectra of bauxite in the hydroxyl deformation and water bending region………………………………………...…………………………………….....188 Figure 9.5. Spectra of bauxite in the low frequency region………………………….189 Figure 9.6. X-ray diffraction patterns of bauxite, (a) unheated, (b – m) heated from 250 to 800 °C at 50 °C intervals…………………………….……………...………………………….193 Figure 9.7. (a) a chi alumina band at 800 cm-1, and (b) a gamma alumina band at 740 cm-1, respectively as a function of dehydroxylation temperature………………….....198 Figure 9.8. Intensity of the broad peak area between 1.40 and 135 Å, which containing chi alumina line at 1.395 Å, and gamma alumina line at 1.391 Å, increased as dehydroxylation temperature increased up to 800 °C, indicating the development of these two alumina phases…………...……...……………………………...……………………………….199 Figure 10.1. Synchrotron micro X-ray diffraction images of alpha alumina (a) one dimension and (b) two dimension patterns; and gamma alumina (c) one dimension and (d) two dimension patterns. Patterns and images obtained from a spot size as small as 10 X 10 μm, where heterogeneous distribution of phases can be determined. Spectra were recorded in 2 minutes. The unit in (a) and (b) is angstrom (Å)……………………………………………………………………..217 Figure 10.2. Synchrotron micro X-ray diffraction of aluminium hydroxides showing 1D and 2D images, (a, b) gibbsite, (c, d) bayerite, (e, f) boehmite, and (g, h) diaspore. Impurities in natural diaspore can be determined easily with a high resolution and a high signal to noise ratio. The unit represents angstrom (Å)……………………...………………………………………..218 Figure 10.3. Synchrotron micro X-ray diffraction of Al-goethite, (a, b) 0% Al-goethite, (c, d) 10% Al-goethite, (e, f) 20% Al-goethite, and (g, h) 30% Al-goethite, showing the diffraction lines shift to low d-spacing as Al-substitution increases. Only less than mg of sample is required and spectra can be obtained from any selected particles. The unit represents angstrom (Å)…………………………………………………….……………………………….219 Figure 10.4. Synchrotron-based micro XRD patterns obtained from ~100 μm2 areas were equivalent to conventional XRD patterns acquired from ~100 mm2 areas. Higher spatial resolution allows identification of a trace phase if the phase is highly concentrated in small areas. The selected Mn-Fe rich nodule sample contains less than 5% romanechite and was not determined by the conventional

laboratory XRD, but was clearly identified by SXRD from the selected spots within a small particle (#022) (see Figure 10.5. for more details). Some mixtures such as goethite with other clay minerals can be detected separately and an almost pure goethite spectrum is recorded (#036). Spectra were acquired in 5 minutes………………………………………………...…………………220 Figure 10.5. Synchrotron micro X-ray diffraction (SXRD) and micro X-ray fluorescence (SXRF) data can be acquired from a beam size as small as 10 X 10 μm of a Mn-Fe rich nodule. The nodule was generously crushed into small particles. The SXRD and SXRF data can be obtained either from the exterior or interior of a nodule. The corresponding SXRD and SXRF spectra are shown in Figures 9.4 and 9.6, respectively…………………………………………………………………………...221 Figure 10.6. Synchrotron micro X-ray fluorescence (SXRF) spectra obtained from the spots marked in Figure 9.5. Elemental variations and their heterogeneous distributions are well distinguished. The formation of a minute mineral romanechite is confirmed by the moderate amounts of barium (Ba) detected from the sample #022………….............................222 Figure 10.7. Two dimension mapping using synchrotron micro X-ray fluorescence (SXRF), showing the spatial distributions of (a) chromium (Cr) and (b) lead (Pb) in a heterogeneous thin section with a mapping area of 1.0 X 0.8 mm. The abundance of elements chromium (Cr) and lead (Pb) is indicated by their relative intensities from (c) a SXRF spectrum…………………………………………....………………………………….224

Chapter 1
1. BACKGROUNG AND LITERATURE REVIEW ON BAUXITE, ALUMINA PASES,
AND VIBRATIONAL SPECTROSCOPY
1.1. Occurrence of Bauxite
Bauxite, a mixture of gibbsite, boehmite and diaspore, is an important raw material for the Al
industries. Iron oxide (e.g., hematite and goethite) and kaolinite are the major impurities in bauxite.
Bauxite was the term introduced by Berthier (1) in 1821 for sediments rich in alumina in the
vicinity of Les Baux in the Alpilles (Bouches du Rhone) France. In 1892, Liebrich (2) was the first
to extend the term to cover lateritic weathering products rich in gibbsite on basalts of the
Vogelsberg in Germany. The term bauxite, therefore, is used for weathering products rich in
alumina but low in alkalis, alkaline earths and silica. The term bauxite ore is applied to bauxites,
which are economically mineable at present or in the foreseeable future, containing not less than 45-
50% Al2O3 and not more than 20% Fe2O3 and 3-5% combined silica. The term alumina refers to
pure Al2O3 which contains 52.9% Al and 47.1% O (3).
Bauxite is of supergene origin, commonly produced under subtropical to tropical climatic
conditions by prolonged weathering and leaching of silica from aluminium-bearing rocks. Bauxite
may also be derived from the weathering of clay-bearing lime stone (4). Bauxite has apparently
originated as a colloidal precipitate. It may occur in places as a direct derivative of the original
rock, or it may have been transported and deposited in a sedimentary formation. Climate has long
been considered to play a major role in the formation of bauxites and laterites (5) (6) (7) (8). The
broad climatic requirements for bauxitisation are in general satisfied by consistently warm
temperatures and high amounts of precipitation.

Australian bauxites are aluminous varieties of laterite that may or may not have been modified
by secondary chemical effects (9). In the tropics deposits known as laterites, consisting largely of
hydrous aluminium and ferric oxides, are found in the residual soils. Laterite, a term was first
introduced by F. Buchanan in 1807 to describe a ferruginous earthy rock, which had been observed
when travelling in southern India in 1800-01, is a mixture of oxides of iron, more or less hydrated,
aluminium hydroxide with or without basic aluminium oxide, and titanium dioxide. It is formed as
a precipitate and a relatively insoluble residue leached product (9). Laterites vary widely in
composition and purity but many are valuable as sources of aluminium and iron (4). The laterite is a
common rock type in tropical and subtropical climates with a high rainfall and temperature (10).
Laterization is a process of deep weathering by which some constituents leached from rocks are
removed in solution and others, chiefly iron and aluminium, are redeposited in the immediate
vicinity (9). Consequently, with a high laterization action on the bases of the mother rock, the
oxides and oxyhydroxides of iron and aluminium plus kaolinite are therefore enriched. This kind of
rock is often red-coloured by some hematite. Bauxite may also be formed by desilification of
kaolinite rock (10). Although bauxite commonly occurs in the zones of deposition it may occur
also as a residual product in the leached portion of the profile where a suitably aluminous rock has
been attacked (9).
Bauxite occurs over a large area in the south of France, an important district being at Baux,
near Arles, France. The major producing countries are Surinam, Jamaica, and Guiana, Indonesia,
the CIS, Australia, Hungary and the United States (4). In Australia, aluminium laterites on basaltic
rocks, which have been extensively investigated, are the bauxites occurring in Queensland (Figures
1.1, 1.2), New South Wales, Victoria, Tasmania and Western Australia (3). They are fossils and
partly covered by lignitic sediments and younger basalt flows, displaced by younger tectonic
movements. They are an example of polygenetic transformation of bauxites under acid and

reducing conditions. At many places they have been eroded considerably and occur as truncated
profiles over large distances. Most deposits can be dated Eocene or Oligocene. The aluminium
laterites in Australia are very similar to those on the Trap basalts in India (9). Laterites and bauxites
are prominently developed in the tropics, but their occurrence is not limited to low latitudes. In the
Southern Hemisphere laterite/bauxite occurs in Tasmania as far south as 43°, and in the Northern
Hemisphere at 45° in Oregon, USA and 55° in Antrim, Northern Ireland (9).
The bauxites may be classified in three different ways:
On genetic principles:
(1) Bauxite on igneous and metamorphic rocks;
(2) Bauxites on sediments: a) carbonate rocks; b) clastic strata;
According to geological age:
(1) Palaeozoic bauxites;
(2) Mesozoic bauxites;
(3) Cenozoic bauxites;
Based on mineralogical composition:
(1) gibbsite bauxites;
(2) boehmite bauxites;
(3) diaspore bauxites.
The distribution of bauxite resources around the world are summarised as follows:
North America: USA, Jamaica, Haiti, and Dominic Rep.;
South America: Brazil, Venezuela, Guyana, Fr. Guiana, and Surinam;
Europe: Austria, France, Germany, Greece, Hungary, Italy, Romania, Russia, Spain, and
Yugoslavia;
Asia: China, India, Indonesia, Malaysia, Philippines, Sarawak, and Turkey;

Africa: Ghana, Guinea, Mozambique, Rhodesia, and Sierra Leone;
Australia
The production of alumina consumes over 90% of the bauxite world production, while the
remainder is used for abrasives, chemicals and refractories (3).
Figure 1.1. A conveyor stacker, moving bauxite into stockpiles at the Weipa mine (Far North Queensland), ready for shipping to Queensland Alumina Limited refinery at Gladstone, Queensland, Australia (provided by Comalco Pty Ltd).

Figure 1.2. An aerial shot of the Weipa plant and wharf (Far North Queensland). The stockpiles of bauxite are moved via conveyor belts to the wharf and shipped to alumina refineries (provided by Comalco Pty Ltd).

Figure 1.3. SEM micrographs of bauxite (from this study).
1.1.1. Composition of bauxite
(a)
(b)

Gibbsite, boehmite and diaspore form the main constituents of bauxite and laterites, with
gibbsite often being the predominant mineral (11) and diaspore being a minor component (10) (12)
(13). Bauxite is a mixture of hydrous aluminium oxides in varying proportions (Figure 1.3). Some
bauxites closely approach the composition gibbsite, but most are a mixture and usually contain
some iron oxides. As a result, bauxite is not a mineral and should be used only as a rock name (4).
In Australia large deposits are mostly found in subtropical regions with Weipa in North Queensland
being one of Australia’s major deposits. Weipa bauxites contain about 70% gibbsite and 15%
boehmite. Iron oxides (hematite and goethite), kaolinite, titanates, and quartz, are commonly found
associated with bauxite making up to 15% of the impurities. Element constituents of bauxites are
present in Tables 1.1. The bauxite particle is pisolitic, usually in round concretionary grains.
Bauxite also has massive, earthy and claylike particles. The colour of bauxite is white, gray,
yellow, red and translucent depending on the effects of impurities. Its hardness is 1-3 and specific
gravity is 2-2.25. Bauxite can usually be recognised by its pisolitic character. (4).
Gibbsite, Boehmite and Diaspore are the three principal hydrates of alumina and are found in
bauxite, lateritic or terra rossa soils and various sediments (11) (10) (14). Bayerite is very rare in
nature although it is an important alumina phase. However, bayerite can be easily synthesised in
the laboratory (14).
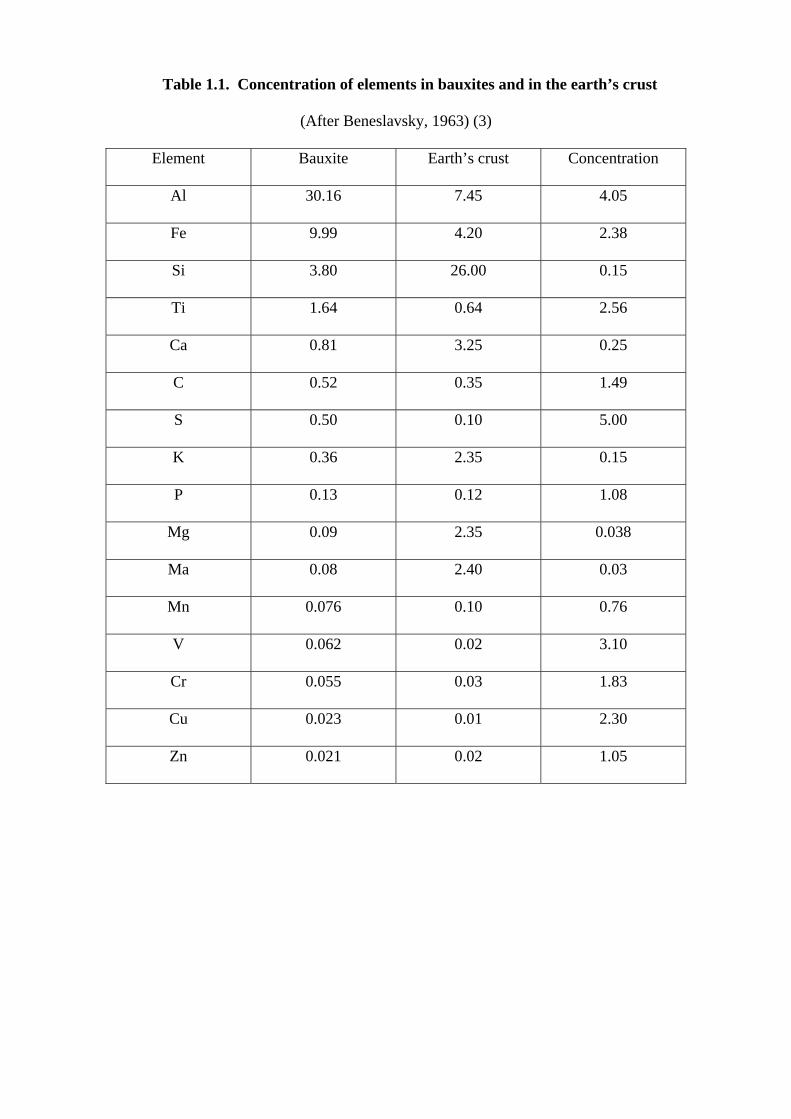
Table 1.1. Concentration of elements in bauxites and in the earth’s crust
(After Beneslavsky, 1963) (3)
Element Bauxite Earth’s crust Concentration
Al 30.16 7.45 4.05
Fe 9.99 4.20 2.38
Si 3.80 26.00 0.15
Ti 1.64 0.64 2.56
Ca 0.81 3.25 0.25
C 0.52 0.35 1.49
S 0.50 0.10 5.00
K 0.36 2.35 0.15
P 0.13 0.12 1.08
Mg 0.09 2.35 0.038
Ma 0.08 2.40 0.03
Mn 0.076 0.10 0.76
V 0.062 0.02 3.10
Cr 0.055 0.03 1.83
Cu 0.023 0.01 2.30
Zn 0.021 0.02 1.05

1.2. Alumina Phases
1.2.1. Gibbsite
Gibbsite (also known as hydrargillite) [formula: γ-Al(OH)3] is a monoclinic mineral and is
found in the clay <2 μm separate of various sediments, especially in areas with a hot rainy climate
and a dry period (monsoon). It is also found concentrated in various bauxite deposits differing in
purity and extension (10). Gibbsite is often the predominant mineral in tropical bauxites.
Gibbsite often occurs in small tabular {001} crystals with pseudohexagonal outline conferred
by the forms {100} and {110} (Figure 1.4): it may also occur in prismatic crystals and in lamellar
or stalactitic aggregates (15). Some gibbsite may be found in emery deposits, which are formed by
the metamorphism of bauxites; it can occur as an alteration crust on corundum. Gibbsite also
occurs as a low-temperature hydrothermal mineral in veins or cavities in aluminium-rich igneous
rocks. It has been reported as the end product of granitic weathering, the sequence being
plagioclase → amorphous or allophanic material → halloysite → gibbsite.
The fundamental unit of gibbsite structure is a layer of Al ions sandwiched between two sheets
of hexagonally packed hydroxyl ions (15). In the gibbsite structure, two out of three of the
octahedrally coordinated sites between the oxygen layers are occupied by cations. The layers may
be regarded as being built of octahedra linked laterally by sharing edges; the network so formed
may be described by an orthogonal (pseudohexagonal) cell with parameters a ~ 8.6 Å, b ~ 5 Å (~ a/
√3) (Figure 1.5). The oxygen layers in gibbsite are in the sequence of hexagonal close packing
ABBAABBA… (Figures 1.6, 1.7). In the ideal structure of gibbsite, oxygens at the bottom of the

layer lie directly above oxygens at the top of the layer below. The structure of gibbsite is in fact
somewhat distorted from the ideal, resulting in a monoclinic cell: there are two layers in each cell.
Figure 1.4. SEM micrograph of gibbsite (from this study).

Figure 1.5. (A and B) Model of the structure of gibbsite with orientations in the ab and bc plane (11).
Figure 1.6. Ball and spoke model of the gibbsite structure (3).
Figure 1.7. Polyhedral description of the gibbsite structure (3).

Heating gibbsite produces γ-alumina, usually with boehmite formation as an intermediate stage.
In the system Al2O3 – H2O, gibbsite is the stable form at lower temperatures; at higher temperatures
diaspore is the stable phase, but boehmite can exist metastably, and at about 450 °C corundum is the
stable phase (15).
1.2.2. Bayerite
Bayerite [formula: α-Al(OH)3] is a monocline mineral and is in a metastable stage (10). It is an
intermediate product between amorphous Al(OH)3·nH2O (cliachite, alumogel) and monocline
gibbsite (Figure 1.8). The natural product is very rare. It is found sometimes in veinlets in calcite
rocks (Israel) (16).

Figure 1.8. SEM micrograph of bayerite (from this study).

Figure 1.9. Polyhedral description of the bayerite structure (11, 17-18)
The gibbsite and bayerite have the same structural sheetlike unit, which consists of a layer of
aluminium ions sandwiched between two layers of hexagonally packed hydroxyl ions, in the plane
defined by the a and b axes. The oxygens of one layer lie directly above the oxygens at the top of
the layer below. The sheetlike units are stacked along the c axis (Figure 1.9) (11) (17) (18).
Bayerite is a dimorph with similar layers of octahedra but these are stacked differently to yield a
single-layer cell. The difference in structure between gibbsite and bayerite is that one can be
generated from the other by a rotation about the c axis of one of the sheetlike units by 60° (18).
1.2.3. Diaspore
Diaspore (formula: α-AlOOH) is found as a minor constituent in many bauxites in the world in
addition to gibbsite and boehmite (10). Large amounts of these minerals are found in only a few
bauxite deposits, e.g., Nezsa of Hungary and Rosebud, Mo of the USA. Thermal action or low-
grade metamorphism mostly favours its genesis. The principal occurrences of diaspore are in
bauxite and in emery deposits, but diaspore and boehmite occur also in fireclays. Hydrolysis of
silicates in tropical climate produces an alumina silica gel; after subsidence and burial, diaspore
crystallises from the gel and is followed by kaolinite formation. In emery deposits (e.g. at Chester,
Massachusetts, USA) diaspore occurs as an intermediate stage in the formation of corundum by the
metamorphism of gibbsite in bauxite deposits. Diaspore is frequently found as one of the products
of hydrothermal alteration of aluminous minerals such as silimanite, kyanite, andalusite,
pyrophyllite or corundum (15).
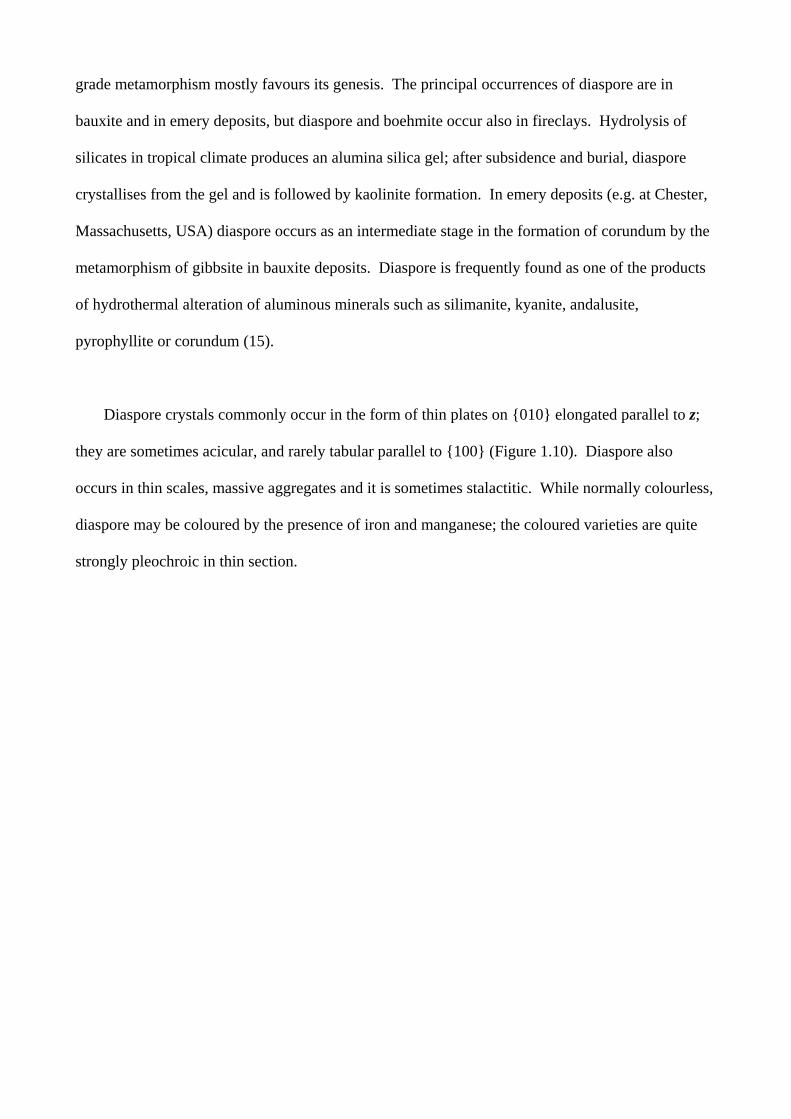
Diaspore crystals commonly occur in the form of thin plates on {010} elongated parallel to z;
they are sometimes acicular, and rarely tabular parallel to {100} (Figure 1.10). Diaspore also
occurs in thin scales, massive aggregates and it is sometimes stalactitic. While normally colourless,
diaspore may be coloured by the presence of iron and manganese; the coloured varieties are quite
strongly pleochroic in thin section.
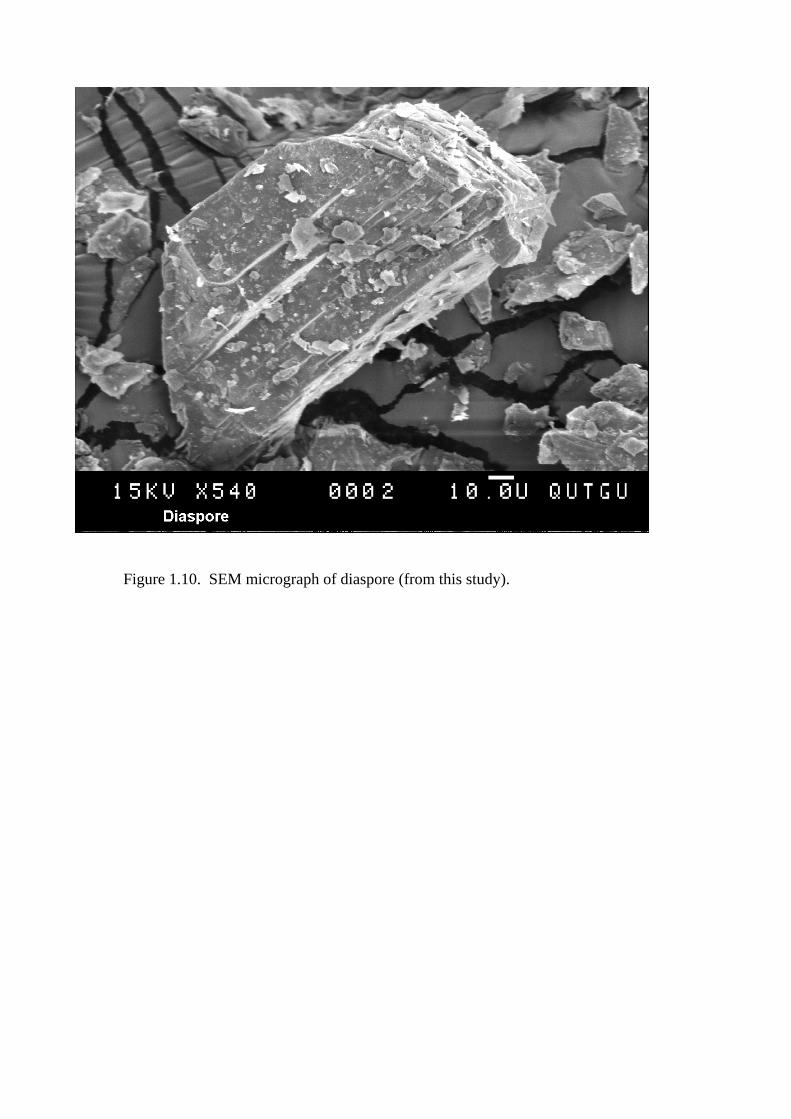
Figure 1.10. SEM micrograph of diaspore (from this study).

Figure 1.11. Polyhedral description of the diaspore structure (19-22).
The structure of diaspore is based on layers of oxygen atoms in hexagonal close packing
(Figure 1.11); the isostructure of diaspore is goethite (α-FeOOH) (19) (20-22). Aluminium ions
occupy octahedrally coordinated sites between layers in such a way as to form strips of octahedra,
the direction of which defines the c parameter of the unit cell. The strips have the width of two
octahedra and yield an orthorhombic cell in which is twice the distance between oxygen layers, and
b/2 ~ c√3 (15). Diaspore and boehmite are polymorphs of the same mineral and differ in structural
relationships by the packing of the oxygens.

Table 1.2. Structural relationships between analogous oxides of aluminium and iron (after Deer, et al.) (15)
Phase Oxygens in hexagonal array Oxygens in cubic array
AlO(OH)
Al2O3
FeO(OH)
Fe2O3
Diaspore
Corundum
Goethite
Hematite
Boehmite
γ-Alumina
Lepidocrocite
γ- Fe2O3 (maghemite)
When diaspore is heated corundum is produced, while the outward form of the diaspore crystal
is retained; there is a close orientational relationship between diaspore and its decomposition
products. The structural relationships between aluminium and analogous iron compounds are
illustrated in Table 1.2 (15). On heating, diaspore decrepitates strongly, separating into white scales
and, on stronger heating, water is given off. Diaspore is sometimes called α-alumina hydrate and
its formula written as α-Al2O3·H2O although there are no water molecules in its structure. The
compounds within the system Al2O3 – H2O are gibbsite, bayerite, boehmite, diaspore, corundum,
and γ-alumina, the first five of which are known definitely to occur as minerals. With increasing
temperature, first gibbsite, then diaspore, then corundum, is the stable phase, and boehmite exists
probably metastably at intermediate temperatures.
1.2.4. Boehmite
Boehmite (formula: γ-AlOOH) is found in the clay <2 μm separate of lateritic or rossa soils.
Bauxite deposits with mainly boehmite are situated mostly in subtropical regions (Mediterranean
type bauxite). The particle size of boehmite is smaller than that of gibbsite (Figure 1.12) and the
boehmite found is usually associated with gibbsite and diaspore (10). However, The Weipa bauxite
contains only gibbsite and boehmite.
Figure 1.12. SEM micrograph of boehmite (from this study).

Figure 1.13. Polyhedral representation of the boehmite structure (15, 23-24).
Boehmite is isostructural with lepidocrocite (γ-FeOOH) (Figure 1.13). The structure of
boehmite consists of double sheets of octahedra with Al ions at their centres, and the sheets
themselves are composed of chains of octahedra, the repeat distance of which defined the a
parameter of the unit cell (15). The stacking arrangement of the three oxygen layers is such that the
double octahedral layer is in cubic close packing (23) (24). In diaspore the oxygens are in a
hexagonal close-packed layer; those within the double octahedral layers in boehmite are in a cubic
packing relationship. These differences in oxygen packing are consistent with the behaviour of the
two polymorphs of AlO(OH) on dehydration in that diaspore yields α-alumina (trigonal) and
boehmite yields γ-alumina, which has the cubic structure of a spinel. Boehmite has a good cleavage
on {010}, the plane defining structural layers of AlO(OH) octahedra (15).
1.3. Impurities
1.3.1. Iron oxides
Among the minerals associated with the alumina hydrates in bauxites and in laterites
(ferruginous bauxites) are the analogous iron compounds (goethite and lepidocrocite), and also
hematite and the clay mineral kaolinite and halloysite. Analyses of gibbsite usually show the
presence of Fe2O3 and minor amounts of other oxides (15). It seems likely that some Fe3+ and
perhaps some oxides are no doubt present as impurities.
In Weipa huge bauxite deposits rest on a succession of clastic sediments, probably Early
Tertiary in age. The original sediment is a kaolinitic arkose sandstone. Above this is the
fluctuating water table zone that essentially consists of quartz and kaolinite. Hematite and goethite
form typical irregular concretions and are enriched together with kaolinite above the base of this
zone. At higher levels (concretionary zone) kaolinite disappears, being replaced by gibbsite and in
the upper-most part, partly by boehmite (3).
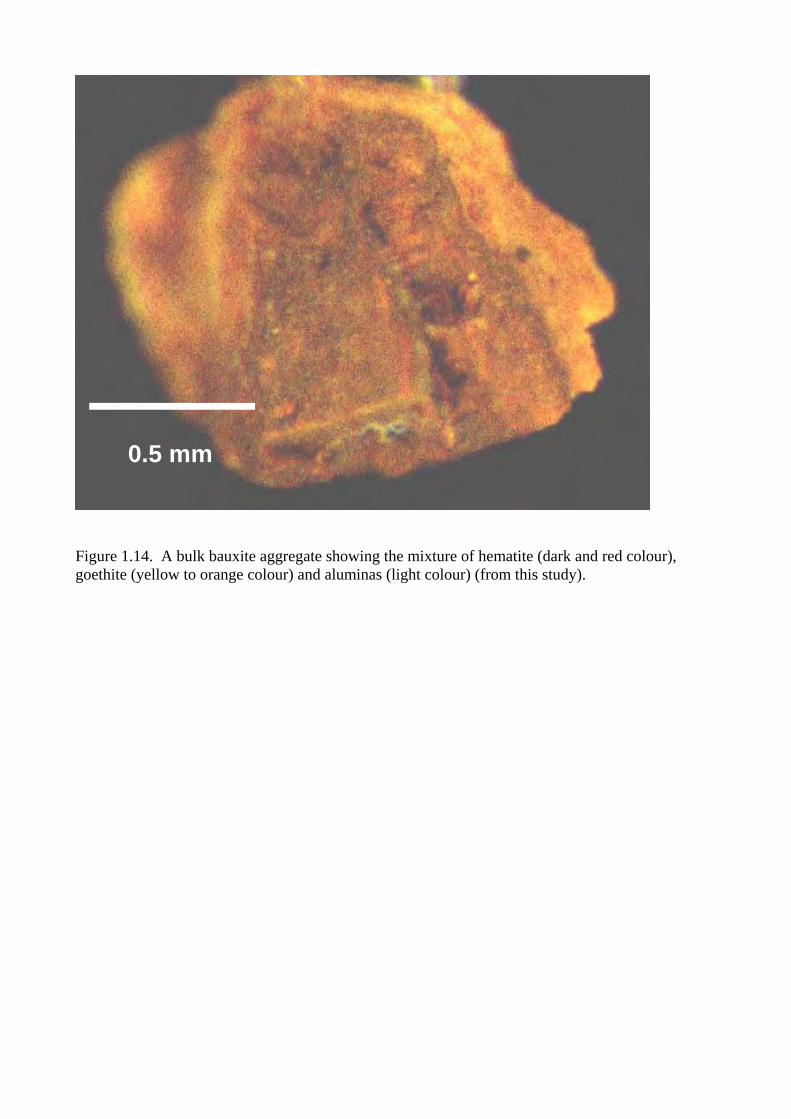
Figure 1.14. A bulk bauxite aggregate showing the mixture of hematite (dark and red colour), goethite (yellow to orange colour) and aluminas (light colour) (from this study).
0.5 mm

Hematite (α-Fe2O3) and/or goethite (α-FeOOH) enrichments in bauxite may be caused by:
annual fluctuation of the water table; persistence of dissolved iron in a reducing environment below
the water table; rapid oxidation to insoluble Fe3+ compounds through periodic exposures in a warm
and oxidising environment; high atmospheric temperatures which favour the accumulation of leaves
and the organic matter at the surface but eliminate the reducing power of the ground water (3). The
most important feature is the migration of iron in an upward direction and the precipitation of stable
iron compounds in the zone of oxidation. Figure 1.14 shows that a bulk bauxite aggregate
containing the mixture of hematite and goethite, their red and yellow colours usually cover the light
colour of alumina.
Figure 1.15. Hematite structure (http://pubweb.acns.nwu.edu/~zzh637/hemastruc.html).
The structure of hematite consists of layers of oxygen ions and layers of iron ions perpendicular
to the triad axis. The oxygen ions are arranged in a slightly distorted hexagonal packing, while
successive cation layers contain equal numbers of ions all in six-fold coordination, thus differing
from the spinel structure where two-thirds of the cations in alternate layers are in four-fold
coordination (Figure 1.15).
The structure of goethite is similar to that of diaspore (Figure 1.11), the unit cell containing
four FeOOH. It consists essentially of layers of oxygen ions in the sequence of hexagonal close-
packing, with the iron ions in the octahedral interstices (15). Goethite usually contains non-
stoichiometric (excess) hydroxyls. The amount of non-stoichiometric hydroxyls incorporated into
the goethite structure can be explained by one Fe iron being replaced by three H ions (20) (21).
Goethite differs from hematite in having a yellow streak, and in general it is more yellowish in
colour. On dehydration it gives hematite.
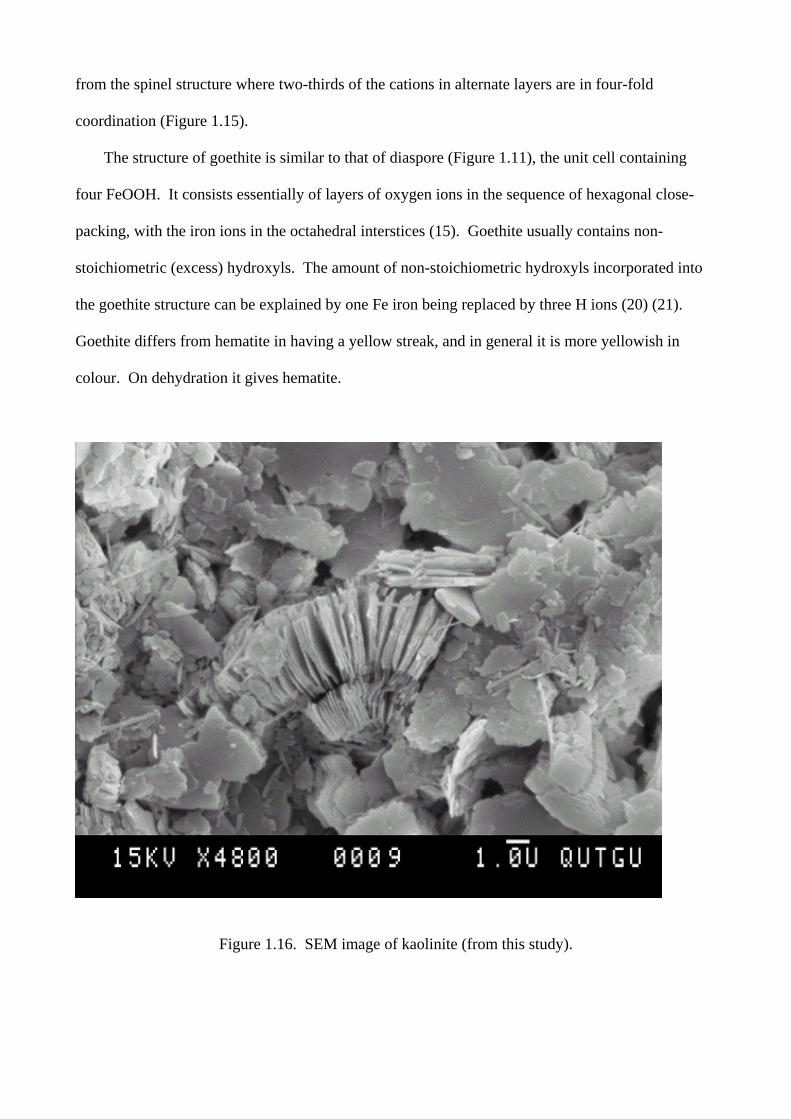
Figure 1.16. SEM image of kaolinite (from this study).
1.3.2. Kaolinite
The principal occurrences of kaolinite [Al2Si2O5(OH)4] are as primary residual deposits formed
by weathering or low-temperature hydrothermal alteration of feldspars, muscovite and other Al-rich
silicates (15). Laterization leads to the enrichment of oxides and oxyhydroxides of iron and
aluminium plus kaolinite (Figure 1.16). Kaolinite is the impurity only second to iron oxides in
Weipa bauxite.
Figure 1.17. Kaolinite structure (114).
The fundamental unit of the kaolinite structure is an extended sheet, which can be regarded as
having two constituents (Figure 1.17). A layer of composition (Si4O10)4- is formed by the linkage of
SiO4 tetrahedra in a hexagonal array, the bases of tetrahedra being approximately coplanar and their
vertices all pointing in one direction. The apical oxygens, together with some additional (OH)- ions
located over the centres of hexagons, form the base of a gibbsite-type layer of composition (OH6)-
Al4-(OH)2O4. From plan and elevation views, there is a composite Al4Si4O10(OH)8 layer. Only two
out of each set of three available sites are occupied by Al ions. Successive layers of kaolinite are
superimposed so that in general oxygens at the base of one are hydrogen-bonded to hydrogen ions
at the top of its neighbour, resulting in a single-layered triclinic unit cell.

1.3.3. Other mineral impurities
In addition to iron oxides and kaolinite, the Weipa bauxites contain quartz (SiO2), anatase
(TiO2), rutile (TiO2) zircon (ZrSiO4) and organic matter as impurities.
1.4. Thermal activation of bauxite
1.4.1. Aluminium hydroxides
Thermal activation of bauxite is one of the biggest steps of dehydroxylation pathways for
gibbsite, boehmite and diaspore to produce α-Al2O3, the most stable member of the Al(OH)3 →
Al2O3 series. Diaspore easily dehydrates (~ 500 °C) to produce α-Al2O3 whereas gibbsite and
boehmite do not. The reason is that α-Al2O3 is hexagonal close packed and diaspore also has a
hexagonal (ABAB…) sequence while boehmite is cubic (ABCABC…) (25). Gibbsite has two
layers of hexagonally packed hydroxyl ions. These hydroxyl groups need energy to release them,
and thus may delay the thermal transformation from gibbsite to α-Al2O3. The structure of α-Al2O3
is as the same as that of hematite with Fe being replaced by Al (Figure 1.15). Experimental
conditions such as water vapour pressure and heating rate, and mineral properties such as crystal
and particle size distribution can affect the pathways of dehydroxylation of gibbsite and boehmite
(in the case of Weipa bauxite) (26), and consequently affect the formation of α-Al2O3.
It was reported by several workers (27) (28) (29) that gibbsite dehydrates through two
pathways. For coarse gibbsite (≥ 1μm) the following two pathways applied:

Coarse gibbsite → boehmite → γ-Al2O3 → θ-Al2O3 → α-Al2O3
χ-Al2O3 → κ-Al2O3 → α-Al2O3
Whereas fine gibbsite (< 1μm) follows one pathway (30) (31):
Fine gibbsite → χ-Al2O3 → κ-Al2O3 → α-Al2O3
The initial step in the thermal decomposition of gibbsite is the diffusion of protons and the reaction
with hydroxyl ions to form water (32) (33) (34) (35). This process removes the binding forces
between the strata of the gibbsite structure and changes in the chemical composition and density
within the layers (36).
Using various materials and techniques, some workers (37) proposed two different pathways
for fine, highly crystalline and fine, poorly crystalline boehmite.
Highly crystalline boehmite → γ-Al2O3 → θ-Al2O3
Amorphous Al2O3 → γ-Al2O3
Poorly crystalline boehmite
η-Al2O3 → θ-Al2O3
Some workers (38) (39) (40) suggested that the δ-Al2O3 phase occurs between the γ and θ phases:
γ-Al2O3 → δ-Al2O3 → θ-Al2O3 → α-Al2O3
However, difference decomposition pathways have been suggested by other researchers (41) who
reported that other intermediate alumina phases, such as λ, κ and ε-Al2O3, may be formed.

Ingram-Jones et al. (39) have found that boehmite undergoes the dehydroxylation sequence
boehmite, gamma, delta, theta, alpha-Al2O3 under both soak and flash calcination. The
dehydroxylation sequence of gibbsite, however, depends on the calcination method and the particle
size of the feed material. Fine gibbsite (ca. 0.5 μm) from soak calcination gave the dehydroxylation
sequence gibbsite, chi, kappa, alpha- Al2O3; and for flash calcination the sequence gibbsite, chi,
gamma, delta, theta, alpha- Al2O3 was observed. Soak calcination of coarse gibbsite (ca. 14 μm)
gave both the dehydroxylation pathway (a) gibbsite, boehmite, gamma, delta, theta, alpha- Al2O3,
and pathway (b) gibbsite, chi, kappa, alpha- Al2O3, and pathway (a) was predominant. Flash-
calcined coarse gibbsite experiences a crossover between these routes (chi-gamma) without
formation of kappa-Al2O3. The thermodynamics of aluminas are summed up in Figure 1.18.
Figure 1.18. Thermodynamics of alumina phases (37).
The following factors that affect the dehydroxylation of gibbsite and boehmite have been
intensively discussed in the literature.

1.4.1.1. Crystal size distribution and crystallinity
Crystal size distribution is one of the critical factors to affect thermal dehydroxylation. As
mentioned above, gibbsite and boehmite showed different pathways of dehydroxylation depending
on their crystal size. One of the main reasons for the difference between coarse and fine crystals is
attributed to the likelihood of there being a high-intra-crystal water vapour pressure (PH2O) leading
to hydrothermal conversions (42) (43) (44). When sufficient porosity is developed, the product
water can diffuse out of the crystal, thus limiting the hydrothermal transformation (41). After
dehydration, boehmite possessed small crystallites would retain its structure because of the easy
egress for water evolved during heating. Boehmite with large crystallites would be more altered
(giving macroporous structure) due the influence of high internal PH2O (45). If this is true, it has
obvious implications for bauxite activation. The (pseudo) boehmite produced by gibbsite
dehydration may behave quite differently for the boehmite already present in the bauxite (41). This
is because the boehmite is produced as microcrystallites (1-2 μm) throughout the interior of the
gibbsite crystal with none likely to be present at the exterior (31). In contrast bauxitic boehmite can
be concentrated on the outside of particles (46). Some previous work (27) (47) implied that it was
the crystallite size and not the particle size of the gibbsite that was important. It was found that
agglomerates of very fine gibbsite behaved exactly as would be expected for isolated crystals of
fine gibbsite. Coarse gibbsite also delays the temperature at which conversion to boehmite or χ-
Al2O3 occurs (29). This is because coarse gibbsite prevents water egress until higher internal PH2O is
achieved. This may also be because coarse crystals would tend to have a lower lattice defect
frequency (41).

1.4.1.2. Water vapour pressure (PH2O)
Dehydration behaviour of gibbsite and boehmite is dependent on the water vapour pressure
(PH2O) (45) (48). A lower decomposition temperature for the aluminium oxyhydroxides is observed
for lower water vapour pressure (41). The dependence on PH2O is presumably because a higher PH2O
requires a higher internal vapour pressure for the reaction to proceed (45). Some workers (49)
found that raising PH2O from 1.4 to 8 kPa increased pore volume ~ 20 to ~ 60 mL N2/g Al(OH)3.
Further increases in PH2O did not substantially further increase pore volume. The marked effect of
increasing PH2O from 1.4 to 8 kPa was put down to increase boehmite formation, which destabilised
the gibbsite structure through the creation of slit-shaped pores. The slit widths were also found to
increase as PH2O increased (50). Consistent with this Rouquerol et al. (50) had found that
essentially amorphous alumina (i.e. no boehmite formed) was created by heating gibbsite at PH2O
equal to 0.043 kPa.
1.4.1.3. Heating rate
Heating rate is one of the important factors that affects the phase transformation. The extreme
in heating rate variation is flash (fast) versus soak (slow) calcination. By comparing these two
types of heating, Ingram-Jones et al (39) found almost exclusive formation of ρ-Al2O3 from gibbsite
flash calcination. Early study (51) showed that a more active alumina is formed by flash heating as
opposed to kiln dehydration and a more extractable alumina would also result from the same
processes. Later, Broersma et al (45) indicated that the temperature at which boehmite decomposes
is well above the thermodynamically expected temperature because of the inhibition of water egress
from the crystals. In general, the decomposition temperatures are lower for the slower heating rates
(52).

1.5. Review of vibrational spectroscopic studies
1.5.1. Infrared spectroscopy
Infrared spectroscopy is a technique that concerned with the observation of the near, mid and
far infrared regions of the electromagnetic spectrum which span the wavenumber ranges between
15000 to 3000 cm-1, 4000 to 400 cm-1, and 600 to 10 cm-1, respectively. It provides a method for
studying materials in all three physical states – gas, liquid and solid, be they of an inorganic or
organic origin (53). Most compounds provide a unique infrared spectrum, which is representative
of their molecular structure. Thus, their infrared spectra can be used both for identification purpose,
and for the characterisation of constituent groupings in a material (54).
The first recorded infrared spectra of minerals seem to be those of calcite, fluorite, gypsum, and
quartz, measured in 1900 by Aschkinass using reflection methods (55). There are many sources
dealing with infrared spectra of minerals (56) (57) (58) (59) (60) (61), in many cases, with extensive
compilations of data. There are also specific articles on far-infrared spectra (56) (62), near-infrared
spectra (56) and theoretical aspects of infrared spectroscopy (57) as applied to minerals.
The introduction of infrared spectroscopy into the well-established field of mineral analysis
was somewhat limited given the supremacy of the X-ray diffraction technique. For over half a
century, X-ray diffraction methods adequately identified and characterised crystalline solid.
However, in the analysis of amorphous materials (e.g. thermally activated bauxite) for which X-ray
crystallographic data is tenuous, the paramount important of infrared spectroscopy as an analytical
technique has become apparent (63).
The use of vibrational spectroscopy to study the phases of the Al2O3-H2O system has been
extensive over a long period of time (57). Synthetic polycrystalline gibbsite showed bands at 3617,
3520, 3428 and 3380 cm-1. These bands were assigned to the hydroxyl stretching frequencies.
Bending vibrations were observed at 1020, 985, and 914 cm-1. Other bands were found at 802 and
743 cm-1. Van der Marel and Beutelspacher (10) reported the infrared spectra of a large number of
samples from the Al2O3-H2O system including gibbsite, boehmite, bayerite, and nordstrandite (10).
Bands were identified for gibbsite at 3620, 3520, 3450, and 3380 cm-1 in the hydroxyl stretching
region. Bands were also found at 1100, 1020, 968, 930, and 915 cm-1. Two low-frequency bands
were observed in many gibbsite samples at 836 and 745 cm-1(10). Infrared spectroscopy has been
used to show the development of crystalline structure in aluminium polymorphs on ageing (64).
Recent work has found that three high-frequency bands at 3622, 3529 and 3460 cm-1 showed
progressive sharpening on ageing (11). Naumann et al. suggested that infrared spectroscopy could
be used to estimate the extent of the lattice defects in gibbsites (65). The application of infrared
spectroscopy and its range of techniques have been widely used to study gibbsites. Further infrared
microscopy has been used to study bauxitic pisoliths from Weipa bauxites (66). Infrared
reflectance spectroscopy has been used to determine the concentrations of gibbsite in Australian
soils (67). Alumina surfaces and the adsorption of organics on alumina surfaces have been
extensively studied using infrared spectroscopy (68) (69).
For the dehydroxylation of gibbsite, Frost et al. (11) observed hydroxyl stretching frequencies
at 3670, 3620, 3524, 3452, 3395, 3375, and 3300 cm, and hydroxyl deformation frequencies at
1059, 1023, 969, 938, and 915 cm-1. The low frequency infrared absorption vibrations were found
at 860, 838, 800, 747, 666, 625, 585, 560, 522, 452, and 423 cm-1. They have found that a
pronounced blue shift (increase) was shown for the hydroxyl stretching vibrations while a red shift
(decrease) was shown for the hydroxyl deformation modes. The dehydroxylation of gibbsite is
followed by the loss of intensity of the hydroxyl stretching frequencies at 3620 and 3351 cm-1, and
by the loss of intensity of the hydroxyl deformation modes at 1024 cm-1. Dehydroxylation starts at
220 °C and is complete by 350 °C.
Synthetic gibbsite has been reported to have hydroxyl stretching frequencies at around 3670,
3620, 3524, 3395,and 3375 cm-1, which values agree well with those obtained for natural gibbsite
(10) (11) (57). However, natural gibbsite usually shows broader bands and some bands are not well
resolved, even though the peaks are observed in identical positions. This may be due to short-range
ordering that affects the infrared absorption spectra of gibbsites and the influence of organic and
inorganic ions during the formation of the gibbsite (70) (71). The difference in the width of the
bands between the synthetic and natural gibbsites may be attributed to the variations in the stacking
of the crystals of the natural samples (11). The 3460 cm-1 band has been shown to be polarized
perpendicular to the 001 plane and the bands at 3529 and 3622 cm-1 polarized in the plane, which is
parallel to the Al(OH)3 layers in the gibbsite structure (71). Frost et al. (11) concluded that the 3460
cm-1 band must be associated with hydrogen bonds between the layers, while the two higher
frequency bands (3529 and 3622 cm-1) correspond to longer hydrogen bonds between hydroxyls
lying in the same plane. They indicated that the higher the frequency, the weaker the hydrogen
bond and the longer the hydrogen-bond distance. By analysing the AlOH bending modes, Frost et
al. (11) found that the three hydroxyls deformation modes at 1024, 969, and 914 cm-1 correspond to
the three hydroxyl stretching frequencies at 3670, 3524, and 3395 cm-1. The additional bands in the
infrared absorption spectra of natural gibbsites may be related to stacking disorder in the gibbsite
structure (11). It has been reported that the band at 914 cm-1 of AlOH bending mode, which
corresponds to the hydroxyl stretching frequency of 3620 cm-1, is assigned to the hydroxyl
deformation vibration and is consistent in the spectra of both the natural and synthetic samples (72)
(73) (74). The 914 cm-1 band is ascribed to an Al(OH)Al group free from hydrogen bonding. This
frequency corresponds to the deformation mode of the inner hydroxyl group found in kaolinite and
this band is common to all the Al2O3-H2O phases (72). In the low frequency region, the bands at

600, 520, 452, and 423 cm-1 are assigned to the vibrations of the Al-O skeleton, the bands at 866,
839, 800, 747, and 700 cm-1 are related to the Al-OH-Al translational vibration (11).
The infrared spectrum of boehmite has a characteristic OH stretching band with two equally
strong maxima at 3297 and 3090 cm-1 (23) (75). Van der Marel and Beutelspacher, however,
reported a very strong maximum at 3090 cm-1 (10). The enormous splitting has been ascribed to the
presence of a direct bonding between the equivalent hydroxyls and to the high structural regularity
of the structure. In the OH bending region, boehmite is characterised by two vibrations at 1160 and
1080 cm-1. The vibration at 755 cm-1 involves the hydrogen vibrations according to Fripiat et al.
(76). An additional vibration at 636 cm-1 was also reported (10).
One of the most recent papers of Frost et al. (23) showed that the dehydroxylation of boehmite
is followed by the loss of intensity of the hydroxyl stretching frequencies observed at 3478, 3319,
and 3129 cm-1 and by the loss of intensity of the hydroxyl deformation modes at 1140 and 1057 cm-
1. Dehydroxylation of boehmite starts at 250 °C and is complete by 450 °C. They also found no
difference between synthetic and natural boehmite dehydroxylation. They compared their results of
infrared absorption with infrared emission and concluded that the hydroxyl stretching (2900-3600)
modes all show a strong blue shift and the hydroxyl deformation modes (900-1050) all show a
pronounced red shift. The hydroxyl translation modes (400-800) show a blue shift to higher
frequencies.
Fourier transform infrared along with other techniques (XRD, DTA, NMR) has been reported
(39) to provide good quality determination of the dehydroxylation sequences of gibbsite and
boehmite, which will be of benefit to the dehydroxylation of activated bauxite for this research.
FTIR spectroscopy plays an important role in distinguishing the pathways of thermal transformation
of boehmite and gibbsite.
1.5.2. Raman spectroscopy
In 1922 and 1923 Raman (77) (78) showed that the passage of rays of sunlight through clear
crystals of quartz or rock salt produced a blue opalescence. His students and collaborators
subsequently noted that monochromatic light scattered from some liquids contained frequencies
differing from that of the exciting radiation (79) (80) (81), and Raman noted a similar effect using
silicate glasses (82). His continuing studies on light scattering by transparent media led in 1928 to
the announcement of the effect that bears his name (79,80). In Russia Landsberg and Mandelstam
were pursuing independent research on this effect and their observations on quartz and later calcite
using the 2536, 3126, and 3650 Å lines of the mercury arc were probably the first published
observations of Raman scattering from a mineral (83). No less than fifty-nine papers on the Raman
effect were published in 1928 (84).
Both Raman and infrared spectroscopy of minerals have histories as long as those of the
techniques themselves, but the amount of work done on Raman spectra of minerals is much less
than that on infrared (85). Compared with infrared spectroscopy, the application of Raman
spectroscopy used for the study of gibbsite has been limited. Dispersive Raman spectroscopy has
been used to determine the presence of gibbsite and bayerite from natural, commercial and synthetic
materials (14) (86). Raman spectroscopy has also been used for the identification of aluminium
oxyhydroxide phases in caustic waste discharges (87).
A recent Raman spectroscopic study of Frost et al. (11) on dehydroxylation of gibbsite showed
that hydroxyl stretching bands are observed at 3524, 3436, and 3365 cm-1. In the low frequency
region, Raman bands are observed at 895, 882, 714, 568, 539,509,429, 398, 380, 321, 313, 257,
243, 206, and 180 cm-1. They indicated that the Raman bands with the most intensity are the 539

and 568 cm-1 bands. These bands are attributed to Al-O-Al deformations. They also reported that
an intense band with a shoulder at 307 cm-1 is observed at 321 cm-1, and both bands are assigned to
the Al-O-Al symmetric stretch.
One of the major problems in early Raman spectroscopic studies on alumina phases was unable
to obtain good quality spectra. In 1980, Huneke et al. (14) published their results on the
identification of gibbsite and bayerite by laser Raman spectroscopy and showed good quality
spectra. They reported that four strong, sharp bands at 3615, 3520, 3431, and 3361 cm-1 were
observed for gibbsite, while only three strong, sharp bands at 3651, 3542, and 3421 cm-1 are present
for bayerite at the hydroxyl stretching region between 3000 and 4000 cm-1. They also found that
the Raman spectrum of gibbsite was more complex than that for bayerite at the lower frequency
region (100-1100 cm-1). They therefore concluded that their Raman spectral data for gibbsite and
bayerite are distinctly different in the ν(O-H) region and can offer an unambiguous method of
identification the these two polymorphs of Al(OH)3, and recommended that this technique is an
excellent complementary technique to use along with X-ray powder methods because it is easy, fast,
non-destructive, and has unique feature that does not require previous dehydration of samples as IR
does.
Later, Rodgers (86) reported his results in identification of aluminium hydroxide polymorphs
with laser Raman microprobe using natural samples. He found that gibbsite displays four intense
ν(OH) stretching bands at 3365, 3435, 3525, and 3618 cm-1, whereas bayerite shows three near
3425, 3545 and 3564 cm-1. The two polymorphs also possess distinctly different Raman signatures
of medium to strong bands in the region 100-1200 cm-1. He found that differences between the
vibrational spectra of gibbsite and bayerite in ν(OH) stretching region are related to the position and
strength or hydrogen bonds. Those hydrogen bonds are located within and between the hexagonally
close-packed hydroxyl layers. His results are consistent with those reported in the literature (14)

(88) (89) (90). The variation in Raman band shapes, widths and relative intensities can reflect the
degree of crystalline order, the relative strengths and population densities of bonds giving rise to
particular scattering bands, the concentration of a polymorph in mixed samples, and polarisation of
different vibration modes affected by sampling geometries (64) (86). Rodgers (86) also found that
the effects of noise and fluorescence are experimental problems to give reproducible high quality
spectra, particularly in lower frequency region. He reported that not all weaker bands were
developed in all spectra of a given species. A weak band or indistinct shoulder with inconsistent
position was noted. Irrespective of technical limitations, Rodgers (86) showed that each aluminium
hydroxide modification shows a distinct Raman signature with a consistent pattern of medium to
very strong bands. His results and other results (91) showed that the principal differences in the
vibration spectra of the aluminium hydroxide polymorphs below ~800 cm-1 are related to
differences in the symmetry of the Al(OH)6 unit.
Vivian et al (91) assigned all absorption bands in the IR spectra in this low frequency region to
vibrations arising from Al-O bonds. Bands in the low frequency region may also arise from
librational motions of hydroxyls, lattice modes, and vibrations of hydrogen bonds (86). Several
workers (14) (86) (87) (92) have confirmed the identification of a species as either the (OH) or
(AlO) stretching bands of aluminium hydroxide polymorphs. They also found that Raman
spectroscopy offers an alternative procedure in characterising poorly crystalline components along
with a combination of several determinative methods.
A Raman study on sol-gel alumina by Roy and Sood (93) indicated that boehmite, gamma,
delta, and alpha-phases of the alumina gel are distinguished by Raman spectroscopy. The main
Raman line in the boehmite phase is red-shifted as well as asymmetrically broadened with respect
to that in the crystalline boehmite, signifying the nanocrystalline nature of the gel. However, they
found that Raman signatures are absent in the gamma and delta-phases due to the disorder in cation
vacancies.
1.5.3. Infrared photoacoustic spectroscopy
The power of coupling FTIR to photoacoustic infrared spectroscopy (PAS) brought about
significant improvements in signal-to-noise ratios to produce good quality spectra, while the
throughput and multiple advantages of FTIR made the utilisation of a broad band source feasible in
PAS (94) (95) (96). PAS is a powerful technique in the study of surface layers and surface
reactions on mineral compounds. For example, PAS was successfully used to determine adsorption
interactions between clay mineral carriers and compounds like insecticides (97) and
organophosphonates (98); with similar experiments having been performed on the surface of metal
and metal oxide powders (99) (100). PAS was also applied for characterisation purposes.
PAS in the near infrared (NIR) range is also useful in characterisation and surface study. A
limited proportion of the photoacoustic literature actually contributes to near infrared studies of
minerals. The earliest reported work was performed by Schmidt (101) on soils and clay mineral
solids. PAS offered a convenient method to overcome the heterogeneous nature and light scattering
tendencies of the materials; found tedious in their analysis by conventional transmission and
reflectance spectroscopy. Cresser and Livesay (102) investigated the changes in dispersive NIR-
PAS spectra of iron oxides, oxyhydroxides, silicates and carbonates attributable to dehydration and
dehydroxylation reactions, which occur on heating. They found NIR-PAS to have possible uses for
quantitative determination of hydrated minerals and for investigations in surface reactions that
occur in minerals during differential thermal and thermogravimetric analyses. Donini and
Michaelian (103) investigated the NIR-PAS spectra of kaolinite, cation-exchanged bentonites and
coal. Their results showed that PAS, operated from a rapid-scan FTIR spectrometer, was feasible
for use in the NIR; a technique never before demonstrated. However, in order to characterise the
combination and overtone bands of Al-OH, H-OH bending and OH stretching modes of the clay
minerals, as well as low-lying spectral transitions of coal within the spectral range 4000-10000 cm,
the limiting velocity of moving mirror has to be reduced. Cresser et al (102) found that the NIR
region of the photoacoustic spectra of minerals is dominated by OH. Later, Arato et al (104)
reported that gibbsite, boehmite and bayerite showed different absorption patterns in the stretching
and bending of OH bonds. Their PAS data for these aluminas in the wavelength region 400-4000
cm-1 are relatively consistent with previously reported data. The spectrum of gibbsite consists of 5
main OH stretching bonds at 3620, 3525, 3446, 3393, and 3379 cm-1. They recommended that PAS
is a useful tool for the characterisation of dehydrated and hydrated aluminas. PAS is also applied to
the surface characterisation of iron oxide surfaces (105), and the determination of iron oxides along
with other minerals in soils (106) (107). The advantages of PAS were indicated by Livesey et al
(108), who used PAS to study the analytical potential of the approach involving heating minerals at
a series of chosen temperatures, and monitoring the results for the purpose of mineral analysis.
Their results showed that the changes in photoacoustic spectra of minerals after heating to different
temperatures could be used for mineral identification, particularly if PAS is used in conjunction
with X-ray diffraction and conventional DTA. By applying PAS in characterisation of the surface
structure of nano-crystalline oxides, Ying (109) has proposed the potential applications of PAS in
analysis of surface chemistry, defect structure, surface phonons, grain boundary structure, and
quantum size effects. His study of bulk, interfacial and surface structures of nanocrystalline
alumina (110) showed that the significant spectral broadening associated with nanocrystalline
samples was attributed to the finite crystal effects and the disorder in the grain boundaries. The
changes in the phonon vibration and surface adsorption of the oxide nanoclusters during heat
treatments were ascribed to grain growth and densification. Adsorption of H2O and CO2 onto

aluminium oxides has also been distinguished by obtaining high quality IR photoacoustic spectra
(111).
1.6. Summary
Different analytical methodologies used by many researchers have resulted in intensive debates
on interpretation of the mechanism, kinetics and pathways of gibbsite and boehmite
dehydroxylation. The level of disagreement and outright contradiction in the literature is
astounding. Much of this appears to be due to a combination of (a) poor experimental techniques
and samples, (b) poor characterisation tools, and (c) lack of understanding of the basic chemistry.
Vibrational spectroscopy in conjunction with XRD and electron microscopy is then chosen for the
characterisation, structural transformation, and surface chemistry (94). Vibrational spectroscopy
has advantages over other techniques in the study of hydroxyl groups both on the surface and in the
structure of a mineral. It has been reported that hydroxyl groups play a most important role in
controlling the mechanism and kinetics of dehydroxylation (20) (28) (112) (113).
It is therefore critical, for this research, bauxite (containing mainly gibbsite and boehmite)
activation is hypothesised as a function of hydroxyl groups (either on crystal surface or in
structure), and also as a function of heating temperature, crystal (particle) size distribution.
Diaspore and bayerite as important referenced minerals and iron oxides as representative impurities
are involved in these comparisons. The relationships mentioned above may provide the Bayer
process (alumina refinery) with information for the increase in alumina phase transformation to
form α-Al2O3 during thermal treatments and in proportion of calcined bauxite dissolution in hot
sodium hydroxide solution. Vibrational studies of thermal transformation of iron oxides are very
important to understand the influences of these impurities on alumina phase transformation under
activation conditions.
By comparing common analytical techniques for bauxite characterisation, according to Rintoul
and Fredericks (66), accurate petrography by optical microscopy is difficult because the different
mineral species can appear very similar. Conventional x-ray diffraction can give useful
mineralogical information, but the spatial resolution is on the order of 1 mm, whereas the mineral
grains have sizes in the micrometer range (114). Scanning and transmission electron microscopy
has a much higher spatial resolution, but provides information in the form of an elemental analysis
rather than the desired mineralogical analysis.
An alternative technique for mineral identification is IR vibrational spectroscopy. The
selection of this technique as an essential tool to investigate the thermal activation of bauxite is
based on its advantages that can readily distinguish most of the minerals commonly occurring in
bauxite (66). To date only little work has been done in IR and Raman spectroscopy for thermally
activated bauxites. As emphasised by Grocott (41), it is such a simple technique that even if it only
reveals a small amount of information, it is worth making IR measurements compared with XRD,
electron microscopic, and other techniques that have been frequently used for characterisation of
bauxite. The advantages in using synchrotron radiation x-ray diffraction, as mentioned earlier, has
revealed its potential application in many disciplines, particularly in the characterisation of Al/Fe
phases and bauxites in conjunction with vibrational techniques, as will be addressed in this thesis.
1.7. References
(1) Berthier, P. Ann. Mines 6 (1821) 531.
(2) Liebrich, A. Ber. Oberhess. Ges. Natur. Heilk., Giessen, Naturw. Abt. 28 (1892) 57.
(3) Valeton, I. Bauxites - Developments in Soil Science 1; Elsevier, London, 1972.
(4) Klein, C., Hurlbut, Jr. C. S. Manual of Mineralogy; John Wiley & Sons Inc, New York, 1993.

(5) Gordon, M., Tracey, J. I. Origin of the Arkansas bauxite deposits. In: Problems of clay and laterite
genesis - symposium; Am. Inst. Mining Metall. Eng., 1952, 12-34.
(6) McNeil, M. Sci. Am. 211 (1964) 96.
(7) McFarlane, M. J. Laterite and landscape; Academic Press, London, 1976.
(8) Price, G. D., Valdes, P. J., Sellwood, B. W. Palaeogeography, Palaeoclimatology, Palaeoecology
131 (1997) 1.
(9) Owen, H. B. Bauxite in Australia; Bull. Bur. Mineral Resources, Geol. Geophys., Australia, 1954.
(10) van der Marel, H. W., Beutelspacher, H. Atlas of Infrared Spectroscopy of Clay Minerals and their
Admixtures; Elsevier, Amsterdam, The Netherlands, 1976.
(11) Frost, R. L., Kloprogge, J. T., Russell, S.C., Szetu, J. L. Appl. Spectr. 53 (1999) 423.
(12) Schoen, R., Robertson, C. E. Am. Miner. 55 (1970) 43.
(13) Taylor, R. M., In: Chemistry of clays and clay minerals; Mineralogical Society Monograph 6, A. C.
D. Newman, Ed., Mineralogical Society, London, 1987.
(14) Huneke, J. T., Cramer, R. E., Alvarez, R, El-Swaify, S. A. Soil Sci. Soc. Am. J. 44 (1980) 131.
(15) Deer, W. A., Howie, R. A. Zussman, J. An Introduction to the Rock-Forming Minerals; John Wiley
& Sons Inc, New York, 1992.
(16) Gross, S., Heller, L. Mineralog. Mag. 32 (1963) 723.
(17) Hsu, P. H., Bates, T. F. Mineralog. Mag. 33 (1964) 749.
(18) Bersillow, J. L., Brown, D. W., Fiessinger, F., Hem, J. D. J. Res. U.S. Geol Survey 6 (1978) 325.
(19) Frost, R. L., Kloprogge, J. T., Russell, S. C., Szetu, J. L. Appl. Spectr. 53 (1999) 829.
(20) Ruan, H. D., Gilkes, R. J. Clays Clay Miner. 43 (1995) 196.
(21) Schulze, D. G. Clays Clay Miner. 32 (1984) 36.
(22) Francombe, M. H., Rooksby, H. P. Clay Miner. Bull. 21 (1959) 1.
(23) Frost, R. L., Kloprogge, J. T., Russell, S.C., Szetu, J. L. Appl. Spectr. 53 (1999) 572.
(24) Buining, P. A., Pathmananoharan, C., Jansen, J. B. H., Lekkerkerker, H. N. W. J. Am. Cer. Soc. 74
(1992) 87.
(25) Saalfield, H. Clay Miner. Bull. 3 (1958) 249.
(26) Rouquerol, J., Rouquerol, F., Ganteaume, M. J. Catalysis 36 (1975) 99.
(27) Sato, T. Thermochimica Acta 88 (1985) 69.
(28) Paulik, F., Paulik, J., Naumann, R., Kohnke, K., Petzold, D. Thermochimica Acta 64 (1983) 1.
(29) Decleer, J. G. M. Bull. Soc. Chim. Belg. 98 (1989) 449.
(30) Brindley, G. W., Chow, J. O. The American Mineralogist 52 (1961) 201.
(31) Arakelyan, O. I., Chistyakova, A. A. J. Appl. Chem. USSR (English Trans.) 35 (1962) 1396.
(32) Feitknecht, W. W., A. Buser, W. Fourth symposium on reactivity of solids; Elsevier, Amsterdam,
1961.
(33) Freund, R. Ber. Deut. keram. Ges. 42 (1965) 23.
(34) Freund, R. Ber. Deut. keram. Ges. 44 (1967) 141.
(35) Colombo, C. V., A. Clays Clay Miner. 44 (1967) 113.
(36) Frost, R. L., Kloprogge, J. T., Russell, S. C., Szetu, J. L. Thermochimica Acta 329 (1998) 47.
(37) Abrams, L., Low, M. J. D. Industrial and Engineering Chemistry Product Research and
Development 8 (1969) 38.
(38) Lippens, B. C., De Boer, J. H. Acta Crystallogr. 17 (1964) 1312.
(39) Ingram-Jones, V. J., Slade, R. C. T., Davies, T. W., Southern, J. C., Salvador, S. J. Mater. Chem. 6
(1996) 73.
(40) Pecharroman, C., Sobrados, K., Iglesias, J. E., Gonzalea-Carreno, T., Sanz, J. J. Phys. Chem. B 103
(1999) 6160.
(41) Grocott, S. C. Bauxite activation literature review. In: With a focus on literature on pure gibbsite and
boehmite dehydration; Comalco Minerals & Alumina Report, 1998.
(42) de Boer, J. H., Fortuin, J. M. H., Steggerda, J. J. Proc. Koninklijke Ned Akademie van
Wetenschappen Ser B. 57 (1954) 170.
(43) de Boer, J. H., Fortuin, J. M. H., Steggerda, J. J. Proc. Koninklijke Ned Akademie van
Wetenschappen Ser B. 57 (1954) 434.
(44) Linsen, B. G., Lippens, B. C., Steggerda, J. J. Active alumina; Academic Press, London, 1970.
(45) Broersma, A., de Bruyn, P. L., Geus, J. W., Stol, R. J. J. Thermal Analysis 13 (1978) 341.
(46) Morgan, M. The geology of the Comalco bauxite resource. A beginner's guide; WTR 96/10, 1996.
(47) Sato, T. J. Thermal Analysis 32 (1987) 61.
(48) Wilson, S. J., McConnell, J. D. C. J. Solid State Chem. 34 (1980) 315.

(49) Candela, L., Perlmutter, D. D. AIChE J. 32 (1986) 1532.
(50) Rouquerol, J., Rouquerol, F., Ganteaume, M. J. Catalysis 57 (1979) 222.
(51) Osment, H. E., Emerson, R. B. Method for producing active alumina modules; In U.S. Patent
3,222,129: U.S.A., 1965.
(52) Lodding, W. The gibbsite dehydroxylation fork; Academic Press, New York, 1969.
(53) Moeller, T., Bailer Jr. J. C., Kleinberg, J., Guss, C. O., Castellion, M. E., Metz, C. Chemistry with
inorganic qualitative analysis; Harcourt Brace Jovanovich, Inc., Orlando, Florida, 1984.
(54) Russell, J. D. A handbook of determinative methods in clay mineralogy; Blackie & Son, Glasgow,
1987.
(55) Aschkinass, E. Ann. Physik 1 (1900) 42.
(56) Karr, C. Infrared and Raman spectroscopy of Lunar and Terrestrial minerals; Academic Press, New
York, 1975.
(57) Farmer, V. C. Infrared spectra of minerals; Mineralogical Society, London, 1974.
(58) Gadsden, J. A. Infrared spectra of minerals and related inorganic compounds; Butterworth, London,
1975.
(59) Boldyrev, A. I. Infrakasnye specktry mineralov; Nedra, Moscow, 1976.
(60) Plyusnina, I. I. Infrakasnye specktry mineralov; Moscow University, Moscow, 1976.
(61) Ferraro, J. R. The sadtler infrared handbook of minerals and clays; Sadtler-Heyden, Philadelphia,
1982.
(62) Karr, C. Proc. Nucl. Eng. 11 (1972) 111.
(63) Gadsden, J. A. Infrared spectra of minerals and related inorganic compounds; Butterworth, London,
1975.
(64) Elderfield, H., Hem, J. D. Mineral. Mag. 39 (1973) 89.
(65) Naumann, K., Kohnke, K., Paulik, J. Paulik, F. Thermochim. Acta 64 (1983) 1.
(66) Rintoul, L., Fredericks, P. M. Appl. Spectrosc. 49 (1995) 1608.
(67) Janik, L. J., Skjemstad, J. O. Australian J. Soil Res. 33 (1995) 637.
(68) Lee, D. H., Condrate, R. A. Mat. Lett. 23 (1995) 241.
(69) Klug, O., Parlagh, G., Forsling, W. J. Molec. Struct. 183 (1997) 410.
(70) Violante, A., Giandfreda, L. Violante, P. Clays Clay Miner. 41 (1993) 353.

(71) Russell, J. D., Parfitt, R. L., Fraser, A. R., Farmer, V. C. Nature 248 (1974) 220.
(72) Frost, R. L. Clays Clay Miner. 46 (1998) 280.
(73) Frost, R. L. Clays Clay Miner. 43 (1995) 191.
(74) Frost, R. L. Clay miner. 32 (1997) 73.
(75) Ryskin, Y. I. in The infrared spectra of Minerals; Mineralogical Society: London, 1974; 137.
(76) Fripiat, J. J., Bosmans, H., Rouxhet, P. G. J. Phys. Chem. 71 (1970) 1097.
(77) Raman, C. V. Nature 109 (1922) 42.
(78) Raman, C. V. Nature 112 (1923) 281.
(79) Raman, C. V. Ind. J. Phys. 2 (1928) 378.
(80) Raman, C. V., Krishnan, R. S. Nature 121 (1928) 501.
(81) Ramanathan, K. R. Proc. Ind. Assoc. Cult. Sci. 8 (1923) 181.
(82) Raman, C. V. J. Opt. Soc. Am. 15 (1927) 185.
(83) Landsberg, G., Mandelstam, L. naturwissenschaften 16 (1928) 557.
(84) Krishnan, R. S., Shankar, R. K. J. Raman Spectrosc. 10 (1981) 1.
(85) Griffith, W. P. Spectroscopy of inorganic-based materials; John Wiley & Sons Ltd, 1987.
(86) Rodgers, K. A. Clay Minerals 28 (1993) 85.
(87) Rogders, K. A., Gregory, M. R., Barton, Bayerite, R. Clays Clay Miner. 39 (1991) 103.
(88) Russell, J. D., Parfitt, R. L., Fraser, A. R., Farmer, V. C. Nature 248 (1974) 220.
(89) Cunningham, K. M. G., M. C. Soil Sci. 136 (1983) 102.
(90) Crestin-Desjobert, S., Cruege, F., Gout, R. Terra Cognita 7 (1987) 14.
(91) Vivian, D., Stegman, M. G., Mazieres, C. J. Chim. Phys. 70 (1973) 1502.
(92) Hsu, P. H. aluminium hydroxides and oxyhydroxides; Soil Sci. Soc. Am., 1989.
(93) Roy, A., Sood, A. K. Pramana-Journal of Physics 44 (1995) 201.
(94) Zhang, S., Franke, F. S., Niemczyk Emission spectroscopy. Modern techniques in applied molecular
spectroscopy; John Wiley & Sons Inc, Toronto, Canada, 1998.
(95) Griffiths, P. R. Advances in infrared and Raman spectroscopy; John Wiley & Sons, New York,
1983.
(96) Graham, J. A., Grim III, W. M., Fateley, W. G. Fourier transform infrared spectroscopy:
applications to chemical systems; Academic Press.

(97) Lowry, S. R., Mead, D. G., Vidrine, D. W. Anal. Chem. 54 (1982) 546.
(98) Bowen, J. M., Compton, S. V., Blanche, S. M. Anal. Chem. 61 (1989) 2047.
(99) Fowkes, F. M., Huang, Y. C., Shah, B. A., Kulp, M. J., Lloyd, T. B. Coll. and Surf. 29 (1988) 243.
(100) Nakao, Y., Yamada, H., Yamada, M. Proc. SPIE - Int. Soc. Opt. Eng., 1975 (8th Int. Con. on
Fourier Transform spectroscopy), 1991, 538.
(101) Schmidt, T. Advanced chemical methods for soil and clay minerals research; D. Reidel Publishing
Co., London, 1980.
(102) Cresser, M. S., Livesay, N. T. Analyst 109 (1984) 219.
(103) Donini, J. C., Michaelian, K. H. Infrared Phys. 26 (1986) 135.
(104) Arato, T., Tochigi, K., Tamamura, T. Mippon Seramikkusu Kyokai Gakujutsu Ronbunshi 98 (1990)
726.
(105) Nishikawa, Y., Kimura, K., Matsuda, A., Kenpo, T. Appl. Spectr. 46 (1992) 1695.
(106) Wu, M. Gunangpuxue Yu Guangpu Fenxi 11 (1991) 71.
(107) Moreira-Nordemann, L. M., Lucht, L. A. M., Muniz, R. P. A. Soil Sci. 139 (1985) 538.
(108) Livesey, N. T., Cresser, M. S. Therm. Anal., Proc. Int. conf., 7th 1 (1982) 325.
(109) Ying, J. Y. NATO ASI Ser., Ser. E. 260 (1994) 197.
(110) Ying, J. Y. NATO ASI Ser., Ser. E. 233 (1993) 565.
(111) Benziger, J. B., McGovern, S. J., Royce, B. S. H. ACS Symp. Ser. 288 (1985) 449.
(112) Ruan, H. D., Gilkes, R. J. J. Thermal Analysis 46 (1996) 1223.
(113) Grygar, T., Ruan, H. D., Gilkes, R. J. J. Thermal Analysis and Calorimetry 55 (1999) 301.
(114) Schulze, D. G. Soil Mineralogy with Environmental Application. SSSA Book Series No. 7. Soil
Sci. Soc. Am. Madison, Wisconsin. 2002.
Chapter 2
2. GENERAL INTRODUCTION
2.1. Objectives and Aims of This Research
The major objectives and aims for this project include:
1) Structural study of natural and synthetic Al oxyhydroxides including gibbsite, bayerite,
boehmite and diaspore, Fe oxyhydroxides goethite and hematite, and kaolinite, in
relation to the structural study of bauxite;
2) Chemical, physical and mineralogical characteristics of the activated samples of Al/Fe
oxyhydroxides and bauxites under industrial and laboratory calcined conditions;
3) Nature of hydroxyl groups reflected on the changes in spectra as a function of
calcination temperature and the kinetics of calcination;
4) The study of water adsorption onto the surface of activated bauxites heated at various
temperatures to study the dehydroxylation of Al/Fe oxyhydroxides and bauxites, and the
effect hydroxylation on phase transformation in bauxites.
5) The relationships between spectroscopic properties and optimal calcination conditions,
pathways of dehydroxylation and phase transformation of activated Al/Fe
oxyhydroxides and bauxites.
6) Study on the potential application of these nano-structural materials as sorbents and
catalysts to industry, environment and agriculture.
2.2. Format and Organisation of Thesis
The format of the thesis is made as it is submitted as a sum of published papers.

This thesis consists of 10 chapters. Chapter 1 is the background and literature review on
bauxite, alumina phases and vibrational spectroscopy. Chapter 2 is a general introduction that
addresses the aims of this research and the approach to achieve those aims. Chapter 3 is Raman
spectroscopy and Chapter 4 is far IR of Al phases. Chapter 5 deals with surface chemistry of
gibbsite and kaolinite using IR-PAS. Chapters 6-8 address the Fe phases with Al substitution.
Various diverse experimental data interpretation and discussion of activated bauxite are present in
Chapter 9. The formats of the chapters 3-9 are based on the journal articles that have been
published or submitted. For convenience and brevity, the relevant literature for the individual paper
is presented in the introduction followed by materials and methods, results and discussion and
conclusions. A summary and suggestion of future work is given in Chapter 10. The references are
directly quoted at the end of each chapter.

Chapter 3
3. COMPARISON OF RAMAN SPECTRA IN CHARACTERISING GIBBSITE,
BAYERITE, DIASPORE AND BOEHMITE RELATING TO BAUXITE
(Ruan, H.D., Frost, R.L. and Kloprogge, J.T., Published in Journal of Raman Spectroscopy, 2001,
32: 745-750)

Chapter 4
4. FAR-INFRARED SPECTROSCOPY OF ALUMINA PHASES
(Ruan, H.D., Frost, R.L., Kloprogge, J.T. and Duong, L, Published in Spectrochimical Acta Part A.
2002, 58: 265-272)

Chapter 5
5. FT-IR PHOTOACOUSTIC SPECTROSCOPY OF KAOLINITE AND GIBBSITE SURFACES
(Ruan, H.D., Frost, R.L., Kloprogge, J.T., Schulze, D. G. and Duong, L., Published
in Proceedings of the12th International Clay Conference, Bahia Blanca, Argentina,
July 22-28, 2001, p 537-543, 2003)

Chapter 6
6. INFRARED SPECTROSCOPY OF GOETHITE DEHYDROXYLATION. I. THE
BEHAVIOUR OF HYDROXYL UNITS OF SYNTHETIC GOETHITE AND ITS
DEHYDROXYLATED PRODUCT HEMATITE
(Ruan, H.D., Frost, R.L. and Kloprogge, J.T., Published in Spectrochimica Acta Part A 2001,
57:2575-2586)
Chapter 7
7. INFRARED SPECTROSCOPY OF GOETHITE DEHYDROXYLATION. II. EFFECT
OF ALUMINIUM SUBSTITUTION OF THE BEHAVIOUR OF HYDROXYL UNITS
(Ruan, H.D., Frost, R.L., Kloprogge, J.T. and Duong, L, Published in Spectrochimica Acta Part A
2002, 58:479-491)

Chapter 8
8. INFRARED SPECTROSCOPY OF GOETHITE DEHYDROXYLATION. III. FT-IR
MICROSCOPY OF IN SITU STUDY OF THE THERMAL TRANSFORMATION OF
GOETHITE TO HEMATITE
(Ruan, H.D., Frost, R.L., Kloprogge, J.T. and Duong, L , Published in Spectrochimica Acta
Part A 2002, 58:967-981)
Chapter 9
9. FOURIER TRANSFORM INFRARED SPECTROSCOPY AND X-RAY DIFFRACTION OF
ACTIVATED BAUXITE
(Ruan, H.D., Schulze, D. G., Johnston, C. T., Frost, R.L. and Kloprogge, J.T., Submitted for the
publication in the Clays and Clay Minerals)
Chapter 10
9. SUMMARY OF RESULTS AND FINDINGS, AND SUGGESTIONS FOR FUTURE
WORK
9.1. Brief summary of results and findings
This chapter only briefly summarizes the results and findings of this study in terms of the
conclusions or general discussion presented from Chapter 3 to Chapter 9, which followed the
format of those papers published in refereed journals. The suggestions for the future work will
focus largely on the characterisation of a mixture of phases with emphasis on the transition phases
formed and their transformation during thermal activation, the dehydroxylation of bauxite that may
optimize the extraction of alumina.
The synthetic and natural aluminium hydroxides gibbsite, bayerite, diaspore and boehmite,
the synthetic iron oxides goethite and hematite, the natural kaolinite, and the activated bauxite that
consists of the mixture of gibbsite and boehmite as the raw materials of refining industry, iron
oxide, kaolinite, quartz, titanium oxides and other trace elements as impurities, have been
systematically studied using vibrational spectroscopy in conjunction with X-ray diffraction and
electron microscopy. The characterizations are based particularly on the vibrations of structural and
surface hydroxyl groups. Vibrational modes are assigned depending on atomic bonding and crystal
structure. Weak bands observed are taken into account for interpretation in addition to strong
bands. Gibbsite, bayerite, diaspore and boehmite are well distinguished although they have similar
atomic close packing. The behaviour of hydroxyl is well characterised and fully interpreted for
both aluminium hydroxides and impurities, thus leading to the investigation of bauxite
dehydroxylation, including the pathways of dehydroxylation of gibbsite, boehmite and kaolinite and
the formation of poorly crystalline transition phases. The thermal dehydroxylation of aluminium

hydroxides and the formation of transition alumina phases have been extensively discussed and the
present findings compared with those cited in the literature. The spectroscopic study on the
dehydroxylation of aluminium substituted iron oxides has provided information of the relationships
between aluminium substitution, and band centre and width, a shift of the band centre being the
result of aluminium substitution. This proportion of aluminium in aluminium substituted goethite
or hematite may be extractable if a right dehydroxylation pathway is followed. A most important
factor in the bauxite activation, as reported in the literature and observed in this study might be the
heating rate. It appears that the higher the heating rate, the more disruption to the crystal structure
which in turn should lead to a more reactive product from the bauxite activation. By combining the
vibrational spectroscopy, X-ray diffraction, and electron microscopy, the present study has achieved
a well-defined characterisation of both pure and mixed phases in a bauxite sample complex.
Vibrational spectroscopy has revealed its advantages and is considered to be a fast, non-destructive
technique for the characterization of pure and mixed phases.
9.2. Suggestions for future work
9.2.1. Data collection, manipulation and interpretation of transition aluminas
Since the vibrational characterisation for transition alumina, particularly for poorly
crystalline transition aluminas is complicated due to the overlap and poor resolution of their bands,
the manipulation and interpretation are more difficult for transition aluminas than for aluminium
hydroxides. One of the reasons is that there are no systematical data that may provide criteria as
references for the characterisation of transition aluminas. In addition, band positions reported vary
considerably from one study to another in terms of the disordered structure that has caused the
changes in oxygen close packing, cation migration and hydroxyl rearrangement. In our cases, the

formation and development of transition aluminas are induced through thermal dehydroxylation.
Their phases may vary depending on the degree of dehydroxylation, one meta-product may undergo
several stages from disordered to ordered and to well crystalline before it transforms into another
phase. Thus, the liberation of hydroxyls is indicative of thermal processes and the behaviour of
hydroxyls is one of the most important characteristics of transition aluminas. Vibrational
spectroscopy is one of the advanced and powerful techniques in studying the behaviour of
hydroxyls, and thus can become one of the routine analytical techniques if reference data sources
have been established systematically.
9.2.2. Simulation of dehydroxylation of bauxite under different conditions of
controlled experiments
Although the results of this study have added useful information in vibrational spectroscopy
of aluminium hydroxides (gibbsite, bayerite, boehmite and diaspore) and iron oxides (goethite and
hematite) with aluminium substitution, and provided new information about the transformation
from aluminium hydroxides to transition alumina, it is still necessary to carry out further work on
the simulation of dehydroxylation of bauxite to compare the dehydroxylation of pure aluminium
hydroxides under different experimental conditions, including particle size distribution and
crystallinity, effect of water vapour pressure (PH2O) and heating rate. It is also worth to compare
the methods of dehydroxylation such as soak (slow heating) and flash (fast heating) calcination.
Laboratory simulation under selected conditions and a controlled environment would enable us to
obtain information on how and when to optimise the extraction of alumina following certain
dehydroxylation pathways. It is noted that the following factors should be taken into account: 1)
alumina phase rehydroxylation, which may decrease the alumina extractability in terms of the
newly formed aluminium hydroxides from the rehydroxylation of transition aluminas, which are
less soluble than transition alumina phases; 2) newly formed boehmite solubility, which may be

different from that of the boehmite already existing in bauxite, thus deserving future investigations;
3) alumina phase extractability, which includes the solubility in sodium hydroxide, and the pore size
influence.
In the past three decades, the synchrotron techniques have been developed rapidly as they
can be the very powerful tools in many applications. The following is a brief introduction to these
advanced techniques.
9.2.3. Application of synchrotron radiation X-ray techniques
9.2.3.1. Advantages of synchrotron radiation X-ray techniques
With the rapid development in synchrotron radiation techniques recently, synchrotron radiation
has shown its advantages in the identification and characterisation of minerals, inorganic solids and
liquids, biomolecules, and heterogeneous materials, with its wide applications in many disciplines
including chemistry, physics, biology, engineering, environment, agriculture, geoscience, material
science, medical and health sciences, etc. About three decades ago, scientists exploited a peculiar
type of electromagnetic radiation that is generated in circular electron accelerators called
synchrotron radiation (1). The radiation was first observed in 1947 in an electron synchrotron of
the General Electric Company and hence it was named. This type of radiation is intense and highly
polarised, and it contains a broad continuum of wavelengths. In synchrotron, charged particles,
either electrons or positrons, are injected into a ring-shaped vacuum chamber kept at ultrahigh
vacuum (~ 10-9 Torr). The particles enter the ring via the injection magnet and then travel around
the ring at near the speed of light, being steered by a series of bending magnets (2). Radiation in the
form of infrared, visible, ultraviolet and X-ray light is emitted when the charged particles pass
through the bending magnets or through insertion devices such as wigglers or undulators. Beam
lines allow the radiation to enter experimental stations, shielded rooms that house the
instrumentation needed for specific experiments.
Synchrotron-based techniques provide information at scales of measurement from angstroms
(10-10 m) to millimetres (10-3 m). Synchrotron light is extremely intense, is emitted over a wide
range of energies (from the infrared region with energies of <1 eV to the hard X-ray region with
energies of 100 keV or more), is highly collimated and highly polarised, and has a pulsed time
structure. All of these properties make synchrotron light sources extremely useful for a wide
variety of analytical techniques, many of which are only possible using a synchrotron source (1).
The synchrotron radiation techniques with which the candidate is familiar are described in
the following sections. Some samples collected in the U.S., in addition to those described in
previous chapter, were used for the synchrotron work. All data presented here were recorded by the
candidate at the X26A beamline, NSLS, Brookhaven National Laboratory, Upton, New York.
(a) Synchrotron X-ray diffraction, of which the principles are not fundamentally
different from those of diffraction utilizing a laboratory X-ray source. Synchrotron X-
ray resources, however, provide a number of advantages for both single crystal and
powder diffraction. Compared to conventional X-ray diffraction (XRD), there are at
least four advantages in using synchrotron X-ray diffraction (SXRD):
(i) Better peak resolution: Only a narrow energy range is selected from a broad
continuum of radiation by the crystal monochromators used for synchrotron
powder diffraction, eliminating the problem of Kα1-Kα2 doublet broadening
inherent with the use of conventional X-ray tubes. The well-defined incident
wavelength, along with the highly collimated nature of the synchrotron X-rays,

allow diffractometer designs that can produce diffraction lines roughly an order
or more of magnitude narrower, and peak to background ratios an order or more
of magnitude better, than those obtained form a conventional laboratory
diffractometer (Figs. 10.1, 10.2, 10.3).
(ii) Exploitation of anomalous scattering effects: X-ray scattering by elements
changes as the incident wavelength is varied. The change in scattering is
particularly large near an adsorption edge of an element and is the result of
resonance between the incident X-ray waves and electronic transitions from
bound atomic orbitals. In the differential anomalous powder diffraction
experiment, two diffraction patterns are obtained, one using an incident
wavelength below the absorption edge of the element of interest and the other
using a wavelength at the absorption edge. Subtraction of the two patterns
results in the diffraction pattern of the phases containing the element of interest,
and this is similar to differential XRD (3). The advantage in SXRD is that
exactly the same sample is used for both patterns, allowing much better matching
of peaks common to both patterns. The spectral range accessible for anomalous
diffraction is for incident X-ray wavelengths of ~ 0.3-3.0 Å or energies of ~ 4-40
keV (4).
(iii) Microdiffraction: Although microdiffraction techniques are still in the early
stages of development and this development is always a challenge to obtain
extremely small X-ray beams (5). With an appropriately designed beam-line that
has been improved from time to time, diffraction patterns from a 100-μm2 area of
thin sections and particles have been recorded (Figs. 10.1, 10.2, 10.3).
Information on the spatial distribution of nano-sized minerals, or minute mineral

from the selected particles or areas (Figs. 10.4, 10.5), in heated or unheated
samples is obtained to complement the bulk information obtained by
conventional XRD techniques.
(iv) Time-resolved diffraction for the course of chemical reactions: The high X-ray
flux available from synchrotron sources has allowed the development of time-
resolved powder diffraction techniques at time scales inaccessible using
laboratory X-ray sources (6, 7). The time for collecting successive diffraction
patterns has been reported, for example, as short as in 200 ms (8). This
technique enables data of successive X-ray diffraction to be recorded as much as
possible for the entire reaction so that in situ investigation of phase transition can
be achieved.

Figure 10.1. Synchrotron micro X-ray diffraction images of alpha alumina (a) one dimension and (b) two dimension patterns; and gamma alumina (c) one dimension and (d) two dimension patterns. Patterns and images obtained from a spot size as small as 10 X 10 μm, where heterogeneous distribution of phases can be determined. Spectra were recorded in 2 minutes. The unit in (a) and (b) is angstrom (Å). (Data of this figure and the following figures were recorded by the candidate at X26A beamline, NSLS, Brookhaven National Laboratory, Upton, New York).
10 12 14 16 18 20
2-theta degree
Inte
nsity
(cou
nt)
Alpha alumina
3.48
2.55
2.38
2.09
5 7 9 11 13 15 17 19
2-theta degree
Inte
nsity
(cou
nt)
6.09
3.48
2.732.40
2.28
Gamma alumina
(a)
(b)
(c)
(d)

Figure 10.2. Synchrotron micro X-ray diffraction of aluminium hydroxides showing 1D and 2D images, (a, b) gibbsite, (c, d) bayerite, (e, f) boehmite, and (g, h) diaspore. Impurities in natural diaspore can be determined easily with a high resolution and a high signal to noise ratio. The unit represents angstrom (Å).
4 6 8 10 12 14 16 18 20
2-theta degree
Inte
nsity
(cou
nt)
Diaspore 9.22
4.16
4.474.29
4.18
4.08
4.01
3.77
3.48
3.07 2.57
2.53
2.42
2.34
2.162.08
5 7 9 11 13 15 17 19
2-theta degree
Inte
nsity
(cou
nt)
Gibbsite 4.85
4.374.32
3.363.32
3.182.45
2.42
2.39
2.24 2.16
5 7 9 11 13 15 17 19
2-theta degree
Inte
nsity
(cou
nt)
Bayerite 4.72
4.36
3.20
2.70 2.36
2.22
5 7 9 11 13 15 17 19
2-theta degree
Inte
nsity
(cou
nt)
Boehmite6.11
3.16
3.36
(a) (b)
(c) (d)
(e) (e)
(f) (g)

Figure 10.3. Synchrotron micro X-ray diffraction of Al-goethite, (a, b) 0% Al-goethite, (c, d) 10% Al-goethite, (e, f) 20% Al-goethite, and (g, h) 30% Al-goethite, showing the diffraction lines shift to low d-spacing as Al-substitution increases. Only less than mg of sample is required and spectra can be obtained from any selected particles. The unit represents angstrom (Å).
5 7 9 11 13 15 17 19
2-theta degree
Inte
nsity
(cou
nt)
0% Al-Goethite
4.98
4.19
3.38
2.692.59
2.46
2.25 2.19
5 7 9 11 13 15 17 19
2-theta degree
Inte
nsity
(cou
nt)
10 % Al-goethite
4.97
4.19
3.38
2.692.58
2.45
2.252.19
5 7 9 11 13 15 17 19
2-theta degree
Inte
nsity
(cou
nt)
20% Al-goethite
4.96
4.18
3.38
2.682.56
2.44
2.232.18
5 7 9 11 13 15 17 19
2-theta degree
Inte
nsity
(cou
nt)
30% Al-goethite
4.96
4.17
3.37
2.672.55
2.43
2.222.18
(a) (b)
(c) (d)
(e) (f)
(g) (h)

Figure 10.4. Synchrotron-based micro XRD patterns obtained from ~100 μm2 areas were equivalent to conventional XRD patterns acquired from ~100 mm2 areas. Higher spatial resolution allows identification of a trace phase if the phase is highly concentrated in small areas. The selected Mn-Fe rich nodule sample contains less than 5% romanechite and was not determined by the conventional laboratory XRD, but was clearly identified by SXRD from the selected spots within a small particle (#022) (see Figure 10.5. for more details). Some mixtures such as goethite with other clay minerals can be detected separately and an almost pure goethite spectrum is recorded (#036). Spectra were acquired in 5 minutes.
2 4 6 8 10 12 14 16 18 20
2-theta degree
inte
nsity
(cou
nt)
#022 Romanechite
#036 Pure Goethite
#039 Mixture of chlorite, mica, kaolinite and quartz
#032 Goethite and quarts
Chlorite 14.1 Å
Mica9.98 Å
Kaolinite7.12 Å Mica
4.98 Å
Quartz4.25 Å
Quartz3.33 Å
Goethite4.18 Å
Romanechite2.40 Å
Synchrotron micro X-ray diffraction

Figure 10.5. Synchrotron micro X-ray diffraction (SXRD) and micro X-ray fluorescence (SXRF)
data can be acquired from a beam size as small as 10 X 10 μm of a Mn-Fe rich nodule. The
nodule was generously crushed into small particles. The SXRD and SXRF data can be obtained
either from the exterior or interior of a nodule. The corresponding SXRD and SXRF spectra are
shown in Figures 10.4 and 10.6, respectively.
Romanechite, a rare Ba-Mn-oxide. XRF shows higher Mn than Fe and the presence of Ba
Mainly goethite. XRF shows abundant Fe and little Mn.
Chlorite, mica, kaolinite (?), & quartz. XRF shows K, Ca.
Beamsize
#039
#032
#036
#022
Nodule Interior
Nodule Exterior
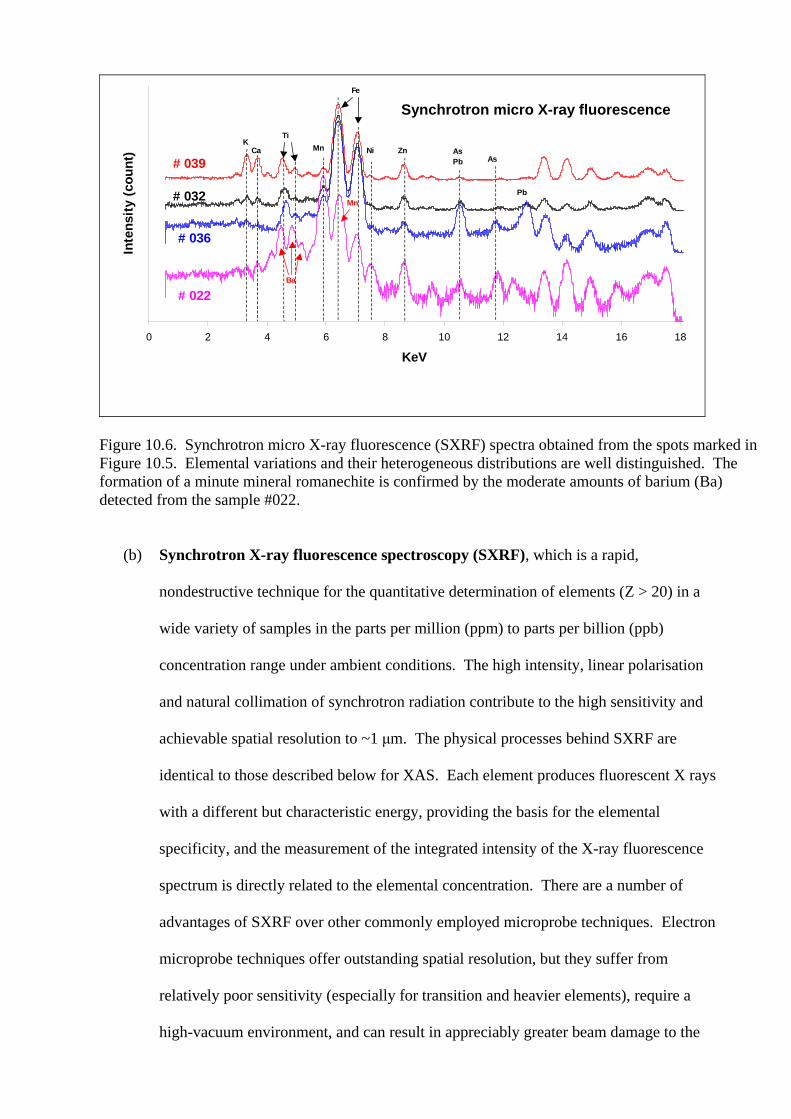
Figure 10.6. Synchrotron micro X-ray fluorescence (SXRF) spectra obtained from the spots marked in Figure 10.5. Elemental variations and their heterogeneous distributions are well distinguished. The formation of a minute mineral romanechite is confirmed by the moderate amounts of barium (Ba) detected from the sample #022.
(b) Synchrotron X-ray fluorescence spectroscopy (SXRF), which is a rapid,
nondestructive technique for the quantitative determination of elements (Z > 20) in a
wide variety of samples in the parts per million (ppm) to parts per billion (ppb)
concentration range under ambient conditions. The high intensity, linear polarisation
and natural collimation of synchrotron radiation contribute to the high sensitivity and
achievable spatial resolution to ~1 μm. The physical processes behind SXRF are
identical to those described below for XAS. Each element produces fluorescent X rays
with a different but characteristic energy, providing the basis for the elemental
specificity, and the measurement of the integrated intensity of the X-ray fluorescence
spectrum is directly related to the elemental concentration. There are a number of
advantages of SXRF over other commonly employed microprobe techniques. Electron
microprobe techniques offer outstanding spatial resolution, but they suffer from
relatively poor sensitivity (especially for transition and heavier elements), require a
high-vacuum environment, and can result in appreciably greater beam damage to the
0 2 4 6 8 10 12 14 16 18
KeV
Inte
nsity
(cou
nt)
# 022Ba
Mn
Fe
Ni Zn AsPb
# 032
# 036
# 039
Mn
KCa
Ti
As
Pb
Synchrotron micro X-ray fluorescence

sample. Likewise, proton-induced X-ray emission (PIXE), although it achieves spatial
resolution comparable to that of SXRF, is not as sensitive for heavier elements and can
impart beam damage to the sample. The applications of SXRF involve nondestructive,
in situ determination of elements in small samples or elemental distributions in
heterogeneous samples (Fig. 10.6). The applications have been particularly useful for
transition metal analysis of samples for which both energy-dispersive X-ray analysis
(EDX) with an electron microscope and PIXE are not sufficiently sensitive and/or
when beam damage to small samples is a concern. Other applications of SXRF have
employed 2D scans of samples or regions within a sample to provide complete
elemental maps. The spatial resolution of the images of one-half the beam size (~4
μm) is easily achieved by acquiring data at points separated by a commensurate step
size (Fig. 10.7).

(a) (b)
(c)
Figure 10.7. Two dimension mapping using synchrotron micro X-ray fluorescence (SXRF), showing the spatial distributions of (a) chromium (Cr) and (b) lead (Pb) in a heterogeneous thin section with a mapping area of 1.0 X 0.8 mm. The abundance of elements chromium (Cr) and lead (Pb) is indicated by their relative intensities from (c) a SXRF spectrum.
(c) X-ray absorption spectroscopy (XAS), which can provide detailed chemical and
structural information about a specific absorbing element, whether it is a major
component of a bulk solid phase (either crystalline or non-crystalline), a trace
component of the bulk phase, a soluble species, or a surface-sorbed component. For
most elements of the periodic table, XAS can provide specific information on the local
1 0
1 0 0
1 0 0 0
1 0 0 0 0
1 0 0 0 0 0
0 5 1 0 1 5 2 0
E n e r g y (k e V )
Inte
nsity
(cou
nt)
C r
P b

environment of an absorber, including its coordination number and the identity and
distances to nearest, and sometimes next nearest, neighboring atoms. This type of
information is not generally available from other techniques, particularly for poorly
ordered mineral phases. For elements with Z > 20, XAS can be conducted on wet
samples, suspensions, and solutions under ambient conditions at absorber
concentrations down to 100 μg g-1 or less. For almost all applications, XAS is a
technique that requires a synchrotron X-ray source, as conventional sources do not
produce sufficient X-ray intensity to obtain a spectrum with adequate signal to noise in
a reasonable time period (2, 3). An X-ray absorption spectrum typically can be
divided into three major energy regions, all of which have fundamentally different
physical origins, namely the preedge region (2-10 eV), the X-ray absorption near edge
structure (XANES) or the near edge X-ray absorption fine structure (NEXAFS) where
the region extends just beyond the preedge region to approximately 50 eV, the
extended X-ray absorption fine structure (EXAFS) as the third energy region from 50-
1000 eV (2, 3, 4, 5, 6, 7). The applications of XAS include minerals and inorganic
solids; surface-sorbed species, redox reactions on mineral surfaces; biomolecules;
soluble metal complexes; heterogeneous materials; spatial distributions of elements;
quantification of oxidation states; oxidation state mapping; and low-Z-elements using
the scanning transmission X-ray microscope.
(d) Synchrotron infrared microspectroscopy, which can provide the source for infrared
spectroscopy. The synchrotron sources are about 100-1000 times brighter than the
conventional black-body infrared source originally provided with the instrument. By
using the synchrotron source, it is able to obtain roughly the same signal from a 10-
μm2 spot size as could be obtained from a 100-μm2 spot by using the original black-
body radiator (2, 3). It is also one of the common techniques used for spatially
resolved identification, and used to complement the elemental and chemical
information obtained by X-ray fluorescence or X-ray absorption spectroscopy.
In addition, the following synchrotron radiation techniques are also commonly employed.
These include: 1) Standing wave and fluorescent X-ray interference techniques, which rely on the
interference of incident and diffracted or reflected X-rays to probe the interfacial region at a solid
surface, thus can be used to probe the distribution of atoms in an adsorbed layer with respect to the
underlying bulk diffraction planes. 2) Mössbauer spectroscopy, which uses synchrotron sources to
reduce data acquisition times to the order of seconds from the hours or days required with current
radioactive sources. 3) Small angle scattering (SAXS), which can provide information on the
microstructure of disordered solids, biological and inorganic colloids, and soluble polynuclear
species. 4) X-ray microscopy, which uses X-rays rather than electrons to generate an image and
allows the sample to remain in air or water during observation, in terms of X-rays being much more
penetrating than electrons. 5) X-ray computed microtomography, which is commonly used for
medical imaging, where it is referred to as computer-assisted tomography (CAT) or computed
tomography (CT) scanning. An X-ray tomographic image is obtained by measuring the linear X-
ray attenuation coefficient for a large number of rays that intersect the object of interest at various
angles.
9.2.3.2. Synchrotron micro X-ray diffraction experimentation
Some synchrotron micro X-ray analysis experiments have been recently carried out by the
candidate at the X26A beamline, NSLS, Brookhaven National Laboratory, Upton, New York. The
experimental setup in X-ray microprobe beam line X26A consisted of a primary aperture, a beam-
defining aperture composed of computer-controlled tantalum shutters, an optional monochromator
for operation in the X-ray absorption spectroscopic mode, a pinhole or elliptical focusing mirror to

produce small X-ray beams, and a computer-controlled x, y, z, micrometer stepping motor sample
stage that can move the samples to appropriate locations within the beam. The positions of a
sample can be adjusted from outside the experimental hutch controlled by a computer through a
petrographic microscope with a TV camera.
Samples were slightly crushed and the crushed small particles were placed on a Kapton tape.
The particles were mounted and fixed in a slide holder. The in situ measurements including spatial
distribution of elements were conducted using resin imbedded thin sections (9). The SXRD and
SXRF spectra were collected respectively in 2-5 minutes, using a Si (Li) X-ray Detector at E = 17.5
keV and λ = 0.7085 Å. The samples were typically oriented at 45° to the incident beam so that the
detector resided at 90° to the incident beam and in the plane of the storage ring.
Experimental data were processed using Fit2d software (http://biocat1.iit.edu/fit2d). An
Al2O3 standard spectrum was used for calibration. Synchrotron X-ray diffraction 1 and 2 D images
were obtained. Data were manipulated and results were interpreted in conjunction with the use of
Jade X-ray diffraction software (Materials Data Incorporation, 1224 Concannon Boulevard,
California 94551).
In summary, synchrotron radiation light sources have many advantages and are the cutting
edge techniques that are being and will be used frequently in future research. With the installation
of new generation synchrotron facilities in Melbourne, Australian researchers will have more
opportunities to be involved in the applications of these modern technologies.

9.3. References
(1) Winick, H. Sci. Am. 257 (1987) 88.
(2) Schulze, D.G. Bertsch, P.M. Advanced in Agronomy 55 (1995) 1.
(3) Schulze, D. G. Differential x-ray diffraction analysis of soil minerals. In: Quantitative
methods in soil mineralogy (J. E. Amonette and L. W. Zelazny, eds.), Soil Sci. Soc. Amer.
Misc. Pulb., Soil Sci. Soc. Amer., Madison, WI. 1994, 412.
(4) Hendrickson, W. A. Science 254 (1991) 51.
(5) Bilderback, D. H., Hoffman, S. A. and Thiel, D. J. Science 263 (1994) 201.
(6) Finger, L. W. Synchrotron powder diffraction. In: Modern powder diffraction (D. L. Bish and
J. E. Post, eds.), Reviews in mineralogy Vol. 20, Miner. Soc. Amer., Washington, D.C.
1989, 307.
(7) Cox, D. E. Powder diffraction. In: Handbook on synchrotron radiation (D. S. Brown and D. E.
Moncton, eds.), Vol. 3, Elsevier, New York, 1991, 155.
(8) Pennartz, P. U., Löchner, U. and Fuess, H. J. Appl. Crystallogr. 25 (1992) 571.
(9) Ruan, H. D. and Schulze, D. G. Synchrotron micro X-ray analysis determination of trace
minerals in Mn-Fe nodules from heterogeneous soil matrix. Clays Clay Miner. 2003
(submitted).