Embed Size (px)
Citation preview

Label-free imaging of the native, living cellularnanoarchitecture using partial-wavespectroscopic microscopyLuay M. Almassalhaa,1, GretaM. Bauera,1, John E. Chandlera,1, Scott Gladsteina,1, Lusik Cherkezyana, Yolanda Stypula-Cyrusa,Samuel Weinbergb, Di Zhanga, Peder Thusgaard Ruhoffc, Hemant K. Roya,d, Hariharan Subramaniana,Navdeep S. Chandelb, Igal Szleifera,e,f, and Vadim Backmana,f,2
aDepartment of Biomedical Engineering, Northwestern University, Evanston, IL 60208; bDepartment of Medicine, Northwestern University Feinberg Schoolof Medicine, Chicago, IL 60611; cInstitute of Technology and Innovation, University of Southern Denmark, DK-5230 Odense M, Denmark; dSection ofGastroenterology, Boston Medical Center, Boston University School of Medicine, Boston, MA 02118; eDepartment of Chemistry, Northwestern University,Evanston, IL 60208; and fChemistry of Life Processes Institute, Northwestern University, Evanston, IL 60208
Edited by Rebecca R. Richards-Kortum, Rice University, Houston, TX, and approved August 23, 2016 (received for review May 25, 2016)
The organization of chromatin is a regulator of molecular processesincluding transcription, replication, and DNA repair. The structureswithin chromatin that regulate these processes span from thenucleosomal (10-nm) to the chromosomal (>200-nm) levels, with lit-tle known about the dynamics of chromatin structure between thesescales due to a lack of quantitative imaging technique in live cells.Previous work using partial-wave spectroscopic (PWS) microscopy, aquantitative imaging technique with sensitivity to macromolecularorganization between 20 and 200 nm, has shown that transforma-tion of chromatin at these length scales is a fundamental event dur-ing carcinogenesis. As the dynamics of chromatin likely play a criticalregulatory role in cellular function, it is critical to develop live-cellimaging techniques that can probe the real-time temporal behaviorof the chromatin nanoarchitecture. Therefore, we developed a live-cell PWS technique that allows high-throughput, label-free study ofthe causal relationship between nanoscale organization and molec-ular function in real time. In this work, we use live-cell PWS to studythe change in chromatin structure due to DNA damage and expandon the link between metabolic function and the structure of higher-order chromatin. In particular, we studied the temporal changes tochromatin during UV light exposure, show that live-cell DNA-bindingdyes induce damage to chromatin within seconds, and demonstratea direct link between higher-order chromatin structure and mito-chondrial membrane potential. Because biological function is tightlypaired with structure, live-cell PWS is a powerful tool to study thenanoscale structure–function relationship in live cells.
chromatin | microscopy | DNA damage | mitochondrial metabolism |cell dynamics
Every cellular and extracellular structure has a complex nano-scale organization ranging from individual macromolecules
that are a few nanometers in size (e.g., protein and DNA) tomacromolecular assemblies that are tens to hundreds of nano-meters in size (e.g., cell membranes, higher-order chromatinstructure, cytoskeleton, and extracellular matrix fibers). A majorscientific challenge is to understand these macromolecular struc-tures, specifically their function and interactions in structurally anddynamically complex living cellular systems. To meet these goals,the ideal live-cell imaging technology would satisfy six key re-quirements: being (i) nanoscale sensitive (<200 nm), (ii) labelfree, (iii) nonperturbing, (iv) quantitative, (v) high throughput, and(vi) molecularly informative.Current approaches are unable to meet all of these criteria
alone. The breakthroughs in superresolution fluorescence mi-croscopy (SRM) have enabled new imaging technologies capableof providing unprecedented molecular identification at the highestresolutions currently available in live cells, but require the use ofexogenous fluorophores to visualize macromolecular structures(1–3). For some applications, these labels are indispensable to
achieve molecular specificity. However, there are significantdrawbacks to the exclusive use of molecular labels for studies ofcellular structure and function. Exclusively label-based SRM ap-proaches are limited by the number of possible imaging channels,by the high label densities required, by the high light intensitiesused during imaging, and by the introduction of possible artifactsdue to the labels themselves, especially at the high densities re-quired for nanoscale resolution (4, 5). In the study of macromo-lecular organization, current imaging approaches have significantdrawbacks as macromolecular structures are often composed ofdozens to hundreds of distinct molecules and often include dif-ferent subtypes such as lipids, proteins, nucleic acids, and carbo-hydrates, some of which are difficult to directly label. Due to theselimitations, phase contrast microscopy is still the most widely usedlabel-free imaging modality for live-cell experiments. Althoughthis technique is fast and improves contrast to visualize live cells,its diffraction-limited resolution cannot provide any insights intothe macromolecular nanoarchitecture. As such, currently no label-free optical technique exists to measure the nanoarchitecturalproperties of live cells below the diffraction limit.
Significance
Chromatin is one of the most critical structures within the cellbecause it houses most genetic information. Its structure is wellunderstood at the nucleosomal (<20-nm) and chromosomal(>200-nm) levels; however, due to the lack of quantitative im-agingmodalities to study this organization, little is known aboutthe higher-order structure between these length scales in livecells. We present a label-free technique, live-cell partial-wavespectroscopic (PWS) microscopy, with sensitivity to structuresbetween 20 and 200 nm that can quantify the nanoarchitecturein live cells. With this technique, we can detect DNA fragmen-tation and expand on the link between metabolic function andhigher-order chromatin structure. Live-cell PWS allows high-throughput study of the relationship between nanoscale orga-nization and molecular function.
Author contributions: H.K.R., H.S., N.S.C., I.S., and V.B. designed research; L.M.A., G.M.B.,J.E.C., S.G., Y.S.-C., and S.W. performed research; L.C., D.Z., and P.T.R. contributed newreagents/analytic tools; L.M.A., G.M.B., J.E.C., S.G., L.C., S.W., D.Z., and P.T.R. analyzeddata; and L.M.A., G.M.B., J.E.C., and S.G. wrote the paper.
Conflict of interest statement: V.B., H.S., and H.K.R. are cofounders of Nanocytomics, LLC.
This article is a PNAS Direct Submission.
Freely available online through the PNAS open access option.1L.M.A., G.M.B., J.E.C., and S.G. contributed equally to this work.2To whom correspondence should be addressed. Email: [email protected].
This article contains supporting information online at www.pnas.org/lookup/suppl/doi:10.1073/pnas.1608198113/-/DCSupplemental.
E6372–E6381 | PNAS | Published online October 4, 2016 www.pnas.org/cgi/doi/10.1073/pnas.1608198113

One prominent area of biological research with a demonstratedneed for label-free, nanoscale-sensitive imaging is the investigationof the structure–function relationship of chromatin. Chromatinorganization (which is comprised of DNA, histones, and hundredsof other conjugated proteins and small molecules such as RNA)involves a hierarchy of length scales ranging from 10 nm in nu-cleosomes to hundreds of nanometers for chromosomal territories(6, 7). The physical nanostructure of chromatin is regulated bynumerous molecular factors, including the primary DNA se-quence composition, differential methylation patterns, histonemodifications, polycomb and cohesin protein complexes, RNAand DNA polymerases, long noncoding RNA, etc., and non-molecular factors, such as crowding, ionic conditions, and pH.Due to this complexity and the lack of existing optical techniquesthat can rapidly sample information below 200 nm, little is knownabout the higher-order chromatin structure at length scales be-tween 10 and 200 nm or their dynamics in live cells (e.g., the foldingstructure of chromatin above that of mononucleosomes). Resultsfrom fixed-cell–imaging techniques, such as electron microscopyor SRM, have shown that chromatin between 20 and 200 nm isfirst organized into polynucleosomal 10-nm fibers, and in certainconditions, these fibers have been shown to assemble into 30-nmclusters (8–10), although the existence of the 30-nm fiber is asubject of an active debate. At length scales between 100 and200 nm, recent work using SRM has shown a power-law (fractal)relation in the organization of chromatin, with domains of highlydense, inactive chromatin localizing within a few hundred nano-meters of transcriptionally active sites (11). Furthermore, in vitrostudies using texture analysis of microscopy images have shownthat the topology of chromatin is well represented as a fractalmedia (12). Likewise, ex vivo analysis of somatic copy numberalterations and neutron scattering measurements of isolated nucleihave shown that, across these length scales, chromatin is welldescribed as a fractal media (13–15). In conjunction, moleculartechniques such as chromosomal capture methods [chromosomeconformation capture (3C) and high-throughput 3C (Hi-C)] haveshown that the higher-order organization of chromatin abovesingle nucleosomes and below the structure of chromosomal ter-ritories follows this same power-law fractal organization. Thesemethods have shown that topology of this higher-order organiza-tion is correlated with the regulation of gene transcription (16–18)and capable of evolving rapidly under stress conditions to globallyregulate the expression of genes (19). Critically, these observedchanges in chromatin structure have recently been linked to theregulation of genes often implicated in oncogenesis (20).In cancer, it is increasingly clear that changes in chromatin to-
pology at all length scales are a critical determinant of tumorformation, aggressiveness, and chemoresistance. One of the pri-mary features of tumorigenesis is a shift in the fractal physicalorganization of chromatin, correlating both with the formation oftumors and their invasiveness. In early carcinogenesis, we havepreviously applied a fixed-cell–imaging technique, partial-wavespectroscopic (PWS) microscopy and transmission electron mi-croscopy (TEM), to detect physical changes in the chromatinnanoarchitecture, indicating that the topology of chromatin is acritical component in cellular function at the earliest stages of tu-mor formation (21). PWS microscopy allows examination of theintracellular organization concealed by the diffraction limit withlength scale sensitivity in the range of 20–200 nm, the range atwhich existing label-free live-cell imaging techniques are deficient,due to the relationship between the nanoscale spatial variations ofmacromolecular density and the resulting variance in the spectrumof backscattered light (22, 23). The novelty is grounded in a pre-viously overlooked difference between resolution and detectability.Although subdiffractional structures are not resolved by PWS, theyare still detected by analyzing the spectrum of elastically scatteredlight to provide quantitative contrast. This capability is rooted inthe principle that, whereas structures below the diffraction limit
cannot be resolved, structures at all length scales within a sample,larger or smaller than the focused spot size, will scatter light.Moreover, the amount of light a particle scatters depends on thesize of the particle and not on the focused spot size. Hence, par-ticles smaller than the diffraction limit of light cannot be visualized,yet their presence and organization can be sensed by analyzing thelight they scatter.In this work, we set out to create a label-free live-cell microscopy
method based on interference principles used in PWS cytology,thereby creating a tool to directly study the dynamic nanoscaletopology of live cells, with a specific focus on studying real-timechanges in chromatin organization. We sought to develop an idealextension of PWS in live cells that would (i) provide nanoscalesensitivity to structures between 20 and 200 nm, (ii) use label-freecontrast to capture nanoscopic information, (iii) be nonperturbingto biological samples by using low-power illumination and label-freecontrast, (iv) quantify the cellular nanoarchitecture, and (v) rapidlycapture the temporal evolution of nanoscale structures, providingcontrast in multiple cells in seconds. For studies aimed at under-standing the overall structure–function relationship in eukaryoticcells, using SRM approaches alone would not be suitable. Thepower of live-cell PWS is its unique ability to work in conjunctionwith existing label-based technologies to provide the structuralcontext for molecular interactions, thereby greatly expanding ourunderstanding of the molecular behavior in live cells (24). Withthis approach, we demonstrate the ability to measure the nano-architecture in live cells in seconds. Specifically, we explore changesto the cellular nanoarchitecture due to UV light exposure, showthat live-cell DNA-binding dyes transform chromatin within seconds,and demonstrate a direct link between higher-order chromatinstructure and mitochondrial membrane potential.
Results and DiscussionThe live-cell PWS instrument is built into a commercial invertedmicroscope equipped with a broadband illumination and a tunablespectral collection filter (Fig. S1). With this configuration, the live-cell instrument uses the glass–cell interface to produce the requi-site interference signal that allows for the study of underlyingnanoscale structure. In brief, the spatial fluctuations of refractiveindex (RI) produced by the macromolecular density distributioncause backscattering of incident light waves from the sample.Optical interference of the backpropagating light results in wave-length-dependent fluctuations in the acquired spectrally resolvedmicroscope image. The standard deviation of these spectra (Σ)quantifies the internal structure of the sample with nanometer sen-sitivity (22, 23). In cells, there are numerous variations in macro-molecular density due to the spatial organization of macromolecules.Quantification of this nanomolecular density distribution is given bythe statistical parameter, Σ, at each diffraction-limited pixel (22, 23).Σ, and the disorder strength (Ld, which is Σ normalized by
sample thickness), are proportional to two crucial characteristicsof molecular organization at deeply subdiffractional length scales:the characteristic length scale of macromolecular organization(Lc), and the standard deviation (δn) of the density (22, 23). In afractal media, such as chromatin, the characteristic length scale ofmacromolecules can be alternatively evaluated through the fractaldimension, D, which is proportional to Σ. Thus, Σ measured fromchromatin senses nanoscale changes in its fractal organization.Critically, increase in heterogeneity (i.e., differential compaction)within chromatin by definition produces an increase in D, δn, orLc. This relation is derived from the properties of fractal mediawith conserved mass and volume—as compaction increases locally,the variations in mass density (heterogeneity) must also increase.Previous molecular dynamics simulations have further confirmedthat increases in δn*Lc correspond to an increase in macromo-lecular compaction, and experimental results have shown that thisincrease within the nucleus quantitatively describes an increase inchromatin heterogeneity (21, 25, 26).
Almassalha et al. PNAS | Published online October 4, 2016 | E6373
CELL
BIOLO
GY
PNASPL
US
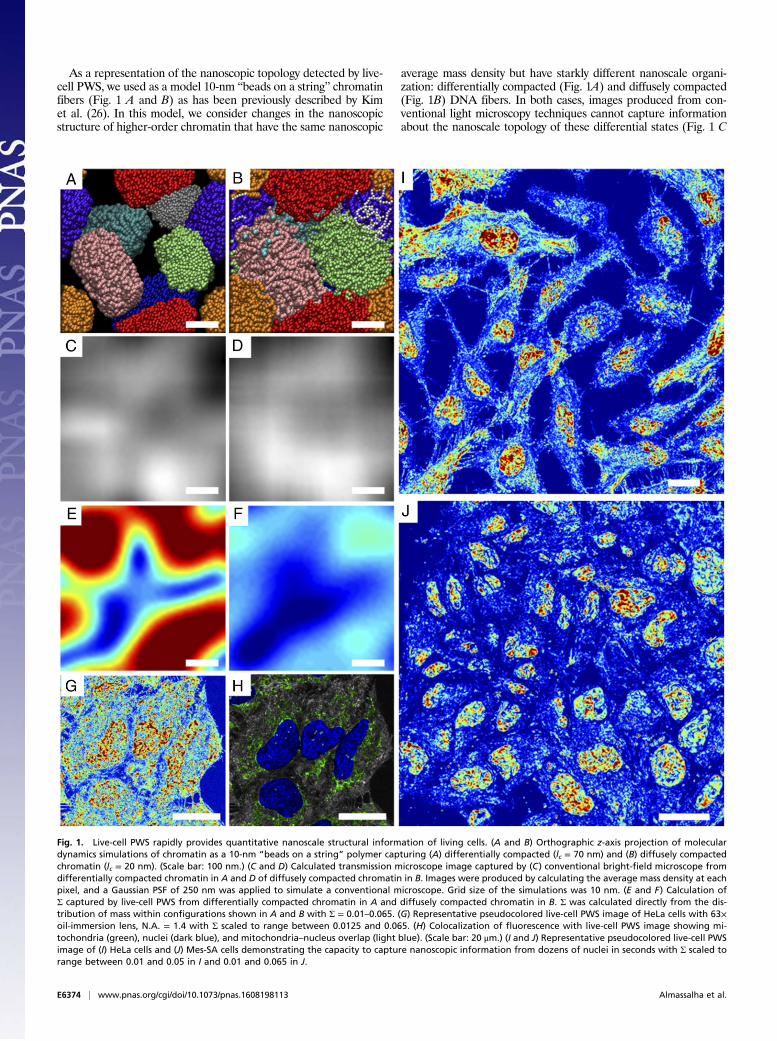
As a representation of the nanoscopic topology detected by live-cell PWS, we used as a model 10-nm “beads on a string” chromatinfibers (Fig. 1 A and B) as has been previously described by Kimet al. (26). In this model, we consider changes in the nanoscopicstructure of higher-order chromatin that have the same nanoscopic
average mass density but have starkly different nanoscale organi-zation: differentially compacted (Fig. 1A) and diffusely compacted(Fig. 1B) DNA fibers. In both cases, images produced from con-ventional light microscopy techniques cannot capture informationabout the nanoscale topology of these differential states (Fig. 1 C
Fig. 1. Live-cell PWS rapidly provides quantitative nanoscale structural information of living cells. (A and B) Orthographic z-axis projection of moleculardynamics simulations of chromatin as a 10-nm “beads on a string” polymer capturing (A) differentially compacted (lc = 70 nm) and (B) diffusely compactedchromatin (lc = 20 nm). (Scale bar: 100 nm.) (C and D) Calculated transmission microscope image captured by (C) conventional bright-field microscope fromdifferentially compacted chromatin in A and D of diffusely compacted chromatin in B. Images were produced by calculating the average mass density at eachpixel, and a Gaussian PSF of 250 nm was applied to simulate a conventional microscope. Grid size of the simulations was 10 nm. (E and F) Calculation ofΣ captured by live-cell PWS from differentially compacted chromatin in A and diffusely compacted chromatin in B. Σ was calculated directly from the dis-tribution of mass within configurations shown in A and B with Σ = 0.01–0.065. (G) Representative pseudocolored live-cell PWS image of HeLa cells with 63×oil-immersion lens, N.A. = 1.4 with Σ scaled to range between 0.0125 and 0.065. (H) Colocalization of fluorescence with live-cell PWS image showing mi-tochondria (green), nuclei (dark blue), and mitochondria–nucleus overlap (light blue). (Scale bar: 20 μm.) (I and J) Representative pseudocolored live-cell PWSimage of (I) HeLa cells and (J) Mes-SA cells demonstrating the capacity to capture nanoscopic information from dozens of nuclei in seconds with Σ scaled torange between 0.01 and 0.05 in I and 0.01 and 0.065 in J.
E6374 | www.pnas.org/cgi/doi/10.1073/pnas.1608198113 Almassalha et al.

and D). Likewise, although PWS cannot resolve the structures di-rectly, it provides information about their subdiffractional organi-zation. To demonstrate sensitivity to these structures, Σ is computeddirectly as described by the work of Cherkezyan et al. (22, 23) ac-counting for the physical properties of the live-cell system. As isshown in Fig. 1E, differentially compacted chromatin (Fig. 1A)produces a much higher Σ than diffusely compacted chromatin (Fig.1F). Consequently, regions that result in high Σ in live cells would bethe heterogeneous, differentially compacted regions likely resultingfrom the formation of local heterochromatin domains neighboringdecompacted euchromatin (Fig. 1A). Conversely, homogeneousregions of chromatin would result in low Σ.Although this instrument configuration was optimized to allow
live-cell imaging with multimodal acquisition, including wide-fieldfluorescence and phase contrast microscopy, it has an appreciablyweaker reference interference signal than that produced in tradi-tional PWS cytology and a much higher objective collection nu-merical aperture. Therefore, we validated the nanoscale sensitivityof live-cell PWS by using rigorous finite-difference time domaincomputations (Fig. S2) to numerically solve Maxwell’s equationswithout approximations simulating the nanoscale-complex spatialdistribution of molecular density in live cells. These computationswere used to study the effect of the RI mismatch using sapphire asa high-RI substrate on the interference signal (SI Materials andMethods, Origin of Interference Spectrum), and to compare theeffect of numerical aperture on Σ (Fig. S3). The finite-differencetime domain (FDTD) simulations enabled us to optimize theconfiguration of signal acquisition to provide nanoscale sensitivityto intracellular structure at length scale between 20 and 200 nm.Without the use of exogenous labels, we can achieve high-contrast
images using Σ that delineate nuclei from cytoplasm due to theintrinsic differences in their nanoarchitecture (Fig. 1G; Fig. S4 foradditional comparisons in multiple cell lines, including primary; andFig. S5 for cell lines). Due to its multimodal design, exogenous andendogenous labels can be subsequently used to colocalize specificmolecular markers or organelles (Fig. 1H). Live-cell PWS acquisi-tion yields a 3D data cube, I(λ, x, y), where λ is the wavelength and(x, y) correspond to pixel positions across a 10,000-μm2 field of view,allowing multiple cells to be imaged simultaneously. Acquisition ofthe full cell reference interference spectrum (500–700 nm) forspectral analysis takes under 30 s, with each wavelength collectionproduced from <100-ms exposures. Using a reduced wavelengthapproach to subsample the interference spectrum, this can be fur-ther reduced to under 2 s per acquisition (27). Even with fullspectral collection, as demonstrated in Fig. 1 I and J (and Figs. S4and S5), live-cell PWS provides rapid, quantitative visualization ofcellular structures within a single field of view for dozens of cellssimultaneously for multiple cell lines (Fig. 1I, 20 HeLa cells cap-tured in ∼30 s, and Fig. 1J, 36 Mes-SA cells captured in ∼15 s).Indeed, one of the most critical features of this rapid acquisition isthe capacity to directly study the underlying heterogeneity of bothchromatin structure and its temporal evolution within the cellpopulation over time. Likewise, as a label-free technique using lowillumination intensity, live-cell PWS allows for the study of varioustime-evolving processes on the structure of cells in general, andchromatin in particular for different cell types over extended periodsof time.Live-cell PWS has a broad utility as a tool for studying the
complex relationships between cell function and chromatin nano-organization. As the initial demonstration, we explored live-cellPWS to rapidly quantify the changes in the nanoscale chromatinstructure due to DNA damage. As a demonstration of its ability todetect rapid changes specific to chromatin (within seconds), weexplored the transformation of the higher-order chromatin struc-ture secondary to DNA fragmentation using the DNA-binding dye,Hoechst 33342. Damage to DNA results in the formation of DNAfragments and double-stranded breaks (28–30). This damage, inturn, leads to apoptosis or mutagenic transformation. In cancer
therapy, many drugs eliminate tumor cells by causing an unbearableaccumulation of DNA damage and/or by activating the intrinsicapoptotic pathways (31, 32). Therefore, the identification ofDNA fragmentation and understanding of the time evolution ofchromatin structure in response to damage are crucial to bothunderstanding DNA repair mechanisms and to identifyingchemotherapeutic efficacy.Current techniques to study these processes require cell fixation,
such as immunofluorescent identification of the rapidly phos-phorylated histone H2A.X (γ-H2A.X) subunit (30) or transfectionusing photoactivatable proteins (33, 34). Furthermore, fluorescentvisualization of cell viability for drug screening often requires theuse of cell-permeant minor-groove binding dyes. However, it hasbeen reported that these minor-groove DNA-binding dyes, in-cluding Hoechst 33342, induce DNA fragmentation by disruptingthe activity of topoisomerase I (35, 36). These effects are observedindependently from the fluorescence excitation of the dye but areaccelerated upon UV excitation (36). Consequently, no methodscurrently exist with the capability for the real-time study of changesto chromatin higher-order structure due to DNA damage or theoverall dynamics of the damage response in unlabeled live cells.Using live-cell PWS, we show that the addition of Hoechst 33342
to living mammalian cells transforms the nanoorganization ofchromatin at the timescale required for imaging and that subsequentexcitation induces fragmentation of the chromatin nanoarchitecturewithin seconds. This is apparent, as we observe an overall decreasein the Σ after irradiation, suggesting homogenization and decom-paction of chromatin across the entire nucleus (Fig. 2A). Addi-tionally, these effects persist for longer durations, lasting at least15 min, indicating that the once-fragmented chromatin in thepresence of the dye does not immediately reassemble, suggestingthese changes could be irreversible. To control for the effects ofionizing UV radiation required for Hoechst excitation, we perfor-med a mock-staining (M-S) experiment where we compared thenuclear changes in cells incubated with Hoechst 33342 to thoseexposed to UV light alone. In the M-S cells, there was not an ob-servable change in cellular or chromatin structure during the shortillumination time required for Hoechst excitation, indicating pres-ervation of the original chromatin structure (Fig. 2 B and C).Quantitatively, M-S cells showed no significant change in mean-nuclear Σ after a few seconds of UV exposure, whereas theHoechst-stained cells display a 17.01% decrease in HeLa [99%confidence interval, Hoechst (−18.5%, −15.6%); value of P < 0.001]between M-S and Hoechst-stained cells with n = 146 cells from 11independent experiments for Hoechst-stained cells and n = 68 cellsfrom 6 independent experiments for M-S cells (Fig. 2 B and C). InHoechst-stained cells, all nuclei demonstrate a negative change inthe mean nuclear Σ after UV exposure, whereas the M-S cellsdisplay a narrow, zero-centered distribution after UV exposure (Fig.2E). In both M-S and Hoechst-stained cells, cytoplasmic Σ did notchange following UV exposure (value of P > 0.05). Similar resultswere observed for Chinese hamster ovarian (CHO) cells with M-Scells displaying no change, whereas Hoechst-stained cells experiencea −7.1% decrease [99% confidence interval, Hoechst (−9%, −5%);value of P < 0.001 between M-S and Hoechst-stained cells; n = 127cells for M-S, n = 87 for Hoechst-stained from five independentexperiments each], demonstrating this effect occurs independent ofthe cell type (Fig. S6).Due to this rapid (<10-s) chromatin transformation, we hypoth-
esized that the decrease in the mean nuclear Σ was due to thehomogenization of the higher-order chromatin organization causedby DNA fragmentation and the resulting nuclear remodeling. Totest this hypothesis, we used a γ-H2A.X-Alexa 488–conjugated an-tibody to independently monitor the fragmentation of DNA. InHoechst-stained cells, we observed a drastic accumulation of theγ-H2A.X antibody, whereas we observed little or no localization inthe M-S control nuclei (Fig. 2D). Additionally, TEM on Hoechst-stained and M-S cells exposed to UV light showed an increase in
Almassalha et al. PNAS | Published online October 4, 2016 | E6375
CELL
BIOLO
GY
PNASPL
US

micrometer-scale dense chromatin clumps compared with untreatedcells (Fig. 2 F and G). As previous work has shown that DNAdamage causes local chromatin expansion (37), this confirmed ourhypothesis that immediate DNA fragmentation was induced byHoechst 33342 excitation, a phenomenon that is detectable by
live-cell PWS in real time without the need for exogenous labels.Subsequently, we compared live-cell PWS with phase contrast mi-croscopy to determine whether live-cell PWS provides informationnot detectable by other standard, label-free optical modalities (Fig.3 A and B). With phase contrast microscopy, no changes in the cell
Fig. 2. Hoechst excitation induces rapid transformation of chromatin nanoarchitecture. (A) Pseudocolored live-cell PWS image of Hoechst 33342-stainedHeLa cells before and after excitation of the dye with UV light. Transformation of chromatin occurs across the whole nucleus within seconds and no repairis observed even after 15 min. (B) Hoechst-stained and M-S cells before excitation and (C ) the same M-S and Hoechst-stained cells after UV irradiation.(D) Minimal (mock) and significant (Hoechst) γH2A.X antibody accumulation. (E ) Distribution of chromatin transformation after UV excitation forHoechst-stained and M-S cells. (F and G) Transmission electron-microscopic images of control and Hoechst-stained cells confirming nanoscale fragmen-tation of the chromatin nanoarchitecture in fixed cells. All pseudocolored images scaled between Σ = 0.01 and 0.065. (All scale bars: 15 μm.) Arrowsindicate representative nuclei.
E6376 | www.pnas.org/cgi/doi/10.1073/pnas.1608198113 Almassalha et al.

or nuclear structure were detected after excitation of Hoechst33342 due to its diffraction-limited resolution (Fig. 3B). Althoughelectron microscopy cannot be performed on live cells, these ex-periments demonstrate that photoexcitable molecules disrupt thechromatin nanoarchitecture, which is uniquely detectable in realtime in live cells by live-cell PWS.Next, we investigated the effects of Hoechst staining on the
spatial transformation of chromatin nanoorganization as measuredby live-cell PWS. In particular, we analyzed the spatial distributionof Σ across the nucleus by calculating the 2D spatial autocorrela-tion, which measures the change in the pixel-to-pixel variability as afunction of distance. An increase in the spatial autocorrelationindicates that the nanoscale structure at one pixel has becomesimilar to its neighboring pixels, whereas a decrease indicates amore locally heterogeneous structure. The size of these clusters ofsimilar nanoscale structures was significantly decreased between100 nm and 1 μm after both the addition of Hoechst and its ex-citation (n = 40 from three independent experiments) (Fig. 3C).This indicates an increase in the spatial microscopic heterogeneityof nanoscopic heterogeneity of the nuclear nanoscale structure (Σ)after Hoechst addition and excitation. Consequently, we foundthat Hoechst causes a global alteration in the chromatin nano-architecture independent of its excitation. Not only does this studydemonstrate the ability of live-cell PWS to sense the alterations in
chromatin structure that were heretofore undetectable in live cells,such as double-strand DNA breaks, but it also illustrates some ofthe limitations of the extrinsic labeling approaches, such asHoechst: even though they have traditionally been used for live-cellimaging, these labels alter chromatin structure and lead to DNAdamage, which in turn may lead to a perturbation of cell function(Fig. S7).Owing to this sensitivity of live-cell PWS to detect dynamic
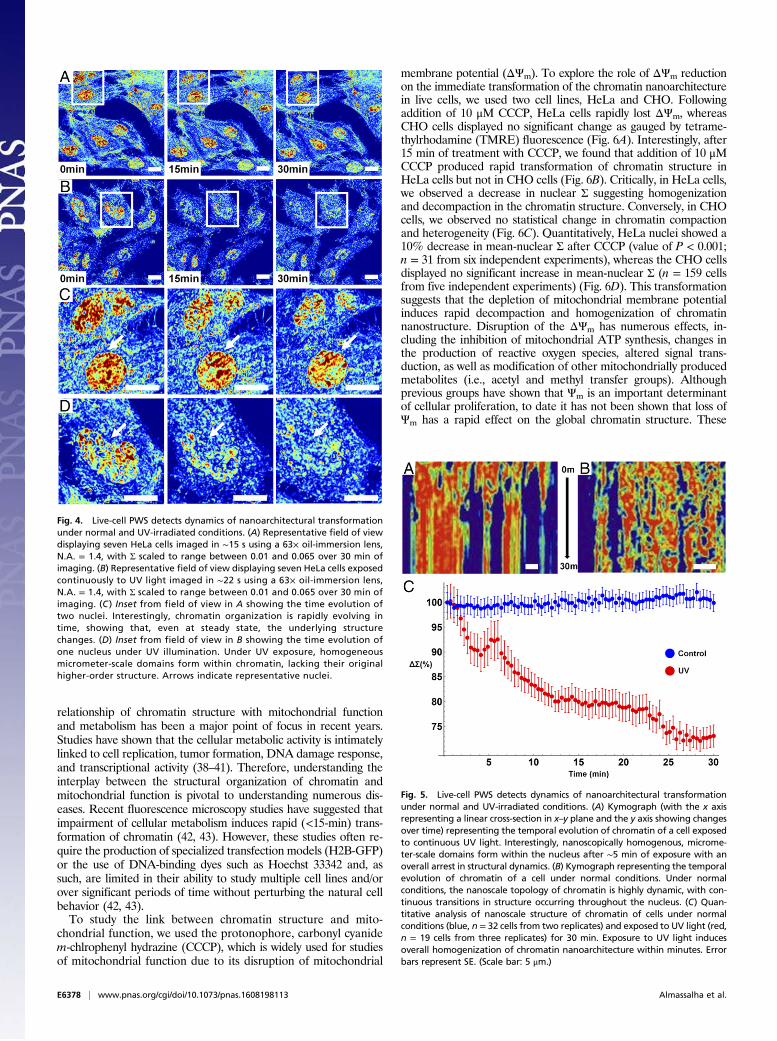
changes to the chromatin nanoarchitecture due to DNA damage,we next applied it to study the temporal dynamics of the cellularnanoarchitecture under normal growth conditions (Fig. 4A) incomparison with cells exposed to continuous UV light (Fig. 4B).UV light is known to cause DNA damage, generate reactive ox-ygen species, alter receptor-kinase function, and disrupt the cel-lular membrane. Under normal conditions, chromatin structurecan evolve rapidly, with whole-scale changes occurring in minutes(Fig. 4C; for a full movie of control cells, see Movie S1). Althoughthe nanoscale topology of chromatin rapidly evolves within anygiven cell, the organization across the population overall remainsstable under normal conditions. In comparison, during continuousUV exposure over 30 min, higher-order chromatin structure isdegraded after few minutes of exposure (Fig. 4D; for a full movieof UV-irradiated cells, see Movie S2), with pronounced variationsin structure over time from cell to cell (with time-lapse measure-ments performed for three independent experiments). As can beobserved in Movie S3, there are numerous phenomena that occurto the cellular nanoarchitecture during continuous UV exposureacross a distribution of timescales.Over the course of 2–3 min, there are minimal changes in
chromatin and cellular topology due to UV light exposure. How-ever, after ∼3 min, the chromatin of some cells exposed to UV lightundergoes rapid, directional increase in heterogeneity that corre-sponds with the formation of micrometer-scale homogeneousdomains (Movie S3 and Fig. 4D). Concurrently, the cytoplasm ofthe cell is transformed, with cell–cell adhesions retracting and aretreating waveform spreading from the cell periphery toward thenucleus. Finally, a near-instantaneous transition occurs within thecytoplasm, with the changes in the cytoplasmic and chromatinnanostructure spontaneously arresting 20 min after exposure. Tocapture these temporal dynamics in nanostructure, we performeda kymograph analysis using ImageJ of a representative cell ex-posed to UV light in comparison with a control cell. As is shown inFig. 5A, over the 30 min of exposure to UV, micrometer-scalehomogeneous domains form within the nucleus and the temporalevolution of nanostructure ceases. In comparison, control cellsdisplay continuous transformation, with homogeneous and het-erogeneous domains transiently forming and dissipating over thetime frame of a few minutes (Fig. 5B). As is shown in Fig. 5C, theformation of these large, homogeneous domains that lack higher-order structure dominate, resulting in an overall decrease in
P
(average decrease at 30 min of 26.9% calculated from 19 nucleifrom three independent experiments). Interestingly, even undercontrol conditions, some cells rapidly demonstrate global changesin their chromatin topology, possibly due to intrinsic molecularvariations or due to differential sensitivity to light exposure. De-spite these rapid alterations, the overall chromatin structure of thepopulation displays minimal changes over the course of 30 min(average 0.2% decrease in
Pfrom 32 nuclei from two indepen-
dent experiments; additional control experiments with slower ac-quisition were not included) (Fig. 5C). Given the multimodalnature of the current system, these topological variations can beexamined and any possible light toxicity further minimized by avariety of well-established methods, including spectral filtration atthe illumination source or by using structured illumination.As a final demonstration of the broad utility of live-cell PWS as
a tool for studying the complex relationships between cell functionand chromatin nanoorganization, we studied the effect of alterationof cellular metabolism on higher-order chromatin architecture. The
Fig. 3. Live-cell PWS uniquely detects nanoarchitectural transformationresulting from Hoechst incubation and excitation. (A and B) Live-cell PWS(A) and phase contrast (B) cells preincubation, 15-min postincubation,Hoechst fluorescent image, and after excitation. (C) Change in the auto-correlation function of live-cell PWS intensity. Hoechst transforms chromatininto a more globally heterogeneous structure. Live-cell PWS images arescaled between Σ = 0.01 and 0.065. (All scale bars: 15 μm.)
Almassalha et al. PNAS | Published online October 4, 2016 | E6377
CELL
BIOLO
GY
PNASPL
US
relationship of chromatin structure with mitochondrial functionand metabolism has been a major point of focus in recent years.Studies have shown that the cellular metabolic activity is intimatelylinked to cell replication, tumor formation, DNA damage response,and transcriptional activity (38–41). Therefore, understanding theinterplay between the structural organization of chromatin andmitochondrial function is pivotal to understanding numerous dis-eases. Recent fluorescence microscopy studies have suggested thatimpairment of cellular metabolism induces rapid (<15-min) trans-formation of chromatin (42, 43). However, these studies often re-quire the production of specialized transfection models (H2B-GFP)or the use of DNA-binding dyes such as Hoechst 33342 and, assuch, are limited in their ability to study multiple cell lines and/orover significant periods of time without perturbing the natural cellbehavior (42, 43).To study the link between chromatin structure and mito-
chondrial function, we used the protonophore, carbonyl cyanidem-chlrophenyl hydrazine (CCCP), which is widely used for studiesof mitochondrial function due to its disruption of mitochondrial
membrane potential (ΔΨm). To explore the role of ΔΨm reductionon the immediate transformation of the chromatin nanoarchitecturein live cells, we used two cell lines, HeLa and CHO. Followingaddition of 10 μM CCCP, HeLa cells rapidly lost ΔΨm, whereasCHO cells displayed no significant change as gauged by tetrame-thylrhodamine (TMRE) fluorescence (Fig. 6A). Interestingly, after15 min of treatment with CCCP, we found that addition of 10 μMCCCP produced rapid transformation of chromatin structure inHeLa cells but not in CHO cells (Fig. 6B). Critically, in HeLa cells,we observed a decrease in nuclear Σ suggesting homogenizationand decompaction in the chromatin structure. Conversely, in CHOcells, we observed no statistical change in chromatin compactionand heterogeneity (Fig. 6C). Quantitatively, HeLa nuclei showed a10% decrease in mean-nuclear Σ after CCCP (value of P < 0.001;n = 31 from six independent experiments), whereas the CHO cellsdisplayed no significant increase in mean-nuclear Σ (n = 159 cellsfrom five independent experiments) (Fig. 6D). This transformationsuggests that the depletion of mitochondrial membrane potentialinduces rapid decompaction and homogenization of chromatinnanostructure. Disruption of the ΔΨm has numerous effects, in-cluding the inhibition of mitochondrial ATP synthesis, changes inthe production of reactive oxygen species, altered signal trans-duction, as well as modification of other mitochondrially producedmetabolites (i.e., acetyl and methyl transfer groups). Althoughprevious groups have shown that Ψm is an important determinantof cellular proliferation, to date it has not been shown that loss ofΨm has a rapid effect on the global chromatin structure. These
Fig. 4. Live-cell PWS detects dynamics of nanoarchitectural transformationunder normal and UV-irradiated conditions. (A) Representative field of viewdisplaying seven HeLa cells imaged in ∼15 s using a 63× oil-immersion lens,N.A. = 1.4, with Σ scaled to range between 0.01 and 0.065 over 30 min ofimaging. (B) Representative field of view displaying seven HeLa cells exposedcontinuously to UV light imaged in ∼22 s using a 63× oil-immersion lens,N.A. = 1.4, with Σ scaled to range between 0.01 and 0.065 over 30 min ofimaging. (C ) Inset from field of view in A showing the time evolution oftwo nuclei. Interestingly, chromatin organization is rapidly evolving intime, showing that, even at steady state, the underlying structurechanges. (D) Inset from field of view in B showing the time evolution ofone nucleus under UV illumination. Under UV exposure, homogeneousmicrometer-scale domains form within chromatin, lacking their originalhigher-order structure. Arrows indicate representative nuclei.
Fig. 5. Live-cell PWS detects dynamics of nanoarchitectural transformationunder normal and UV-irradiated conditions. (A) Kymograph (with the x axisrepresenting a linear cross-section in x–y plane and the y axis showing changesover time) representing the temporal evolution of chromatin of a cell exposedto continuous UV light. Interestingly, nanoscopically homogenous, microme-ter-scale domains form within the nucleus after ∼5 min of exposure with anoverall arrest in structural dynamics. (B) Kymograph representing the temporalevolution of chromatin of a cell under normal conditions. Under normalconditions, the nanoscale topology of chromatin is highly dynamic, with con-tinuous transitions in structure occurring throughout the nucleus. (C) Quan-titative analysis of nanoscale structure of chromatin of cells under normalconditions (blue, n = 32 cells from two replicates) and exposed to UV light (red,n = 19 cells from three replicates) for 30 min. Exposure to UV light inducesoverall homogenization of chromatin nanoarchitecture within minutes. Errorbars represent SE. (Scale bar: 5 μm.)
E6378 | www.pnas.org/cgi/doi/10.1073/pnas.1608198113 Almassalha et al.

results show that the change in Ψm rapidly regulates the nanoscaleorganization of chromatin, possibly resulting in the observed de-creased proliferative potential of cells over time.
ConclusionIn summary, we have extended the application of PWS microscopyto the study of temporal dynamics of the cellular nanoarchitecture.Using this technique, we can rapidly quantify the nanomolecularorganization in live eukaryotic cells without the use of exogenouslabels. Applying this technique to studying the topological changeswithin the nucleus, live-cell PWS microscopy predominantlymeasures spatiotemporal changes in the macromolecular assem-blies formed by chromatin because there are no other scaffoldingstructures present within the nucleoplasm of interphase nucleiwithin its sensitivity range. As a result, live-cell PWS demonstratesthat the nanoscale structure of chromatin evolves rapidly withtime, which would significantly transform our understanding of thestructure–function relationship between critical processes andchromatin structure, including DNA repair, replication, and tran-scription. With this technique, we determined that live-cell DNA-binding dyes, such as Hoechst 33342, cause rapid destruction of thehigher-order chromatin structure at timescales (seconds) not previouslyrecognized. Paradoxically, this dye is ubiquitously used for the study of
cell viability and the presence of DNA damage (44). As a result, live-cell PWS is a powerful tool for studying DNA damage/repair and,potentially, chemotherapeutic efficacy in live cells. To demonstrate itspotential for use in this regard, we studied the temporal dynamics ofchromatin during continuous-UV light exposure, showing a transfor-mation in both the temporal and physical properties of the chromatinnanoarchitecture during UV-induced stress.Additionally, we showed that live-cell PWS allows for previously
limited exploration of the factors affecting the chromatin nano-architecture by demonstrating differential responses in chromatinstructure that depend on the mitochondrial membrane potential.In particular, this illustrates that mitochondrial function is inti-mately related to chromatin structure in real time and that live-cellPWS can act as a tool to further investigate the mechanisms ofchromatin–metabolic interactions. Live-cell PWS is a naturalsupplement to superresolution fluorescence techniques, providingquantifiable information about unstained cellular organization toexamine the role of the nanoarchitecture on molecular interactionsin live cells. In the future, we envision that live-cell PWS can beapplied to a broad range of critical studies of structure–function inlive cells, leveraging the multimodal potential in conjunction withexisting SRM to study: (i) the interaction between chromatinstructure and mRNA transport; (ii) the accessibility of euchro-matin and heterochromatin to transcription factors (45–47);(iii) the relationship between chromatin looping, as measured bytechniques such as Hi-C, to the physical chromatin structure (6, 16,48); (iv) why and how higher-order chromatin structure changes incancer (14); (v) the role of nuclear architecture as an epigeneticregulator of gene expression (6, 16, 48); (vi) the effect of metabo-lism on chromatin structure (40, 49); and (vii) the role of chromatindynamics in stem cell development (50, 51).
Materials and MethodsLive-Cell PWS Imaging. Before imaging, media within the Petri dishes wasexchanged with fresh RPMI-1640 media (lacking phenol red pH indicator;purchased from Life Technologies) supplemented with 10% (vol/vol) FBS(Sigma-Aldrich). For DNA fragmentation experiments, live-cell PWS imageswere acquired at room temperature (22 °C) and in trace CO2 (open air) con-ditions for cells subsequently stained with Hoechst 33342. During acquisitionof any time series data (UV and controls, metabolic perturbation), cells weremaintained at physiological conditions for the duration of the experiment. Forimaging, a reference scattering spectra was obtained from an open surface ofthe substrate coverslip immersed in media before any cellular imaging tonormalize the intensity of light scattered for each wavelength at each pixel.We define Σ as the spectral SD of our measured reflectance intensity nor-malized to this reference scattering spectra from the substrate–media in-terface. To account for noise due to high-frequency oscillations produced bythe lamp, we used a low-pass Butterworth filter before calculation of Σ. Forphase contrast imaging, cells were grown and maintained in the same con-ditions as cells used for live-cell PWS, but images were acquired with a 40× airobjective and a transmission illumination beam. Likewise, for wide-field fluo-rescent imaging, cells were grown in the same conditions but preincubatedwith Hoechst 33342 for 15 min before imaging. To study the effects of UVillumination on cellular structure and function, cells were continuously ex-posed to UV light produced from an Xcite 120 LED light source (Excelitas) byremoving the 500-nm long-pass filter from the illumination path (measure-ments were performed in triplicate; n = 19). For Hoechst-induced DNA damageexperiments, significance was determined using Student’s t test with unpaired,unequal variance on nuclear Δ(Σ) between the conditions indicated in theexperiment in both Mathematica, version 10, and Microsoft Excel (Microsoft)with n = 146 for Hoechst-stained HeLa cells from 11 replicates and n = 87 forHoechst-stained CHO cells from 5 replicates. For mitochondrial membranedepletion experiments, significance was determined using a two-tailed, pairedStudent’s t test on nuclear Σ before and after CCCP treatment using MicrosoftExcel (Microsoft) with n = 31 for HeLa cells from six independent experimentsand n = 159 for CHO cells from five independent experiments. Each experi-ment consists of 1–10 independent fields of view for analysis. Sequences ofpseudocolored live-cell PWS images were merged into movies using ImageJ.All pseudocolored live-cell PWS images were produced using Matlab, version2015b, using the Jet color scheme with the ranges indicated in the figurelegend. All cells were purchased fromAmerican Type Culture Collection (ATCC)
Fig. 6. Mitochondrial membrane potential (ΔΨm) is a direct, rapid regulatorof chromatin compaction. (A) Flow cytometry showing a 10-fold decrease inHeLa cell TMRE fluorescence after 10 μM CCCP treatment (P < 0.015) and nosignificant change in CHO cell fluorescence. (B) HeLa and (C) CHO cells be-fore and 15 min after CCCP treatment. (D) Quantification of the nuclearnanoarchitecture change in HeLa and CHO cells before and after treatment(HeLa = 31 cells, six replicates; CHO = 159 cells, five replicates) with SE bars.Depletion of ΔΨm induces decompaction and homogenization of HeLa butnot CHO chromatin. Live-cell PWS images are scaled between Σ = 0.01 and0.065. (All scale bars: 15 μm.) Arrows indicate representative nuclei.
Almassalha et al. PNAS | Published online October 4, 2016 | E6379
CELL
BIOLO
GY
PNASPL
US

unless otherwise noted and imaged in their cell appropriate media supple-mented with 10% (vol/vol) FBS. Human umbilical vein endothelial cells(HUVECs) were purchased from Lonza and grown under cell-appropriatemedia formulation on poly-L-lysine–coated glass imaging dishes.
Colocalization. Fluorescence colocalization of organelle-specific stains with live-cell PWS imaging was performed through manual image alignment of mean-reflectance images produced by live-cell PWS acquisition of unstained cells tothe cells at the time of acquisition. Background intensity was removed usingImageJ with using a rolling average of 50 pixels for nuclei and 75 pixels formitochondria. Threshold intensities for the aligned fluorescence images werethen calculated by FindThreshold function in Mathematica, version 10, usingOtsu’s algorithm. Colocalized images were produced by the binary mapping offluorescent images for each stain, pseudocolored, and scaled by the live-cellPWS
Pintensity.
H2A.X Phosphorylation. Coregistration of live-cell PWS imaging and DNA stranddamage using phospho-histone H2A.X was performed by immunofluorescentstaining on three independent experiments. Cells were fixed for 20 min with4% (wt/vol) paraformaldehyde at room temperature and washed twice withPBS, and a permeabilization/blocking step was performed with 0.1% TritonX-100 in 1%BSA (Sigma-Aldrich) for 20min. Cellswere againwashed twicewithPBS and then incubatedwith Alexa Fluor 488 conjugated to anti-γH2A.X (serine139 residue) rabbit monoclonal antibody (Cell Signaling) for 30 min. Followingincubation with the antibody, cells were imaged using the FITC-EGFP filter onthe live-cell PWS microscope.
Mitochondrial Membrane Potential Perturbation.HeLa and CHO cells were grownand prepared for live-cell imaging as previously described. Cell measurements
for a single field of viewwere sequentially obtained for 3 min before treatmentwith CCCP. HeLa (n = 31 from six independent experiments) and CHO (n = 159from five independent experiments) cells were treated with 10 μM for 15 minand imaged before and after treatment. Mock-treated cells were incubatedwith 0.01% DMSO to account for the effect of DMSO solvent on the cells. Nosignificant changes were observed in the mock-treated cells for either cell line.Mitochondrial membrane potential, ΔΨm, was measured by flow cytometry(BD LSRII at the Northwestern Flow Cytometry Core) for TMRE (purchased fromLife Technologies)-stained cells. In brief, cells were trypsinized and immediatelystained with 50 nM TMRE for 30 min. Cells were washed twice with PBS afterstaining and suspended in 1 mL of PBS. CCCP-treated cells were treated for15min to replicate conditions during live-cell PWS imaging. At least 20,000 cellswere selected by forward- and side-scattering channels for each group, with adouble elimination of doublets from the final analysis. Mean TMRE intensityfrom each replicate population was used for representative comparison be-tween treated and untreated groups.
ACKNOWLEDGMENTS. MDA-MB-231 cells were provided by the O’HalloranLaboratory at Northwestern University Evanston, IL. TEMwas performed at theBiological Imaging Facility at Northwestern University. Flow cytometry wasperformed by the Northwestern University Flow Cytometry Facility, which re-ceived support from National Cancer Institute Grant CA060553. This materialwas based on work supported by a National Science Foundation GraduateResearch Fellowship under Grant DGE-082416; National Science FoundationGrants CBET-1249311 and CBET-1240416; National Institutes of Health (NIH)Grants U54CA193419, R01CA200064, R01CA155284, and R01CA165309; NIHT32 Training Grants T32GM008152 and T32HL076139; and Chicago BiomedicalConsortium Lever Award L-006 for the Chicago Center for Physical ScienceOncology Innovation and Translation.
1. Klar TA, Jakobs S, Dyba M, Egner A, Hell SW (2000) Fluorescence microscopy with
diffraction resolution barrier broken by stimulated emission. Proc Natl Acad Sci USA
97(15):8206–8210.2. Rust MJ, Bates M, Zhuang X (2006) Sub-diffraction-limit imaging by stochastic optical
reconstruction microscopy (STORM). Nat Methods 3(10):793–795.3. Betzig E, et al. (2006) Imaging intracellular fluorescent proteins at nanometer reso-
lution. Science 313(5793):1642–1645.4. Jing C, Cornish VW (2011) Chemical tags for labeling proteins inside living cells. Acc
Chem Res 44(9):784–792.5. Lelek M, et al. (2012) Superresolution imaging of HIV in infected cells with FlAsH-
PALM. Proc Natl Acad Sci USA 109(22):8564–8569.6. Mirny LA (2011) The fractal globule as a model of chromatin architecture in the cell.
Chromosome Res 19(1):37–51.7. Cremer T, et al. (2000) Chromosome territories, interchromatin domain compartment,
and nuclear matrix: An integrated view of the functional nuclear architecture. Crit
Rev Eukaryot Gene Expr 10(2):179–212.8. Eltsov M, Maclellan KM, Maeshima K, Frangakis AS, Dubochet J (2008) Analysis of
cryo-electron microscopy images does not support the existence of 30-nm chromatin
fibers in mitotic chromosomes in situ. Proc Natl Acad Sci USA 105(50):19732–19737.9. Joti Y, et al. (2012) Chromosomes without a 30-nm chromatin fiber. Nucleus 3(5):
404–410.10. Maeshima K, Imai R, Tamura S, Nozaki T (2014) Chromatin as dynamic 10-nm fibers.
Chromosoma 123(3):225–237.11. Boettiger AN, et al. (2016) Super-resolution imaging reveals distinct chromatin fold-
ing for different epigenetic states. Nature 529(7586):418–422.12. Bedin V, Adam RL, de Sá BC, Landman G,Metze K (2010) Fractal dimension of chromatin
is an independent prognostic factor for survival in melanoma. BMC Cancer 10:260.13. Lebedev DV, et al. (2005) Fractal nature of chromatin organization in interphase
chicken erythrocyte nuclei: DNA structure exhibits biphasic fractal properties. FEBS
Lett 579(6):1465–1468.14. Fudenberg G, Getz G, Meyerson M, Mirny LA (2011) High order chromatin architec-
ture shapes the landscape of chromosomal alterations in cancer. Nat Biotechnol
29(12):1109–1113.15. Bancaud A, Lavelle C, Huet S, Ellenberg J (2012) A fractal model for nuclear organiza-
tion: Current evidence and biological implications. Nucleic Acids Res 40(18):8783–8792.16. Lieberman-Aiden E, et al. (2009) Comprehensive mapping of long-range interactions
reveals folding principles of the human genome. Science 326(5950):289–293.17. Dekker J, Marti-Renom MA, Mirny LA (2013) Exploring the three-dimensional organiza-
tion of genomes: Interpreting chromatin interaction data. Nat Rev Genet 14(6):390–403.18. Botta M, Haider S, Leung IXY, Lio P, Mozziconacci J (2010) Intra- and inter-chromo-
somal interactions correlate with CTCF binding genome wide. Mol Syst Biol 6:426.19. Li L, et al. (2015) Widespread rearrangement of 3D chromatin organization underlies
polycomb-mediated stress-induced silencing. Mol Cell 58(2):216–231.20. Hnisz D, et al. (2016) Activation of proto-oncogenes by disruption of chromosome
neighborhoods. Science 351(6280):1454–1458.21. Cherkezyan L, et al. (2014) Nanoscale changes in chromatin organization represent
the initial steps of tumorigenesis: A transmission electron microscopy study. BMC
Cancer 14:189.
22. Cherkezyan L, et al. (2013) Interferometric spectroscopy of scattered light canquantify the statistics of subdiffractional refractive-index fluctuations. Phys Rev Lett111(3):033903.
23. Cherkezyan L, Subramanian H, Backman V (2014) What structural length scales can bedetected by the spectral variance of a microscope image? Opt Lett 39(15):4290–4293.
24. Chandler JE, et al. (April 25, 2016) Colocalization of cellular nanostructure usingconfocal fluorescence and partial wave spectroscopy. J Biophotonics, 10.1002/jbio.201500298.
25. Stypula-Cyrus Y, et al. (2013) HDAC up-regulation in early colon field carcinogenesis isinvolved in cell tumorigenicity through regulation of chromatin structure. PLoS One8(5):e64600.
26. Kim JS, Pradhan P, Backman V, Szleifer I (2011) The influence of chromosome densityvariations on the increase in nuclear disorder strength in carcinogenesis. Phys Biol8(1):015004.
27. Chandler JE, Cherkezyan L, Subramanian H, Backman V (2016) Nanoscale refractiveindex fluctuations detected via sparse spectral microscopy. Biomed Opt Express 7(3):883–893.
28. Rogakou EP, Pilch DR, Orr AH, Ivanova VS, Bonner WM (1998) DNA double-strandedbreaks induce histone H2AX phosphorylation on serine 139. J Biol Chem 273(10):5858–5868.
29. Burma S, Chen BP, Murphy M, Kurimasa A, Chen DJ (2001) ATM phosphorylates his-tone H2AX in response to DNA double-strand breaks. J Biol Chem 276(45):42462–42467.
30. Olive PL (2004) Detection of DNA damage in individual cells by analysis of histoneH2AX phosphorylation. Methods Cell Biol 75:355–373.
31. Banáth JP, Olive PL (2003) Expression of phosphorylated histone H2AX as a surrogateof cell killing by drugs that create DNA double-strand breaks. Cancer Res 63(15):4347–4350.
32. Cohen SM, Lippard SJ (2001) Cisplatin: From DNA damage to cancer chemotherapy.Prog Nucleic Acid Res Mol Biol 67:93–130.
33. Burgess RC, Burman B, Kruhlak MJ, Misteli T (2014) Activation of DNA damage re-sponse signaling by condensed chromatin. Cell Rep 9(5):1703–1717.
34. Johnson SA, You Z, Hunter T (2007) Monitoring ATM kinase activity in living cells.DNA Repair (Amst) 6(9):1277–1284.
35. Beerman TA, et al. (1992) Effects of analogs of the DNA minor groove binder Hoechst33258 on topoisomerase II and I mediated activities. Biochim Biophys Acta 1131(1):53–61.
36. Zhang X, Chen J, Davis B, Kiechle F (1999) Hoechst 33342 induces apoptosis in HL-60cells and inhibits topoisomerase I in vivo. Arch Pathol Lab Med 123(10):921–927.
37. Kruhlak MJ, et al. (2006) Changes in chromatin structure and mobility in living cells atsites of DNA double-strand breaks. J Cell Biol 172(6):823–834.
38. Daugas E, et al. (2000) Mitochondrio-nuclear translocation of AIF in apoptosis andnecrosis. FASEB J 14(5):729–739.
39. Lakhani SA, et al. (2006) Caspases 3 and 7: Key mediators of mitochondrial events ofapoptosis. Science 311(5762):847–851.
40. Martinez-Pastor B, Cosentino C, Mostoslavsky R (2013) A tale of metabolites: Thecross-talk between chromatin and energy metabolism. Cancer Discov 3(5):497–501.
41. Lum JJ, et al. (2007) The transcription factor HIF-1alpha plays a critical role in thegrowth factor-dependent regulation of both aerobic and anaerobic glycolysis. GenesDev 21(9):1037–1049.
E6380 | www.pnas.org/cgi/doi/10.1073/pnas.1608198113 Almassalha et al.

42. Liu XS, Little JB, Yuan ZM (2015) Glycolytic metabolism influences global chromatinstructure. Oncotarget 6(6):4214–4225.
43. Visvanathan A, et al. (2013) Modulation of higher order chromatin conformation inmammalian cell nuclei can be mediated by polyamines and divalent cations. PLoS One8(6):e67689.
44. Tice RR, Hook GG, Donner M, McRee DI, Guy AW (2002) Genotoxicity of radio-frequency signals. I. Investigation of DNA damage and micronuclei induction in cul-tured human blood cells. Bioelectromagnetics 23(2):113–126.
45. Bancaud A, et al. (2009) Molecular crowding affects diffusion and binding of nuclearproteins in heterochromatin and reveals the fractal organization of chromatin. EMBOJ 28(24):3785–3798.
46. Papantonis A, Cook PR (2010) Genome architecture and the role of transcription. CurrOpin Cell Biol 22(3):271–276.
47. Papantonis A, et al. (2010) Active RNA polymerases: Mobile or immobile molecularmachines? PLoS Biol 8(7):e1000419.
48. Williamson I, et al. (2014) Spatial genome organization: Contrasting views fromchromosome conformation capture and fluorescence in situ hybridization. Genes Dev28(24):2778–2791.
49. Katada S, Imhof A, Sassone-Corsi P (2012) Connecting threads: Epigenetics and me-tabolism. Cell 148(1-2):24–28.
50. Azuara V, et al. (2006) Chromatin signatures of pluripotent cell lines. Nat Cell Biol
8(5):532–538.51. Hajkova P, et al. (2008) Chromatin dynamics during epigenetic reprogramming in the
mouse germ line. Nature 452(7189):877–881.52. Taflove A, Hagness SC (2005) Computational Electrodynamics (Artech House, Boston).53. Capoglu _IR, Rogers JD, Taflove A, Backman V (2012) The microscope in a computer:
Image synthesis from three-dimensional full-vector solutions of Maxwell’s equa-
tions at the nanometer scale. Progress in Optics, ed Wolf E (Elsevier, Amsterdam),
Vol 57, Chap 1.54. Capoglu IR, Taflove A, Backman V (2013) Angora: A free software package for finite-
difference time-domain electromagnetic simulation. IEEE Antennas Propag Mag 55(4):
80–93.55. Liang X, Liu A, Lim C, Ayi T, Yap P (2007) Determining refractive index of single living
cell using an integrated microchip. Sens Actuators A Phys 133(2):349–354.56. Schmitt JM, Kumar G (1998) Optical scattering properties of soft tissue: A discrete
particle model. Appl Opt 37(13):2788–2797.57. Khintchine A (1934) Korrelationstheorie der stationären stochastischen Prozesse.
Math Ann 109(1):604–615.58. Wiener N (1930) Generalized harmonic analysis. Acta Math-Djursholm 55(1):117–258.
Almassalha et al. PNAS | Published online October 4, 2016 | E6381
CELL
BIOLO
GY
PNASPL
US