Embed Size (px)
Citation preview
Proceedings of 25th ITTC – Volume II
473
Specialist Committee on Cavitation
Final Report and Recommendations to the 25th ITTC
1 INTRODUCTION
1.1 Membership and Meetings
The 24th ITTC appointed the following members to serve on the Specialist Committee on Cavitation:
• Laurence Briançon-Marjollet (Chair), Bassin d’Essais des Carènes, France;
• Bong Jun Chang, Hyundai Maritime Re-search Institute, South Korea;
• Scott Gowing, Naval Surface Warfare Center, United States;
• Jan Hallander, SSPA, Sweden; • Christian Johannsen, Hamburg Ship
Model Basin, Germany; • Takafumi Kawamura, University of Tokyo,
Japan; • Mohammad Saeed Seif, Sarif University
of Technology, Iran; • Erik van Wijngaarden, Maritime Research
Institute Netherlands, The Netherlands; and
• William Zierke (Secretary), Applied Re-search Laboratory, The Pennsylvania State University, United States.
Mahammad Saeed Seif was unable to take part in the work of the committee. To aid the committee, Randy Riesterer of the Applied Re-search Laboratory at The Pennsylvania State University created the web site for the commit-tee’s cavitation survey and for the exchange of technical documents.
In performing their work, the committee held four meetings:
• Val-de-Reuil, France at the Bassin d’Essais des Carènes on January 17-18, 2006;
• Wageningen, The Netherlands near the Maritime Research Institute Netherlands on September 15-16, 2006 (following the International Symposium on Cavitation, CAV2006);
• Göteborg, Sweden at the SSPA on April 23-24, 2007; and
• Washington, D. C., United States at the Naval Surface Warfare Center on Novem-ber 7-9, 2007.
1.2 Recommendations of the 24th ITTC
The 24th ITTC recommended that the Spe-cialist Committee on Cavitation for the 25th ITTC address the following technology areas:
(1) Review the application of computa-tional methods and new experimental methods to the prediction of cavitation, including cavitation dynamics and its influence on pressure fluctuations.
(2) Review advances in multiphase flow modeling of cavitation and its potential to predict inception, erosion, and in-duced pressure fluctuations.
(3) Review methods and develop guide-lines for the prediction of cavitation and erosion damage for unconventional rud-ders or rudders behind highly-loaded propellers.
(4) Review methods of modeling the cavi-tation behavior of waterjets (inlets and pumps), including scale effects. De-

Specialist Committee on Cavitation
474
velop guidelines or procedures. Liaise with the Propulsion Committee.
2 CAVITATION SURVEY
The 25th ITTC Specialist Committee on Cavitation has been tasked to determine the status of cavitation modeling—with specific questions related to multiphase flow modeling, rudders, and waterjets. In order to fairly ad-dress the state of the art of cavitation modeling, the committee wanted to survey the opinions of the worldwide cavitation community. The committee developed survey questions in the following areas:
• Background Information, • Cavitation Modeling Capability, • Cavitation Experimental Capability, • Rudder Cavitation, • Waterjet Cavitation, and • Summary Information.
2.1 Survey: Background Information
In June of 2006, the committee sent e-mail messages to 179 organizations—including ITTC members and other specifically-identified organizations who deal with cavita-tion—which asked them to go to a web site es-tablished by the committee and answer as many of the survey questions as they felt able to complete. 29 organizations from 14 coun-tries completed the survey—with responses from Australia, China, Finland, France, Ger-many, Italy, Japan, The Netherlands, Poland, Russia, South Korea, Sweden, Turkey, and the United States.
2.2 Survey: Cavitation Modeling Capability
All but one of the responding organizations perform numerical and/or empirical modeling to predict cavitation performance. In the survey, the committee asked these organizations to quantify the accuracy of certain modeling techniques to predict various types of cavita-tion phenomena. In general, the responses indi-
cated that the field of cavitation modeling is still not in a fully-matured stage of develop-ment, no matter which modeling technique is used. The empirical and potential-flow meth-ods seem to have reached the stage where the accuracy is reasonable enough for trade-off studies, perhaps with the exception of predict-ing cavitation noise and cavitation erosion. The responding organizations rank the maturity of computational fluid dynamics (CFD) codes to be somewhat lower. Again, they feel that pre-dicting cavitation erosion is the most difficult task.
Clearly, the organizations that develop CFD codes had more faith in the absolute accu-racy of these types of codes than the organiza-tions who are only CFD users. In general, the responding groups already feel that the CFD codes offer a good alternative to boundary-element codes. However, for all of the model-ing methods, the survey indicated a large scat-ter in the judgment of the accuracy for cavita-tion predictions—which is not surprising, given the very limited availability of quantita-tive validation data.
For trade-off studies and scaling, all of the responding organizations utilize empirical modeling, based on both model-scale and full-scale test results—as well as theoretical formu-lations. For instance, empirical models for the inception of vortex cavitation are based on some modified form of the formula developed by McCormick (1962). Other empirical models attempt to account for nuclei population, ther-modynamic effects, bubble interactions, pres-sure fluctuations, cavitation thrust breakdown, cavitation erosion, and cavitation noise. Some groups use a combination of empirical models and viscous CFD computations.
Most of the responding organizations util-ize potential-flow methods, primarily for sheet cavitation. These groups used a mixture of their own codes, developed by other groups, and modified codes.
Sixteen of the 29 responding organizations that perform cavitation modeling, use commer-cial CFD software. For single-phase flow,

Proceedings of 25th ITTC – Volume II
475
many groups mentioned the use of commercial CFD codes for surface cavitation inception. The majority of the organizations that use commercial CFD codes mentioned that they use these codes with multiphase flow models, although a couple of groups linked these codes with models not available in the commercial CFD codes themselves. Some of the organiza-tions mentioned success in predicting devel-oped surface cavitation and cavitation thrust breakdown. However, little success was men-tioned in predicting other cavitation phenom-ena. Finally, some of the groups mentioned the need for improved convergence time, robust-ness, and the resolution of the boundary be-tween cavities and the water.
Seven of the responding organizations ei-ther develop their own CFD codes or use uni-versity-developed codes. These groups also develop their own multiphase flow models. The use of large-eddy simulation (LES) or de-tached-eddy simulation (DES) was also dis-cussed to better resolve turbulent structures within the flow. Some groups use some mix-ture of CFD codes and potential-flow codes.
Clearly, many of the responding organiza-tions feel that the use of CFD with multiphase flow modeling is important for cavitation pre-dictions. While some of these computations are already becoming practical, the responding or-ganizations felt that the use of CFD for other predictions—such as cavitation erosion, higher-order pressure pulses, and noise—will take several years.
2.3 Survey: Cavitation Experimental Capability
Most of the organizations that responded to the survey answered questions regarding their cavitation experimental capability, with 22 of the 29 organizations responding to at least some portions of this section of the survey. For the questions asking for comments or addi-tional information, most of the organizations only provided short answers, and they mainly focused on the technical data (such as the size)
of their facilities. Thus, the responding organi-zations provided very little information regard-ing new experimental techniques or new meas-uring equipment.
Of the responding organizations that per-form cavitation experiments, all but one group utilizes a closed-jet-type of cavitation tunnel. Two groups use free-surface tunnels, while two other groups use depressurized towing tanks. For wake simulations during cavitation testing, the bigger facilities use full models, while the smaller facilities use dummy models or wire screens. When performing cavitation-inception tests, seventeen organizations simply use visual observation, while eight groups use video equipment, and eight groups use acoustic methods to determine inception.
To establish the water-quality conditions prior to cavitation-inception testing, nineteen of the responding organizations measure the gas-content level, with six of these groups us-ing some device to measure the oxygen content, and four groups specifically responding that they used a van Slyke type of measuring device. Only six organizations stated that they meas-ured the nuclei distribution—including just one large facility, two research facilities, two facili-ties where the method is under development, and one consultant group.
2.4 Survey: Rudder Cavitation
Only fifteen of the organizations that re-sponded to the survey addressed the section on rudder cavitation. Nevertheless, of the fourteen groups that perform rudder cavitation tests, most of those organizations perform those tests with a rudder installed behind a propeller and acting in a non-uniform inflow. Depending on the capabilities of the organization, this non-uniformity is generated by wire screens of in-dividually-adjusted mesh width, by dummy bodies, or by complete ship models. Only 17% of the responding organizations indicated the performance of rudder cavitation tests without any wake simulation.

Specialist Committee on Cavitation
476
The answers regarding the testing methods for cavitation assessment were even more uni-form. 75% of the organizations rely on visual observation of the cavitation. Half of the or-ganizations perform paint tests to judge the erosiveness of the cavitation, but almost all these groups only perform these paint tests as an addition to the visual observation. The reli-ability of this paint method may not be re-garded as the best, primarily due to low local Reynolds numbers and the differing materials used for rudder models. The same holds for the use of high-speed video techniques—where 42% of the organizations use this special ob-servation technique, but only to support the conventional visual assessment. This might be due to the lack of sufficient experience with the special kind of pictures gathered from high-speed cameras.
Most institutes with full-scale ship experi-ence answered that almost all rudder cavitation phenomena (gap, sheet, and/or vortex cavita-tion), as well as the range of rudder angles where they occur, are under-predicted from the model test. Just a few organizations consider these values as similar, and no organization an-swered that these phenomena are over-predicted.
Twelve organizations responded to ques-tions on modeling rudder cavitation. Most of these groups do not yet actively use viscous computational methods, in comparison with empirical and potential-flow methods. The use of multiphase-flow simulations to predict the unsteady cavitation behavior is rarely applied in the design stage.
Half of the responding organizations per-form calculations for the rudder alone, but they use model testing or previous numerical com-putations to first obtain the flow downstream of the propeller and upstream of the rudder. The other groups consider the interaction between the propeller and the rudder in a single compu-tation.
Two-thirds of the organizations design rud-ders based on the pressure distribution pre-dicted without an analysis of the cavitation be-havior. These groups do not regard the predic-tion of the cavitation behavior as relatively economic at the current time. Similarly, only two organizations even attempt to model cavi-tation erosion, probably because the physical mechanisms for erosion are still not clear.
2.5 Survey: Waterjet Cavitation
Not many organizations responded to the portion of the survey on waterjet cavitation. Of the 29 organizations that responded to the sur-vey, only 11 organizations provided any input on waterjet cavitation—with nine organizations responding to the questions on experimental investigations, seven organizations responding to questions on modeling, and five organiza-tions responding to both categories.
Regarding the experimental investigation of waterjet cavitation, the nine responding organi-zations all ran a variety of tests. Some reported on pump-loop testing to evaluate the waterjet pump alone—particularly for cavitation break-down, but also with some flow-field measure-ments. More organizations reported on waterjet system tests, or on tests with the waterjet inlet alone. Most of the organizations simply pro-vided very limited (or no) details. Only one waterjet manufacturer responded to the survey, and they clearly performed the most tests with the most types of measurements. For instance, they were the only responding organization who reported performing cavitation erosion tests. Most of the organizations reported on specialized tests—involving, for instance, de-tailed flow-field measurements, bubble-augmented waterjets, and totally-immersed wa-terjets integrated into a hydrofoil.
Six of the seven organizations that provided information regarding cavitation modeling for waterjets reported on the use of CFD to solve for the viscous flow field. These methods were used primarily to address cavitation incep-tion—where some of the organizations also

Proceedings of 25th ITTC – Volume II
477
used empirical methods, potential-flow meth-ods, and combined methods. One organization reported the use of a Burrill-like chart as an empirical method to model cavitation break-down. The organization that did not report on using viscous CFD methods responded on the use of empirical methods for cavitation incep-tion, breakdown, pressure fluctuations, vibra-tion, and noise. Finally, only two organizations responded on the use of multiphase flow CFD methods: one for computing cavitation break-down, and one for computing bubble behavior.
2.6 Survey: Summary Information
To complete the cavitation survey, the committee asked the various organizations to provide their view on the future of cavitation modeling—and to give them the opportunity to provide the committee with papers or reports that they felt were relevant to this investigation. Of the 29 organizations that responded to the survey, 16 organizations responded to the final summary question—and only three organiza-tions uploaded any papers or reports.
A few of the responding organizations are currently working to couple their traditional potential-flow (or boundary-element) methods with more advanced methods in CFD, primar-ily viscous-flow solvers of the Reynolds-averaged Navier-Stokes (RANS) equations. However, several groups felt that the use of potential-flow methods for cavitation modeling would vanish in the next decade. Some of the responding organizations focused on the use of multiphase flow modeling in the context of a RANS formulation—primarily when address-ing the prediction of bubble cavitation, cloud cavitation, and the interaction between the bubble dynamics and the flow field. They also mentioned the importance of understanding nuclei effects, and they stressed the use of these methods to better understand and predict scale effects.
Other responding organizations focused on the need to improve the modeling of unsteady cavitation—particularly to address cavitation
inception, vortex cavitation, and cavitation ero-sion. These organizations mentioned unsteady RANS solvers, LES, and DES as promising methods for future modeling of unsteady cavi-tation. One responder also mentioned the pos-sible need to model fluid/structure interactions. Depending on the cavitation problem that one needs to address, various cavitation modeling approaches will be used in the future, depend-ing on both the physics of the problem and the available resources.
Even though most of the responding or-ganizations that answered the final summary question focused on numerical cavitation mod-eling, a few responders felt strongly that model-scale testing still offers the best current method to model cavitation. In particular, they stressed the importance of using modern facili-ties to control and measure nuclei, using high-speed video, investigating basic cavitation and turbulence physics, measuring cavitation ero-sion, and using standard testing procedures. However, these responders did not disregard the use of numerical cavitation modeling. In-stead, they advocated a more systematic ap-proach of coupling experimental and computa-tional models, especially the experimental vali-dation of the computational models.
3 CAVITATION MODELING
The prediction of cavitation phenomena and the cavitation performance of marine vehi-cles and propulsors can involve either compu-tational or experimental modeling methods. As summarized in the survey of the worldwide cavitation community, experts advocate the use of both computational and experimental meth-ods, especially in providing experimental vali-dation of computational simulations.
Verification and validation of computa-tional simulations are the primary methods for building confidence in the simulations and quantifying this confidence. Oberkampf et al. (2004) provided a very objective and extensive description of verification, validation, and the predictive capability of all types of computa-
Specialist Committee on Cavitation
478
tional models. They describe verification as the assessment of the accuracy of the solution to a computational model, primarily by comparison with known analytical solutions. They describe validation as the assessment of the accuracy of the computational simulation by comparison with experimental data. Verification has no is-sue with relating the simulation to the real world—while for validation, the relationship between the computation and the real world is the issue.
Oberkampf et al. (2004) also state that veri-fication and validation are ongoing activities that do not have a clearly defined completion point, primarily since computational models cannot be demonstrated for all possible appli-cations and code options. They describe fun-damental strategies for both verification and validation. Note that the validation strategy does not assume that the experimental meas-urements are more accurate than the computa-tional results. The strategy only asserts that ex-perimental measurements are the more faithful reflection of reality for the purposes of valida-tion. For both verification and validation strategies, they discuss at length such familiar accuracy topics as the numerical algorithm, grid quality, boundary conditions, convergence, and experimental uncertainty.
In the following sections of this report, the 25th ITTC Specialist Committee on Cavitation will examine current cavitation modeling used by organizations to impact design, as well as the state-of-the-art of multiphase flow cavita-tion modeling. Then, the committee shows how organizations are using these varied cavitation modeling methods to address cavitation issues on rudders and within waterjets.
Before proceeding, the committee will de-fine the primary parameter used to quantify or categorize cavitation performance—namely, the cavitation number (or cavitation index),
2.1
2
ref vp p
Vσ
ρ ∞
−= (3.1)
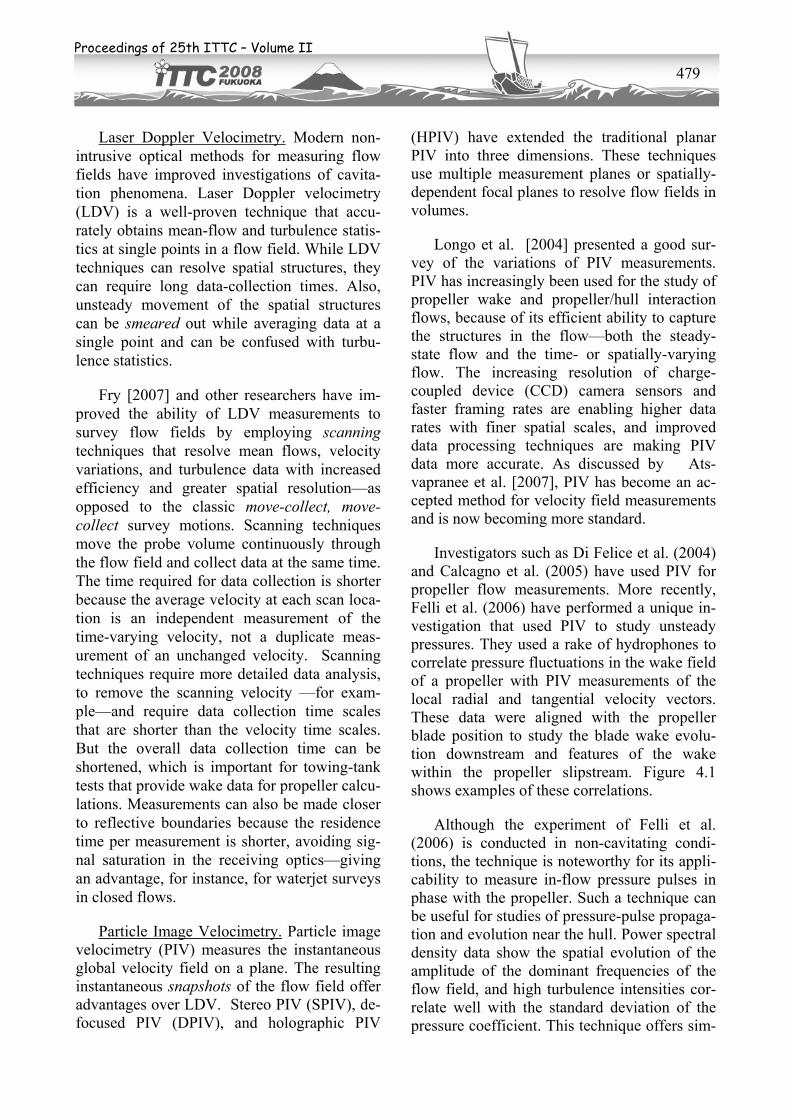
In this equation, refp is a reference static pres-sure, vp is the vapor pressure (usually at the bulk temperature of the fluid), ρ is the fluid density, and ∞V is the freestream velocity (which is usually the ship speed, shipV ). De-fined similar to a static-pressure coefficient, one can essentially think of the cavitation num-ber as the fluid’s reserve of static pressure be-fore cavitation. As long as this reserve is greater than any drop in the local static-pressure coefficient, no cavitation will occur.
4 CURRENT CAVITATION MODELING METHODS
In reviewing the varied cavitation predic-tion methods, the 25th ITTC Specialist Com-mittee on Cavitation began by examining new experimental methods that organizations have employed to investigate cavitation phenomena. Following this experimental review, the com-mittee examined computational methods that organizations are currently using to impact de-sign—methods that include empirical methods, potential-flow methods, and RANS solvers without multiphase flow models. The review of these modeling methods is representative of current methods used by many organizations, but it is by no means exhaustive.
4.1 Experimental Techniques
Much of the recent development of experi-mental methods involves non-intrusive optical techniques for velocity measurements—which impact cavitation modeling, even for measure-ments in non-cavitating flow fields, such as propeller flows upstream of rudders. Some acoustic methods have also become popular for velocity measurements, but these are typically limited to hull flows or boundary-layer meas-urements in ship motion tests. Additional im-provements of experimental techniques that impact cavitation modeling include photogra-phy and video measurements, unsteady pres-sure measurements, nuclei measurements, and cavitation erosion measurements.
Proceedings of 25th ITTC – Volume II
479
Laser Doppler Velocimetry. Modern non-intrusive optical methods for measuring flow fields have improved investigations of cavita-tion phenomena. Laser Doppler velocimetry (LDV) is a well-proven technique that accu-rately obtains mean-flow and turbulence statis-tics at single points in a flow field. While LDV techniques can resolve spatial structures, they can require long data-collection times. Also, unsteady movement of the spatial structures can be smeared out while averaging data at a single point and can be confused with turbu-lence statistics.
Fry [2007] and other researchers have im-proved the ability of LDV measurements to survey flow fields by employing scanning techniques that resolve mean flows, velocity variations, and turbulence data with increased efficiency and greater spatial resolution—as opposed to the classic move-collect, move-collect survey motions. Scanning techniques move the probe volume continuously through the flow field and collect data at the same time. The time required for data collection is shorter because the average velocity at each scan loca-tion is an independent measurement of the time-varying velocity, not a duplicate meas-urement of an unchanged velocity. Scanning techniques require more detailed data analysis, to remove the scanning velocity —for exam-ple—and require data collection time scales that are shorter than the velocity time scales. But the overall data collection time can be shortened, which is important for towing-tank tests that provide wake data for propeller calcu-lations. Measurements can also be made closer to reflective boundaries because the residence time per measurement is shorter, avoiding sig-nal saturation in the receiving optics—giving an advantage, for instance, for waterjet surveys in closed flows.
Particle Image Velocimetry. Particle image velocimetry (PIV) measures the instantaneous global velocity field on a plane. The resulting instantaneous snapshots of the flow field offer advantages over LDV. Stereo PIV (SPIV), de-focused PIV (DPIV), and holographic PIV
(HPIV) have extended the traditional planar PIV into three dimensions. These techniques use multiple measurement planes or spatially-dependent focal planes to resolve flow fields in volumes.
Longo et al. [2004] presented a good sur-vey of the variations of PIV measurements. PIV has increasingly been used for the study of propeller wake and propeller/hull interaction flows, because of its efficient ability to capture the structures in the flow—both the steady-state flow and the time- or spatially-varying flow. The increasing resolution of charge-coupled device (CCD) camera sensors and faster framing rates are enabling higher data rates with finer spatial scales, and improved data processing techniques are making PIV data more accurate. As discussed by Ats-vapranee et al. [2007], PIV has become an ac-cepted method for velocity field measurements and is now becoming more standard.
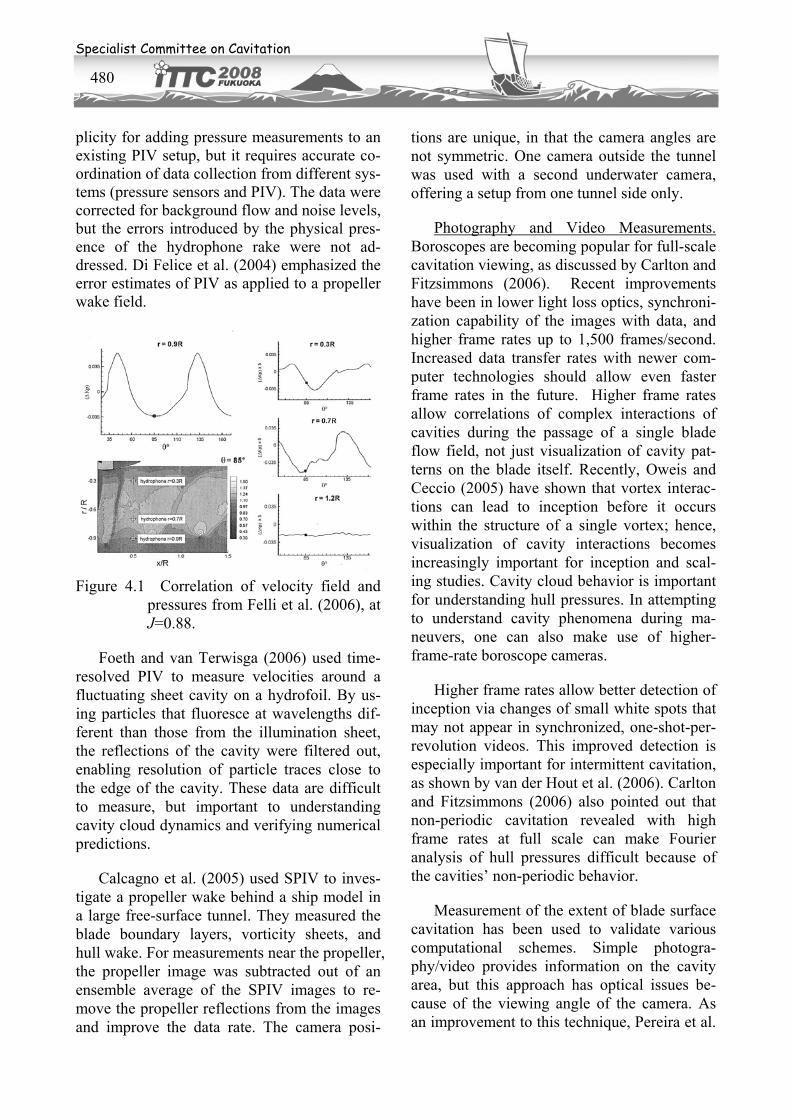
Investigators such as Di Felice et al. (2004) and Calcagno et al. (2005) have used PIV for propeller flow measurements. More recently, Felli et al. (2006) have performed a unique in-vestigation that used PIV to study unsteady pressures. They used a rake of hydrophones to correlate pressure fluctuations in the wake field of a propeller with PIV measurements of the local radial and tangential velocity vectors. These data were aligned with the propeller blade position to study the blade wake evolu-tion downstream and features of the wake within the propeller slipstream. Figure 4.1 shows examples of these correlations.
Although the experiment of Felli et al. (2006) is conducted in non-cavitating condi-tions, the technique is noteworthy for its appli-cability to measure in-flow pressure pulses in phase with the propeller. Such a technique can be useful for studies of pressure-pulse propaga-tion and evolution near the hull. Power spectral density data show the spatial evolution of the amplitude of the dominant frequencies of the flow field, and high turbulence intensities cor-relate well with the standard deviation of the pressure coefficient. This technique offers sim-
Specialist Committee on Cavitation
480
plicity for adding pressure measurements to an existing PIV setup, but it requires accurate co-ordination of data collection from different sys-tems (pressure sensors and PIV). The data were corrected for background flow and noise levels, but the errors introduced by the physical pres-ence of the hydrophone rake were not ad-dressed. Di Felice et al. (2004) emphasized the error estimates of PIV as applied to a propeller wake field.
Figure 4.1 Correlation of velocity field and
pressures from Felli et al. (2006), at J=0.88.
Foeth and van Terwisga (2006) used time-resolved PIV to measure velocities around a fluctuating sheet cavity on a hydrofoil. By us-ing particles that fluoresce at wavelengths dif-ferent than those from the illumination sheet, the reflections of the cavity were filtered out, enabling resolution of particle traces close to the edge of the cavity. These data are difficult to measure, but important to understanding cavity cloud dynamics and verifying numerical predictions.
Calcagno et al. (2005) used SPIV to inves-tigate a propeller wake behind a ship model in a large free-surface tunnel. They measured the blade boundary layers, vorticity sheets, and hull wake. For measurements near the propeller, the propeller image was subtracted out of an ensemble average of the SPIV images to re-move the propeller reflections from the images and improve the data rate. The camera posi-
tions are unique, in that the camera angles are not symmetric. One camera outside the tunnel was used with a second underwater camera, offering a setup from one tunnel side only.
Photography and Video Measurements. Boroscopes are becoming popular for full-scale cavitation viewing, as discussed by Carlton and Fitzsimmons (2006). Recent improvements have been in lower light loss optics, synchroni-zation capability of the images with data, and higher frame rates up to 1,500 frames/second. Increased data transfer rates with newer com-puter technologies should allow even faster frame rates in the future. Higher frame rates allow correlations of complex interactions of cavities during the passage of a single blade flow field, not just visualization of cavity pat-terns on the blade itself. Recently, Oweis and Ceccio (2005) have shown that vortex interac-tions can lead to inception before it occurs within the structure of a single vortex; hence, visualization of cavity interactions becomes increasingly important for inception and scal-ing studies. Cavity cloud behavior is important for understanding hull pressures. In attempting to understand cavity phenomena during ma-neuvers, one can also make use of higher-frame-rate boroscope cameras.
Higher frame rates allow better detection of inception via changes of small white spots that may not appear in synchronized, one-shot-per-revolution videos. This improved detection is especially important for intermittent cavitation, as shown by van der Hout et al. (2006). Carlton and Fitzsimmons (2006) also pointed out that non-periodic cavitation revealed with high frame rates at full scale can make Fourier analysis of hull pressures difficult because of the cavities’ non-periodic behavior.
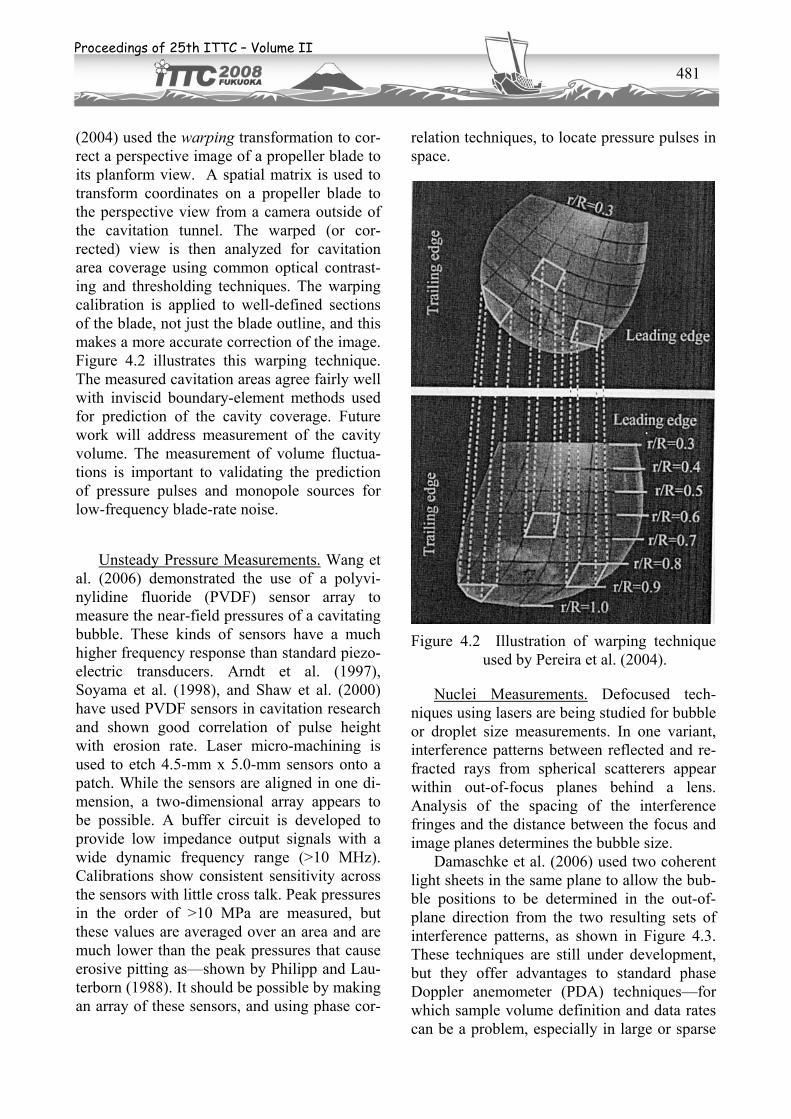
Measurement of the extent of blade surface cavitation has been used to validate various computational schemes. Simple photogra-phy/video provides information on the cavity area, but this approach has optical issues be-cause of the viewing angle of the camera. As an improvement to this technique, Pereira et al.
Proceedings of 25th ITTC – Volume II
481
(2004) used the warping transformation to cor-rect a perspective image of a propeller blade to its planform view. A spatial matrix is used to transform coordinates on a propeller blade to the perspective view from a camera outside of the cavitation tunnel. The warped (or cor-rected) view is then analyzed for cavitation area coverage using common optical contrast-ing and thresholding techniques. The warping calibration is applied to well-defined sections of the blade, not just the blade outline, and this makes a more accurate correction of the image. Figure 4.2 illustrates this warping technique. The measured cavitation areas agree fairly well with inviscid boundary-element methods used for prediction of the cavity coverage. Future work will address measurement of the cavity volume. The measurement of volume fluctua-tions is important to validating the prediction of pressure pulses and monopole sources for low-frequency blade-rate noise.
Unsteady Pressure Measurements. Wang et al. (2006) demonstrated the use of a polyvi-nylidine fluoride (PVDF) sensor array to measure the near-field pressures of a cavitating bubble. These kinds of sensors have a much higher frequency response than standard piezo-electric transducers. Arndt et al. (1997), Soyama et al. (1998), and Shaw et al. (2000) have used PVDF sensors in cavitation research and shown good correlation of pulse height with erosion rate. Laser micro-machining is used to etch 4.5-mm x 5.0-mm sensors onto a patch. While the sensors are aligned in one di-mension, a two-dimensional array appears to be possible. A buffer circuit is developed to provide low impedance output signals with a wide dynamic frequency range (>10 MHz). Calibrations show consistent sensitivity across the sensors with little cross talk. Peak pressures in the order of >10 MPa are measured, but these values are averaged over an area and are much lower than the peak pressures that cause erosive pitting as—shown by Philipp and Lau-terborn (1988). It should be possible by making an array of these sensors, and using phase cor-
relation techniques, to locate pressure pulses in space.
Figure 4.2 Illustration of warping technique
used by Pereira et al. (2004).
Nuclei Measurements. Defocused tech-niques using lasers are being studied for bubble or droplet size measurements. In one variant, interference patterns between reflected and re-fracted rays from spherical scatterers appear within out-of-focus planes behind a lens. Analysis of the spacing of the interference fringes and the distance between the focus and image planes determines the bubble size.
Damaschke et al. (2006) used two coherent light sheets in the same plane to allow the bub-ble positions to be determined in the out-of-plane direction from the two resulting sets of interference patterns, as shown in Figure 4.3. These techniques are still under development, but they offer advantages to standard phase Doppler anemometer (PDA) techniques—for which sample volume definition and data rates can be a problem, especially in large or sparse

Specialist Committee on Cavitation
482
particle fields. The analyzed images must be bubbles, however, because interference is re-quired from the reflected and refracted rays.
Figure 4.3 Schematic of the interferometric-
bubble-sizing method of Dam-aschke et al. (2005).
Palero et al. (2005) adapted the defocused technique by using two laser sheets to produce two first-surface reflections that discriminate spherical from non-spherical scatterers, where they assumed that the spherical scatterers were bubbles. Holographic PIV can also use inter-ference patterns within out-of-focus planes for bubble sizing, or simply discriminating bubbles from particles by resolving the two specular reflections for bubbles. Straightforward optical examination at high magnification can still be used, but this method places demands on the resolution of the system.
Researchers have recently adopted acoustic techniques for nuclei measurements—non-intrusive techniques which interact only with bubbles. In conjunction with this type of tech-nique, Chahine and Kalumuck (2003) devel-oped inverse scattering algorithms that use pulse signals to provide bubble sizes and con-centrations.
Cavitation Erosion Measurements. Erosion measurements are made using a variety of techniques. The classical pit-count-rate method evaluates surface erosion and can be used to rank different materials for erosion resistance or rank cavitation intensities for the same mate-rial. Optical profiling of the pits has been used to extend this method for estimates of the lost volume of material. Patella et al. (2000) used laser profiling to map the surface contour of erosion pits. Bachert et al. (2005) used a rotat-ing disc with holes to create erosive cavitation on copper samples. A novel white light inter-
ferometry technique measured the depth pro-files of eroded areas, and the resultant volumes compared well to a direct mass loss measure-ment. The results also showed qualitative agreement with pit counts using CCD cameras. Escaler et al. (2007) have shown good correla-tion of acceleration impulse with pit rate for unsteady cloud and sheet cavitation. The accel-erometer signals are band-passed filtered at the modulated frequency of the cavity cloud col-lapse, and the resultant signal levels are well-correlated with pitting rate.
4.2 Computational Prediction Methods
Along with experimental methods, most or-ganizations also use different computational methods to predict cavitation performance. These computational methods include empiri-cal methods, potential-flow methods, and RANS solvers without multiphase flow models. The use of RANS solvers with multiphase flow models will be discussed in Section 5 of this report.
Empirical Methods. The cavitation survey showed that some organizations feel that cavi-tation is still primarily an experimental disci-pline, where testing still offers the best current modeling method. Thus, experimentalists have acquired a large amount of cavitation data, at different scales, and used these data in con-junction with theoretical formulations to de-velop empirical methods to model cavitation. These methods are still indispensable for de-signers to account for the effects of cavitation, especially at early stages of a design.
As mentioned in response to the cavitation survey, many organizations use empirical mod-els for the inception of vortex cavitation which are based on some modified form of the for-mula developed by McCormick (1962). For instance, Shen et al. (2001) applied a log law to vary the thickness of the boundary-layer thick-ness with Reynolds number—and the resulting scaling exponent is dependent on the Reynolds numbers of the model and prototype scales.

Proceedings of 25th ITTC – Volume II
483
Burrill (1943) and Burrill and Emerson (1963) developed the Burrill chart as an em-pirical method to assess the tendency of cavita-tion thrust breakdown for a propeller. Break-down is typically negligible for cavity cover-age less than 10% of the back face of the blade. Recently, Black (2007) analyzed data from five propellers with modern blade sections and pro-posed an empirical formula for the onset of ca-vitation thrust breakdown that relates a thrust-loading coefficient to the cavitation index. Fig-ure 4.4 shows the predictions using his method. The resulting formula includes a correction for low-order harmonic inflow variations typical of shaft inclination angles, and is close to the 15% backface cavity coverage criterion of the Bur-rill chart. Levels of cavitation thrust breakdown to 5% are found to be tolerable because the lost thrust can be recovered by increased propeller speed, in spite of the slight increase in cavita-tion. Beyond 10% loss, the thrust cannot be re-covered.
Van Rijsbergen and van Terwisga (2000) reviewed existing criteria for maximum thrust density on open and ducted propellers. The maximum thrust capability of a given propeller is determined by two criteria: a non-dimensional thrust-density criterion and a non-dimensional tip-speed criterion. Dimensional equivalents of these two criteria are less reli-able because they show too large of a depend-ency on shaft immersion and efficiency. The thrust capability of a propulsor is dependent on the wake field, the propulsor type, and the pro-pulsor design—giving parameters that should be included in any empirical model. The exist-ing empirical model shows a good correspon-dence with experimental results on conven-tional propellers, when the maximum thrust capability is defined at the point where a 2% thrust cavitation breakdown is reached.
Potential-Flow Methods. The development of algorithms to solve the RANS equations and perform viscous CFD simulations—as well as the necessary computer power—has only re-cently impacted cavitation modeling. Previ-ously, hydrodynamicists have used the assump-
tions of inviscid and irrotational flow to de-velop potential-flow methods to solve for the flows in the vicinity of ship hulls, propellers, rudders, and other geometries of interest. For cavitation modeling, these hydrodynamicists have developed lifting-surface, panel, vortex-lattice, or boundary-element methods that model the cavities, as well as the geometry. One can also solve the inviscid Euler equations, without the assumption of irrotational flow.
Figure 4.4 Cavitation thrust breakdown predic-
tion by Black (2007).
Because of their efficiency, these potential-flow methods are still used for propeller design and for predictions over a range of flow and cavitation conditions. These methods can ad-dress non-uniform inflows and predict fluctuat-ing forces and pressures produced by sheet ca-vitation. Several researchers, including Kinnas et al. (2007), have developed corrections for viscous-flow effects by using RANS predic-tions for the incoming wake and vorticity fields or by incorporating boundary-layer integral solvers or viscous empirical corrections into the potential-flow methods.
Lee and Kinnas (2004) developed a bound-ary-element method (BEM) that couples calcu-lations for tip vortex cavitation with fully un-steady sheet cavitation on a propeller blade. The predicted shape of the tip vortex cavitation compares well with elliptic foil results, and the method is applied to a propeller tested in a ship wake. The resulting blade cavity shapes match experiments much better near the tip region with addition of the calculated tip vortex cavi-

Specialist Committee on Cavitation
484
tation. Without the calculated tip vortex cavita-tion, the predicted sheet cavities are too large. Lee and Kinnas (2004) also predict the result-ing cavitation forces.
Takekoshi et al. (2005) used a vortex-lattice method (VLM) for optimization of a propeller design in a non-uniform wake by evaluation of the time-dependent pressure distribution and cavity volume development. By shifting the loading distribution more towards the rear of the chord, they reduced the cavity volume, while maintaining the same overall loading dis-tribution. Experiments confirmed the predicted trends from the design optimization. The re-duced cavitation volume reduces the low-frequency, blade-rate components and also re-duces higher-frequency noise associated with tip vortex cavity bursting. This decrease was attributed to the reduction of the tip vortex cav-ity volume. In addition, they achieved a higher net efficiency for their new propeller design.
As demonstrated by Takekoshi et al. (2005), the efficiency of potential-flow codes com-bined with faster computers has allowed de-signers to apply optimization schemes to com-plex problems, including problems involving cavitation. Takekoshi et al. (2005) used their VLM with a cluster of personal computers to optimize blade section and pitch distributions for a cavitating propeller in a non-uniform wake. Cavitation and efficiency are two pa-rameters that typically cannot be varied inde-pendently in optimization schemes. Han et al. (2006) evaluated various optimization schemes for maximizing propeller efficiency, while si-multaneously meeting a criterion for the hull pressure fluctuations.
Falcao de Campos et al. (2006) studied the influence of the frequency on the partial-sheet cavitation behavior within the gust of a two-dimensional hydrofoil. Using a boundary-element method, they found that the effect of the wake peak on the cavity length can be nonlinearly significant.
Single-Phase RANS Methods. The cavita-tion survey clearly showed that most organiza-tions involved with problems associated with cavitation currently use CFD—either using their own codes, university-developed codes, or commercial codes. These viscous-flow codes solve the Reynolds-averaged Navier-Stokes (RANS) equations. Even without in-cluding any multiphase flow models which will be covered thoroughly in Section 5 of this re-port—these RANS solvers have proven valu-able for evaluating cavitation inception, espe-cially for the inception of surface cavitation. In addition, some organizations use RANS solvers in conjunction with empirical modeling and potential-flow modeling.
To show the accuracy of computations to an engineering level, Li (2006) compared RANS computations of the flow through a highly-skewed propeller, over a full range of advance ratios, to open-water powering data, PIV data, and the results of paint tests and cavitation-inception tests. Using a commercial code, he showed that the minimum pressure coefficient on the blade surface was sensitive to grid refinement. Within the tip vortex, he showed that the computational and experimen-tal results for the inception cavitation number differed by 7%, but he urged caution for this type of computation and the strong sensitivity to grid density. Others have shown issues re-lated to the turbulence model and the basic un-steadiness of the tip vortex and its minimum pressure.
Bulten and Oprea (2006) used a single-phase RANS solver to study the effects of grid refinement and turbulence modeling on propel-ler tip-vortex cavitation inception at model and full scale. The results show robustness, pro-vided that they did not use the overly-dissipative k-ε turbulence model. The expo-nents derived for the McCormick (1962) type of scaling from the predictions show smaller exponents than those usually found experimen-tally, similar to the trends from the empirical model of Shen at al. (2001).

Proceedings of 25th ITTC – Volume II
485
Dreyer et al. (2006) used a single-phase RANS solver in developing a multipoint shape-optimization method using the continuous ad-joint approach. They obtained an optimized hydrofoil design to improve cavitation-inception performance at off-design conditions. Then, they analyzed the optimized hydrofoil and the original baseline hydrofoil numerically using a RANS solver and experimentally in a water tunnel. Both analyses showed that the shape-optimization method successfully re-duced the cavitation number for the optimized hydrofoil at off-design incidence angles and widened the cavitation bucket.
4.3 Cavitation Noise and Pressure Fluctua-tion Prediction Methods
In reviewing the current cavitation model-ing methods, the 25th ITTC Specialist Commit-tee on Cavitation specifically set out to investi-gate how these prediction methods address ca-vitation dynamics and its influence on pressure fluctuations and noise.Dang (2004) compared pressure pulses for flat versus triangular pres-sure profile blade sections passing through a simulated sinusoidal wake by calculating cav-ity volume time derivatives. The results showed equivalent values. He focused on the varying propeller profiles to change pressure pulses, leading-edge cavitation, and leading-edge vortex separation.
Ligtelijn et al. (2004) compared model- and full-scale pressure fluctuation data for five dif-ferent ships, including two with noz-zle/propeller propulsors. Calculations of the pressures were made with three sets of pro-grams from two different laboratories. Addi-tionally, the calculations and model tests were conducted with the full-scale conditions, as in-put to remove the effects of variations of the full-scale-trial and model-test conditions. For the Azipod propulsors, Ligtelijn et al. (2004) showed good correlation between the full-scale and model-scale data—where the calculations either slightly over-predicted the first blade-rate tone or gave very accurate predictions, de-pending on the method. The nozzle propulsor
results showed poor agreement between model-scale data and predictions, with the predicted cavitation being too strong. Another nozzle-propeller test showed over-predicted fluctua-tions for the same reason, but the fully-wetted pressures were under-predicted, and the differ-ence were attributed to reverberant characteris-tics of the nozzle. For this case, the simple re-flection coefficient of two for a flat, solid boundary may be too small. Such propeller ar-rangements may require reverberation esti-mates that can be very frequency dependent.
For container ship correlations, Ligtelijn et al. (2004) showed over-predictions of the pres-sure pulses, primarily because of excessive ca-vitation calculated using model wakes, which were not sufficiently corrected for scale effects. The absence of good tip vortex modeling also caused discrepancies between the calculated and measured data. Ligtelijn et al. (2004) also revealed the importance of discriminating the pressure pulsations from the passage of the blade volume and the unsteady force pressure pulsations from the cavity volume pressure pulses. In the case where the source strengths were similar for these two phenomena, the phase relationship becomes important in de-termining the net amplitude on the hull. Low-amplitude pulses can be the lucky result of phase cancellation and not the result of a good design.
Lee and Chen (2005) predicted propeller cavitation and pressure fluctuations with and without hull interaction effects by coupling an Euler solver with a vortex lattice method and comparing the results to a RANS code coupled to the same VLM. The hull interaction had a very strong effect for the first blade rate and indicated the strong influence of hull interac-tion on the propeller inflow.
Kehr and Kao (2005) calculated far-field noise of a cavitating propeller from cavitation and unsteady forces. They based the cavity volume on unsteady lifting-surface calculations, mixed with dipole models of unsteady forces. Far-field results showed that cavity volume
Specialist Committee on Cavitation
486
noise can be replaced by a point source on the blade, but near-field results require the noise source distribution.
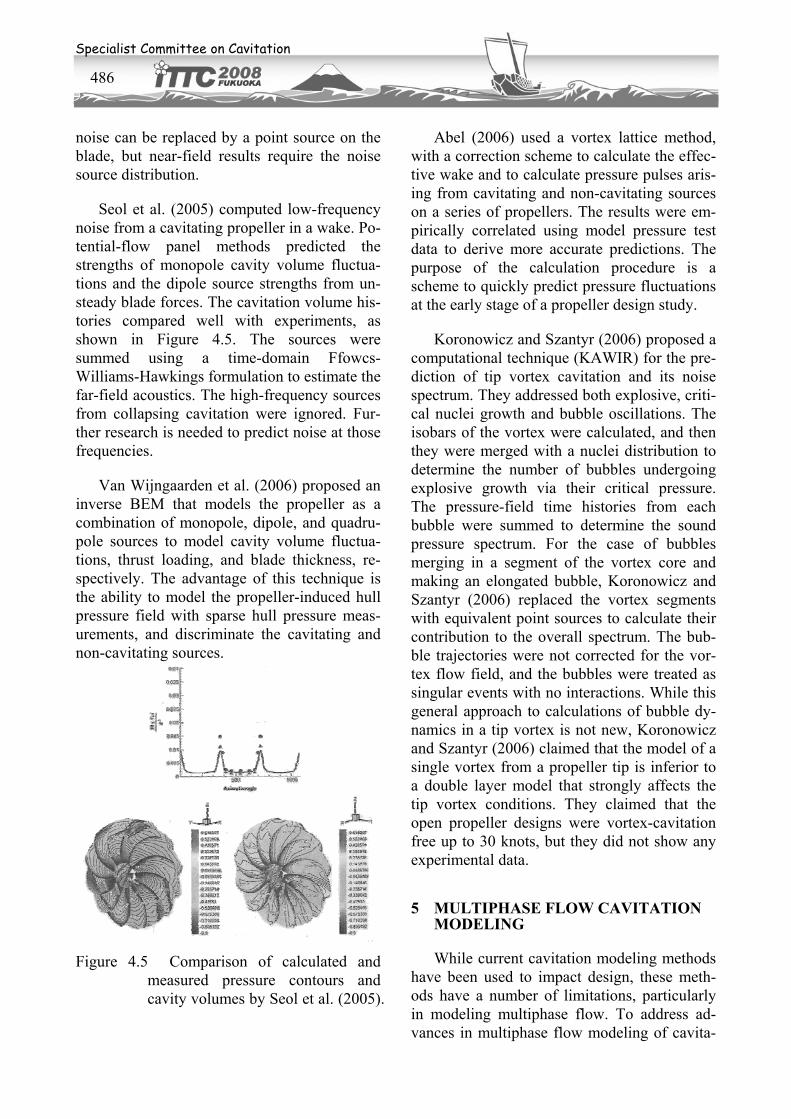
Seol et al. (2005) computed low-frequency noise from a cavitating propeller in a wake. Po-tential-flow panel methods predicted the strengths of monopole cavity volume fluctua-tions and the dipole source strengths from un-steady blade forces. The cavitation volume his-tories compared well with experiments, as shown in Figure 4.5. The sources were summed using a time-domain Ffowcs-Williams-Hawkings formulation to estimate the far-field acoustics. The high-frequency sources from collapsing cavitation were ignored. Fur-ther research is needed to predict noise at those frequencies.
Van Wijngaarden et al. (2006) proposed an inverse BEM that models the propeller as a combination of monopole, dipole, and quadru-pole sources to model cavity volume fluctua-tions, thrust loading, and blade thickness, re-spectively. The advantage of this technique is the ability to model the propeller-induced hull pressure field with sparse hull pressure meas-urements, and discriminate the cavitating and non-cavitating sources.
Figure 4.5 Comparison of calculated and
measured pressure contours and cavity volumes by Seol et al. (2005).
Abel (2006) used a vortex lattice method, with a correction scheme to calculate the effec-tive wake and to calculate pressure pulses aris-ing from cavitating and non-cavitating sources on a series of propellers. The results were em-pirically correlated using model pressure test data to derive more accurate predictions. The purpose of the calculation procedure is a scheme to quickly predict pressure fluctuations at the early stage of a propeller design study.
Koronowicz and Szantyr (2006) proposed a computational technique (KAWIR) for the pre-diction of tip vortex cavitation and its noise spectrum. They addressed both explosive, criti-cal nuclei growth and bubble oscillations. The isobars of the vortex were calculated, and then they were merged with a nuclei distribution to determine the number of bubbles undergoing explosive growth via their critical pressure. The pressure-field time histories from each bubble were summed to determine the sound pressure spectrum. For the case of bubbles merging in a segment of the vortex core and making an elongated bubble, Koronowicz and Szantyr (2006) replaced the vortex segments with equivalent point sources to calculate their contribution to the overall spectrum. The bub-ble trajectories were not corrected for the vor-tex flow field, and the bubbles were treated as singular events with no interactions. While this general approach to calculations of bubble dy-namics in a tip vortex is not new, Koronowicz and Szantyr (2006) claimed that the model of a single vortex from a propeller tip is inferior to a double layer model that strongly affects the tip vortex conditions. They claimed that the open propeller designs were vortex-cavitation free up to 30 knots, but they did not show any experimental data.
5 MULTIPHASE FLOW CAVITATION MODELING
While current cavitation modeling methods have been used to impact design, these meth-ods have a number of limitations, particularly in modeling multiphase flow. To address ad-vances in multiphase flow modeling of cavita-

Proceedings of 25th ITTC – Volume II
487
tion, the 25th ITTC Specialist Committee on Cavitation has proceeded from the definition of multiphase flow modeling as the science of numerically modeling cavitating flows on pro-pellers, rudders, and appendages by means of CFD codes that involve void-fraction modeling or at least two phases. Thus, potential-flow methods—such as boundary-element methods of two-phase flows—are excluded from this section of the report. (These methods were in-cluded in the previous section of the report.)
The remainder of this section includes an overview of the field of multiphase CFD and a literature review of material that researchers and users have reported since 2003. In addition, this section includes a discussion on the use of LES and DES to better resolve turbulent struc-tures and improve the modeling of unsteady cavitation.
5.1 Multiphase Flow Modeling
Many numerical models of cavitation have been proposed in the last three decades. In early models, it was assumed that the cavity is a vapor film in which the static pressure is con-stant. Models of this kind have been used mainly on the assumption that the flow is irro-tational, and they have been practically applied to attached sheet cavitation or supercavitation. However, the range of application has been limited because these traditional methods usu-ally require somewhat empirical or ad-hoc treatments at the leading and trailing edges of the cavity. Recently, with the increase of com-putational power and improvement of turbulent flow simulation methods, more general and flexible multiphase flow models have attracted attention.
The multiphase flow modeling of cavitation can be distinguished from the traditional ap-proach in that cavitating flows are modeled with a continuum, variable-density fluid. The traditional interface-tracking approach has been used mainly in combination with methods based on potential-flow theory, whereas the multiphase-flow approach is more often used in
combination with RANS simulations—or, very recently, with DES and LES. The advantage of multiphase flow cavitation models over the traditional interface tracking approach is the flexibility of the framework. Thus, they offer a better perspective of modeling more details of cavitation and its consequences. Whether this type of modeling is good enough for practical purposes is still to be proven.
The multiphase flow model is based on the concept of phase averaging. For example, if cavitation is considered as a two-phase flow (some researchers take non-condensable gas as a third phase), one assumes that, at a given in-stant, the fluid in an arbitrarily small volume centered at a certain point in space is a homo-geneous mixture of vapor and liquid. The mix-ture fluid properties, like mass density and dy-namic viscosity, are an average of the liquid and vapor properties, based on the local consti-tution at that instant, governed by a nondimen-sional scalar phase fraction parameter, which is either the volume fraction of vapor (αv) or the volume fraction of liquid (αl), where αl = 1-αv in a two-phase flow.
One approach is now to derive the mixture density (and thereby the volume fraction) from the instantaneous pressure via an artificial equ-ation of state. This type of model is also re-ferred to as a barotropic model. It assumes that bubbles instantaneously respond to the global pressure variations. It also implies that an equal-pressure surface in the flow is an equal-density or equal-phase-fraction surface.
In another, more extensively pursued ap-proach, the computation of the cavitating flow is based on the solution of the equations for mass and momentum conservation of the mix-ture fluid (including a turbulence model), to-gether with a transport equation for the volume fraction parameter. The latter equation must have creation and destruction terms to model the evaporation and condensation processes. As a matter of fact, the formulation of these source/sink terms distinguishes the various cavitation models which have so far been pro-

Specialist Committee on Cavitation
488
posed in this category. In some versions, the formulation has a bearing on the Rayleigh equation for bubble dynamics; in other ver-sions, it has simply been tuned to the behavior of cavitation observed in experiments.
In the numerical solution of cavitating flows, several problems are encountered and, from publications, it is not always clear how they are resolved. In that sense, there is consid-erable similarity with turbulence modeling. Moreover, the choices on spatial and temporal resolution seem to be important. But with the increase of the resolution in space and time, the computation time goes up dramatically. On the other hand, it is difficult to judge the perform-ance of a given cavitation model, as long as the solution has not been shown to be independent of time step and grid spacing. This is to say that a lot more work has to be done to arrive at best practice guidelines for numerical modeling of cavitation.
5.2 Review of Recent Literature on Multi-phase Flow Cavitation Modeling
Multiphase flow modeling of cavitation is a very active research area, and many research groups—mainly in Europe, the United States, and Japan—are engaged in this research. In the next section, the committee reviews the recent advances of these models, and their potential to predict cavitation inception, erosion, induced pressure fluctuations, and thrust breakdown.
Fundamental Studies and Validation on Simple Geometries. A significant amount of effort has been made so far to investigate the validity of multiphase flow cavitation models. In many studies, cavitating flow around two-dimensional simple geometries, such as foil sections, have been simulated and compared with experimental results. In 2003, during the Fifth International Symposium on Cavitation (CAV2003) in Osaka, Japan, the organizers held an interesting session. The objective of the session was to compare computational results on a common test case. The subject chosen in the session was cavitating flow over a two-
dimensional hydrofoil for which experimental data were not yet available. Figure 5.1 shows the geometric configuration of this problem.
Figure 5.1 CAV2003 hydrofoil test case.
Participants were requested to simulate the flow at the non-cavitating condition and at two cavitation numbers, σ =0.4 and 0.8. Seven out of the eight papers presented in the session used multiphase flow modeling. Qin et al. (2003), Pouffary et al. (2003), Saito et al. (2003), and Coutier-Delgosha and Astolfi (2003) used the state-law approach—while Wu et al. (2003), Kawamura and Sakoda (2003), and Kunz et al. (2003) used either the bubble two-phase flow model or a heuristic model. Al-though experimental results were not presented, the computational results suggested that a peri-odically-collapsing sheet cavity appears at σ = 0.8 and that relatively stable supercavitation occurs at σ = 0.4. While most participants predicted this qualitative feature, Figures 5.2 and 5.3 show that the computed time-averaged quantities were quite scattered.
It should be noticed that those computed quantities are influenced not only by the cavita-tion model, but also by various computational conditions such as the turbulence model, the grid resolution and quality, the discretization scheme, and so on.
More recently, Patella and Reboud (2006) and Rolland et al. (2006) have shown detailed comparison of the computation using the baro-tropic-state-law model and an experiment for a cavitating flow in a Venturi. Also, Takekoshi and Kawamura (2006) have carried out a sys-tematic validation of the full cavitation model developed by Singhal et al. (2002) for cavitat-ing flows over various hydrofoils. These re-

Proceedings of 25th ITTC – Volume II
489
searchers showed reasonable overall agreement between the simulation and the experiments. However, Takekoshi and Kawamura (2006) suggested that the reliability of the simulation is dependent on other conditions, such as the angle of attack or the hydrofoil section. As for the turbulence model, Coutier-Delgosha et al. (2003a) and Xiong et al. (2006) have pointed out that the predicted cavity patterns are sig-nificantly influenced by the choice of the RANS models. Recently, Wosnik and Arndt (2006), Persson et al. (2006), and Wang and Ostoja-Starzewski (2007) applied LES to cavi-tating flows.
Figure 5.2 Comparison of the computed lift
coefficients of the CAV2003 hydro-foil at two cavitation numbers (where σ = 0.8 are the blue dia-monds and σ = 0.4 are the black squares).
While most validations have been two di-mensional, Kunz et al. (2003), Frobenius et al. (2003), and Dular et al. (2003, 2006a) have performed three-dimensional simulations. Fig-ure 5.4 shows a good agreement between the computed cavity shape and experimental ob-servation for a three-dimensional hydrofoil, as computed by Frobenius et al. (2003).
Many researchers have also applied multi-phase flow cavitation models to studies on in-stabilities of cavitating flows. Leroux et al. (2003) and Coutier-Delgosha et al. (2003c) performed two-dimensional unsteady simula-
tions of the cavitating flow over a hydrofoil section using the barotropic-state-law model, and they reported good predictions of the fre-quencies of the cavity oscillation. Coutier-Delgosha et al. (2003b), Iga et al. (2003), Iga et al. (2004), and Leroux et al. (2005) obtained similar results.
Figure 5.3 Comparison of the computed max-
imum cavity lengths over the CAV2003 hydrofoil at two cavita-tion numbers (where σ = 0.8 are the blue diamonds and σ = 0.4 are the black squares).
Figure 5.4 Comparison of the cavity shapes
between experimental observations and simulations by Frobenius et al. (2003).
Application to Engineering Flows, Pumps, and Propellers. Multiphase flow cavitation models have also been applied to flows of en-gineering interest such as flows in a pump or

Specialist Committee on Cavitation
490
through a marine propeller. Yamada et al. (2003), Nohmi et al (2003), Okita et al. (2003), Kimura et al. (2006), Hosangadi et al. (2006), and Flores (2006) have applied these models extensively to pumps. Bakir et al. (2003) and Ait-Bouziad et al. (2003) simulated cavitation in a pump inducer using commercial CFD software with multiphase flow modeling. Their results are in good overall agreement with ex-perimental results with respect to the head drop, the size and location of the cavity, and the in-ception. However, Bakir et al. (2003) stated that the simulation under-predicted the head drop at high flow rate and that the cavitation model itself requires careful testing for the de-termination of empirical constants. Fukaya et al. (2003) applied a bubble-flow-type multiphase flow model to cavitating flow in an axial-flow pump. Although the predicted cavitation per-formance was only in qualitative agreement with the measurements, they refer to the poten-tial of predicting impulsive pressure due to the collapse of bubbles.
Streckwall and Salvatore (2007) compared the results of RANS codes with multiphase flow models from various laboratories predict-ing propeller performance and cavitation in uniform flow. While the thrust and torque pre-dictions were close, the cavity patterns showed some differences, as seen in Figure 5.5. A sur-prising result was that the surface pressures under the cavity were not constant in some of the codes.
Watanabe et al. (2003) and Rhee et al. (2005) simulated cavitating flow through a ma-rine propeller using commercial software, and they showed that the predicted cavity shape agrees with experimental results. Kawamura et al. (2006) presented an unsteady simulation of cavitation on a marine propeller operating in a non-uniform wake. The time-dependent growth and collapse of the sheet cavity in the wake is reproduced, as shown in Figure 5.6. This capa-bility is necessary for predicting the pressure fluctuation at the blade frequency.
Figure 5.5 Comparison of measured and com-
puted cavity patterns (vapor volume fraction cV=0.5)—as reported by Streckwall and Salvatore (2007).
30[deg.] 0[deg.] -30[deg.]
(a) Calculation
(b) Experiment Figure 5.6 Comparison of the unsteady cavity
patterns in the (a) experiment and (b) calculation given by Kawamura et al. (2006).
Prediction of Cavitation Inception. Predic-tion of cavitation inception is also very impor-tant from an engineering point of view. How-ever, most multiphase flow cavitation models use the assumption that the growth and col-lapse of cavitation bubbles occur in a very
Proceedings of 25th ITTC – Volume II
491
short time. This assumption may be valid for predicting the inception of attached sheet cavi-tation, but it is probably inappropriate for in-ception of traveling bubble cavitation or vortex cavitation. Therefore, several researchers have applied more complex bubble dynamics mod-els to the prediction of inception in vortices. Hsiao and Chahine (2004) applied spherical and non-spherical bubble dynamics models to the prediction of tip-vortex cavitation of a fi-nite-span hydrofoil, and they showed that non-spherical bubble deformation is important for the accurate prediction of cavitation inception.
Kim et al. (2006) studied the inception of tip-leakage cavitation within a ducted propeller, and Wienken et al. (2006) have studied the in-ception in the flow past a square cylinder. Kim et al. (2006) used a locally-refined grid around the tip for resolving the vortex core, while Wienken et al. (2006) applied LES to capture the unsteady vortices.
Prediction of Cavitation-Induced Pressure Fluctuations. Occurrence of unsteady cavita-tion can induce significant pressure fluctua-tions on the surrounding structures. These pres-sure fluctuations are particularly important in the design of the propulsion system for a ship. While there are relatively many papers on the prediction of the influence of cavitation on hy-drodynamic performance, publications of these pressure fluctuation have been very limited.
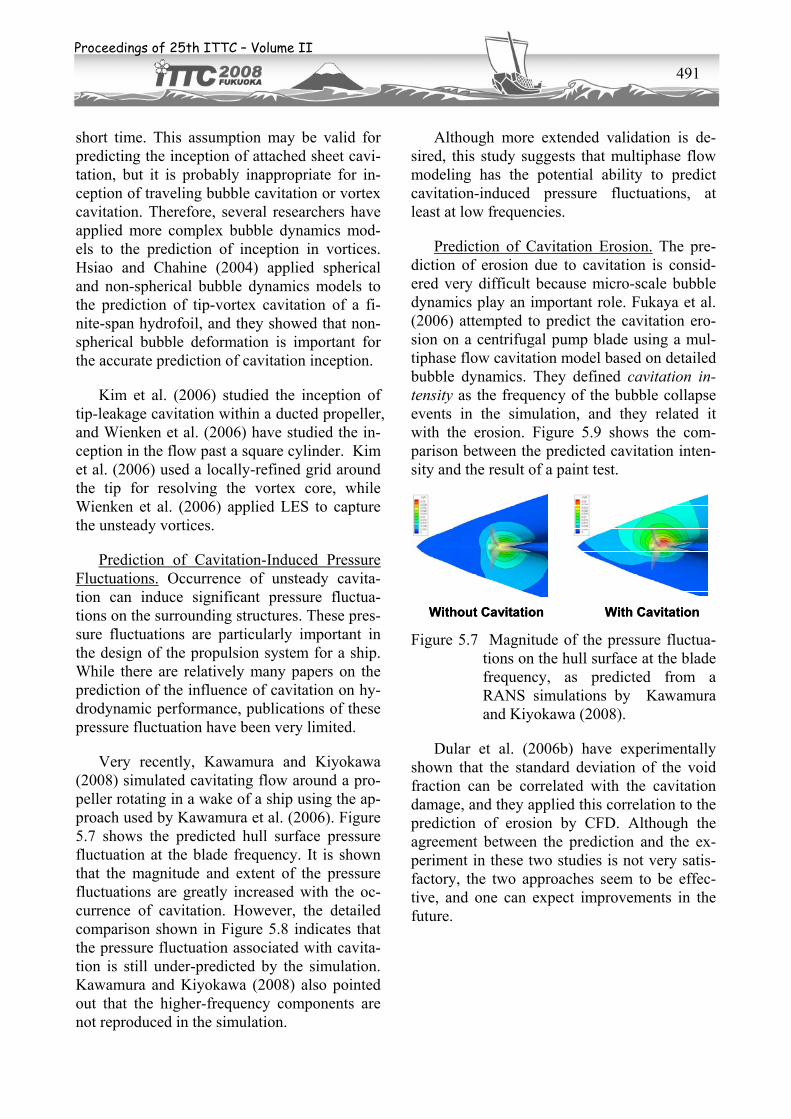
Very recently, Kawamura and Kiyokawa (2008) simulated cavitating flow around a pro-peller rotating in a wake of a ship using the ap-proach used by Kawamura et al. (2006). Figure 5.7 shows the predicted hull surface pressure fluctuation at the blade frequency. It is shown that the magnitude and extent of the pressure fluctuations are greatly increased with the oc-currence of cavitation. However, the detailed comparison shown in Figure 5.8 indicates that the pressure fluctuation associated with cavita-tion is still under-predicted by the simulation. Kawamura and Kiyokawa (2008) also pointed out that the higher-frequency components are not reproduced in the simulation.
Although more extended validation is de-sired, this study suggests that multiphase flow modeling has the potential ability to predict cavitation-induced pressure fluctuations, at least at low frequencies.
Prediction of Cavitation Erosion. The pre-diction of erosion due to cavitation is consid-ered very difficult because micro-scale bubble dynamics play an important role. Fukaya et al. (2006) attempted to predict the cavitation ero-sion on a centrifugal pump blade using a mul-tiphase flow cavitation model based on detailed bubble dynamics. They defined cavitation in-tensity as the frequency of the bubble collapse events in the simulation, and they related it with the erosion. Figure 5.9 shows the com-parison between the predicted cavitation inten-sity and the result of a paint test.
Without Cavitation With CavitationWithout Cavitation With Cavitation Figure 5.7 Magnitude of the pressure fluctua-
tions on the hull surface at the blade frequency, as predicted from a RANS simulations by Kawamura and Kiyokawa (2008).
Dular et al. (2006b) have experimentally shown that the standard deviation of the void fraction can be correlated with the cavitation damage, and they applied this correlation to the prediction of erosion by CFD. Although the agreement between the prediction and the ex-periment in these two studies is not very satis-factory, the two approaches seem to be effec-tive, and one can expect improvements in the future.

Specialist Committee on Cavitation
492
0
0.01
0.02
0.03
0.04
0.05
0.06
-1 -0.5 0 0.5 1
Kp
y/D
Exp.(cavitating)Exp.(non-cavitating)
Comp.(cavitating)Comp.(non-cavitating)
Figure 5.8 Comparison of the measured and
computed hull surface pressure fluctuations at the blade frequency, as given by Kawamura and Kiyo-kawa (2008).
Figure 5.9 Predicted cavitation intensity and
comparison with the result of an experimental paint test, as given by Fukaya et al. (2006).
Prediction of Cavitation Thrust Breakdown. One of the most detrimental effects of cavita-tion within a propulsor or pump involves the performance breakdown of thrust, torque, and total-head rise. Recently, several investigators have begun to show some promising numerical simulations of cavitation breakdown for pumps and propellers based on three-dimensional RANS solvers with multiphase flow models.
To evaluate the three-dimensional, quasi-steady cavitation within three different pumps, Coutier-Delgosha et al. (2002) used a commer-cial RANS code, which they adapted to ac-count for the cavitation phenomenon. They de-scribed the cavitating flow as a single fluid
model—with a barotropic law that links the local density with the local static pressure. Their simulations of cavitation breakdown quantitatively compared well with experimen-tal data for two radial-flow (or centrifugal) pumps. However, while they obtained good qualitative agreement; they did not obtain ac-curate quantitative agreement with experimen-tal data for a turbopump inducer.
Dupont and Casartelli (2002) described several approaches for modeling cavitation with three-dimensional RANS simulations, and they used two different approaches to predict the cavitation in two centrifugal pump impel-lers—impellers with the same specific speed, but with small geometrical differences that lead to significant differences in cavitation devel-opment. First, they used a commercial RANS code, which has a cavitation module using a coupled approach. Then, using a non-coupled approach, they used their own RANS code to compute the non-cavitating pressure distribu-tion, which they used to simply solve the Ray-leigh-Plesset equation for computing the cavity shapes. They developed this simple method and calibrated it using test data as an alterna-tive to the expensive coupled approach—but they realized its physical limitations, especially if the cavities begin to detach. Nonetheless, they obtained comparable agreement between the two approaches in predicting the cavity shapes and the 3% drop in total head that marks the point of cavitation breakdown—with both approaches giving fair comparisons with experimental results.
For the cavitating flow through a centrifu-gal pump impeller, Frobenius et al. (2002) per-formed both an experimental investigation and a numerical investigation, using their own de-veloped RANS code with a cavitation model based on bubble dynamics. They used a one-fluid model, which they treated as a homoge-neous bubble-liquid mixture. Their method in-cluded a transport equation for the vapor frac-tion and the Rayleigh-Plesset equation to model bubble growth and collapse. For the to-tal-head drop associated with cavitation break-down, they showed good agreement between their experimental and numerical results. At the

Proceedings of 25th ITTC – Volume II
493
point of incipient cavitation, they also showed good agreement with blade pressure distribu-tions. However, with decreasing cavitation number, they showed less favorable agree-ments for both blade pressure distributions and void fraction distributions.
Using their own developed code, Lindau et al. (2005) performed a simulation of propeller cavitation thrust breakdown based on a homo-geneous, multiphase RANS formulation. They treated both the liquid and vapor phases within each control volume and discretely modeled the mass transfer between phases, a multiple species transfer model of multiphase flow that they felt offers a more flexible physical ap-proach. For this propeller test case, they pre-dicted the critical cavitation number leading to thrust and torque breakdown, providing good agreement with experimental data over a wide range of flow coefficients.
5.3 Cavitation Predictions using LES and DES
For the simulation of turbulent flows of practical interest, most organizations currently use solvers of the Reynolds-averaged Navier-Stokes (RANS) equations. This choice holds for cavitating flows as well as non-cavitating flows. RANS solvers are based on time- or en-semble-averaging of the Navier-Stokes equa-tions. The averaged velocities and pressures are explicitly solved, while the apparent Reynolds stresses are modeled using a turbulence model. For practical problems, two-equation models—such as k-ε, k-ω, or q-ω models—or one-equation models—such as the model developed by Spalart and Allmaras (1994) —are usually applied. Because only the averaged quantities are explicitly solved, the required computa-tional load is usually moderate. However, it is known that the quality of the turbulence model is not always sufficient, especially in regions of strong adverse pressure gradients, flow separa-tion, and flow rotation.
In recent years, organizations have shown an increased interest in large eddy simulation (LES). In contrast to simulations using the
RANS equations, LES is based on spatial fil-tering, so that filtered variables are functions of space and time. LES resolves the largest turbu-lent eddies and only requires modeling of ed-dies smaller than the grid scale. Thus, a greater grid resolution gives a greater resolution on the turbulence. Consequently, careful LES requires much denser grids than RANS—and, hence, much more computational effort and a much larger quantity of computation data.
Given the significant increase in computa-tional effort between RANS simulations and LES, researchers have developed detached ed-dy simulation (DES) to reduce the computa-tional effort of LES, but still resolve the impor-tant turbulent structures. In fact, one could de-scribe DES as a mix of RANS and LES. One models the near-wall flow (or boundary layers) with RANS and the outer flow (and corre-sponding detached eddies) with LES. The change from RANS to LES is governed by a comparison of a local grid scale and a suitable turbulence length scale. One issue still involves how to make the transition from the RANS domain, with its averaged turbulent quantities, to the LES domain—which requires much more detailed turbulent information.
Cavitation modeling within RANS, DES, or LES is based on the same approach—assuming a continuum mixture fluid and solving an addi-tional transport equation for a void fraction with appropriate source terms. However, in DES or LES, local and instantaneous pressure fields are better resolved than in RANS, possi-bly leading to significant improvements in the prediction of cavitating flows.
Within the literature review of recent re-search on multiphase flow modeling, the com-mittee has given several examples of using LES and DES. These efforts included the work by Wienken et al. (2006), Wosnik and Arndt (2006), Persson et al. (2006), and Wang and Ostoja-Starzewski (2007).
Rhee et al. (2007) discussed new commer-cial RANS/LES hybrid schemes, which are based on a homogeneous mixture using a sin-gle set of momentum and turbulence equations.

Specialist Committee on Cavitation
494
The method uses the reduced Rayleigh-Plesset equations to account for phase changes, includ-ing non-condensable gas and pressure fluctua-tions. Slip is allowed between phases, and the phase change model can be user-defined to in-clude mass source terms. Rhee et al. (2007) gave example calculations that compare open-water propeller test data, in a fully-wetted con-dition and with extensive tip vortex cavitation conditions. They showed good agreement of the values for thrust coefficient, TK , and torque coefficient, QK .
For cavitation inception within a circular jet flow, Edge (2007) computed this complex vor-tical flow field with a single-phase DES. Then, he released cavitation nuclei into the jet flow and computed the radial growth of the nuclei using a code that solves the Rayleigh-Plesset equation, with the dispersion of the bubbles governed by a semi-empirical equation of mo-tion. This uncoupled methodology proved very useful in evaluating parameters that determine jet cavitation inception—such as the size and characteristics of the jet and the initial nuclei size. The primary objective of this research was to develop a scaling relationship for cavi-tation inception.
Huuva (2008) applied LES and DES to ca-vitating flow over a NACA0015 foil with a flat tip and over a Twist11 hydrofoil. He indicated that LES and DES computations resolve the structure of cavitating flows in more detail compared with RANS computations, and that this added detail can cause significant qualita-tive difference in the collapsing behavior of cavity over hydrofoils. Meanwhile, he also mentioned that RANS computations are suffi-ciently reliable in the prediction of basic quan-tities such as cavity volume or shedding fre-quency.
6 RUDDER CAVITATION
Problems of rudder cavitation erosion had been somewhat out of focus in the shipbuilding industry in the 1970’s—since, at that time, ships were sailing quite slow due to high oil prices. Even with oil prices high again, ships—
especially container vessels, roll-on/roll-off (RoRo) ferries, and liquefied natural gas (LNG) carriers—tend to sail at high speed. Consequently, prevention of rudder damage due to cavitation has become an issue again.
Billet et al. (2005) and the Specialist Com-mittee on Cavitation Erosion on Propellers and Appendages on High Powered/High Speed Ships for the 24th ITTC addressed the topic of cavitation damage on conventional rudders. They concluded that the propeller(s) and rud-der(s) —and any other appendages—must be designed as a unit, with careful attention paid to both the hydrodynamics and the materials. They also stressed the importance of off-design operating conditions. Finally, they recom-mended more documentation of the observed full-scale erosion patterns—not only to im-prove correlations of model-scale tests, but also for improvement of the design methodology to reduce potential cavitation erosion.
Figure 6.1, taken from Friesch (2006), shows the typical areas of rudder erosion dam-ages on a conventional semi-spade rudder. Cases have been reported, where serious rudder repair work had become necessary long before the regular five-year service interval was com-pleted. The cavitation phenomena responsible for damage in Figure 6.1 include gap cavitation in both the vertical gaps (Zones B and C) and horizontal gaps (Zone D), sheet or cloud cavi-tation in thickened geometry regions such as around the pintle area (Zone A), and vortex ca-vitation at the rudder sole (Zone E).
The 25th ITTC Specialist Committee on Cavitation will extend the recommendations of this previous ITTC committee by addressing the methods for predicting cavitation and ero-sion damage on unconventional rudders or on rudders behind highly-loaded propellers. For clarification, the committee will address two fundamental questions in Appendix A: “What is an unconventional rudder?” and “What is a highly-loaded propeller?”

Proceedings of 25th ITTC – Volume II
495
AD
C
B
E
A
C
AD
C
AD
C
B
E
A
C
B
E
A
C
Figure 6.1 Critical areas of cavitation damage
on a conventional semi-spade rud-der as described by Friesch (2006).
As a consequence of the issues addressed in Appendix A, the recommendations in Sections 6.2 and 6.3 for rudder cavitation tests should be applied whenever the ship does not have a con-ventional symmetric semi-spade or spade rud-der, or whenever the ship has a propeller power density of more than 800 kW/m2. It might be pointed out that all of the large and fast con-tainer ships of today, which are known to be highly susceptible to rudder cavitation erosion, fall into this category, since they typically have a propeller power density greater than 1,000 kW/m2.
6.1 Rudder Erosion Issues
Of course, all rudder erosion problems mentioned by the previous ITTC Specialist Committee on Cavitation for conventional rud-ders also apply for unconventional rudders. Additional problems arise from the much more complex geometry of unconventional rudders. They have more gaps and/or more sharp edges, as illustrated in the figures in Appendix A. Sharp edges always imply high flow velocities, or low static pressures. The consequence is an increasing risk of cavitation. The same holds for a flow that accelerates through a narrow gap.
The problems involved in a rudder behind a highly-loaded propeller have already been ad-dressed in the previous section. The high pro-peller loading increases not only the axial in-flow velocity to the rudder, but also the non-uniformity of the inflow due to the increased swirl in the propeller slipstream. Adaptation of the rudder to this non-uniformity requires non-
uniformity of its geometry, which again results in either sharp edges or edges with small ra-dii—as shown, for instance, in Figures A.5 or A.8.
Issues also arise during cavitation perform-ance testing on models of unconventional rud-ders or rudders behind highly-loaded propellers, especially from cavitation within the gaps and from the propeller vortex cavitation impacting the rudder. Gap flow is influenced by the boundary layer thickness upstream and within the gap. Because the Reynolds number is smaller in a model test, the boundary layer is thicker, which hinders the gap flow unrealisti-cally. Consequently, the gap flow is slower at model scale and the cavitation inception is de-layed.
Regarding the impact from the propeller, its hub and tip vortex cavitation need to be men-tioned. Both cavitating vortices are known to be possible sources of erosion when impacting the rudder. The existence of these vortices is unavoidable according to the first Helmholtz theorem. Their strength correlates with the loading of the propeller—which makes them critical, especially with highly-loaded propel-lers. In this case, these hub and tip vortices may be strong enough to generate cavitation within their core, and their stability might be great enough to remain cavitating until they have reached the rudder. In general, these kinds of vortex cavitation do not cause any erosion problem at the propeller, because they appear downstream of the propeller. But, they may damage the rudder, especially when collapsing on the rudder surface.
At least since the fundamental work of McCormick (1962), it is known that vortex ca-vitation inception depends on the Reynolds number—that is, it appears later and weaker at model scale. This Reynolds number depend-ency is because the rotational flow in the vor-tex core is weakened by the exaggerated vis-cosity at model scale. As a consequence, rud-der erosion due to propeller vortex impact might be under-predicted from model tests.
Specialist Committee on Cavitation
496
6.2 Experimental Methods for Rudder Ca-vitation Prediction
As mentioned previously, not many organi-zations from the worldwide cavitation commu-nity responded to the rudder cavitation portion of the committee’s survey—and, the few or-ganizations that did respond, did not elaborate on the experimental methods. Nonetheless, with the difficulty in modeling cavitation ero-sion, experimental methods still offer the best means of assessing rudder cavitation.
Scale Effects. Even more importantly than for model tests of propeller cavitation, one must account for scale effects when conducting model tests to investigate rudder cavitation. This situation is especially true for unconven-tional rudders. In this respect, the result of the survey was very clear. Most organizations with full-scale ship experience answered that almost all rudder cavitation phenomena (gap, sheet, and/or vortex cavitation), as well as the range of rudder angles where they occur, are under-predicted from a model test. Just a few organi-zations consider these values as similar, and no organization answered that these phenomena are over-predicted.
For a normal cavitation test, one places the rudder behind a propeller, and a TK -identity exists between model and full scale. Then, the ratio between model- and full-scale Reynolds numbers is the same for the propeller and for the rudder. Nevertheless, the absolute value of the Reynolds number locally at the rudder is typically only 50% of the model propeller Rey-nolds number. Even if this value is well above the critical value of Re > 300,000 (which is known to be sufficient for a propeller), the Reynolds number may still be insufficient to guarantee fully turbulent flow over the rudder.
Regarding gap cavitation, scale effects also include the viscosity effect within those gaps. Thus, the resulting boundary layers are too thick at model scale, hindering the flow through the rudder gaps—and, in this way, cer-tainly delaying gap cavitation. Such a delay has been reported by 86% of the organizations hav-
ing full-scale experience (as estimated from the survey).
As mentioned previously for propeller vor-tex cavitation, model-scale rudder vortex cavi-tation may also suffer from scale effects caused by the Reynolds numbers being too low during testing. McCormick (1962) performed a fun-damental investigation and developed a well-known equation for the inception of vortex ca-vitation,
,
,
Re,
Re
m
i full scale full scale
i model scale model scale
σσ⎛ ⎞ ⎛ ⎞
=⎜ ⎟ ⎜ ⎟⎜ ⎟ ⎜ ⎟⎝ ⎠ ⎝ ⎠
(6.1)
which he originally developed for delta wing forms. Several researchers suggested various values for the exponent, m , depending on ar-rangements and conditions. The most recent approach is reported by Bulten and Oprea (2006). Anyway, rudder cavitation is normally investigated to predict erosion problems at full scale. While the equation developed by McCormick (1962) and others may be applica-ble for the inception of rudder vortex cavitation, it does not help investigators to scale the ero-siveness of developed vortex cavitation.
Assessment of Cavitation Erosion. The big-gest problem with respect to model-test-based predictions of rudder cavitation erosion is the actual assessment of the cavitation at model scale. Propeller cavitation observed in strobo-scopic light has been correlated to full-scale propeller erosion damage for more than a hun-dred years. Even if the fundamental physical mechanism is still not clear, this experience represents a sufficient basis for assessment. The lack of such experience is one of the prob-lems involved in high-speed video observations of cavitation at model scale. Cavitation simply looks different using this tool and experience needs to be acquired to judge it. The same holds for rudder cavitation, even under conven-tional recording conditions: phenomena such as stable sheet cavitation, which are known to be non-critical for propellers, seem to be erosive on a rudder surface. Gap cavitation phenom-ena never occurred on a propeller (except very

Proceedings of 25th ITTC – Volume II
497
locally behind the palm of controllable pitch propellers). So what does erosive gap cavita-tion look like? How does one distinguish be-tween erosive and non-erosive rudder sheet cavitation?
One important, but time-consuming, ap-proach to overcome this problem in the future is to gather the missing experience by perform-ance of frequent full-scale rudder cavitation observations. Miller and Wilczynski (2006) have recently published such a correlation study. Also, Friesch (2006) gave an excellent overview of this issue. An alternative, but not a very satisfying, approach is the use of soft-ink testing methods for erosion assessment. Here, to achieve better reliability, one must follow approved standard procedures as established for propeller erosion tests by the EROCAV project and reported by Billet et al. (2005) and the Specialist Committee on Cavitation Erosion for the 24th ITTC.
Recommendations for Unconventional Rudder Cavitation Tests. Following the previ-ous sections, the committee has developed rec-ommendations for model testing of unconven-tional rudders or rudders behind highly-loaded propellers:
(1) The recommendations given by Jessup et al. (2002) and the Propulsion Committee of the 23rd ITTC regarding cavitation testing at model scale in general apply to the tests for un-conventional rudders as well. The operation of the complete unit of rudder and propeller in most realistic propeller inflow conditions is es-sential for unconventional rudders as well. Use of complete ship models for wake generation should be considered wherever possible.
(2) For unconventional rudders, the exact reproduction of the complex rudder geometry is essential. Sharp edges at full scale need to be modeled sharply. Penetrating gaps at full scale need to be modeled as such to allow water passing through the gap. Mechanisms of flap rudders, for example, need to be modeled.
(3) The local Reynolds number at the rud-der profile should be greater than 300,000 to avoid laminar flow effects.
(4) As long as nothing better is known (re-fer to the following recommendations for fu-ture investigations), one should investigate a much wider range of rudder angles than has to be guaranteed for erosion-free operation at full scale. If a model rudder suffers from erosive gap cavitation at a 5° rudder angle, for example, it might show this phenomenon at full scale for a 3° rudder angle. Bear this in mind!
(5) Larger-scale part models may be used to test local gap cavitation phenomena or cavi-tation phenomena occurring at rudder details like spoilers. Whenever such part models are tested in uniform inflow, a calibration is needed based on knowledge of the cavitation phenomena occurring at full scale for those rudder details: the test conditions (tunnel pres-sure, flow speed, and rudder angle) need to be modified until the phenomenon to be investi-gated occurs as at full scale. Then, geometric modifications can be investigated keeping those test conditions constant. Without such a calibration, the reliability of a part-model rud-der cavitation test is regarded as poor.
Requirements for Future Investigations. While the previous recommendations should be followed under present conditions, future in-vestigations can certainly improve model-scale cavitation testing for unconventional rudders or rudders behind highly-loaded propellers. Here, the committee provides some suggestions:
(1) The application of rudder leading-edge roughness should be considered to further re-duce laminar flow effects in this area.
(2) Intentional widening of gaps (that is, local deviation from geometric scaling) should be investigated as a means to compensate for the overly thick boundary layers within gaps during most model-scale tests.
(3) Full-scale rudder cavitation observa-tions and corresponding monitoring of rudder

Specialist Committee on Cavitation
498
erosion damages are necessary to gather ex-perience for visual assessment of rudder cavita-tion at model scale.
(4) The previous requirement for full-scale rudder cavitation observation especially applies for high-speed video observations.
(5) Improvement of the soft-ink method is required to improve its reliability and to over-come the necessity of visual assessment of ero-siveness. Model basins need to introduce their own standard procedures—individually ad-justed to their rudder materials, coatings, and standard test procedures.
6.3 Numerical Methods for Rudder Cavita-tion Prediction
In spite of much effort, hydrodynamic re-searchers have yet to develop a universally-accepted numerical method to predict the cavi-tation erosion—largely because the physical mechanism of the erosion is not fully clarified. Only a few researchers have reported their studies since the last ITTC.
Hence, in practice, to evaluate the possibil-ity of the occurrence of cavitation erosion, de-signers of rudders, without model tests, must use indirect information—such as the pressure distribution on the rudder surface obtained from numerical methods or the empirical ap-proaches based on the designer’s experience. These numerical methods can be divided into the potential-flow and viscous-flow approaches.
The potential-flow approach—such as a lifting-surface or a boundary-element method (BEM)—is traditionally used in propeller and wing design, and it can provide information on the cavitation occurrence on the blade surface of the rudder. Especially for the rudder located just behind a propeller, the significant interac-tion between the propeller and the rudder can be considered by using the same numerical methodology. Of course, the calculation for the rudder alone with the appropriate inflow is possible. BEM codes give more realistic results
than the lifting-surface theory, because the rudder is relatively thicker than the propeller blades.
In general, the potential-flow approach re-quires low computational costs—and, addition-ally, the performances of the propeller as well as the rudder can be predicted simultaneously. Hence, this approach is still widely used, espe-cially during the initial design stage.
However, drawbacks exist in the potential-flow approach, since the tip vortex induced by the thick bottom edge of the rudder is not simu-lated precisely, and the viscous effect is ne-glected. As a result, potential-flow methods cannot predict the vortex cavitation around the bottom edge, without specific additional mod-eling. Also, for the semi-spade rudder, it is im-possible to represent the gap between the rud-der blade and the horn using the potential-flow approach. Reasons for this difficulty are that the flow pattern and pressure distribution around the gap are quite complex—including the flow separation and vortex generation—and are highly affected by small changes and vis-cous effects in the gap geometry.
Recently, with advances in computer tech-nology, designers have increased their use of viscous-flow solvers, with the exact shape of the rudder geometry. In this approach, both single-phase flow solvers and multiphase flow solvers exist—as reported previously in this report. The single-phase flow calculation pre-dicts the flow pattern and pressure distribution around the rudder, which gives an indication of cavitation inception wherever the local static pressure falls below the vapor pressure. As discussed previously in this report, a multi-phase flow calculation gives information on the unsteady behavior of developed cavitation. However, in practice, few designers actually use multiphase flow calculations, because of high computational costs and the lack of uni-versal acceptance of the cavitation-erosion models.

Proceedings of 25th ITTC – Volume II
499
Under these circumstances, another major factor that affects the reliability of the numeri-cal results for the rudder is how to consider the propeller action. The simple way is to assume the inflow and to calculate the flow around the rudder alone. The assumption of the inflow can be based on measurements in a model test or on computations of the propeller. Of course, this method does not include the interaction between the propeller and the rudder.
Conversely, one could compute the flow around the propeller and rudder simultaneously. However, this method increases the computa-tional costs, and it must correctly model the interface between the rotating computational grid in the vicinity of the propeller and the sta-tionary computational grid in the vicinity of the rudder. A sliding mesh, with proper interpola-tion, is one example of modeling this interface.
Alternatively, one could simplify the pro-peller as a momentum disk and treat the thrust and torque of the propeller as momentum sources—iteratively determined by the poten-tial-flow codes for the propeller in general. Hence, performance of the rudder and propeller is predicted with a low computational cost. However, this method has problems in properly capturing the tip and hub vortices generated from the propeller.
7 WATERJET CAVITATION
Waterjets have become the standard pro-pulsion system for surface vessels with cruis-ing speeds greater than about 25 knots, where waterjets can become more efficient than the propellers fit for those vessels—especially for vessels with draught restrictions that limit the propeller diameter. Compared to vessels using propellers, vessels using waterjets have the ad-vantage of higher speed operation without thrust breakdown from cavitation, especially for speeds greater than 30-35 knots. Even at lower speeds, vessels with shallow-water re-quirements may also employ waterjets. Fur-thermore, when installed with steerable nozzles, waterjets offer greater maneuverability. Also
to their advantage, waterjets absorb power from the main engine almost independently of ship speed. Therefore, standard waterjet units have the ability to operate over a large speed range without placing undue stress on the transmission and engine.
Since the ITTC has never focused on water-jet cavitation issues, the 25th ITTC Specialist Committee on Cavitation will provide a fairly detailed introduction to these issues in Appen-dix B. The rest of this section will focus on the modeling and scaling of waterjet cavitation.
7.1 Modeling of Waterjet Cavitation
Traditionally, most modeling of waterjet cavitation has involved experimental testing. As mentioned previously, the ITTC has devel-oped procedures for the determination of the powering characteristics of waterjet-propelled vessels, and Hoyt et al. (1999) and the Special-ist Committee on Waterjets for the 22nd ITTC recommended self-propulsion tests, waterjet system tests, and pump tests. In this section, the committee will comment on the usefulness of these three types of waterjet tests for deter-mining the cavitation performance. In addition, the committee will focus much of the discus-sion on how recent advances in CFD can ad-dress the modeling of waterjet cavitation.
Self-Propulsion Tests. Similar to self-propulsion tests for vessels powered by propel-lers, self-propulsion tests for vessels powered by waterjets involve models tested in a towing tank. To measure the model-scale resistance, waterjet testing requires that one conceal the inlets with an appropriately-contoured cover. For waterjet-powered tests, Hoyt et al. (1999) have recommended many additional measure-ments than one would use for propeller-powered tests. Essentially, these measurements allow one to determine the momentum flux and energy flux at several key stations from up-stream of the waterjet through the pump and into the downstream jet.

Specialist Committee on Cavitation
500
Self-propulsion tests are not appropriate for the evaluation of cavitation. Most facilities used for self-propulsion tests cannot be depres-surized—so, one cannot achieve cavitation si-milarity. Even when it is possible to achieve cavitation similarity, cavitation viewing is dif-ficult in the inlet region and almost impossible in the pump region. For well-designed inlets, cavitation should only be an issue at off-design values of the inlet velocity ratio, IVR, (as de-fined in Appendix B) so one would have to at-tempt to view the cavitation at the appropriate values of IVR. Furthermore, operation at an ap-propriate Reynolds number is necessary for ca-vitation testing. For instance, characteristics of a cavitating flow field, such as flow separation, depend on the Reynolds number. The speed of the towing-tank carriage and the small dimen-sions of the waterjet model do not allow for testing at an appropriate Reynolds number. In most cases, the waterjet pump used for self-propulsion tests is not even a scaled model of the actual waterjet pump; it is simply a surro-gate pump that ingests the appropriate mass flow rate.
Waterjet System Tests. Waterjet system tests involve either closed-loop or open-loop experiments of an actual waterjet inlet and pump, without an actual model of the ship hull. While some waterjet system tests involve a uniform inflow, more appropriate tests should incorporate incoming boundary layers—which are ingested through the inlet—that properly represent the hull boundary layer. As pointed out by Hoyt et al. (1999), these tests can ad-dress cavitation observations of the inlet lip and ramp, as well as observations of pump cavitation.
Pump Tests. If one does not have an appro-priate setup to conduct a waterjet system test and if the self-propulsion test is at too small of a Reynolds number or uses a surrogate pump, then historically waterjet designers have relied on tests within a pump loop. One valuable characteristic of pump-loop testing is the abil-ity to change the resistance of the pump loop and operate the pump at a large range of flow
coefficients, allowing the designer to evaluate the off-design characteristics of the pump—from stall at low flow coefficients through the design flow coefficient through high flow coef-ficients, where lower values of static pressure could enhance issues related to cavitation. For-tunately, most waterjets tend to operate at a nearly constant flow coefficient. However, if this operational flow coefficient differs signifi-cantly from the design coefficient, this off-design testing can prove useful.
Hoyt et al. (1999) also feel that pump tests can address how cavitation affects waterjet per-formance, particularly in evaluating cavitation thrust breakdown. Control of the static pressure within the pump loop allows for testing at dif-ferent cavitation numbers. The cavitation num-ber corresponding to a 3% decrease in total-head rise across the pump is commonly used to identify the point of cavitation breakdown. In most pump tests, the pump inflow comes from flow through a pipe or through a bellmouth nozzle, which does not represent the inflow that the pump will ingest within an operational waterjet propulsion system. One could attempt to better model the correct inflow by using properly-designed honeycomb, screens, fins, and/or pipe elbow. In any event, the testing should include a measurement of the pump in-flow.
Computational Fluid Dynamics. While nu-merical modeling of cavitation phenomena has existed for many years, the complexity of wa-terjet systems—for both the physics of the flow fields and the geometry—has historically led organizations to rely on experimental modeling. However, improvements in computational tools and computer power—as well as the high cost and time required for experimental modeling—have recently led organizations to rely more and more on numerical modeling to address cavitation behavior in waterjets. The literature reviews in Appendix B certainly reflect the in-creased use of CFD. And, as reported in previ-ous sections of this report, even more powerful CFD tools are becoming available to investi-gate waterjet cavitation issues.

Proceedings of 25th ITTC – Volume II
501
For cavitation inception, where the volume of the cavitation is a very small percentage of the flow field, one can suitably assume that the existence of the cavitation will have a negligi-ble impact on the flow. Therefore, one can nu-merically model the bulk flow field and then use that simulation as input to numerically model the bubble dynamics, if desired. The si-mulation of the bubble dynamics will not influ-ence the simulation of the bulk flow field.
Numerical analysts have had success in modeling surface (sheet) cavitation inception by solving the RANS equations. Following the proper use of the RANS solver—such as using adequate grid quality—the minimum static-pressure region near a solid surface will corre-spond closely with the region of surface cavita-tion inception. While unsteady flow phenom-ena can alter this result, these types of simula-tions have matched well with experimental re-sults for visual observation of inception.
While RANS simulations have proven suc-cessful in determining the minimum static-pressure region near a surface, they have not been very successful in determining the mini-mum static-pressure region within a vortex core. Obtaining adequate grid resolution within the vortex core is certainly one problem, but the effects of unsteady flow phenomena are an even greater problem, including unsteadiness due to turbulent-flow structures. Traditional turbulence modeling within a RANS solver av-erages out the unsteadiness of these turbulent-flow structures. Therefore, numerical modeling of vortex cavitation inception requires a direct simulation of the larger, energy-containing tur-bulent scales. LES has become a more mature method to model these important turbulent scales, but the computational costs remain pro-hibitively large. However, methods like DES allow one to compute these important turbulent scales only in the areas of interest, reverting to a RANS simulation elsewhere. These types of methods are beginning to make the numerical modeling of vortex cavitation inception possi-ble, but they still remain primarily a research topic.
The most detrimental effect of cavitation within a waterjet involves the breakdown of pump performance parameters such as thrust, torque, and total-head rise. Recent investiga-tions have led to the development of multi-phase flow models using three-dimensional RANS solvers that have shown some promis-ing numerical simulations of cavitation break-down for pumps and propellers. Multiphase flow modelling is further advanced for cavita-tion breakdown, since it is a more global cavi-tation event, not a local event such as cavita-tion erosion. These methods should be utilized in future modeling of cavitation breakdown in waterjet pumps.
The prediction of erosion due to cavitation is very difficult because micro-scale bubble dynamics play an important role. Therefore, numerically modeling the behaviour of cavita-tion erosion is a research topic in its infancy. Researchers have pursued two approaches to this multiphase flow modeling problem. The first approach uses a cavitation model that in-cludes modeling of the micro-scale bubble dy-namics, which estimates the impulsive pressure directly. The second approach models the rela-tionship between the fluctuation of the void fraction and the occurrence of erosion. To date, both approaches have predicted erosion areas that qualitatively agree with experimental data, but much further research is required to achieve quantitative predictions, especially for the complex geometry and flow fields found in a waterjet pump.
7.2 Scaling of Waterjet Cavitation
As discussed previously, and in Appendix B, one attempts to quantify or categorize cavi-tation performance using the cavitation number (or some related parameter). When using ex-perimental modeling to determine the behav-iour of cavitation in a waterjet, test facilities usually dictate the use of model-scale hardware. Unfortunately, the cavitation number that char-acterizes a cavitation phenomenon at model scale may differ for the full-scale prototype

Specialist Committee on Cavitation
502
hardware. These differences result from cavita-tion-scale effects—such as the method of cavi-tation detection (visual or acoustic) and water quality, as describe in depth by Billet et al. (2002) and the Specialist Committee on Water Quality and Cavitation for the 23rd ITTC.
Other cavitation-scale effects can include Reynolds-number effects, geometry effects (such as surface roughness or manufacturing tolerances), turbulence, and the residence time that nucleation sources spend within low-pressure regions of the flow.
The scaling of cavitation inception depends strongly on whether one is concerned with sur-face (sheet) cavitation inception or vortex cavi-tation inception. For experimental models with geometric similarity, one is usually not able to run the model-scale test at the full-scale Rey-nolds number. However, for surface (sheet) cavitation inception, after one accounts for wa-ter-quality effects, Reynolds-number effects may be small and are usually neglected. The exception can be for the Reynolds-number ef-fects on flow separation, which can influence cavitation on a waterjet inlet. However, for a waterjet inlet, dynamic similitude of the incom-ing boundary layer is probably more important than Reynolds-number effects. The biggest problem is that modeling the highly unsteady, three-dimensional boundary layer that a full-scale waterjet ingests at sea is probably impos-sible in a model-scale test facility. For the wa-terjet pump, cavitation inception probably oc-curs in the tip-leakage vortex rather than on the rotor-blade surface, so the Reynolds-number effects on surface cavitation may not be of pri-mary importance anyway.
For vortex cavitation inception, one tradi-tionally scales the inception cavitation number using some form of the equation presented by McCormick (1962),
,
,
Re.
Re
m
i full scale full scale
i model scale model scale
σσ⎛ ⎞ ⎛ ⎞
=⎜ ⎟ ⎜ ⎟⎜ ⎟ ⎜ ⎟⎝ ⎠ ⎝ ⎠
(7.1)
Using this equation as a basis, Billet et al. (1996) and the Cavitation Committee for the 21st ITTC presented an empirical equation for scaling rotor-blade-tip cavitation inception,
( )2
,a tip mL
ref
Wconstant C ReV
σ⎛ ⎞
= ⎜ ⎟⎜ ⎟⎝ ⎠
(7.2)
where LC is the average of the lift coefficients over some finite span of the rotor-blade tip,
tipW is the mean relative velocity at the rotor-blade tip, refV is a reference velocity (such as ship speed), and Re is the Reynolds number based on tipW and the chord length of the ro-tor-blade tip. Billet et al. (1996) gave a theo-retical value of two for the exponent a . Many researchers have suggested empirical values for the proportionality constant and the exponent m . Again, one must also take water-quality effects into account. Each organization has to determine their own empirical exponents and proportionality constant using their own com-parisons between model- and full-scale results.
Billet et al. (2005) and the Specialist Com-mittee on Cavitation Erosion on Propellers and Appendages on High Powered/High Speed Ships for the 24th ITTC presented an extensive overview of scaling effects for cavitation ero-sion. Most efforts to determine this type of scaling concentrate on pitting damage rate and the volume damage rate of controlled samples, with most researchers using the incubation pe-riod of material to analyze the flow and study the scaling effects.
Very little information is available for the Reynolds-number scaling effects for cavitation performance breakdown. Since cavitation breakdown is most often related to surface (sheet) cavitation, Reynolds-number scaling effects for cavitiaton breakdown are normally neglected.
Finally, numerical modeling of the behav-iour of waterjet cavitation should theoretically allow for at least the Reynolds-number scaling effects, since one can use these models to simulate flows at both model-scale and full-

Proceedings of 25th ITTC – Volume II
503
scale Reynolds numbers. However, Appendix B will discuss the issues regarding numerical modeling of waterjet cavitation, and previous sections of this report have discussed these is-sues for cavitation in general. While practitio-ners will continue, and should continue, to em-ploy numerical models to determine the behav-iour of cavitation in waterjets, they need to be aware of the issues in using these models.
8 SUMMARY AND CONCLUSIONS
The 25th ITTC Specialist Committee on Cavitation reviewed the methods of predicting cavitation performance, a review that included a survey of the worldwide cavitation commu-nity. As confirmed by organizations that re-sponded to the survey, experimental methods and model-scale testing still offer a primary method for predicting cavitation performance. Recent improvements have enhanced these ex-perimental methods.
Particle image velocimetry (PIV) has be-come a mature technology for measuring non-cavitating flow fields, such as the inflows of propellers and rudders. With improved accu-racy, PIV has become extremely useful in vali-dating and supporting computational methods used for both non-cavitating and cavitating flows. Some very recent work has also in-volved using PIV with cavitation bubbles in the flow field. Improvements in nuclei measure-ments such as the use of interferometry have also been used in conjunction with PIV meas-urements.
For cavitating flows, improvements in high-speed video have aided the evaluation of un-steady pressure pulses, cavitation erosion, and cavity interactions. Also, the improved use of boroscopes during full-scale cavitation testing has enhanced the correlations with the model-scale testing used to predict cavitation per-formance.
Several computational methods have been used for a number of years to predict cavitation performance, methods that impact design and
have been coupled with experimental models. These computational methods include empiri-cal methods, potential-flow methods, and sin-gle-phase RANS solvers including techniques that couple different methods together. For in-stance, some groups in the cavitation commu-nity couple RANS solvers with potential-flow methods, and some couple RANS solvers with empirical methods.
While the methodology of potential-flow and single-phase RANS solvers have become quite mature, some groups have applied these methods to more and more complex applica-tions. For instance, some groups have applied potential-flow methods to propeller flow fields interacting with a downstream rudder. Single-phase RANS solvers have become quite com-mon, much easier to use, and show excellent results for simple flows. For more complex flows with many scales, analysts should pro-ceed with caution using single-phase RANS solvers—since issues can arise regarding com-putational grids, turbulence models, and scale dissipation. For instance, the use of single-phase RANS solvers to accurately evaluate the static pressure within the core of a tip vortex can be very challenging, if not impossible.
Researchers have made significant strides in developing multiphase flow models for RANS solvers, and now most commercial RANS codes also have incorporated these models. However, RANS solvers with multi-phase flow models have undergone very little validation, primarily because of a lack of qual-ity experimental data. In fact, it is probably still premature to use these tools for the current pre-diction of full-scale cavitation performance on propellers and rudders. As more validation-quality experiments are performed in the future and compared with multiphase flow RANS si-mulations, these tools will become more ma-ture.
Many flows, such as tip vortices, require better resolution of the turbulent structures. Researchers have made great progress in using large eddy simulation (LES) and detached eddy

Specialist Committee on Cavitation
504
simulation (DES) to compute these flows. In the future, these computational methods will improve the prediction of vortex cavitation in-ception. Regarding unsteady cavitation, some researchers have just begun to use these ad-vanced computational methods with multiphase flow models.
Clearly, several methods exist for predict-ing cavitation performance. However, cavita-tion performance includes different phenomena. For the inception of surface cavitation, most groups use single-phase RANS solvers or mod-el-scale testing to obtain the correct inflow. With this correct inflow, many groups use po-tential-flow methods to predict surface cavita-tion inception. With the ability to simulate vis-cous-flow interactions, single-phase RANS solvers can offer improved predictions.
For the inception of vortex cavitation, many groups still use model-scale testing and an em-pirical scaling method to predict full-scale per-formance. Also, other groups use single-phase RANS solvers to compute parameters, such as propeller blade tip loading, and then use em-pirical methods to predict full-scale perform-ance. Improvements in scaling methods and empirical methods will require more full-scale inception tests. Direct modeling of vortex cavi-tation inception will require better resolution of turbulent structures and flow unsteadiness, which may require methods such as LES or DES rather than RANS solvers.
The prediction of full-scale pressure fluc-tuations still relies almost exclusively on model-scale testing. While computational methods do quite well in simulating surface cavity areas, these methods are not yet ready to predict surface-cavitation-driven pressure fluc-tuations. Vortex-cavitation-driven pressure fluctuations are even more difficult to predict. Clearly, more validation-quality experiments are needed.
To predict cavitation erosion, all groups still utilize model-scale testing. Improvements in the use of high-speed video have helped to
examine surface cavities and indicate the exis-tence of fluctuations in void fraction. Experi-ence is still necessary in correlating model-scale testing with full-scale erosion. Computa-tionally, researchers have developed multi-phase flow models to predict cavitation erosion. However, further research is required to achieve quantitative predictions.
Extensive cavitation leads to a major dete-rioration of thrust, torque, and total-head rise for propellers, waterjets, and pumps—referred to as cavitation breakdown. Most designers still use rules and empirical knowledge—and then make their final predictions using model-scale tests. Recent developments in using RANS solvers with multiphase flow models have made great advances, including compari-sons with experimental data. In fact, some groups are now beginning to use these methods for the prediction of cavitation breakdown.
In addition to reviewing methods for pre-dicting cavitation performance, the 25th ITTC Specialist Committee on Cavitation addressed cavitation behavior and the subsequent model-ing of that behavior for the specific applica-tions of rudders and waterjets. Billet et al. (2005) and the Specialist Committee on Cavi-tation Erosion on Propellers and Appendages on High Powered/High Speed Ships for the 24th ITTC previously addressed the key cavitation issue on rudders, namely cavitation erosion. Here, the 25th ITTC Specialist Committee on Cavitation extended this topic to cavitation on unconventional rudders and rudders down-stream of highly-loaded propellers.
As discussed previously groups still utilize model-scale testing to predict cavitation ero-sion. On unconventional rudders and rudders downstream of highly-loaded propellers, one should test the complete unit of rudder and propeller, with a realistic propeller inflow, preferably generated by a complete ship model itself. Also, one should correctly model sharp edges and gaps. While one needs to test with a local Reynolds number of greater than 300,000, obtaining the correct local gap cavitation phe-

Proceedings of 25th ITTC – Volume II
505
nomena is still very challenging at model scale. Larger-scale part models may be necessary. In addition, one should investigate a wide range of rudder angles at model scale to satisfactorily evaluate cavitation erosion at full scale. Finally, high-speed video, improvements in the soft-ink method, and more full-scale cavitation obser-vations will improve the prediction of cavita-tion erosion in the future.
While progress has been made, researchers have yet to develop a universally-accepted nu-merical method to predict cavitation erosion. Designers of rudders use empirical methods, potential-flow methods, and single-phase RANS solvers to obtain indirect information that guides their designs. However, model-scale testing is still necessary to predict rudder cavitation erosion.
Since the ITTC has never focused on water-jet cavitation issues, the 25th ITTC Specialist Committee on Cavitation provided a detailed summary of cavitation issues for the different components of a waterjet. The most critical ca-vitation issue for a waterjet involves cavitation breakdown of the pump, leading to a signifi-cant reduction in thrust. While cavitation breakdown can occur for high-speed operation, it may also occur at lower vehicle speeds and prevent the vehicle from getting over the “hump” created by high wave resistance and obtaining the desired high-speed operation. Cavitation erosion of the pump blades—which are normally manufactured using stainless steel to increase operational life—can also be an im-portant issue. Cavitation vibration leading to blade fatigue—and cavitation noise can also be issues.
Cavitation can occur within a waterjet inlet as well. Waterjets that are well designed (or well matched) to operate with a given hull should only experience inlet cavitation when one operates the waterjet at an inlet velocity ratio (IVR) different from the design value. For these off-design values of IVR, flow separation and cavitation can occur on the inlet lip, or cutwater, and on the roof of the inlet.
Pump testing offers the most common me-thod to predict pump cavitation breakdown, although the use of RANS solvers with multi-phase flow models are beginning to be used. Without the proper pump inflow, these pump tests are problematic to evaluate cavitation ero-sion and useless for evaluating cavitation vi-bration and noise. Waterjet system tests are used to observe inlet cavitation at various val-ues of IVR and—depending on the test setup—to observe pump cavitation. Waterjet self-propulsion tests in a towing tank are not useful for cavitation testing.
Little specific information is available for waterjet cavitation issues, especially compari-sons between full-scale data, model-scale data, and computational methods. In fact, most ship-yards and model basins have not been asked to provide predictions of cavitation performance for waterjets. Instead, commercial waterjet manufacturers generally provide all design, analysis, and testing methods and results, espe-cially with regard to cavitation performance—and for competitive reasons, these manufac-tures have been quite secretive.
9 RECOMMENDATIONS
The 25th ITTC Specialist Committee on Cavitation recommends that organizations adopt two new procedures and guidelines: (1) 7.5-02-03-03.7 on the “Prediction of Cavitation and Erosion Damage for Unconventional Rud-ders or Rudders behind Highly-Loaded Propel-lers” and (2) 7.5-02-03-03.8 on the “Modeling the Behavior of Cavitation in Waterjets.”
10 REFERENCES
Abels, W., 2006, “Reliable Prediction of Pro-peller Induced Pulses on the Aftbody By Correlation Direct Calculation,” Sixth In-ternational Symposium on Cavitation, CAV2006, Wageningen, The Netherlands.
Ait-Bouziad, Y., Farhat, M., Kueny, J.-L., Gueninoun, F., Avellan, F., and Miyagawa, K., 2003, “Physical Modeling and Simula-

Specialist Committee on Cavitation
506
tion of Leading Edge Cavitation, Applica-tion to an Industrial Inducer,” Fifth Interna-tional Symposium on Cavitation (CAV2003), OS-6-014.
Arndt, R. E. A., Long, D. F., and Glauser, M. N., 1997, “Proper Orthogonal Decomposi-tion of Pressure Fluctuations Surrounding a Turbulent Jet,” Journal of Fluid Mechanics, Vol. 340, pp. 1-33.
Atsavapranee, P., Carneal, J., Etebari, A., and Percival, S., 2007, “Applications of Stereo Particle Image Velocimetry (SPIV) in Na-val Hydrodynamics,” 28th American Tow-ing Tank Conference, Univ. of Michigan, Ann Arbor.
Bachert, B., Ludwig, G., Stoffel, B., and Baumgarten, S., 2005, “Comparison of Dif-ferent Methods for the Evaluation of Cavi-tation Damaged Surfaces,” Proceedings of the 2005 ASME Fluids Engineering Divi-sion Summer Meeting, FEDSM2005, pp. 553-560.
Bakir, F., Mejri-Chtioui, I., Kouidri, S., and Rey, R., 2003, “Hub Shape Effects under Cavitation on the Inducers Performance,” Fifth International Symposium on Cavita-tion (CAV2003), OS-6-001.
Billet, M. L. (Chairman), 1996, “Report of the Cavitation Committee,” 21st ITTC, Trond-heim, Norway, pp. 63-126.
Billet, M. L. (Chairman), 2002, “Report of the Specialist Committee on Water Quality and Cvaitation,” 23rd ITTC, Venice, Italy, pp. 459-491.
Billet, M. L. (Chairman), 2005, “Report of the Specialist Committee on Cavitation Erosion on Propellers and Appendages on High Powered/High Speed Ships,” 24th ITTC, Edinburgh, United Kingdom, Vol. II, pp. 509-542.
Black, S., 2007, “Thrust Breakdown Character-istics of Conventional Propellers,” Hydro-mechanics Departmental Report, NSWCCD-50-TR-2007/064.
Bulten, N. and Oprea, A. I, 2006, “Evaluation of McCormick's Rule for Propeller Tip Vortex Cavitation Inception Based on CFD Results,” Sixth International Symposium on
Cavitation (CAV2006), Wageningen, The Netherlands, Paper No. 28.
Burrill, L. C., 1943, “Developments in Propel-ler Design and Manufacture for Merchant Ships,” Transactions, Institute of Marine Engineers, London, Vol. 55.
Burrill, L. C. and Emerson, A., 1963, “Propel-ler Cavitation: Further Tests on 16in. Pro-peller Models in the King’s College Cavita-tion Tunnel,” Transactions of the North East Coast Institution of Engineers and Ship Builders, Vol. 78, pp. 295-320.
Calcagno, G., Di Felice, F., Felli, M., and Pe-reira, F., 2005, “A Stereo PIV Investigation of a Propeller’s Wake behind a Ship Model in a Large Free Surface Water Tunnel,” Marine Technology Society Journal, Vol. 39, No. 2.
Carlton, J. S., and Fitzsimmons, P. A., 2006, “Full Scale Cavitation Observations Relat-ing to Propeller Cavitation,” Sixth Interna-tional Symposium on Cavitation, CAV2006, Wageningen, The Netherlands.
Chahine, G. L., and Kalumuck, K., 2003, “De-velopment of a Near Real Time Instrument for Nuclei Measurement: the ABS Acoustic Bubble Spectrometer,” International Sym-posium on Cavitation Inception, Proceed-ings of FEDSM ’03, Fourth ASME-JSME Joint Fluids Engineering Conference, Honolulu, HI.
Coutier-Delgosha, O., Fortes-Petella, R., Re-boud, J. L., and Pouffary, B., 2002, “3D Numerical Simulation of Pump Cavitating Behavior,” Proceedings of the 2002 ASME Fluids Engineering Division Summer Meet-ing, Montreal, Quebec, Canada.
Courtier-Delgosha, O. C., and Astolfi, J. A., 2003, “Numerical Prediction of the Cavitat-ing Flow on a Two-Dimensional Symmet-rical Hydrofoil With a Single Fluid Model,” Fifth International Symposium on Cavita-tion (CAV2003), OS-1-013.
Coutier-Delgosha, O. C., Fortes-Patella, R. F., and Reboud, J. L., 2003a “Evaluation of the Turbulence Model Influence on the Nu-merical Simulation of Unsteady Cavita-tion,” Transactions of the ASME, Journal

Proceedings of 25th ITTC – Volume II
507
of Fluid Engineering, Vol. 125, No. 1, pp.38–46.
Coutier-Delgosha, O., Perrin, J., Fortes-Patella, R., and Reboud, J. L., 2003b, “A Numerical Model to Predict Unsteady Cavitating Flow Behaviour in Inducer Blade Cascades,” Fifth International Symposium on Cavita-tion (CAV2003), OS-4-005.
Coutier-Delgosha, O. C., Reboud, J. L., and Delannoy, Y., 2003c, “Numerical Simula-tion of the Unsteady Behaviour of Cavitat-ing Flows,” International Journal for Nu-merical Methods in Fluids, Vol. 42, pp.527–548.
Damaschke, N., Nobach, H., and Tropea, C., 2006, “Global Phase Doppler Technique for Size and Velocity Measurements,” DLR-Mitteilung, No. 3, pp. 1055-1067.
Dang, J., 2004, “Improving Cavitation Per-formance with New Blade Sections for Ma-rine Propellers,” International Shipbuilding Progress, Vol. 51, No. 4, pp. 353-376.
Di Felice, F., Di Florio, D., Felli, M., and Ro-mano, G. P, 2004, “Experimental Investiga-tion of the Propeller Wake at Different Loading Conditions by Particle Image Ve-locimetry,” Journal of Ship Research, Vol. 48, No. 2.
Dreyer, J. J., Koncoski, J. J., Zierke, W. C., and Willits, S. M., 2006, “Experimental Verifi-cation of Blade-Shape Optimization for Improved Off-Design Cavitation Perform-ance,” Proceedings of the Eleventh Interna-tional Symposium of Transport Phenomena and Dynamics of Rotating Machinery (IS-ROMAC-11), Honolulu, Hawaii, USA.
Dular, M., Bachert, R., Stoffel, B., and Sirok, B., 2003, “Numerical and Experimental Study of Cavitating Flow on 2D and 3D Hydrofoils,” Fifth International Symposium on Cavitation (CAV2003), GS-9-011.
Dular., M., Bachert, R., and Stoffel, B., 2006a, “Experimental and Numerical Investigation of Swept Leading Edge Influence on the Developed Cavitation,” Sixth International Symposium on Cavitation (CAV2006), Wageningen, The Netherlands, Paper No. 102.
Dular, M., Širok, B. and Stoffel, B., 2006b, “Experimental and Numerical Modelling of Cavitation Erosion,” Sixth International Symposium on Cavitation (CAV2006), Wageningen, The Netherlands, Paper No. 55.
Dupont, P. and Casartelli, E., 2002, “Numeri-cal Prediction of the Cavitation in Pumps,” Proceedings of the 2002 ASME Fluids En-gineering Division Summer Meeting, Montreal, Quebec, Canada.
Edge. B., 2007, “An Analytical and Numerical Study of Cavitation Scale Effects in High-Reynolds Number Circular Jet Flows,” Ph.D. Dissertation, Department of Me-chanical Engineering, The Pennsylvania State University.
Escaler, X., Farhat, M., Egusquiza, E., and Avellan, F., 2007, “Dynamics and Intensity of Erosive Partial Cavitation,” ASME Jour-nal of Fluids Engineering, Vol. 129, pp. 886-893.
Falcao de Campos, J., Vaz, G., and Bosschers, J., 2006, “Influence of the Reduced Fre-quency on the 2-D Partial Sheet Cavitation Behavior for a Foil in a Gust,” Sixth Inter-national Symposium on Cavitation (CAV2006), Wageningen, The Netherlands, Paper No. 113.
Felli, M., Di Felice, F., Guj, G., and Camussi, R., 2006, “Analysis of the Propeller Wake Evolution by Pressure and Velocity Phase Measurements,” Experiment in Fluids, Vol. 41, pp. 441-451.
Fine, N. E. and Kinnas, S. A., 1993, “A Boun-dary-Element Method for the Analysis of the Flow around 3-D Cavitating Hydrofoils, Journal of Ship Research, Vol. 37, pp. 213-224.
Flores, N. G., 2006, “Head Drop of Spatial Turbopump Inducer,” Sixth International Symposium on Cavitation (CAV2006), Wageningen, The Netherlands, Paper No. 108.
Foeth, E.-J., and Terwisga, T. van, 2006, “The Structure of Unsteady Cavitation: Part II Applying Time-Resolved PIV to Attached Cavitation,” Sixth International Symposium

Specialist Committee on Cavitation
508
on Cavitation, CAV2006, Wageningen, The Netherlands.
Friesch, J., 2006, “Rudder Erosion Damages Caused by Cavitation,” 6th International Symposium on Cavitation (CAV2006), Wageningen, The Netherlands, Invited Pa-per.
Frobenius, M., Schilling, R., Friedrichs, J., and Kosyna, G., 2002, “Numerical and Experi-mental Investigations of the Cavitating Flow in a Centrifugal Pump Impeller,” Pro-ceedings of the 2002 ASME Fluids Engi-neering Division Summer Meeting, Mont-real, Quebec, Canada.
Frobenius, M., Schilling, R., Bachert, R., Stof-fel, B., and Ludwig, G., 2003, “Three-Dimensional Unsteady Cavitation Effects on a Single Hydrofoil and in a Radial Pump - Measurements and Numerical Simula-tions: Part Two: Numerical Simulation,” Fifth International Symposium on Cavita-tion (CAV2003), GS-9-004.
Fry, D. J., 2007, “Scanning LDV for Tow Tank Wake Surveys,” 28th American Towing Tank Conference, University of Michigan, Ann Arbor.
Fukaya, M., Okamura, T., Tamura, Y., and Matsumoto, Y., 2003, “Prediction of Cavi-tation Performance of Axial Flow Pump by Using Numerical Cavitating Flow Simula-tion with Bubble Flow Model,” Fifth Inter-national Symposium on Cavitation (CAV2003), OS-6-012.
Fukaya, M., Tamura, Y., and Matsumoto, Y., 2006, “Prediction of Cavitation Intensity and Erosion in Centrifugal Pump Based on Detailed Bubble Behavior Simulated Using Bubble Flow Model,” The 11th Interna-tional Symposium on Transport Phenomena and Dynamics of Rotating Machinery (IS-ROMAC-11), Honolulu, Hawaii.
Han K-J., Bark, G., Larsson, L., and Regn-strom, B., 2006, “A Procedure for Optimiz-ing Cavitating Propeller Blades in a Given Wake,” Ship Technology Research, Vol. 53, No. 1, pp. 39-52.
Hosangadi, A., Ahuja, V., and Ungewitter R. J., 2006, “Numerical Study of a Flat Plate In-ducer: Comparison of Performance in Liq-
uid Hydrogen and Water,” Sixth Interna-tional Symposium on Cavitation (CAV2006), Wageningen, The Netherlands, Paper No. 82.
Hoyt III, J. G. (Chairman), 1999, “Report of the Specialist Committee on Waterjets,” 22nd ITTC, Seoul, South Korea and Shang-hai, China, pp. 587-613.
Hsiao, C.-T. and Chahine, G., 2004, “Predic-tion of Tip Vortex Cavitation Inception Us-ing Coupled Spherical and Nonspherical Bubble Models and Navier–Stokes Compu-tations,” Journal of Marine Science and Technology, Vol. 8, No. 3, pp. 99-108.
Huuva, T., 2008, “Large Eddy Simulation of Cavitating and Non-Cavitating Flow,” Ph.D. Thesis, Department of Shipping and Marine Technology, Chalmers University of Tech-nology, Göteborg, Sweden.
Iga, Y., Nohmi, M., and Goto, A., 2003, “Nu-merical Study of Sheet Cavitation Breakoff Phenomenon on a Cascade Hydrofoil,” Transactions of the ASME, Journal of Flu-ids Engineering, Vol. 125, No. 4, pp. 643-652.
Iga, Y., Nohml, M., and Goto, A., 2004, “Nu-merical Analysis of Cavitation Instabilities Arising in the Three-Blade Cascade,” Transactions of the ASME, Journal of Flu-ids Engineering, Vol. 126, No. 3, pp. 419-430.
Jessup, S. D (Chairman), 2002, “Report of the Propulsion Committee,” 23rd ITTC, Venice, Italy, Vol. I, pp. 99-151.
Kawamura, T. and Sakoda, M., 2003, “Com-parison of Bubble and Sheet Cavitation Models for Simulation of Cavitating Flow over a Hydrofoil,” Fifth International Sym-posium on Cavitation (CAV2003), OS-1-008.
Kawamura, T., Takekosi, Y., Yamaguchi, Y., Minowa, T., Maeda, M., Fujii, A., Kimura, K., and Taketani, T., 2006, “Simulation of Unsteady Cavitating Flow around Marine Propeller Using a RANS CFD Code,” Sixth International Symposium on Cavitation (CAV2006), Wageningen, The Netherlands, Paper No. 173.

Proceedings of 25th ITTC – Volume II
509
Kawamura, T. and Kiyokawa, T., 2008, “Nu-merical Prediciton of Hull Surface Pressure Fluctuation Due to Propeller Cavitation,” Conference Proceedings of the Japan Soci-ety of Naval Architects and Ocean Engi-neers, Nagasaki, Japan, No. 6.
Kehr, Y-Z., and Kao, J-H., 2005, “Numerical Prediction of the Blade Rate Noise Induced by Marine Propellers,” Journal of Ship Re-search, Vol. 48, No. 1, pp. 1-14.
Kim, J., Paterson, E. G., and Stern, F., 2006, “RANS Simulation of Ducted Marine Pro-pulsor Flow Including Subvisual Cavitation and Acoustic Modeling,” Transactions of the ASME, Journal of Fluids Engineering, Vol. 128, No. 4, pp. 799-811.
Kimura, T., Yoshida, Y., Hashimoto, T., and, Shimagaki, M., 2006, “Numerical Simula-tion for Unsteady Cavitating Flow in a Tur-bopump Inducer,” Sixth International Sym-posium on Cavitation (CAV2006), Wagen-ingen, The Netherlands, Paper No. 41.
Kinnas, S. A., Lee, H., Sun, H., and He, L., 2007, “Performance Prediction of Single or Multi-Component Propulsors Using Cou-pled Viscous/Inviscid Methods,” 10th In-ternational Symposium on Practical Design of Ships and Other Floating Structures (PRADS), American Bureau of Shipping, Houston, TX, U.S.A.
Koronowicz, T., and Szantyr, J. A., 2006, “Vortex Cavitation as a Source of High Level Acoustic Pressure Generated by Ship Propellers,” Acta Acustica united with Acustica, Vo. 92, pp. 175-177.
Kunz, R. F, Lindau, J. W., Peltier, L. J., and Kaday, T. A., 2003, “Detached Eddy Simu-lation of Developed Cavitating Flows,” Fifth International Symposium on Cavita-tion (CAV2003), OS-1-012.
Lee, S-K., and Chen, H-C., 2005, “The Influ-ence of Propeller/Hull Interaction on Pro-peller Induced Cavitating Pressure,” Pro-ceedings of the 15th International Offshore and Polar Engineering Conference, Seoul, Korea, pp. 596-603.
Lee, H., and Kinnas, S. A., 2004, “Application of a Boundary Element Method in the Pre-diction of Unsteady Blade Sheet And De-
veloped Tip Vortex Cavitation on Marine Propellers,” Journal of Ship Research, Vol. 48, No. 1, pp. 15-30.
Leroux, J.-B., Coutier-Delgosha, O., Astolfi, J. A., 2003, “A Joint Experimental and Nu-merical Study of Mechanisms Associated to Instability of Partial Cavitation on Two-Dimensional Hydrofoil,” Fifth International Symposium on Cavitation (CAV2003), GS-9-006.
Leroux, J. B., Coutier-Delgosha, O., and As-tolfi, J. A., 2005, “A Joint Experimental and Numerical Study of Mechanisms Asso-ciated to Instability of Partial Cavitation on Two-Dimensional Hydrofoil,” Physics of Fluids, Vol. 17, No. 5, p. 52101.
Li, D.-Q., 2006, “Validation of RANS Predici-tons of Open Water Performance of a High-ly Skewed Propeller with Experiments,” Conference of Global Chinese Scholars on Hydrodynamics (CCSH).
Ligtelijn, J. T., Wijngaarden, H. C. J. van, Moulijn, J. C., and Verkuyl, J. B., 2004, “Correlation of Cavitation: Comparison of Full-Scale Data with Results of Model Tests and Computations,” Transactions of the Society Of Naval Architects and Marine Engineers, Vo. 112, pp. 80-110.
Lindau, J. W., Boger, D. A., Medvitz, R. B., and Kunz, R. F., 2005, “Propeller Cavita-tion Breakdown Analysis,” Journal of Flu-ids Engineering, Vol. 127, pp. 995-1002.
Longo, J., Gui, L., and Stern, F., 2004, “Ship Velocity Fields,” Chapter 3: PIV and Water Waves, Advances in Costal and Ocean En-gineering, Vol. 9, World Scientific, pp. 119-180.
McCormick, B. W., 1962, “On Cavitation Pro-duced by a Vortex Trailing from a Lifting Surface,” Journal of Basic Engineering, Transactions of the American Society of Mechanical Engineers (ASME), pp. 369-379.
Miller, W. and Wilczynski, L., 2006, “Model - Full Scale Correlations of the Cavitation Erosion of Ship Propeller and Rudder - a Container Vessel Study,” Sixth Interna-tional Symposium on Cavitation

Specialist Committee on Cavitation
510
(CAV2006), Wageningen, The Netherlands, Paper No. 124.
Nohmi, M., Goto, A., Iga, Y., and Ikohagi, T., 2003, “Cavitation CFD in a Centrifugal Pump,” Fifth International Symposium on Cavitation (CAV2003), OS-4-010.
Oberkampf, W. L., Trucano, T. G., and Hirsch, C., 2004, “Verification, Validation, and Predictive Capability in Computational En-gineering and Physics,” Applied Mechanics Review, Vol. 57, No. 5, pp. 345-384.
Okita, K., Matsumoto, Y., and Kamijo, K., 2003, “Numerical Analysis for Unsteady Cavitating Flow in a Pump Inducer,” Fifth International Symposium on Cavitation (CAV2003), OS-4-012.
Oweis, G. F., and Ceccio, S. L., 2005, “Instan-taneous and Time-Averaged Flow Fields of Multiple Vortices in the Tip Region of a Ducted Propulsor,” Experiments in Fluids, Vol. 38, pp. 615-635.
Palero, V., Lobera, J., and Arroyo, M. P., 2005, “Digital Image Plane Holography (DIPH) for Two-Phase Flow Diagnostics in Multi-ple Planes,” Experiments in Fluids, Vol. 39, No. 2, pp. 397-406.
Patella, R. F., Reboud, J. L., and Archer, A., 2000, “Cavitation Damage Measurement by 3D Laser Profilometry,” Wear, Vol. 246, Nov. pp. 59-67.
Patella, R. F. and Reboud, J.-L., 2006, “Ex-periments and Modelling of Cavitating Flows in Venturi Part II: Unsteady Cavita-tion,” Sixth International Symposium on Cavitation (CAV2006), Wageningen, The Netherlands, Paper No. 109.
Pereira, F., Salvatore, F., Di Felice, F., 2004, “Measurement and Modeling of Propeller Cavitation in Uniform Inflow,” Journal of Fluids Engineering, Transactions of the ASME, Vol. 126, No. 4, pp. 671-679.
Persson, T., Bark, G., Bensow, R., Berchiche, N., and Fureby, C., 2006, “Large Eddy Simulation of the Cavitating Flow around a Wing Section,” Sixth International Sympo-sium on Cavitation (CAV2006), Wagenin-gen, The Netherlands, Paper No. 45.
Philipp, A., and Lauterborn, W., 1988, “Dam-age of Solid Surfaces by Single Laser-Produced Cavitation Bubbles,” Acta Acus-tica, Vol. 83, No. 2, pp. 223-227.
Pouffary, B., Fortes-Patella, R., and J.-L. Re-boud, J.-L., 2003, “Numerical Simulation of Cavitating Flow around a 2D Hydrofoil: A Barotropic Approach”, Fifth Interna-tional Symposium on Cavitation (CAV2003), OS-1-005.
Qin, Q., Song, C. C. S., and Arndt, R. E. A, 2003, “A Virtual Single-Phase Natural Ca-vitation Model and Its Application to CAV2003 Hydrofoil,” Fifth International Symposium on Cavitation (CAV2003), OS-1-004.
Rhee, S. H., Kawamura, T., and Li, H., 2005, “Propeller Cavitation Study Using an Un-structured Grid Based Navier-Stoker Solv-er,” Transactions of the ASME, Journal of Fluids Engineering, Vol. 127, pp. 986-994.
Rhee, S. H., Oh, J.-K., Lee, S.-H., and Kim, H., 2007, “Development of Rudder Cavitation Suppression Devices and its Concept Veri-fication through Experimental and Numeri-cal Studies,” 10th International Symposium on Practical Design of Ships and other Floating Structures (PRADS), Houston, Texas.
Rolland, J., Boitel, G., Barre, S., Goncalves, E., and Patella, R. F., 2006, “Experiments and Modelling of Cavitating Flows in Venturi Part I: Stable Cavitation,” Sixth Interna-tional Symposium on Cavitation (CAV2006), Wageningen, The Netherlands, Paper No. 110.
Saito, Y., Nakamori, I., Ikohagi, T., 2003, “Numerical Analysis of Unsteady Vaporous Cavitating Flow around a Hydrofoil,” Fifth International Symposium on Cavitation (CAV2003), OS-1-006.
Seol, H., Suh, J–C., and Lee, S., 2005, “Devel-opment of Hybrid Method for the Predic-tion of Underwater Propeller Noise,” Jour-nal of Sound and Vibration, Vol. 288, No. 1-2, pp. 345-360.
Shaw, S. J., Schiffers, W. P., Gentry, T. P., and Emmony, D. C., 2000, “The Interaction of a Laser-Generated Cavity with a Solid Boun-

Proceedings of 25th ITTC – Volume II
511
dary,” Journal of the Acoustical Society of America, Vol. 107, No. 6, pp. 3065-3072.
Shen, Y. T., Jessup, S. D., and Gowing, S. 2001, “Tip Vortex Cavitation Inception Logarithmic Scaling,” NSWCCD-50-TR-2001/060, Oct. 2001.
Singhal, A.K., Athavale, M.M., Li, H.Y., Ji-ang, Y., 2002, “Mathematical Basis and Validation of the Full Cavitation Model,” Journal of Fluids Engineering, Vol. 124, pp. 617-624.
Soyama, H., Lichtarowicz, A., Momma, T., and Williams, E. J., 1998, “A New Calibra-tion Method for Dynamically Loaded Transducers and Its Application to Cavita-tion Impact measurement,” Transactions of the ASME, Vol. 120, pp. 712-718.
Spalart, P. R. and Allmaras, S. R., 1994, “One-Equation Turbulence Model for Aerody-namic Flows,” La Recherche Aerospatiale, No. 1, pp. 5-21.
Streckwall, H., and Salvatore, F., 2007, “Re-sults from the Wageningen 2007 Workshop on Propeller Openwater Calculations In-cluding Cavitation,” Virtue, Workshop On Propeller RANS Calculations, Conditions and Requested Results for Non-Cavitating and Cavitating RANS Analysis of INSEAN Propeller E779A (Version 4), Wageningen, Netherlands.
Takekoshi, Y., Kawamura, T., Yamaguchi, H., Maeda, M., Ishi, N., Kimura, K., Taketani, T., and Fuji, A., 2005, “Study on the De-sign of Propeller Blade Sections using the Optimization Algorithm,” Journal of Ma-rine Science and Technology, Vol. 10, No. 2, pp. 70-81.
Takekoshi, Y. and Kawamura, T., 2006, “Comparison of Cavitation Models for Si-mulation of Cavitating Flow over a Hydro-foil,” Sixth International Symposium on Cavitation (CAV2006), Wageningen, The Netherlands, Paper No. 174.
van derHout, I., Tukker, J., and Gent, A., van, 2006, “New Developments on Full Scale Cavitation Observations,” Sixth Interna-tional Symposium on Cavitation, CAV2006, Wageningen, The Netherlands.
van Rijsbergen, M. X. and van Terwisga, T. J. C., 2000, “On the Maximum Thrust Den-sity of Propellers,” NCT’50 International Conference on Propeller Cavitation, New-castle, United Kingdom, pp. 97-119.
van Wijngaarden, H. C. J. van, Brouwer, J., and Zijlstra, M.., 2006, “A Spatial Extrapo-lation Technique for Sparse Measurements of Propeller-Induced Hull Pressures Using an Inverse Acoustic Boundary Element Me-thod,” Sixth International Symposium on Cavitation (CAV2006), Wageningen, The Netherlands, Paper No. 93.
Wang, Y. C., Huang, C. H., Lee, Y. C., and Tsai, H. H., 2006, “Development of a PVDF Sensor Array for Measurement of the Pressure Generated by Cavitation Bub-ble Collapse,” Experiments in Fluids, Vol. 41, pp. 365-373.
Wang, G. and Ostoja-Starzewski, M., 2007, “Large Eddy Simulation of a Sheet/Cloud Cavitation on a NACA0015 Hydrofoil,” Applied Mathematical Modelling, Vol. 31, No. 3, pp. 417-448.
Watanabe, T., Kawamura, T., Takekoshi, Y., Maeda, M., and Rhee, S.-H., 2003, “Simu-lation of Steady and Unsteady Cavitation on a Marine Propeller using a RANS CFD code,” Fifth International Symposium on Cavitation (CAV2003), GS-12-004.
Wienken, W., Stiller, and J., Keller, 2006, “A Method to Predict Cavitation Inception Us-ing Large-Eddy Simulation and its Applica-tion to the Flow Past a Square Cylinder,” Transactions of the ASME, Journal of Flu-ids Engineering, Vol. 128, No. 2, pp. 316-326.
Wosnik, M. and Arndt, R. E. A., 2006, “Identi-fication of Large Scale Structures in the Wake of Cavitating Hydrofoils Using LES and Time Resolved PIV,” Sixth Interna-tional Symposium on Cavitation (CAV2006), Wageningen, The Netherlands, Paper No. 67.
Wu, J., Utturkar, Y. and Shyy, W., 2003 “As-sessment of Modeling Strategies for Cavi-tating Flow around a Hydrofoil,” Fifth In-ternational Symposium on Cavitation (CAV2003), OS-1-007.

Specialist Committee on Cavitation
512
Yamada, H., Yoshida, Y., Shimagaki, M., Wa-tanabe, M., Hasegawa, S., Hashimoto, T., Kimura, T., and Uchiumi, M., 2003, “Per-formance of a Tandem Inducer under Non-cavitating and Cavitating Conditions,” Fifth International Symposium on Cavitation (CAV2003), OS-4-008.
Xiong, Y. L., Gao, Y., and An, W. G., 2006, “Comparisons of Turbulence Models in Predicting Unsteady Supercavitating Flow,” Sixth International Symposium on Cavitation (CAV2006), Wageningen, The Netherlands, Paper No. 25.
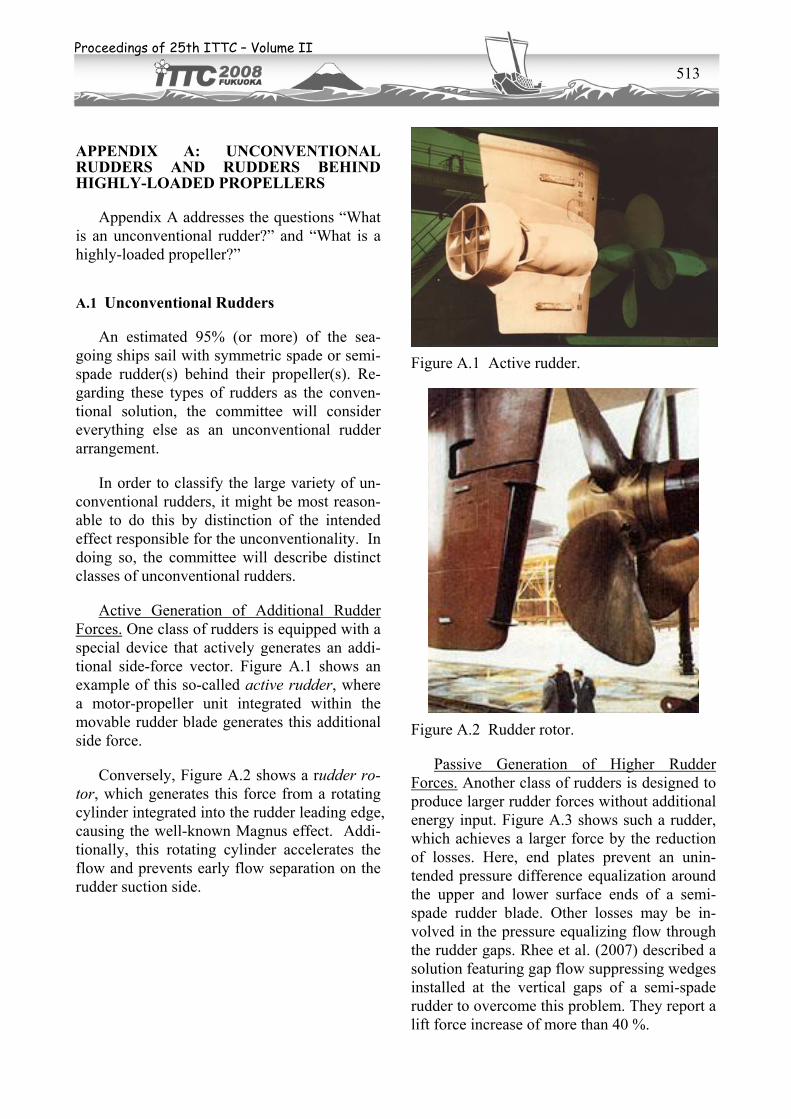
Proceedings of 25th ITTC – Volume II
513
APPENDIX A: UNCONVENTIONAL RUDDERS AND RUDDERS BEHIND HIGHLY-LOADED PROPELLERS
Appendix A addresses the questions “What is an unconventional rudder?” and “What is a highly-loaded propeller?”
A.1 Unconventional Rudders
An estimated 95% (or more) of the sea-going ships sail with symmetric spade or semi-spade rudder(s) behind their propeller(s). Re-garding these types of rudders as the conven-tional solution, the committee will consider everything else as an unconventional rudder arrangement.
In order to classify the large variety of un-conventional rudders, it might be most reason-able to do this by distinction of the intended effect responsible for the unconventionality. In doing so, the committee will describe distinct classes of unconventional rudders.
Active Generation of Additional Rudder Forces. One class of rudders is equipped with a special device that actively generates an addi-tional side-force vector. Figure A.1 shows an example of this so-called active rudder, where a motor-propeller unit integrated within the movable rudder blade generates this additional side force.
Conversely, Figure A.2 shows a rudder ro-tor, which generates this force from a rotating cylinder integrated into the rudder leading edge, causing the well-known Magnus effect. Addi-tionally, this rotating cylinder accelerates the flow and prevents early flow separation on the rudder suction side.
Figure A.1 Active rudder.
Figure A.2 Rudder rotor.
Passive Generation of Higher Rudder Forces. Another class of rudders is designed to produce larger rudder forces without additional energy input. Figure A.3 shows such a rudder, which achieves a larger force by the reduction of losses. Here, end plates prevent an unin-tended pressure difference equalization around the upper and lower surface ends of a semi-spade rudder blade. Other losses may be in-volved in the pressure equalizing flow through the rudder gaps. Rhee et al. (2007) described a solution featuring gap flow suppressing wedges installed at the vertical gaps of a semi-spade rudder to overcome this problem. They report a lift force increase of more than 40 %.

Specialist Committee on Cavitation
514
Figure A.3 Rudder with end plates.
Figure A.4 shows another unconventional rudder that increases the side force with an ad-ditional flap at the rudder trailing edge—a flap that generates a more favorable static-pressure distribution in the chordwise direction.
Figure A.4 Full-spade flap rudder.
Whether actively or passively generating increased side forces, these unconventional rudders achieve the higher forces at the ex-pense of higher resistance.
Improvement of Propulsion Performance. As a completely different approach, one can design an unconventional rudder geometry to increase the propulsion performance of a vessel. Figure A.5 shows a typical example for this class of rudders: the asymmetric rudder blade, which recovers energy from the swirl down-stream of the propeller. These rudders can ei-ther be of semi-spade or full-spade type. The same working principle stands behind the rud-
der fin, which features wings attached to the rudder.
Figure A.5 Twisted full-spade rudder.
The Costa Bulb, shown in Figure A.6, represents another possible application. This rudder aims to reduce losses involved in the propeller hub vortex. This bulb is normally in-stalled on a movable spade rudder blade, which means that there must be a disadvantageous gap between the propeller hub and the bulb. Also, the so-called High-Efficiency Rudder, shown in Figure A.7, is a consequence of fur-ther development of this working principle, ap-plied on a horn-type rudder.
Improvement of Cavitation Performance. Finally, one can consider another class of un-conventional rudders with the intention of avoiding cavitation problems on the rudder it-self. The previously described twisted rudder, as shown in Figure A.5, gives an example in which one considers this cavitation require-ment during the design phase of the rudder. Besides its energy recovering effect, this rud-der also reduces rudder leading-edge cavitation, because the rudder profile is better adjusted to the propeller swirl. Figure A.8 shows a very complicated geometry developed after the de-sign and original fabrication of a conventional

Proceedings of 25th ITTC – Volume II
515
symmetrical semi-spade rudder that suffered from severe rudder cavitation erosion. Geome-try modifications such as this one—or just simple scissor plates or spoilers—may convert a conventional rudder into an unconventional one.
Figure A.6 Full-spade rudder with a Costa
Bulb.
Figure A.7 High-efficiency rudder.
Park et al. (2007) described numerical in-vestigations of slot bars, scissor plates, and special rudder horn geometries to achieve bet-ter cavitation performance with a conventional semi-spade rudder. The gap flow suppressing wedges proposed by Rhee et al. (2007) for lift force improvement (as described previously) may also be understood as a contribution to gap cavitation prevention. Additionally, the end plate shown in Figure A.3 also helps to improve the cavitation behavior by delaying or moving the tip vortex at the rudder sole.
Figure A.8 Semi-spade rudder modified to re-
duce cavitation.
A.2 Highly-Loaded Propellers
Propeller loading is normally measured by the thrust-loading coefficient, ThC , expressing the propeller-generated energy increase of the fluid passing through the propeller disc, related to the initial kinetic energy of this fluid. ThC is important for the rudder cavitation behavior, since the acceleration of the flow by the pro-peller directly depends on the thrust-loading coefficient. From momentum theory, the axial flow speed behind the propeller, behindV , is
( )1
21 ,behind Th AV C V= + ⋅ (A.1)
where AV is the speed of advance (as deter-mined from open-water propeller tests). In oth-er words, with a thrust-loading coefficient of
ThC = 3, for example, the incoming flow speed would be doubled by the propeller action. Ac-cording to propeller theory, the induced veloci-ties are not axially directed, but they are more or less perpendicular to the propeller blades (strictly speaking, they are perpendicular to the helical sheet of free vortices). This means that the flow behind the propeller is not only axially accelerated, but it gets an additional swirl in the same direction as the propeller rotation. Thus, a higher thrust loading gives a stronger amount of swirl downstream of the propeller—or a stronger amount of cross flow within the rudder inflow.
Unfortunately, the thrust-loading coeffi-cient is normally not known in the early design stage of a ship, since the thrust requirement and

Specialist Committee on Cavitation
516
wake fraction (and, for this reason, AV ) are un-known. A practical classification of propeller loads should be based on the power density value—the power flux through the propeller disc—as shown in Figure A.9. The values plot-ted in this figure are known in an early design stage and correlate quite well with the much more precise thrust-loading coefficient. The values displayed in Figure A.9 were taken from the Hamburg Ship Model Basin’s cavitation testing statistics.
Figure A.9 Propeller loads (testing statistics
from the Hamburg Ship Model Ba-sin).
Figure A.9 shows that two thirds of all sea-going ships—with either one or two propel-
lers—have a power density of not more than 800 kW/m2. For single-screw ships, the usual values range from 400 kW/m2 to 500 kW/m2—while for twin-screw vessels, the typical power densities are more widespread. Nevertheless, a pragmatic definition for a highly-loaded pro-peller would be one with more than 800 kW delivered power per square meter of disc area.
A.3 References.
Park, S., Heo, J., and Yu, B., 2007, “Numerical Study on Horn Rudder Section to Reduce Gap Cavitation,” 10th International Sympo-sium on Practical Design of Ships and other Floating Structures (PRADS), Houston, Texas.
Rhee, S. H., Oh, J.-K., Lee, S.-H., and Kim, H., 2007, “Development of Rudder Cavitation Suppression Devices and its Concept Veri-fication through Experimental and Nu-merical Studies,” 10th International Sym-posium on Practical Design of Ships and other Floating Structures (PRADS), Hous-ton, Texas.

Proceedings of 25th ITTC – Volume II
517
APPENDIX B: WATERJET CAVITATION ISSUES
To date, the ITTC’s work on waterjets has focused on providing procedures for the deter-mination of the powering characteristics of wa-terjet-propelled vessels. Kruppa et al. (1996) and the Specialist Committee on Waterjets for the 21st ITTC proposed a momentum flux me-thod. They also discussed the direct thrust measurement method, which they felt required further evaluation. Later, Hoyt et al. (1999) and the Specialist Committee on Waterjets for the 22nd ITTC recommended three types of tests for determining the powering characteristics: self-propulsion tests, waterjet system tests, and pump tests. Within a towing tank, the self-propulsion tests would provide the required flow rate, waterjet thrust, and effective waterjet system power—including waterjet/hull interac-tion factors. The waterjet system tests would then determine the system characteristics in terms of the flow rate, head, torque, and re-quired power. Finally, the pump tests would determine the hydraulic characteristics of the pump without the flow distortion caused by the intake and hull boundary layer.
Van Terwisga et al. (2002) and the Special-ist Committee on Waterjet Test Procedures for the 23rd ITTC set out to have several ITTC members conduct a series of these three stan-dardization tests, with a special emphasis on including accompanying results from CFD. This work became possible through the team-ing with a project sponsored by the United States Office of Naval Research (ONR) and administered by the Gulf Coast Region of Maritime Technology Center, situated at the University of New Orleans. With a delay in the delivery of the models sponsored by the Gulf Coast Project, van Terwisga et al. (2005) and the Specialist Committee on Waterjet Test Pro-cedures for the 24th ITTC finished the work from the previous committee, thus completing the ITTC effort to provide procedures for the determination of the powering characteristics
of waterjet-propelled vessels. In addition, Wil-son et al. (2003) provided the final review of the Gulf Coast Project.
As pointed out by van Terwisga et al. (2005), the 24th ITTC Specialist Committee on Waterjet Test Procedures—and the previous committees—deliberately disregarded the ef-fect of cavitation on the powering characteris-tics and possible erosion effects from the scope of their work. They assumed for their work that cavitation in the pump or intake during opera-tion of the vessel does not affect the powering characteristics. However, they did suggest that this assumption should be checked with the waterjet manufacturer for each individual ap-plication.
Appendix B provides a fairly detailed de-scription of cavitation issues related to water-jets.
B.1 Waterjet Cavitation Issues
Waterjets must produce a thrust that over-comes the various components of resistance, or drag, of the vessel. All vessels experience some resistance as the superstructure—the portion of the vessel above the water surface—moves through the air, but this resistance is usually small relative to the other components. The portion of the vessel that stays under the water surface experiences a viscous resistance. At low speeds—or low Froude numbers—this vis-cous resistance dominates the total resistance of the vessel, and it increases approximately with the square of the vehicle speed. As the speed—or the Froude number—increase, wave resistance becomes a higher percentage of the total resistance with the formation of waves that follow the ship, known as the Kelvin wake. At some critical speed or “hump” speed the wave resistance exceeds the viscous resistance. In this region, most high-speed hulls differ from displacement hulls. For high-speed hulls, hydrodynamic lift becomes important, and the hull begins to plane, and the wave drag de-creases—producing a “hollow” in the resis-tance curve, as shown in Figure B.1. Also, Fig-

Specialist Committee on Cavitation
518
ure B.1 shows how a rough sea increases wave drag—and, thus, the total resistance of the ves-sel.
Vehicle Speed
Vehi
cle
Res
ista
nce
“Hollow”
“Hump”
Resistance in a Calm Sea
Resistance in a Rough Sea
Vehicle Speed
Vehi
cle
Res
ista
nce
“Hollow”
“Hump”
Resistance in a Calm Sea
Resistance in a Rough Sea
Figure B.1 Generic resistance curves for a
high-speed vehicle.
For these high-speed planing or surface-effect ships, Garrett (1967) and Wislicenus (1973) both report that the thrust requirements of a waterjet system in traversing the “hump” region can be nearly as high—and possibly even higher—than at the cruising speed. As will be discussed later in this report, waterjet pumps require a minimum absolute pressure at the pump inlet—or a net positive suction head—to avoid cavitation. This net positive suction head, NPSH, increases with vehicle speed—so it is very much lower at the “hump” speed than at the cruising speed, increasing the tendency for the pump to cavitate. Therefore, for some vessels operating with a waterjet pro-pulsion system, the thrust requirements within the “hump” region can dictate the design or se-lection of the waterjet—and, in many cases, the waterjet pump will operate in a cavitating con-dition during transit through this “hump” re-gion.
One designs or selects a shaft speed, Ω , for the waterjet pump that coincides with the nor-mal rating of the engine. The resulting net thrust curve for the waterjet propulsion system intersects the resistance curve (for a specified sea state), giving the speed of the vessel, as shown in Figure B.2. This figure also shows that one may be able to increase the shaft speed
even further—for a short amount of time—but an engine power limit does exist.
Vehicle Speed
Vehi
cle
Res
ista
nce
Engine Power Limit
Net Thrust
Net Thrust at Normal Engine Rating and
Shaft Speed, Ω
V∞Vehicle Speed
Vehi
cle
Res
ista
nce
Engine Power Limit
Engine Power Limit
Net Thrust
Net Thrust at Normal Engine Rating and
Shaft Speed, Ω
V∞
Figure B.2 Generic resistance curves for a
high-speed vessel, with a generic net thrust curve for a waterjet.
Pump cavitation can be characterized by a parameter called the suction specific speed,
SSN (which will be defined later). Figure B.3 shows a line of constant SSN added to the re-sistance and thrust curves. Operating at a high-er value of SSN will result in cavitation break-down and a significant decrease in total-head rise and net thrust, meaning that the pump will no longer absorb the horsepower. Figure B.3 shows this pump suction limit. If this limiting curve of constant SSN moved down and to the right on Figure B.3, one may get to the point where cavitation breakdown on the pump would prevent the vehicle from getting over the “hump” and reaching the desired cruise speed.
Vehicle Speed
Vehi
cle
Res
ista
nce
Engine Power Limit
Net Thrust
Pump Suction Limit
Line of Constant Suction Specific Speed, Nss
Vehicle Speed
Vehi
cle
Res
ista
nce
Engine Power Limit
Engine Power Limit
Net Thrust
Pump Suction Limit
Line of Constant Suction Specific Speed, Nss
Line of Constant Suction Specific Speed, Nss

Proceedings of 25th ITTC – Volume II
519
Figure B.3 Generic resistance and thrust curves for a high-speed vessel pow-ered by a waterjet, with a limiting value of suction specific speed for cavitation breakdown.
As pointed out by Allison (1993), some wa-terjet manufacturers indicate zones of operation on their waterjet pump maps. Figure B.4 shows these zones. This figure adds additional net thrust curves (for different shaft speeds) and curves of constant ssN to Figure B.3. Opera-tion within Zone 1 is unrestricted, probably with only some intermittent cavitation. The pressure fluctuations associated with this in-termittent cavitation could increase vibration and noise, which is probably not an issue with most applications. For operation in rough weather or at overload displacement, one could operate in Zone 2, which probably includes de-veloped cavitation. This developed cavitation would further increase vibration and noise, and it could lead to some erosion. Operation in Zone 3 (or beyond the pump suction limit) is prohibited and would include significant vapor cavities. Operation here would not only in-crease cavitation erosion, vibration, and noise, but it would also lead to complete cavitation breakdown of the thrust.
Vehicle Speed
Vehi
cle
Res
ista
nce
Net Thrust
Zone 3
Decreasing Nss
Decreasing Ω
Engine Power Limit
Zone 2
Zone 1
Vehicle Speed
Vehi
cle
Res
ista
nce
Net Thrust
Zone 3
Decreasing Nss
Decreasing Ω
Engine Power Limit
Engine Power Limit
Zone 2
Zone 1
Figure B.4 Generic curves of resistance, thrust, and suction specific speed for a high-speed vessel powered by a wa-terjet, showing zones of operation.
In order to improve the performance and extend the operation range of vessels with wa-terjet propulsion, one must understand the cavi-tation issues, be able to better predict the oc-currence of cavitation, and then improve the de- signs. In this report, the committee will first review the existing literature and discuss the cavitation issues associated with the vari-ous components of a waterjet propulsion unit. Roy (1994) presented an excellent history of waterjet propulsion units, and Wislicenus (1973) provided the fundamental hydrody-namic theory for waterjets. For work per-formed prior to the early 1990’s, Allison (1993) gave an excellent summary of the status of waterjet propulsion. However, in recent years, commercial waterjet manufacturers have been quite secretive about their design, analy-sis, and testing methods and results—especially with regard to cavitation perform-ance. Nonetheless, this literature review is still fairly extensive and representative of the tech-nology; but it is by no means exhaustive. Fi-nally, the committee will examine the three types of tests recommended by Hoyt et al. (1999) and the Specialist Committee on Water-jets for the 22nd ITTC, and the committee will point out where one could apply cavitation test-ing procedures. In addition, the committee will

Specialist Committee on Cavitation
520
Vjet
pump casingnozzle
drive shaft
water line
lip or cutwater
diffuser duct
rampvessel hull
ramp angle
Vship
Vjet
pump casingnozzle
drive shaft
water line
lip or cutwater
diffuser duct
rampvessel hull
ramp angle
Vship
Figure B.5 Generic waterjet with a flush inlet.
recommend how some of the prediction meth-ods discussed previously in this report can be applied to waterjets.
B.2 Waterjet Inlets
While waterjets do allow a surface vessel to operate over a large speed range, the waterjet inlet or intake must be designed to guide the flow properly through the inlet duct and into the pump, in order to achieve this range. Most waterjets today have flush inlets, as illustratein Figure B.5, while some waterjets have pod in-lets, as illustrated in Figure B.6. These for-ward-facing pod inlets are called ram inlets, since (efficiently) bringing the water to rest downstream of the inlet would increase the static pressure to the value of the dynamic pressure. Alternately, one could compromise between a flush inlet and a pod inlet and em-ploy a scoop, giving a partial ram inlet
Designers try to minimize the losses within an inlet to improve the overall propulsive effi-ciency. To minimize losses, one should also avoid flow separation under all operational conditions. Minimizing flow separation will also help avoid cavitation on the inlet surfaces. As the flow within the hull boundary layer is ingested through the inlet’s “S” ducting and over the shaft, a circumferentially-non-uniform—or secondary—flow can enter the
pump and degrade pump performance with re-gard to efficiency, cavitation, vibration, and noise. Therefore, the designer wants to mini-mize these flow distortions if possible. In addi-tion, most waterjets diffuse the flow through the inlet ducting in order to increase the static pressure at the pump entrance plane and im-prove pump cavitation performance. However, the amount of diffusion is a trade-off between improved cavitation performance and increased losses. Finally, the inlet ducting in a vessel—and, thus, the volume of water entrained in the ducting constitutes—lost buoyancy for the ves-sel, so designers seek to keep the ducting as short as possible.
Vjet
pump casingnozzle
drive shaft
water line
strut
diffuser duct
pod
Vship
Vjet
pump casingnozzle
drive shaft
water line
strut
diffuser duct
pod
Vship
Figure B.6 Generic waterjet with a pod inlet.
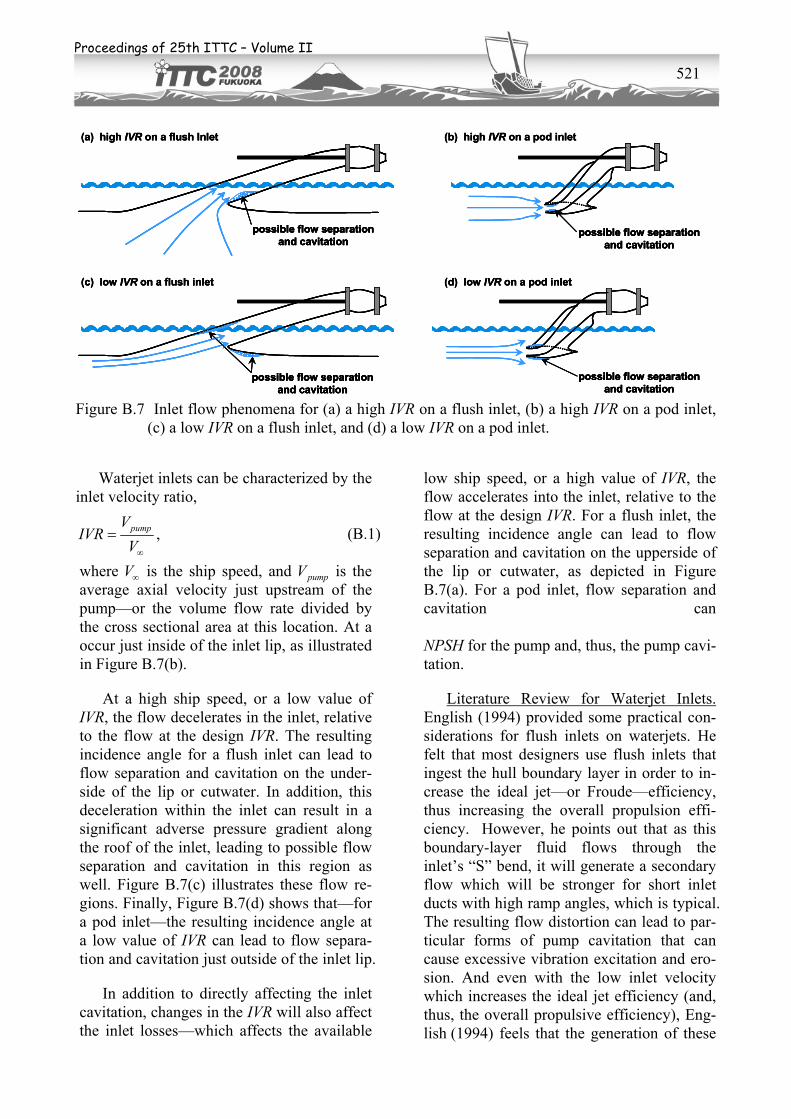
Proceedings of 25th ITTC – Volume II
521
possible flow separation and cavitation
possible flow separation and cavitation
possible flow separation and cavitation
possible flow separation and cavitation
(a) high IVR on a flush Inlet (b) high IVR on a pod inlet
(c) low IVR on a flush inlet (d) low IVR on a pod inlet
possible flow separation and cavitation
possible flow separation and cavitation
possible flow separation and cavitation
possible flow separation and cavitation
(a) high IVR on a flush Inlet (b) high IVR on a pod inlet
(c) low IVR on a flush inlet (d) low IVR on a pod inlet
possible flow separation and cavitation
possible flow separation and cavitation
possible flow separation and cavitation
possible flow separation and cavitation
possible flow separation and cavitation
possible flow separation and cavitation
possible flow separation and cavitation
possible flow separation and cavitation
(a) high IVR on a flush Inlet (b) high IVR on a pod inlet
(c) low IVR on a flush inlet (d) low IVR on a pod inlet
Figure B.7 Inlet flow phenomena for (a) a high IVR on a flush inlet, (b) a high IVR on a pod inlet, (c) a low IVR on a flush inlet, and (d) a low IVR on a pod inlet.
Waterjet inlets can be characterized by the inlet velocity ratio,
,pumpVIVR
V∞
= (B.1)
where V∞ is the ship speed, and pumpV is the average axial velocity just upstream of the pump—or the volume flow rate divided by the cross sectional area at this location. At a
low ship speed, or a high value of IVR, the flow accelerates into the inlet, relative to the flow at the design IVR. For a flush inlet, the resulting incidence angle can lead to flow separation and cavitation on the upperside of the lip or cutwater, as depicted in Figure B.7(a). For a pod inlet, flow separation and cavitation can
occur just inside of the inlet lip, as illustrated in Figure B.7(b).
At a high ship speed, or a low value of IVR, the flow decelerates in the inlet, relative to the flow at the design IVR. The resulting incidence angle for a flush inlet can lead to flow separation and cavitation on the under-side of the lip or cutwater. In addition, this deceleration within the inlet can result in a significant adverse pressure gradient along the roof of the inlet, leading to possible flow separation and cavitation in this region as well. Figure B.7(c) illustrates these flow re-gions. Finally, Figure B.7(d) shows that—for a pod inlet—the resulting incidence angle at a low value of IVR can lead to flow separa-tion and cavitation just outside of the inlet lip.
In addition to directly affecting the inlet cavitation, changes in the IVR will also affect the inlet losses—which affects the available
NPSH for the pump and, thus, the pump cavi-tation.
Literature Review for Waterjet Inlets. English (1994) provided some practical con-siderations for flush inlets on waterjets. He felt that most designers use flush inlets that ingest the hull boundary layer in order to in-crease the ideal jet—or Froude—efficiency, thus increasing the overall propulsion effi-ciency. However, he points out that as this boundary-layer fluid flows through the inlet’s “S” bend, it will generate a secondary flow which will be stronger for short inlet ducts with high ramp angles, which is typical. The resulting flow distortion can lead to par-ticular forms of pump cavitation that can cause excessive vibration excitation and ero-sion. And even with the low inlet velocity which increases the ideal jet efficiency (and, thus, the overall propulsive efficiency), Eng-lish (1994) feels that the generation of these

Specialist Committee on Cavitation
522
secondary flows can increase inlet losses, which will adversely affect the overall pro-pulsion efficiency.
In addition, while it is both convenient and typical for inlet ducting to have a rectan-gular cross-section, English (1994) stated that this shape may not necessarily be the most suitable from the viewpoints of efficiency, vibration excitation, and maneuvering. Also, using principals developed for auxiliary air intakes on aircraft, he suggests the use of a scoop. And while he admits that the use of a scoop on high-speed craft may result in hull cavitation near the scoop, he feels that cavita-tion that is controlled and does not cause ero-sion on surfaces—or other problems—can be tolerated. English (1994) also suggested the use of elliptically-shaped intakes with rounded edges to help improve the flow dis-tortion ingested into the pump. Finally, he noted the close interaction between the hull and the waterjet; where the shape of the bot-tom of the vehicle in the region of the intake can influence the hydrodynamic performance directly and adversely.
Steen and Minsaas (1995) stated that wa-terjet pump suppliers traditionally played the main role in designing the entire waterjet pro-pulsion system for each individual ship. However, they felt that model basins were becoming increasingly involved in the design and evaluation of the waterjet system, particu-larly for the waterjet inlets. Based on the pre-dicted ship resistance, Steen and Minsaas (1995) would first select the type and size of the main engine. Then, they would select an available waterjet pump to fit the engine, making sure to select the optimum jet outlet area, which determines the flow rate required to obtain the necessary increase in axial mo-mentum and, thus, the proper thrust. Clearly, the impeller characteristics, the inlet losses, and the expected operating profile of the craft also play important roles in this design opti-mization process.
Next, Steen and Minsaas (1995) would design the waterjet inlet to fit the bottom of the hull, as well as considering other con-straints. The cross-sectional area of the inlet mouth is of primary importance, especially when choosing the design value of IVR and evaluating possible regions of cavitation for off-design values of IVR. They developed a computer program to generate the geometry for both flush and ram inlets, using super-elliptic cross-sections and splines. The code automatically generates a mesh for a bound-ary-element method that allows them to eva-luate the pressure and velocity distributions, as well as the risk of flow separation and cavitation. Later, they use a RANS solver to further study vortex generation and flow separation. They concluded that the inlet suc-tion area was far from rectangular.
Steen and Minsaas (1995) also strongly advocated testing in both a towing tank and a cavitation tunnel to help design waterjet inlets without cavitation and with an optimum effi-ciency. For self-propulsion tests within a tow-ing tank, they studied the waterjet/hull inter-action and air ventilation into the waterjet. Even for calm water, they needed to avoid waterjet inlets with sharp corners, which lead to vortices which can draw air into the inlet. To obtain good performance for high-speed craft, it is essential to test in a seaway to de-sign craft with as little speed loss and air ven-tilation as possible at higher sea states. For waterjet system tests in a cavitation tunnel, they measured the flow rate, inlet losses, and flow distortion into the pump. They also per-formed surface flow visualization to detect possible flow separation, and they observed cavitation on the inlet and on the impeller. They stressed the importance of observing the inlet cavitation at various values of IVR, as this cavitation will increase the resistance of the ship.
Seil et al. (1997) reported on the optimiza-tion of waterjet inlets using CFD. Because of the waterjet/hull interaction, they stated that the ideal optimization would include a deter-
Proceedings of 25th ITTC – Volume II
523
mination of the hull form and the inlet geome-try together. However, they avoided this com-plex hydrodynamic design problem and sim-ply optimized the inlet geometry with an up-stream turbulent, flat-plate boundary layer. They developed their own single-block, body-fitted-coordinate, structured computational grid—which they used with a commercial CFD code to solve the steady, incompressible RANS equations, with a two-equation renor-malization group (RNG) k-ε turbulence model.
First, Seil et al. (1997) developed a para-metric definition of the geometry for the wa-terjet inlet. Then, they developed a cost func-tion based on four hydrodynamic perform-ance parameters—the distortion of the total-pressure distribution at the exit of the inlet duct, the total-pressure loss coefficient, the volume of water entrained in the inlet duct, and the cavitation number—with coefficients and exponents to provide weighting factors for the relative importance of the four per-formance parameters. They used a formal op-timization methodology to minimize the re-sulting cost function. For a given IVR, they ran several cases (cases with circular cross-sectional ducts), and they always found that cavitation would occur on the underside of the inlet lip. They felt that they would need to increase the radius of the inlet lip or increase the ramp angle in order to reduce the cavita-tion number. However, they pointed out that an infinite number of possible designs exist, so they could not draw many conclusions from their limited study.
Hu and Zangeneh (1999) also reported on the optimization of waterjet inlets using CFD. They also used a commercial code (with a standard k-ε turbulence model) and a body-fitted structured grid; however, they felt that they could use two-dimensional RANS solu-tions along the center plane for the design op-timization, before checking the results with a three-dimensional RANS simulation. They performed the optimization by adjusting sev-eral B-spline control points and minimizing an cost function representing the total-
pressure loss. Based on some initial geometry, they reduced the inlet total-pressure loss by 20% at the design point, with even more re-duction at some off-design points. They also obtained a slightly more uniform flow at the exit of the waterjet inlet and suppressed the flow separation near the lip. However, the ini-tial lip geometry looked very sharp, and the optimization based on two-dimensional RANS solutions provided a more rectangular cross section for the inlet duct, which may shed more vortical structures.
Bulten and Verbeek (2003) used a com-mercial CFD code with an in-house three-dimensional grid generator to optimize the inlet geometry of a fast ferry, a patrol boat, and a high-speed motor yacht. Their design criteria, in a priority listing, were (1) avoid flow separation under all circumstances, (2) avoid cavitation on the upper part of the cut-water at high IVR and on the roof at high IVR, (3) avoid cavitation on the underside of the cutwater at low IVR, and (4) minimize the vo-lume entrained by the water within the inlet.
Brandner and Walker (2007) conducted an extensive experimental investigation of the performance of flush waterjet inlets. Within their cavitation tunnel, they fitted the inlet model to the ceiling of the test section, with an instrumented pipe length fitted down-stream of the inlet to investigate flow proper-ties at a notional pump face. Upstream of this flush inlet—which they consider typical of a conventional waterjet design—they could thicken the incoming boundary layer using a saw-toothed fence. They measured the static-pressure distribution along the centerline of the ramp—or roof of the inlet—and the boun-dary-layer profile on this surface, just up-stream of the dummy, non-rotating pump ro-tor shaft. They also measured the static pres-sures on the lip to help determine the inci-dence angle, and they used a three-hole pres-sure probe to measure the flow at the exit plane of the inlet. Finally, they made observa-tions of cavitation inception and occurrence.

Specialist Committee on Cavitation
524
As one would expect, Brandner and Walker (2007) found that the flow field with-in the waterjet inlet changed significantly with IVR. For decreasing values of IVR, the static-pressure gradient along the ramp be-came more adverse and the flow eventually separated. Secondary flow from the incoming boundary-layer fluid turning through the “S” bend dominated the flow features at the exit of the inlet, although they also saw evidence of the shaft wake and streamwise vortices shed from the square corners of the ducting. The flow became more distorted at this plane for decreasing values of IVR. Also, for lower values of IVR, the stagnation point on the lip of the inlet moved inside the duct and sheet cavitation occurred below the lip, as shown in Figure B.8. These trends in the flow field went in the other direction when increasing the values of IVR. At some values of IVR, Bandner and Walker (2007) also observed cavitation at the bottom of the duct, just up-stream of the exit plane. This cavitation ap-peared as transient, partially-isolated, thin bubbles along the wall of the duct, with re-gions of coalescence.
Finally, Brandner and Walker (2007) showed inlet performance to be generally im-proved with the ingestion of a thicker bound-ary layer. The thicker boundary layer reduced the flow separation along the ramp and re-duced the degree of flow distortion at the exit plane, before flow would enter the pump. However, the range of incidence angles on the lip was greater for the thicker boundary layer, increasing the likelihood of flow sepa-ration and cavitation in the vicinity of the lip.
Figure B.8 Lip cavitation inception with the
waterjet inlet ingesting a natural and thicknened boundary layer, as measured by Brandner and Walker (2007).
B.3 Waterjet Pumps
Historically, Allison (1993) reported that waterjet propulsion units have included pumps that range from axial-flow units, through mixed-flow units, to radial-flow (or centrifugal) units—as well as reciprocating pumps used in early waterjet propulsors. Based on similitude, one can define the spe-cific speed, SN , to characterize the pump type,
,gH
QN S
⎟⎠⎞⎜
⎝⎛Ω
=4
3
21
(B.2)
where Ω is the rotational speed of the rotor blades, Q is the volumetric flow rate through the pump, and H is the net total head through the pump. This dimensionless parameter is independent of the size of the pump and the type of fluid. The specific speed normally defines the best hydraulic efficiency point of the pump. The approximate range of specific speeds for axial-flow pumps is 3.0-6.5, for mixed-flow pumps is 1.5-3.0, and for radial-flow (or centrifugal) pumps is 0.2-1.5. Recip-rocating pumps have even smaller values of specific speed than radial-flow pumps, while propellers have even larger values of specific

Proceedings of 25th ITTC – Volume II
525
speed than axial-flow pumps. Propulsion sys-tems work more efficiently with a larger flow rate and a lower total-head rise, or a higher specific speed—as indicated by Wislicenus (1973), for example—so most current water-jet propulsors incorporate either axial-flow or mixed-flow pumps.
A waterjet pump requires a minimum ab-solute pressure at its entrance to avoid cavita-tion. If the pressure at the pump face falls be-low this value of pressure, vapor bubbles will form, and their subsequent collapse can lead to vibration, noise, erosion, and a reduction in the waterjet thrust. This required pressure de-pends on the design of the inlet and the pump. Downstream of the inlet ducting, at the en-trance to the pump, Wislicenus (1986) de-fined the total head available to the blade rows as
,gp
zg
VhH vs
ssv ρ−⎟⎟
⎠
⎞⎜⎜⎝
⎛Δ±+=
2
2
(B.3)
where sh is the static head equal to the static pressure divided by the weight per unit vol-ume of the fluid ( ρg ), sV is the fluid velocity at the place where sh is measured, and zΔ is the difference in elevation between the point where sh is measured and the point of cavita-tion. This total suction head above the vapor pressure is also referred to as the net positive suction head, NPSH .
In his review of waterjet propulsion, Alli-son (1993) stated that the waterjet inlet must be capable of supplying the NPSH demanded by the pump to avoid cavitation. Usually, this is no problem at the design point; but at low ship speeds, it is generally necessary to re-duce power (or pump speed) to match the pump-required RNPSH to the total head available from the inlet for the existing ship speed. The available ANPSH will depend on the efficiency of the inlet.
Rather than use the cavitation number, σ , to characterize cavitation, the pump industry has used other dimensionless parameters to
characterize cavitation. One of the earliest parameters is Thoma’s cavitation factor (or the Thoma parameter), Thσ , which can be de-fined simply as
.NPSH
HH
H svsvTh ==σ (B.4)
Alternatively, in a manner similar to de-fining the specific speed, one could use si-militude to define the suction specific speed as
.NPSHg
Q
gH
QNsv
SS
⎟⎠⎞⎜
⎝⎛ ⋅
Ω=
⎟⎠⎞⎜
⎝⎛Ω
=4
3
21
43
21
(B.5)
Figure B.9 presents a generic schematic il-lustrating the cavitation performance of a pump, for a given flow rate. The shape and magnitude of these cavitation characteristic curves depends on the pump type (or specific speed), the details of the pump design, and the flow conditions. Various investigators characterize the degree of cavitation using σ ,
Thσ , or NPSH —as shown increasing to the right on the bottom abscissa of Figure B.9—or using SSN —as shown increasing to the left on the top abscissa. Figure B.9 shows three critical cavitation numbers which limit pump performance: a limit for cavitation inception, a limit for cavitation erosion, and a limit for cavitation breakdown. Note that these three critical cavitation numbers, which are usually determined experimentally, are essentially independent of one another. For instance, in-ception may result from cavitation in the gap between the rotor-blade tips and the casing or in the core of the resulting tip-leakage vor-tex—and, yet, neither of these forms of cavi-tation lead to erosion or breakdown on the rotor blades.
Referring to Figure B.9, if one reduces the static pressure (or the cavitation number) from a noncavitating condition, cavitation first appears at inception—typically as a crackling sound. Further reduction in static pressure leads to increases in vibration and noise. Reducing the static pressure even fur-

Specialist Committee on Cavitation
526
ther results in the onset of cavitation erosion, which is caused by the implosion of vapor bubbles on the surface of the blades. This erosion rate also depends on the material of the blade.
Finally, further reductions in static pres-sure will lead to a major deterioration in the powering performance of the pump. The criti-cal cavitation number for this breakdown in performance is typically defined as a 3% loss in thrust, torque, or total-head rise across the pump (although values of 2% and 5% have also been used). For axial-flow pumps, a cav-ity will form on the suction surface of the ro-tor blades, which can initially increase the blade camber—and, thus, the flow turning and blade lift—and cause a small increase in the powering parameters, as illustrated in Fig-ure B.9. However, as the static pressure de-creases towards the breakdown cavitation number, the cavity will enlarge and decrease the flow turning, causing a significant reduc-tion in the powering parameters. For radial-flow (or centrifugal) pumps, the cavity may need to grow to the point where it blocks a significant portion of the impeller channel be-fore finally resulting in performance break-down.
Axial-flow pumps offer some key advan-tages within a waterjet propulsor. With a high specific speed, they provide improved effi-ciency. Also, their small casing diameter al-lows for easier installation into many existing hulls or less volume restrictions when design-ing a new hull. However, axial-flow pumps can have difficulty developing enough head without detrimental effects from cavitation. The three limiting cavitation numbers in Fig-ure B.9 can be larger—or the limiting suction specific speeds can be smaller—for axial-flow pumps, although the details of the pump design and the flow condition can alter these limits. For instance, designers may increase the blade area of their axial-flow rotor blades to decrease the maximum loading or lift and improve cavitation performance, at the risk of increasing friction losses.
Cavitation Number, σ(or σTh or NPSH)
Pow
erin
g Pa
ram
eter
(T
hrus
t, To
rque
, Tot
al-H
ead
Ris
e, …
) Acoustic Level
orErosion R
ate
Suction Specific Speed, NSS
3%
Inception
Erosion Limit
Breakdown Limit
Cavitation Number, σ(or σTh or NPSH)
Pow
erin
g Pa
ram
eter
(T
hrus
t, To
rque
, Tot
al-H
ead
Ris
e, …
) Acoustic Level
orErosion R
ate
Suction Specific Speed, NSS
3%
Inception
Erosion Limit
Breakdown Limit
Figure B.9 Generic schematic of pump cavi-
tation performance (for a given flow rate).
In general, pump designs with lower spe-cific speeds will have improved cavitation performance. One possible pump type with a lower specific speed is a multistage axial-flow pump. Similar to configurations used for rocket fuel pumps, one can design an axial-flow inducer just upstream of the main impel-ler. This blade row will increase the static pressure to supply the RNPSH required by the impeller, without excessive loss of per-formance due to cavitation. Inducer blades themselves will not experience cavitation breakdown until the cavitation number be-comes very small, or the suction specific speed becomes very large. Well-designed in-ducers will raise the static pressure gradually, without doing much work to increase the total pressure (or total head). The main impeller will perform the bulk of the work. However, the inducer—with a large blade area—will still have total-pressure losses and will leng-then the overall unit.
Another possible pump type with a spe-cific speed lower than an axial-flow pump is a mixed-flow pump. These blade rows will provide some increase in total head through centrifugal action (an increase in radius), so the blade loading will be reduced relative to an axial-flow pump—and cavitation should be less of a problem. These pumps can still
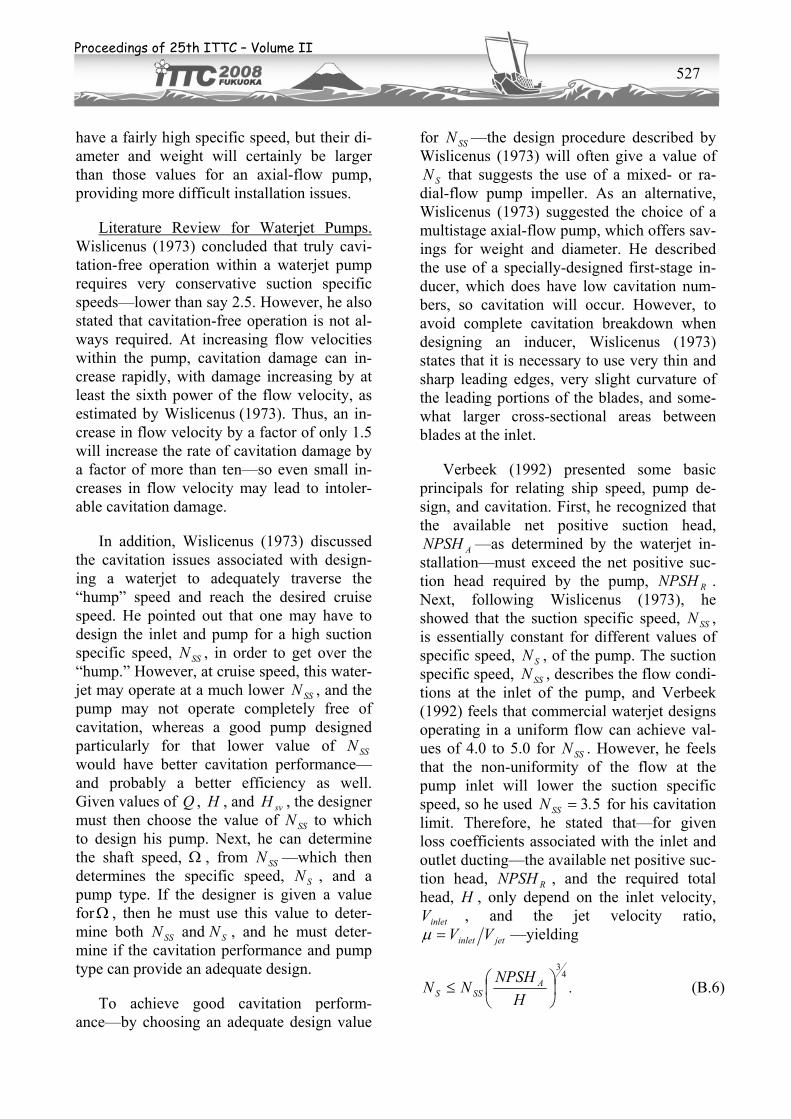
Proceedings of 25th ITTC – Volume II
527
have a fairly high specific speed, but their di-ameter and weight will certainly be larger than those values for an axial-flow pump, providing more difficult installation issues.
Literature Review for Waterjet Pumps. Wislicenus (1973) concluded that truly cavi-tation-free operation within a waterjet pump requires very conservative suction specific speeds—lower than say 2.5. However, he also stated that cavitation-free operation is not al-ways required. At increasing flow velocities within the pump, cavitation damage can in-crease rapidly, with damage increasing by at least the sixth power of the flow velocity, as estimated by Wislicenus (1973). Thus, an in-crease in flow velocity by a factor of only 1.5 will increase the rate of cavitation damage by a factor of more than ten—so even small in-creases in flow velocity may lead to intoler-able cavitation damage.
In addition, Wislicenus (1973) discussed the cavitation issues associated with design-ing a waterjet to adequately traverse the “hump” speed and reach the desired cruise speed. He pointed out that one may have to design the inlet and pump for a high suction specific speed, SSN , in order to get over the “hump.” However, at cruise speed, this water-jet may operate at a much lower SSN , and the pump may not operate completely free of cavitation, whereas a good pump designed particularly for that lower value of SSN would have better cavitation performance—and probably a better efficiency as well. Given values of Q , H , and svH , the designer must then choose the value of SSN to which to design his pump. Next, he can determine the shaft speed, Ω , from SSN —which then determines the specific speed, SN , and a pump type. If the designer is given a value forΩ , then he must use this value to deter-mine both SSN and SN , and he must deter-mine if the cavitation performance and pump type can provide an adequate design.
To achieve good cavitation perform-ance—by choosing an adequate design value
for SSN —the design procedure described by Wislicenus (1973) will often give a value of
SN that suggests the use of a mixed- or ra-dial-flow pump impeller. As an alternative, Wislicenus (1973) suggested the choice of a multistage axial-flow pump, which offers sav-ings for weight and diameter. He described the use of a specially-designed first-stage in-ducer, which does have low cavitation num-bers, so cavitation will occur. However, to avoid complete cavitation breakdown when designing an inducer, Wislicenus (1973) states that it is necessary to use very thin and sharp leading edges, very slight curvature of the leading portions of the blades, and some-what larger cross-sectional areas between blades at the inlet.
Verbeek (1992) presented some basic principals for relating ship speed, pump de-sign, and cavitation. First, he recognized that the available net positive suction head,
ANPSH —as determined by the waterjet in-stallation—must exceed the net positive suc-tion head required by the pump, RNPSH . Next, following Wislicenus (1973), he showed that the suction specific speed, SSN , is essentially constant for different values of specific speed, SN , of the pump. The suction specific speed, SSN , describes the flow condi-tions at the inlet of the pump, and Verbeek (1992) feels that commercial waterjet designs operating in a uniform flow can achieve val-ues of 4.0 to 5.0 for SSN . However, he feels that the non-uniformity of the flow at the pump inlet will lower the suction specific speed, so he used 53.N SS = for his cavitation limit. Therefore, he stated that—for given loss coefficients associated with the inlet and outlet ducting—the available net positive suc-tion head, RNPSH , and the required total head, H , only depend on the inlet velocity,
inletV , and the jet velocity ratio, jetinlet VV=μ —yielding
.H
NPSHNN ASSS
43
⎟⎠⎞
⎜⎝⎛≤ (B.6)
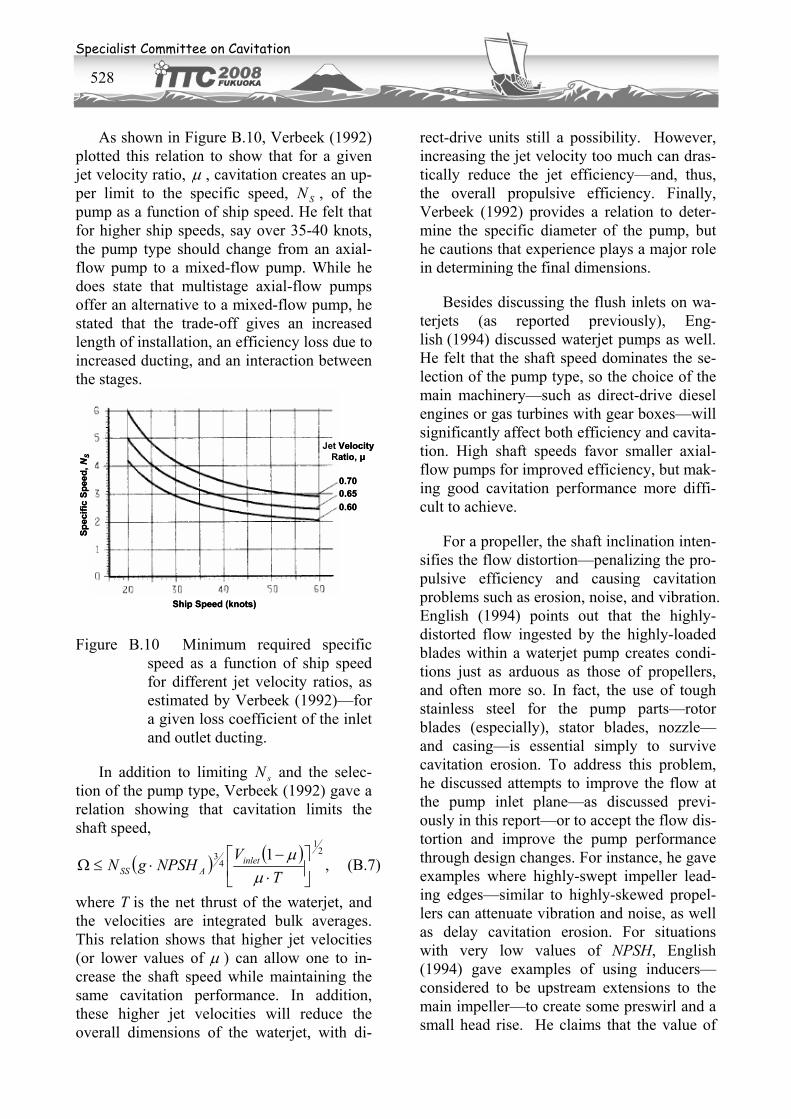
Specialist Committee on Cavitation
528
As shown in Figure B.10, Verbeek (1992) plotted this relation to show that for a given jet velocity ratio, μ , cavitation creates an up-per limit to the specific speed, SN , of the pump as a function of ship speed. He felt that for higher ship speeds, say over 35-40 knots, the pump type should change from an axial-flow pump to a mixed-flow pump. While he does state that multistage axial-flow pumps offer an alternative to a mixed-flow pump, he stated that the trade-off gives an increased length of installation, an efficiency loss due to increased ducting, and an interaction between the stages.
Spec
ific
Spee
d, NS
Ship Speed (knots)
Jet Velocity Ratio, μ
0.700.650.60
Spec
ific
Spee
d, NS
Ship Speed (knots)
Jet Velocity Ratio, μ
0.700.650.60
Figure B.10 Minimum required specific speed as a function of ship speed for different jet velocity ratios, as estimated by Verbeek (1992)—for a given loss coefficient of the inlet and outlet ducting.
In addition to limiting sN and the selec-tion of the pump type, Verbeek (1992) gave a relation showing that cavitation limits the shaft speed,
( ) ( ),
1 21
43
⎥⎦
⎤⎢⎣
⎡⋅−
⋅≤ΩT
VNPSHgN inlet
ASS μμ
(B.7)
where T is the net thrust of the waterjet, and the velocities are integrated bulk averages. This relation shows that higher jet velocities (or lower values of μ ) can allow one to in-crease the shaft speed while maintaining the same cavitation performance. In addition, these higher jet velocities will reduce the overall dimensions of the waterjet, with di-
rect-drive units still a possibility. However, increasing the jet velocity too much can dras-tically reduce the jet efficiency—and, thus, the overall propulsive efficiency. Finally, Verbeek (1992) provides a relation to deter-mine the specific diameter of the pump, but he cautions that experience plays a major role in determining the final dimensions.
Besides discussing the flush inlets on wa-terjets (as reported previously), Eng-lish (1994) discussed waterjet pumps as well. He felt that the shaft speed dominates the se-lection of the pump type, so the choice of the main machinery—such as direct-drive diesel engines or gas turbines with gear boxes—will significantly affect both efficiency and cavita-tion. High shaft speeds favor smaller axial-flow pumps for improved efficiency, but mak-ing good cavitation performance more diffi-cult to achieve.
For a propeller, the shaft inclination inten-sifies the flow distortion—penalizing the pro-pulsive efficiency and causing cavitation problems such as erosion, noise, and vibration. English (1994) points out that the highly-distorted flow ingested by the highly-loaded blades within a waterjet pump creates condi-tions just as arduous as those of propellers, and often more so. In fact, the use of tough stainless steel for the pump parts—rotor blades (especially), stator blades, nozzle—and casing—is essential simply to survive cavitation erosion. To address this problem, he discussed attempts to improve the flow at the pump inlet plane—as discussed previ-ously in this report—or to accept the flow dis-tortion and improve the pump performance through design changes. For instance, he gave examples where highly-swept impeller lead-ing edges—similar to highly-skewed propel-lers can attenuate vibration and noise, as well as delay cavitation erosion. For situations with very low values of NPSH, English (1994) gave examples of using inducers—considered to be upstream extensions to the main impeller—to create some preswirl and a small head rise. He claims that the value of

Proceedings of 25th ITTC – Volume II
529
SSN for cavitation breakdown can be im-proved by 10-20%, but he does suggest that the inducer blades should be highly swept—or highly skewed—to properly accept the dis-torted inflow.
Stricker, Becnel, and Purnell (1994) de-veloped a waterjet propulsor for a vessel re-quiring high thrust at relatively low speeds. They included a semi-flush inlet design and a low-solidity inducer to raise the pressure to a sufficient level so that a non-cavitating kicker blade row can input the major part of the head rise. These two rows of axial-flow rotor blades were followed by downstream stator blades and a nozzle. Initially, they sized the waterjet using a one-dimensional optimiza-tion routine based on inducer design theory, limiting the inducer suction performance by using a flow coefficient where the NPSH is 20% greater than the value of NPSH at com-plete head breakdown, as determined from an experimental database. They used the mean streamline method to design the non-cavitating blade sections and used cavitating blade row theory to adjust the blade sections, choosing the incidence angles and thickness distributions to maintain their 20% margin above cavitation breakdown. Next, they used a combination of the mean streamline method and two-dimensional RANS simulations to design the kicker impeller blades, the stator blades, and the nozzle.
In developing an effective, compact wa-terjet system, Stricker, Becnel, and Pur-nell (1994) required an inducer flow coeffi-cient that is typically much higher than the current practice indicated. They stated that they would further develop their optimization method to hydrodynamically integrate the in-let, jet, and hull. Finally, their development work showed them that significant waterjet performance degradation may occur due to air ingestion. For certain flush-inlet waterjet sys-tems, they have shown that air ingestion can lead to breakdown, with very large reductions in torque and thrust.
Waterjet propulsion offers a potential ad-vantage over conventional propellers to re-duce the inboard noise of interest to passenger vessels and the underwater noise of interest to naval vessels. Aartojärvi (1995) discussed noise from waterjet propulsion—focusing on blade-frequency-related tonal noise, but also discussing jet-impingement noise and cavita-tion noise. As a monopole type of noise source, cavitation is an efficient noise radiator with a high-frequency noise component due to bubble collapse and lower-frequency com-ponents due to bubble oscillation, with the relative importance of these components de-pending on cavitation type and pressure gra-dients. For the non-uniform impeller inflow associated with flush inlets, Aartojärvi (1995) reported that normal conditions give rise to suction-side sheet cavitation that varies in volume depending on blade position. Under extreme conditions, suction-side bubble cavi-tation and pressure-side sheet cavitation may also occur. Furthermore, he reported that im-peller cavitation can have a strong influence on blade-frequency noise tones due to cavita-tion volume pulsation. Therefore, he recom-mended that one designs the inlet to produce smooth circumferential wake variations and properly designs the impeller, in order to have impeller cavitation as stationary as possible. Finally, while he felt that one normally de-signs inlets not to have harmful cavitation at conditions of acceptable impeller cavitation, inlet lip cavitation may occur at off-design conditions.
In presenting a parametric method for the prediction of the powering characteristics of waterjets, van Terwisga (1997) stated that the thrust capacity of a waterjet system is gov-erned by either the available engine power or the cavitation limits of the pump. Furthermore, he stated that the constraints limiting the im-peller diameter (or waterjet size) are the available size within the afterbody of the hull and the cavitation in the pump. In developing his parametric method, he needed the resis-tance-speed relation for the hull form, the nozzle diameter—which is based as much on
Specialist Committee on Cavitation
530
optimization of capital costs and operation costs as it is on hydrodynamics—and the spe-cific speed of the pump—which determines the pump type, the pump efficiency, and the cavitation characteristics. Then, in developing his parametric model, van Terwisga (1997) decomposed the overall efficiency into the waterjet’s freestream efficiency—which in-cludes both an ideal efficiency and a waterjet system efficiency—and the waterjet-hull in-teraction efficiency. Finally, he included a parametric approach to determine the cavita-tion characteristics of the pump by using the suction specific speed, SSN . Much of his pre-diction method required calibration using test data, historical empirical data, or CFD com-putations—especially his cavitation limita-tions for various values of SSN .
Allison et al. (1998) gave a good summary of the tools used to design and analyze water-jet propulsors. Despite the assumptions used in one-dimensional theory, they still advo-cated the use of these tools for preliminary design, where they can rapidly generate per-formance maps based on dimensionless quan-tities for head, flow rate, specific speed, and cavitation number—among others. During the pump design, they advocated the use of the streamline curvature method to determine the axisymmetric flow through the waterjet. They used the mean streamline method to design the subcavitating blade sections and cavitat-ing blade-row models to design cavitating blade sections, especially to determine the incidence angles and blade thicknesses. To account for the effect of the nonuniform in-flow on cavitation performance, they stated that most designers use experience factors and developmental test data.
Allison et al. (1998) also discussed the use of lifting-surface theory to design and analyze waterjet pumps, including the coupling with a solver of the axisymmetric RANS equations. This coupling required them to extract the ef-fective flow field from the RANS solution, in order to use the lifting-surface theory during the next iteration. Finally, they discussed the
use of a three-dimensional RANS solver to analyze the waterjet, for both the single-phase and cavitating flow fields.
As part of the development of a commer-cial RANS solver, Athavale et al. (2002) de-veloped a full cavitation model and applied it to three different turbomachinery applications, including a waterjet pump. This full cavita-tion model accounts for first-order effects such as phase change, bubble dynamics, tur-bulent pressure fluctuations, and the presence of non-condensable gasses—with several ap-proximations required to obtain numerical results and further work required to calibrate and validate the model. One of their initial test cases involved an axial-flow pump for a waterjet, with a four-bladed inducer, followed by an eight-bladed impeller (or kicker), as suggested by Allison (1993). Their simulation used a 65,000-cell structured grid—with one inducer passage, two impeller passages, and three cells in the tip gaps of both blades—which is extremely coarse, especially for a viscous (turbulent) computation. However, they did show the expected increase in cavita-tion for a decrease in suction specific speed,
SSN . For the highly cavitating value of SSN , they showed extreme zones of cavitation on the inducer blades, with minimal zones of ca-vitation on the impeller blades. Finally, they showed that the presence of non-condensable gases reduced the pump head, as well as the extent of the cavitation zone.
Carlton (2002) listed problems that he has encountered during full-scale investigations of waterjet propulsion units. His primary con-cerns were cavitation behavior on the pump rotor blades and cavitation erosion on the wa-terjet inlet lip. Cavitation on the rotor blades have led to vibration of the rotating blades and shaft, and eventually led to structural fail-ure. He recommended designing the waterjet inlet, ducting, and pump into the hull struc-ture in an integrated fashion.
Kooiker et al. (2003) studied the effect of IVR on waterjet pump performance by con-
Proceedings of 25th ITTC – Volume II
531
ducting experiments on a waterjet system mounted in a cavitation tunnel. They showed the presence of intake-pump interaction ef-fects, which must be taken into account. The intake generates a distorted flow at the pump inlet phase and impacts pump performance. Increases in IVR—above the design value—led to increases in head coefficient and pump efficiency. Within the pump, sheet cavitation on the rotor blades was more sensitive to IVR than the rotor tip vortex cavitation.
In a pump test, Gowing (2005) tested a waterjet with axial-flow rotor blades followed by downstream stator blades. With a smaller diameter than a corresponding mixed-flow waterjet, this axial-flow waterjet was devel-oped for a high-power slender-hull vessel. For three different flow rates, Gowing (2005) re-duced the tunnel pressure and first observed cavitation in the rotor/duct gap and then along the leading edge of the rotor blades. He de-termined cavitation breakdown by measuring the total-pressure rise across the pump as he reduced the tunnel pressure. Just before the onset of cavitation breakdown, he observed a 2-3% rise in total pressure, followed by a sudden and dramatic decrease in total pres-sure, defining the actual onset of breakdown as the value of NPSH where he measured a 3% decrease in total pressure relative to the design value. Using static-pressure taps, Kiel probes, and LDV, he also acquired measure-ments of the flow field and compared them with CFD results.
Finally, Kerwin (2007) reviewed the wa-terjet design and analysis methods for inlets and, primarily, pumps. He discussed some of the methods already discussed here with a fo-cus on RANS solvers and on a lifting-surface method coupled with an Euler/boundary-layer code, to provide a fast means of accounting for some of the viscous effects. While he did mention cavitation inception within the rotor tip-leakage vortex, he did not review cavita-tion modeling for either waterjet design or analysis.
B.4 Waterjet Nozzles
Cavitation within a waterjet propulsion system varies with static pressure. The low static pressure associated with waterjet in-lets—which can be situated at low depths may lead to cavitation issues, especially at off-design values of IVR. For most waterjets, the static pressure increases as the water flows through the diffusing inlet, in an effort to improve the cavitation performance of the downstream rotor blades. The rotor blades add energy into the water and further increase the static pressure, but large local regions of strongly accelerated flow gives rise to cavita-tion within the rotor blades. Downstream of the rotor blades, waterjet pumps incorporate stator blades to remove the absolute swirl from the flow and raise the static pressure available to the nozzle. Well-designed blade rows will eliminate any possible hub vortex, which would certainly lead to cavitation. If a waterjet operates with no major cavitation is-sues on the rotor blades, the stator blades should not experience any cavitation issues—unless the rotor-blade tip-leakage vortex cavi-tates, and this cavitating vortex impinges on the stator blades, leading to a possible erosion issue.
Further downstream, the nozzle acceler-ates the flow, decreasing the static pressure to the ambient value and achieving a high jet velocity. As accelerating devices, well-designed nozzles should have small total-pressure losses. Most waterjet nozzles dis-charge the flow above the surface of the wa-ter—at least for higher ship speeds—although submerged, or partially-submerged, nozzles do exist. Nozzles may have a well-rounded entrance that leads to a parallel throat, such that the nozzle exit area equals the minimum jet area. However, other waterjet nozzles may simply have inner and outer peripheral walls that are straight and parallel, which leads to a vena contracta downstream of the nozzle exit. As pointed out by Allison (1993), it is possi-ble for parallel-throat nozzles to experience
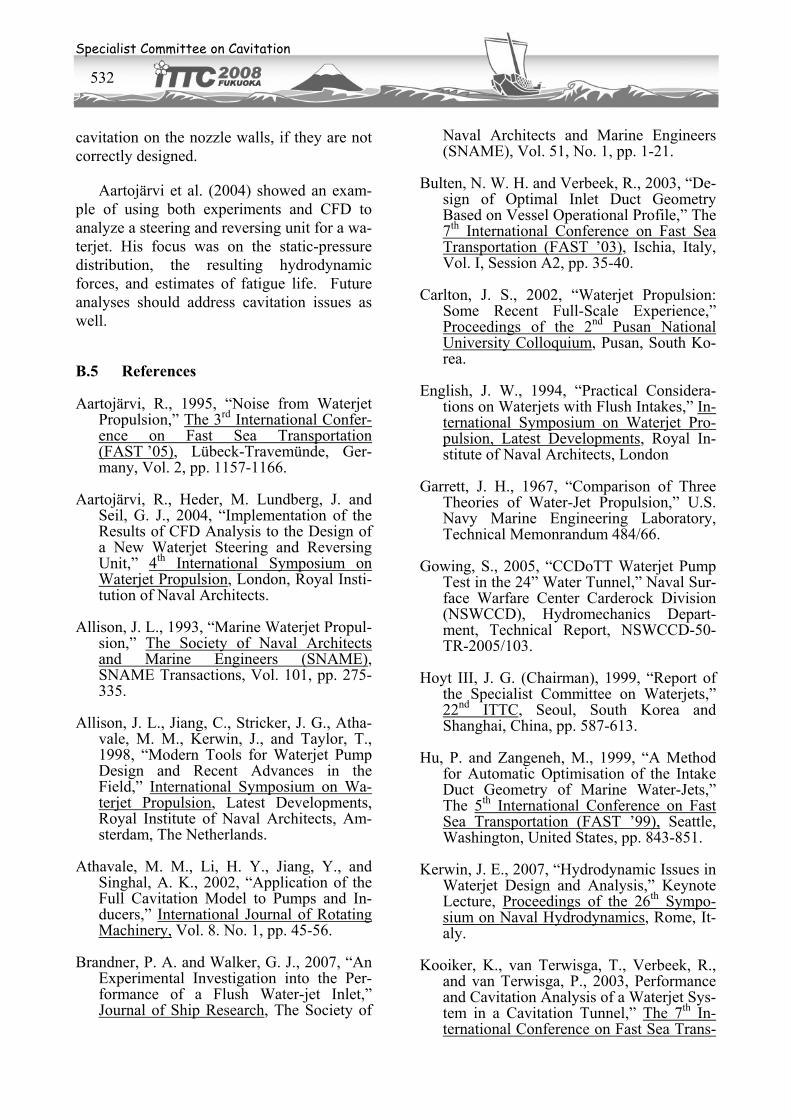
Specialist Committee on Cavitation
532
cavitation on the nozzle walls, if they are not correctly designed.
Aartojärvi et al. (2004) showed an exam-ple of using both experiments and CFD to analyze a steering and reversing unit for a wa-terjet. His focus was on the static-pressure distribution, the resulting hydrodynamic forces, and estimates of fatigue life. Future analyses should address cavitation issues as well.
B.5 References
Aartojärvi, R., 1995, “Noise from Waterjet Propulsion,” The 3rd International Confer-ence on Fast Sea Transportation (FAST ’05), Lübeck-Travemünde, Ger-many, Vol. 2, pp. 1157-1166.
Aartojärvi, R., Heder, M. Lundberg, J. and Seil, G. J., 2004, “Implementation of the Results of CFD Analysis to the Design of a New Waterjet Steering and Reversing Unit,” 4th International Symposium on Waterjet Propulsion, London, Royal Insti-tution of Naval Architects.
Allison, J. L., 1993, “Marine Waterjet Propul-sion,” The Society of Naval Architects and Marine Engineers (SNAME), SNAME Transactions, Vol. 101, pp. 275-335.
Allison, J. L., Jiang, C., Stricker, J. G., Atha-vale, M. M., Kerwin, J., and Taylor, T., 1998, “Modern Tools for Waterjet Pump Design and Recent Advances in the Field,” International Symposium on Wa-terjet Propulsion, Latest Developments, Royal Institute of Naval Architects, Am-sterdam, The Netherlands.
Athavale, M. M., Li, H. Y., Jiang, Y., and Singhal, A. K., 2002, “Application of the Full Cavitation Model to Pumps and In-ducers,” International Journal of Rotating Machinery, Vol. 8. No. 1, pp. 45-56.
Brandner, P. A. and Walker, G. J., 2007, “An Experimental Investigation into the Per-formance of a Flush Water-jet Inlet,” Journal of Ship Research, The Society of
Naval Architects and Marine Engineers (SNAME), Vol. 51, No. 1, pp. 1-21.
Bulten, N. W. H. and Verbeek, R., 2003, “De-sign of Optimal Inlet Duct Geometry Based on Vessel Operational Profile,” The 7th International Conference on Fast Sea Transportation (FAST ’03), Ischia, Italy, Vol. I, Session A2, pp. 35-40.
Carlton, J. S., 2002, “Waterjet Propulsion: Some Recent Full-Scale Experience,” Proceedings of the 2nd Pusan National University Colloquium, Pusan, South Ko-rea.
English, J. W., 1994, “Practical Considera-tions on Waterjets with Flush Intakes,” In-ternational Symposium on Waterjet Pro-pulsion, Latest Developments, Royal In-stitute of Naval Architects, London
Garrett, J. H., 1967, “Comparison of Three Theories of Water-Jet Propulsion,” U.S. Navy Marine Engineering Laboratory, Technical Memonrandum 484/66.
Gowing, S., 2005, “CCDoTT Waterjet Pump Test in the 24” Water Tunnel,” Naval Sur-face Warfare Center Carderock Division (NSWCCD), Hydromechanics Depart-ment, Technical Report, NSWCCD-50-TR-2005/103.
Hoyt III, J. G. (Chairman), 1999, “Report of the Specialist Committee on Waterjets,” 22nd ITTC, Seoul, South Korea and Shanghai, China, pp. 587-613.
Hu, P. and Zangeneh, M., 1999, “A Method for Automatic Optimisation of the Intake Duct Geometry of Marine Water-Jets,” The 5th International Conference on Fast Sea Transportation (FAST ’99), Seattle, Washington, United States, pp. 843-851.
Kerwin, J. E., 2007, “Hydrodynamic Issues in Waterjet Design and Analysis,” Keynote Lecture, Proceedings of the 26th Sympo-sium on Naval Hydrodynamics, Rome, It-aly.
Kooiker, K., van Terwisga, T., Verbeek, R., and van Terwisga, P., 2003, Performance and Cavitation Analysis of a Waterjet Sys-tem in a Cavitation Tunnel,” The 7th In-ternational Conference on Fast Sea Trans-
Proceedings of 25th ITTC – Volume II
533
portation (FAST ’03), Ischia, Italy, Vol. I, Session A1, pp. 57-62.
Kruppa, C. (Chairman), 1996, “Report of the Specialist Committee on Waterjets,” 21st ITTC, Trondheim and Bergen, Norway, pp. 189-209.
Roy, S. M., 1994, “The Evolution of the Modern Waterjet Marine Propulsion Unit,” International Symposium on Wa-terjet Propulsion, Latest Developments, Royal Institute of Naval Architects, Lon-don.
Seil, G. J., Fletcher, C. A. J., and Doctors, L. J., 1997, “Optimisation of Waterjet Inlets Using Computational Fluid Dynamics,” The 4th International Conference on Fast Sea Transportation (FAST ’97), Sydney, Australia, Vol. 1, pp. 59-64.
Steen, S. and Minsaas, K. J., 1995, “Experi-ences from Design and Testing of Water-jet Inlets for High Speed Craft,” The 3rd International Conference on Fast Sea Transportation (FAST ’95), Lübeck-Travemünde, Germany, Vol. 2, pp. 255-1270.
Stricker, J. G, Becnel, A. J., and Purnell, J. G., 1994, “Some Important Factors in Devel-opment of Waterjet Systems,” Interna-tional Symposium on Waterjet Propulsion, Latest Developments, Royal Institute of Naval Architects, London, Great Britain.
van Terwisga, T. J. C., 1997, “A Parametric Propulsion Prediction Method for Water-jet Drive Craft,” The 4th International Conference on Fast Sea Transportation (FAST ’97), Sydney, Australia, Vol. 2, pp. 661-667.
van Terwisga, T. J. C. (Chairman), 2002, “Report of the Specialist Committee on Validation of Waterjet Test Procedures,” 23rd ITTC, Venice, Italy, Vol. II, pp. 379-407.
van Terwisga, T. J. C. (Chairman), 2005, “Report of the Specialist Committee on Validation of Waterjet Test Procedures,” 24th ITTC, Edinburgh, United Kingdom, Vol. II, pp. 471-508.
Verbeek, R, 1992, “Application of Waterjets in High-Speed Craft,” Hydrodynamics: Computations, Model Tests and Reality, Proceedings of MARIN Workshops on Advanced Vessels, Station Keeping, Pro-pulsor-Hull Interaction, and Nautical Si-mulators, Maritime Research Institute Netherlands (MARIN), Wageningen, The Netherlands.
Wilson, M. B., Hoyt III, J. G., Scherer, J. O., Gorski, J. J., and Becnel, A. J., 2003, “The Gulf Coast Waterjet Design and Experi-mental Evaluation Project for a Small Navy Ship,” SNAME Propeller/Shafting 2003 Symposium, Virginia Beach, Vir-ginia, pp. 18-1~18-19.
Wislicenus, G. F., 1973, “Hydrodynamic De-sign Principles of Pumps and Ducting for Waterjet Propulsion,” Report 3990, De-partment of the Navy, Naval Ship Re-search and Development Center, Bethesda, Maryland.
Wislicenus, G. F., 1986, “Preliminary Design of Turbopumps and Related Machinery, NASA Reference Publication 1170, Na-tional Aeronautics and Space Administra-tion, Scientific and Technical Information Branch.