Embed Size (px)
Citation preview

Special Education Annual Performance Report
Presented by:Jody A. Fields, Ph.D.
2015 Special Education Data Summit, June 15-16, 2015Holiday Inn Airport Conference Center, Little Rock, AR

Trivia 1How many indicators are reported on the local education agency (LEA) Annual Performance Report?
5 points
Section 616 of IDEA
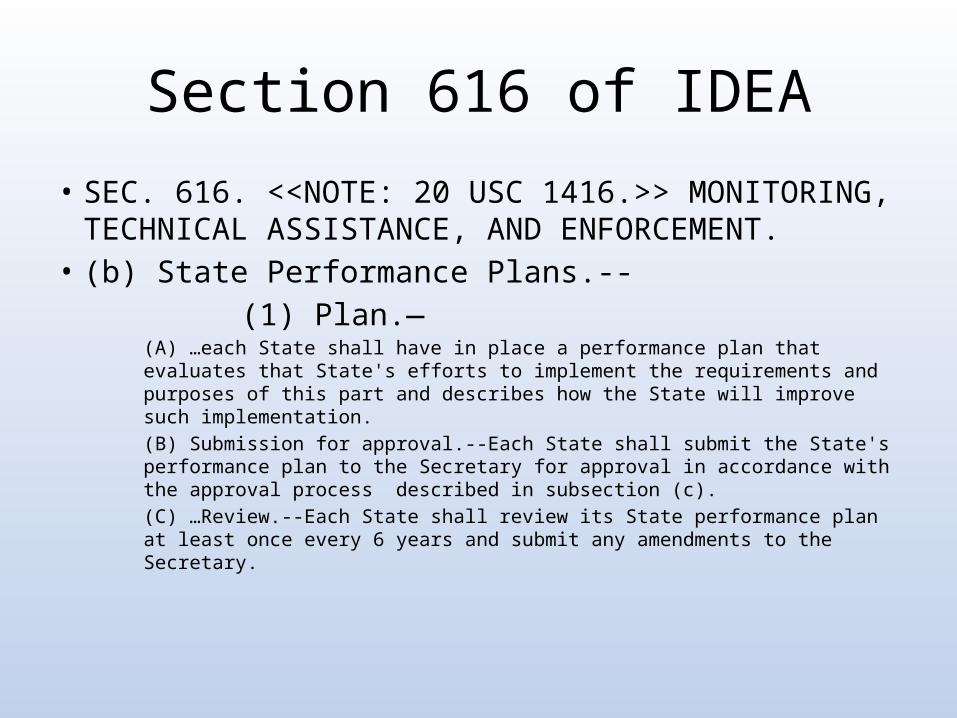
• SEC. 616. <<NOTE: 20 USC 1416.>> MONITORING, TECHNICAL ASSISTANCE, AND ENFORCEMENT.
• (b) State Performance Plans.-- (1) Plan.—
(A) …each State shall have in place a performance plan that evaluates that State's efforts to implement the requirements and purposes of this part and describes how the State will improve such implementation.(B) Submission for approval.--Each State shall submit the State's performance plan to the Secretary for approval in accordance with the approval process described in subsection (c).(C) …Review.--Each State shall review its State performance plan at least once every 6 years and submit any amendments to the Secretary.
Section 616 of IDEA
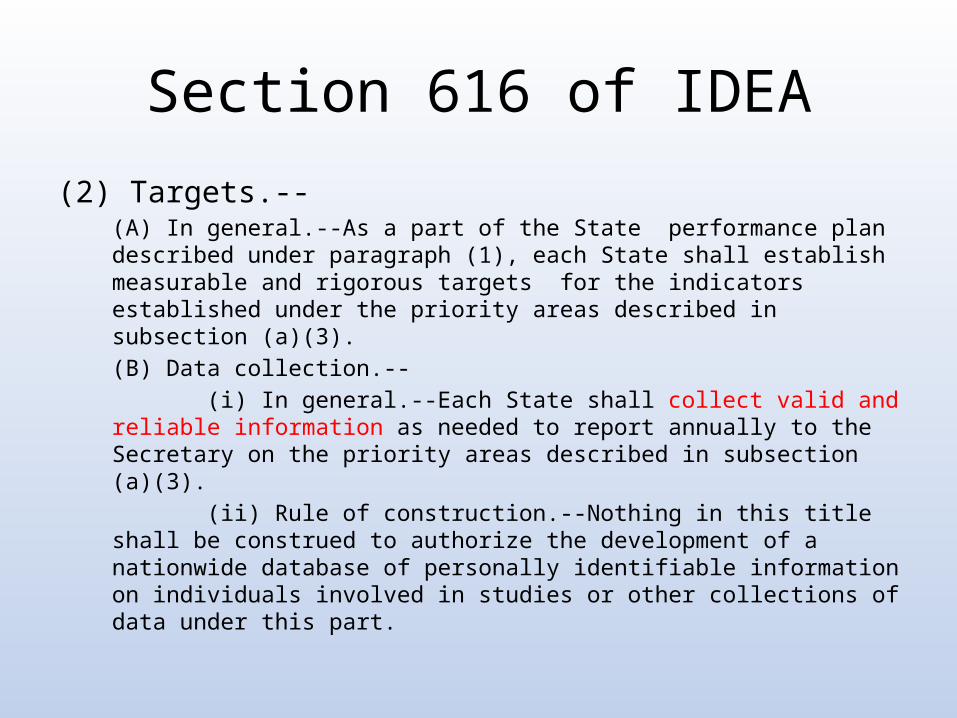
(2) Targets.--(A) In general.--As a part of the State performance plan described under paragraph (1), each State shall establish measurable and rigorous targets for the indicators established under the priority areas described in subsection (a)(3). (B) Data collection.-- (i) In general.--Each State shall collect valid and reliable information as needed to report annually to the Secretary on the priority areas described in subsection (a)(3). (ii) Rule of construction.--Nothing in this title shall be construed to authorize the development of a nationwide database of personally identifiable information on individuals involved in studies or other collections of data under this part.

Trivia 1 Answer
1. Graduation 2. Dropout 3. AssessmentA-C
4. DisciplineA-B
5. SA LREA-C
6. EC LREA-B
7. EC OutcomesA-B x 3
8. Family Outcomes
9. Disproportionality - Identification
10. Disproportionality - Disability
11. Child Find 12. C to B Transition
13. Secondary Transition
14. Post-school Outcomes
Timely and Accurate Reporting
Section 616 of IDEA(2) Targets.--
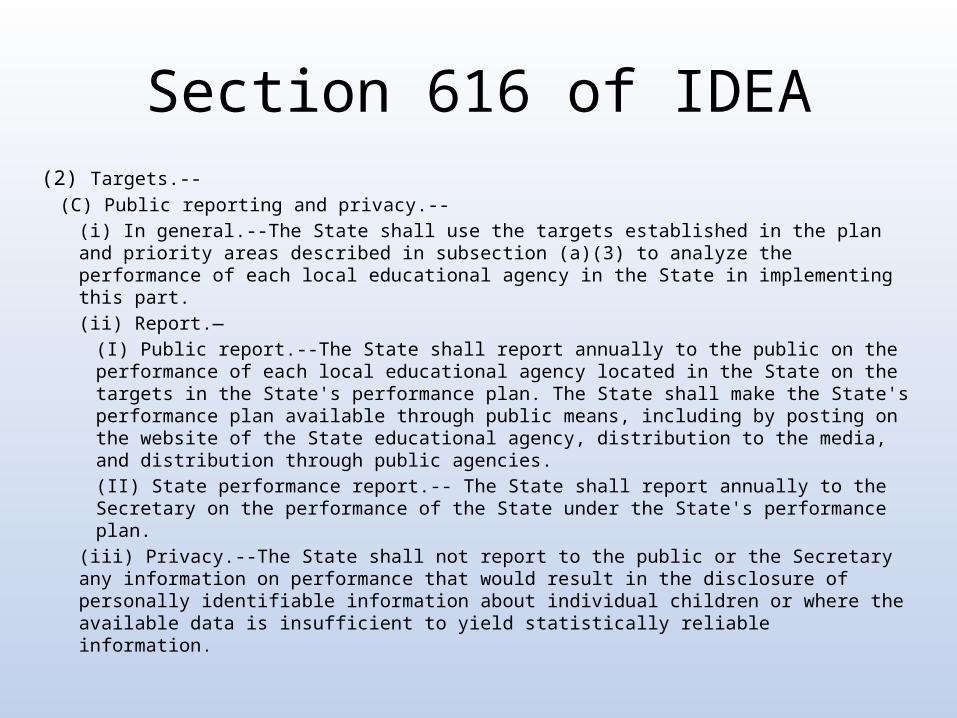
(C) Public reporting and privacy.--(i) In general.--The State shall use the targets established in the plan and priority areas described in subsection (a)(3) to analyze the performance of each local educational agency in the State in implementing this part.(ii) Report.—
(I) Public report.--The State shall report annually to the public on the performance of each local educational agency located in the State on the targets in the State's performance plan. The State shall make the State's performance plan available through public means, including by posting on the website of the State educational agency, distribution to the media, and distribution through public agencies.(II) State performance report.-- The State shall report annually to the Secretary on the performance of the State under the State's performance plan.
(iii) Privacy.--The State shall not report to the public or the Secretary any information on performance that would result in the disclosure of personally identifiable information about individual children or where the available data is insufficient to yield statistically reliable information.
Trivia 2There are four related indicators that when you sum their indicator numbers together they equal 30. What are the name the four indicators (number or name)?
4 points for 4; 3 points for 3; 2 points for 2; 1 point for 1

Indicator 1: GraduationResults indicator: Percent of youth with IEPs graduating from high school with a regular diploma. (20 U.S.C. 1416 (a)(3)(A))
Calculation: – The four-year graduation rate follows a cohort, or a group of
students, who begin as first-time 9th graders in a particular school year and who graduate with a regular high school diploma in four years or less.
– The cohort is "adjusted" by adding any students transferring into the cohort and by subtracting any students who transfers out, emigrate to another country, or die during the years covered by the rate.
– All subcategories are identified in their initial 9th grade year except race which identified at 12th grade.

Indicator 1: Graduation
FFY 2005 2006 2007 2008 2009 2010 2011 2012
Target ≥ 88.00% 89.00% 77.00% 77.00% 85.00% 85.00% 85.00%
Data 87.49% 94.15% 90.18% 81.42% 81.42% 75.76% 75.31% 79.15%
Number of youth with IEPs in the current year's adjusted cohort
graduating with a regular diploma
Number of youth with IEPs in the current year's adjusted cohort eligible to graduate
FFY 2012Data
FFY 2013Target
FFY 2013Data
2,681 3,333 79.15% 85.00% 80.44%
Historical Data
FFY 2013 SPP/APR Data
FFY 2013 2014 2015 2016 2017 2018
Target ≥ 85.00% 85.00% 85.00% 85.00% 85.00% 85.00%
SPP/APR Targets
Trivia 2 Answer
1. Graduation 2. Dropout 13. Secondary Transition
14. Post-school Outcomes
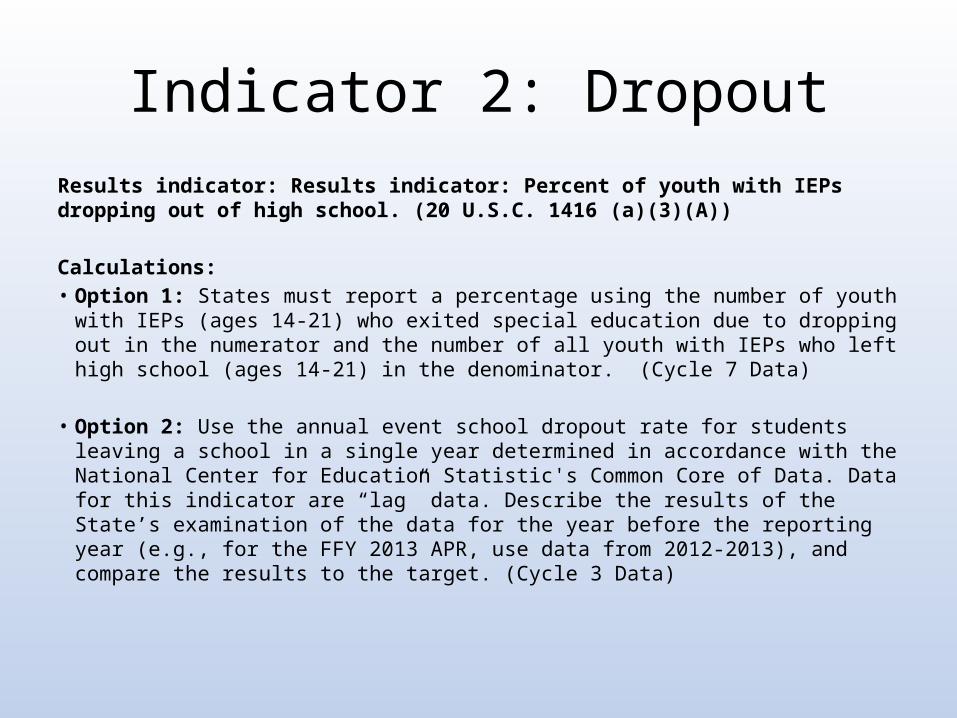
Indicator 2: DropoutResults indicator: Results indicator: Percent of youth with IEPs dropping out of high school. (20 U.S.C. 1416 (a)(3)(A))
Calculations: • Option 1: States must report a percentage using the number of youth with IEPs
(ages 14-21) who exited special education due to dropping out in the numerator and the number of all youth with IEPs who left high school (ages 14-21) in the denominator. (Cycle 7 Data)
• Option 2: Use the annual event school dropout rate for students leaving a school in a single year determined in accordance with the National Center for Education Statistic's Common Core of Data. Data for this indicator are “lag” data. Describe the results of the State’s examination of the data for the year before the reporting year (e.g., for the FFY 2013 APR, use data from 2012-2013), and compare the results to the target. (Cycle 3 Data)

Indicator 2: Dropout
FFY 2005 2006 2007 2008 2009 2010 2011 2012
Target ≤ 2.83% 2.87% 4.25% 4.20% 4.20% 4.20%
Data 2.59% 3.51% 3.37% 4.28% 3.66% 3.06% 2.92% 2.62%
Number of youth with IEPs (ages 14-21) who exited special education due to dropping out
Total number of all youth with IEPs who left high school (ages 14-21)
FFY 2012Data
FFY 2013Target
FFY 2013Data
433 22,032 2.62% 2.77% 1.97%
Historical Data
FFY 2013 SPP/APR Data
FFY 2013 2014 2015 2016 2017 2018
Target ≤ 2.77% 2.62% 2.54% 2.29% 2.14% 1.98%
SPP/APR Targets

Trivia 3Early childhood has how many indicators reported in the LEA APR Report?
5 points

Indicator 3: Assessment
Results indicator: Participation and performance of children with IEPs on Statewide assessments:
A. Percent of the districts with a disability subgroup that meets the State’s minimum “n” size that meet the State’s AYP/AMO targets for the disability subgroup.
B. Participation rate for children with IEPs.C. Proficiency rate for children with IEPs against grade
level, modified and alternate academic achievement standards.
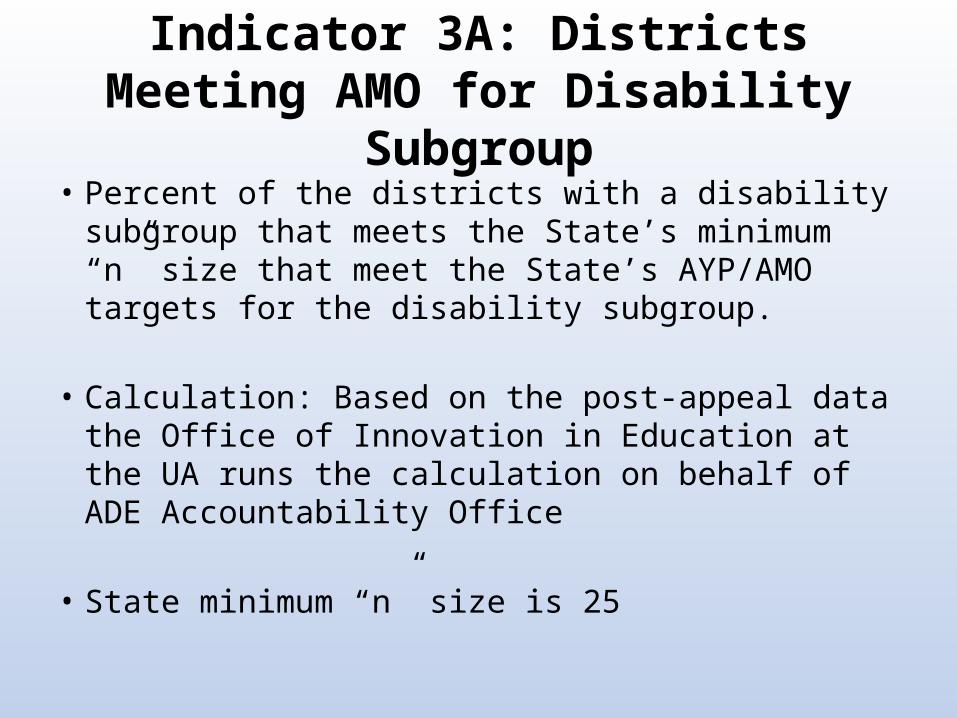
Indicator 3A: Districts Meeting AMO for Disability Subgroup
• Percent of the districts with a disability subgroup that meets the State’s minimum “n” size that meet the State’s AYP/AMO targets for the disability subgroup.
• Calculation: Based on the post-appeal data the Office of Innovation in Education at the UA runs the calculation on behalf of ADE Accountability Office
• State minimum “n” size is 25

Indicator 3A: Districts Meeting AMO for Disability Subgroup
FFY 2005 2006 2007 2008 2009 2010 2011 2012
Target ≥ 16.95% 17.15% 17.15% 17.15%
Data 16.67% 13.64% 6.25% 19.38% 34.25%
Number of districts in
the State
Number of districts that met the minimum "n"
size
Number of districts that meet the minimum "n" size AND met
AMOFFY 2012
DataFFY 2013
TargetFFY 2013
Data
256 252 4 34.25% 17.16% 1.59%
Historical Data
FFY 2013 SPP/APR Data
FFY 2013 2014 2015 2016 2017 2018
Target ≥ 17.16% 17.65% 18.14% 18.63% 19.12% 19.61%
SPP/APR Targets

Trivia 3 Answer
6. EC LREA-B
7. EC OutcomesA-B x 3
8. Family Outcomes
11. Child Find 12. C to B Transition
Timely and Accurate Reporting
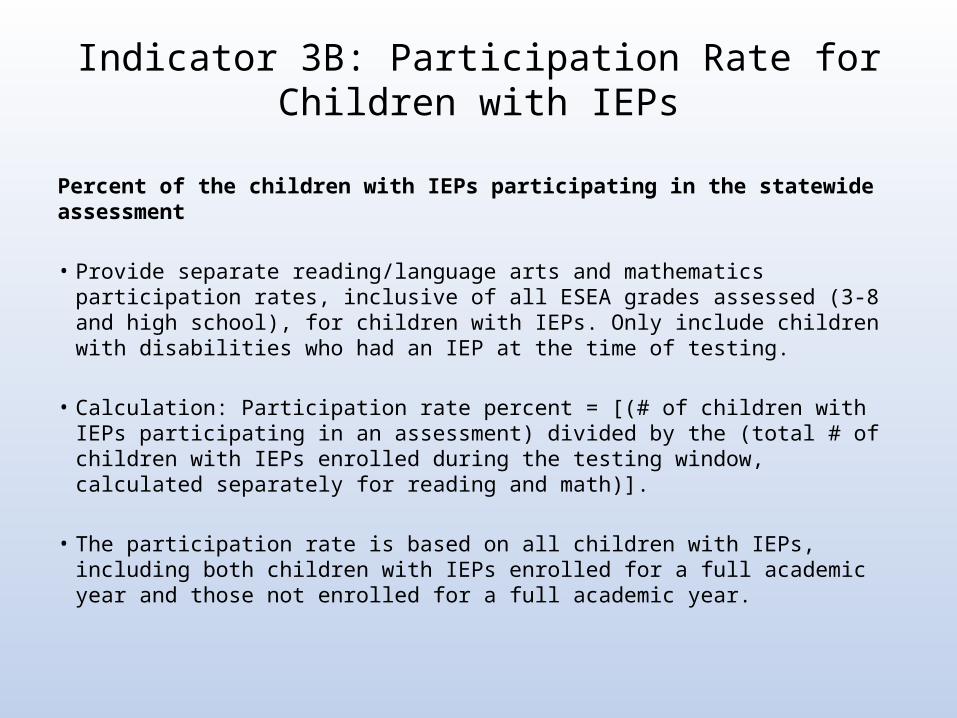
Indicator 3B: Participation Rate for Children with IEPs
Percent of the children with IEPs participating in the statewide assessment
• Provide separate reading/language arts and mathematics participation rates, inclusive of all ESEA grades assessed (3-8 and high school), for children with IEPs. Only include children with disabilities who had an IEP at the time of testing.
• Calculation: Participation rate percent = [(# of children with IEPs participating in an assessment) divided by the (total # of children with IEPs enrolled during the testing window, calculated separately for reading and math)].
• The participation rate is based on all children with IEPs, including both children with IEPs enrolled for a full academic year and those not enrolled for a full academic year.

Indicator 3B: Participation Rate for Children with IEPs
FFY 2005 2006 2007 2008 2009 2010 2011 2012
Targets for Reading and Mathematics ≥ 95.00% 95.00% 95.00% 95.00% 95.00% 95.00% 95.00% 95.00%
State Rate: Reading 96.56% 97.84% 98.62% 98.59% 99.12% 98.78% 98.81% 97.81%
State Rate: Mathematics 96.56% 97.84% 98.62% 98.02% 98.88% 98.61% 98.61% 97.69%
Historical Data
FFY 2013 2014 2015 2016 2017 2018
Target s for Reading and Mathematics Participation ≥ 95.00% 95.00% 95.00% 95.00% 95.00% 95.00%
SPP/APR Targets

Indicator 3B: Participation Rate for Children with IEPs: Reading
FFY 2013 Assessment Data Groups: ReadingReading assessment participation data by grade
Grade 3 4 5 6 7 8 HS
a. Children with IEPs 4690 4713 4615 4474 4254 4042 3394
b. IEPs in regular assessment with no accommodations 1309 987 850 688 650 606 464
c. IEPs in regular assessment with accommodations 2793 3064 3085 3092 2936 2769 2032
f. IEPs in alternate assessment against alternate standards 497 575 597 602 574 571 752
Number of Childrenwith IEPs
Number of Children withIEPs participating
FFY 2012 Data
FFY 2013 Target
FFY 2013 Data
Reading 30,182 29,493 97.81% 95.00% 97.72%
FFY 2013 SPP/APR Data: Reading

Indicator 3B: Participation Rate for Children with IEPs: Mathematics
FFY 2013 Assessment Data Groups: MathematicsMathematics assessment participation data by grade
Grade 3 4 5 6 7 8 HS
a. Children with IEPs 4720 4736 4643 4511 4301 4085 5674
b. IEPs in regular assessment with no accommodations
1310
987
850
688
650
606
869
c. IEPs in regular assessment with accommodations
2793
3064
3086
3092
2936
2769
2239
f. IEPs in alternate assessment against alternate standards 497 575 597 602 574 571 2305
Number of Childrenwith IEPs
Number of Children withIEPs participating
FFY 2012 Data
FFY 2013 Target
FFY 2013 Data
Mathematics 32,670 31,660 97.69% 95.00% 96.91%
FFY 2013 SPP/APR Data: Mathematics

Indicator 3C: Proficiency rate for children with IEPs against grade level, modified and alternate academic
achievement standards.
• Proficiency rate percent = ([(# of children with IEPs scoring at or above proficient against grade level, modified and alternate academic achievement standards) divided by the (total # of children with IEPs who received a valid score and for whom a proficiency level was assigned, and, calculated separately for reading and math)]. The proficiency rate includes both children with IEPs enrolled for a full academic year and those not enrolled for a full academic year.
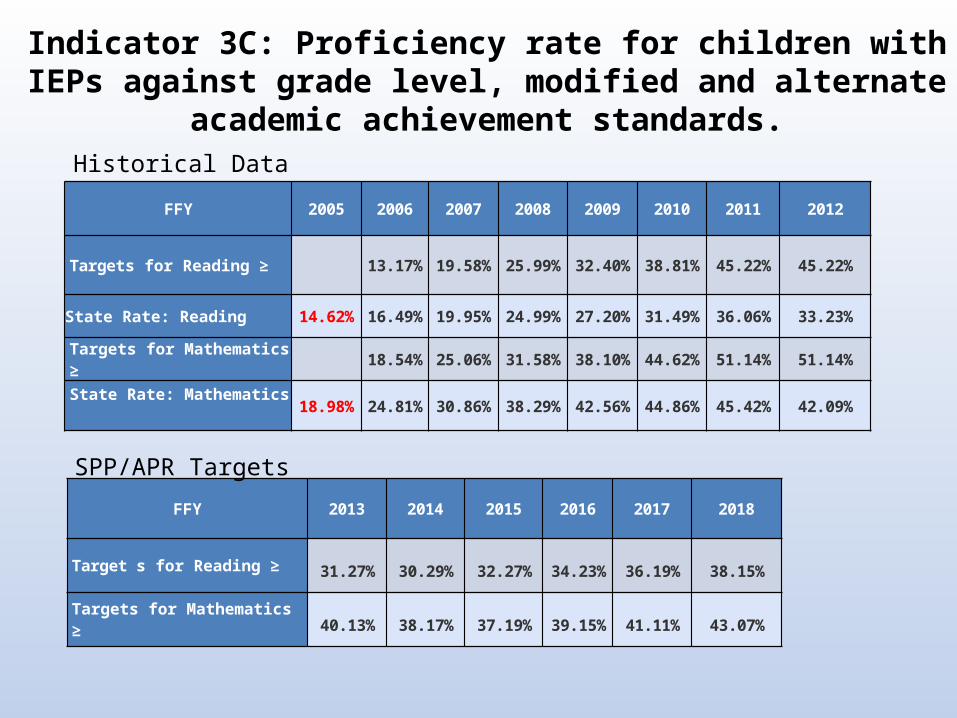
Indicator 3C: Proficiency rate for children with IEPs against grade level, modified and alternate academic achievement standards.
FFY 2005 2006 2007 2008 2009 2010 2011 2012
Targets for Reading ≥ 13.17% 19.58% 25.99% 32.40% 38.81% 45.22% 45.22%
State Rate: Reading 14.62% 16.49% 19.95% 24.99% 27.20% 31.49% 36.06% 33.23%
Targets for Mathematics ≥ 18.54% 25.06% 31.58% 38.10% 44.62% 51.14% 51.14%
State Rate: Mathematics 18.98% 24.81% 30.86% 38.29% 42.56% 44.86% 45.42% 42.09%
Historical Data
FFY 2013 2014 2015 2016 2017 2018
Target s for Reading ≥
31.27%
30.29%
32.27%
34.23%
36.19%
38.15%
Targets for Mathematics ≥
40.13%
38.17%
37.19%
39.15%
41.11%
43.07%
SPP/APR Targets

Indicator 3C: Proficiency rate for children with IEPs against grade level, modified and alternate academic
achievement standards.
Reading proficiency data by gradeGrade 3 4 5 6 7 8 HS
a. Children with IEPs who received a valid score and a proficiency was assigned 4,599 4,626 4,532 4,382 4,160 3,946 3,248
b. IEPs in regular assessment with no accommodations scored at or above proficient against grade level 835 717 557 289 264 201 93
c. IEPs in regular assessment with accommodations scored at or above proficient against grade level 522 828 750 329 558 559 262
f. IEPs in alternate assessment against alternate standards scored at or above proficient against grade level
331 372 393 399 359 281 616
FFY 2013 Assessment Data Groups: Reading
Children with IEPs who received a valid score and a proficiency was assigned
Number of Children with IEPs Proficient
FFY 2012 Data
FFY 2013 Target
FFY 2013 Data
Reading 9,515 29,493 33.23% 31.27% 32.26%
FFY 2013 SPP/APR Data: Reading

Indicator 3C: Proficiency rate for children with IEPs against grade level, modified and alternate academic
achievement standards.
Reading proficiency data by gradeGrade 3 4 5 6 7 8 HS
a. Children with IEPs who received a valid score and a proficiency was assigned 4,599 4,626 4,532 4,382 4,160 3,946 3,248
b. IEPs in regular assessment with no accommodations scored at or above proficient against grade level 835 717 557 289 264 201 93
c. IEPs in regular assessment with accommodations scored at or above proficient against grade level 522 828 750 329 558 559 262
f. IEPs in alternate assessment against alternate standards scored at or above proficient against grade level 331 372 393 399 359 281 616
FFY 2013 Assessment Data Groups: Mathematics
Children with IEPs who received a valid score and a proficiency was assigned
Number of Children with IEPs Proficient
FFY 2012 Data
FFY 2013 Target
FFY 2013 Data
Mathematics 12,842 31,600 42.09% 40.13% 40.56%
FFY 2013 SPP/APR Data: Mathematics
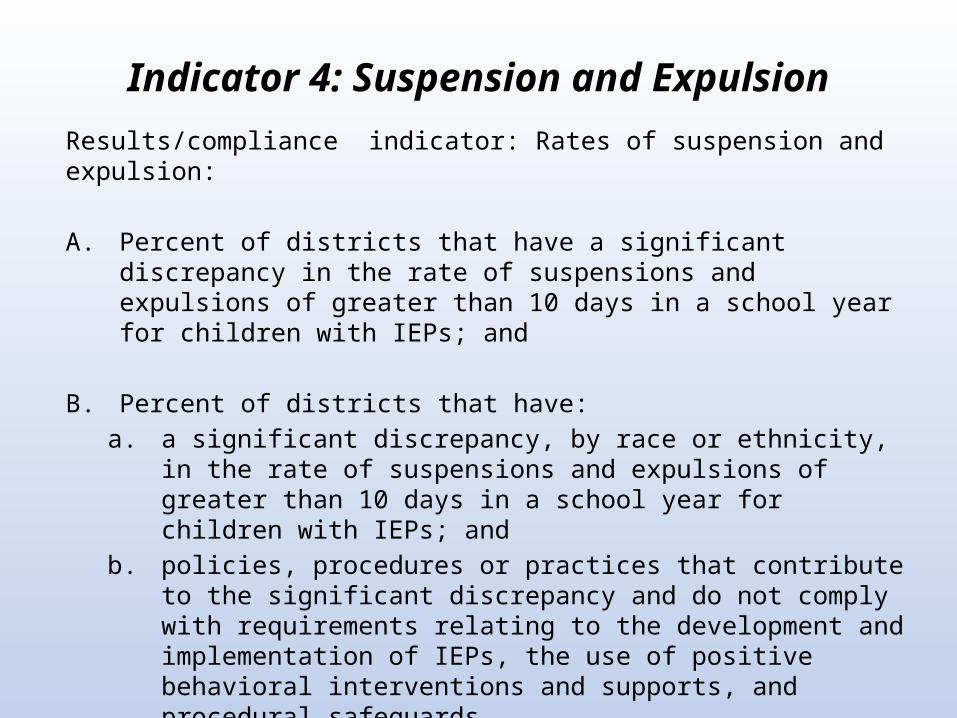
Indicator 4: Suspension and ExpulsionResults/compliance indicator: Rates of suspension and expulsion: A. Percent of districts that have a significant discrepancy in the rate of
suspensions and expulsions of greater than 10 days in a school year for children with IEPs; and
B. Percent of districts that have: a. a significant discrepancy, by race or ethnicity, in the rate of suspensions
and expulsions of greater than 10 days in a school year for children with IEPs; and
b. policies, procedures or practices that contribute to the significant discrepancy and do not comply with requirements relating to the development and implementation of IEPs, the use of positive behavioral interventions and supports, and procedural safeguards.
Note: This measurement is for all students in K-12.

4A: Suspension and ExpulsionMeasurement: Percent = [(# of districts that have a significant discrepancy in the rates of suspensions and expulsions for greater than 10 days in a school year of children with IEPs) divided by the (# of districts in the State)] times 100
This is a hybrid indicator. Part I: Identify districts as having a significant discrepancy. Rate of students receiving out-of-school suspensions/expulsion totaling greater than 10 days.
Rate of special education – Rate of general education
If special education’s rate is 1.36 percentage points higher than general education’s rate then the district is identified as having a significant discrepancy.
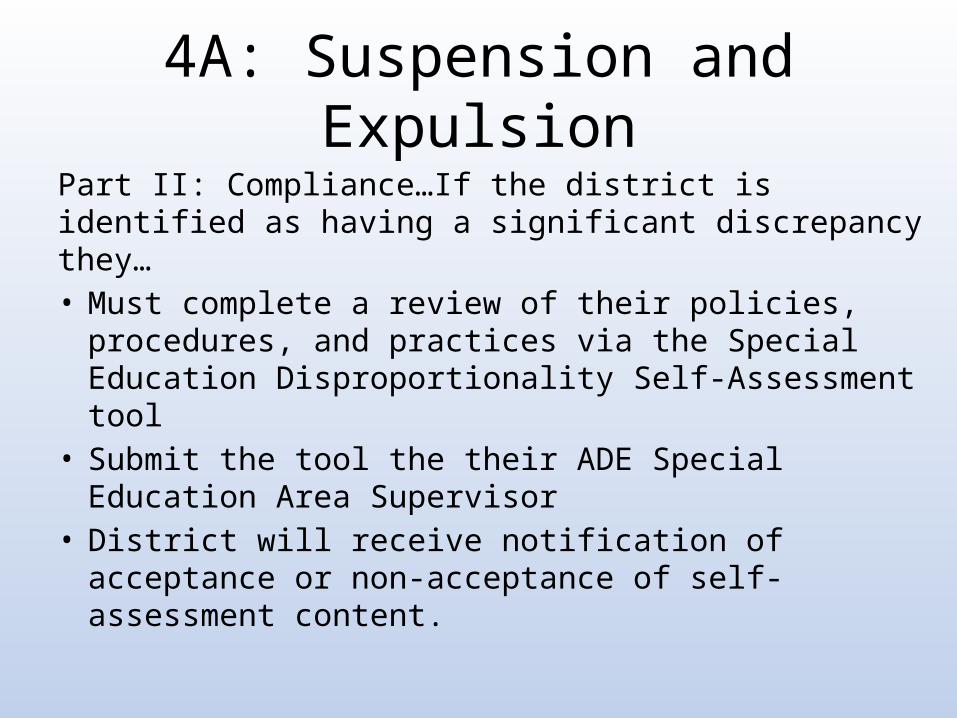
4A: Suspension and Expulsion
Part II: Compliance…If the district is identified as having a significant discrepancy they…• Must complete a review of their policies, procedures,
and practices via the Special Education Disproportionality Self-Assessment tool
• Submit the tool the their ADE Special Education Area Supervisor
• District will receive notification of acceptance or non-acceptance of self-assessment content.

Indicator 4A: Percent of districts that have a significant discrepancy in the rate of suspensions and expulsions of
greater than 10 days in a school year for children with IEPs
FFY 2005 2006 2007 2008 2009 2010 2011 2012
Target ≤ 7.59% 7.11% 7.11% 7.00% 6.23% 6.23% 6.23%
Data 9.06% 7.57% 11.76% 11.76% 7.86% 6.91% 10.26% 3.69%
Number of districts that have a significant discrepancy Number of districts in the State FFY 2012
DataFFY 2013
TargetFFY 2013
Data
12 258 3.69% 5.77% 4.65%
Historical Data
FFY 2013 SPP/APR Data
FFY 2013 2014 2015 2016 2017 2018
Target ≤ 5.77% 5.43% 5.11% 4.78% 4.45% 4.12%
SPP/APR Targets

Trivia 4There are 3.5 indicators that address disproportionality; What are the indicator numbers and names of at least two of the indicators. (Number and name)
4 points for 3.5; 2 points for 2; 1 point for 1

Indicator 4B: Disproportionality in Suspension and Expulsion
Compliance indicator: Rates of suspension and expulsion:
Percent of districts that have:a. a significant discrepancy, by race or ethnicity, in the rate
of suspensions and expulsions of greater than 10 days in a school year for children with IEPs; and
b. policies, procedures or practices that contribute to the significant discrepancy and do not comply with requirements relating to the development and implementation of IEPs, the use of positive behavioral interventions and supports, and procedural safeguards.

Indicator 4B: Disproportionality in Suspension and Expulsion
Measurement:Special Education by race the rate of student with IEPs suspended/ expelled for greater than 10 days
General Education overall: the rate of general education students suspended suspended/expelled for greater than 10 days (not by race)
Rate = Special education rate for Hispanic - General education rate for all
races
If the special education rate 4 percentage points higher than general education for a particular race then the district is identified as having a significant discrepancy in discipline for that race.
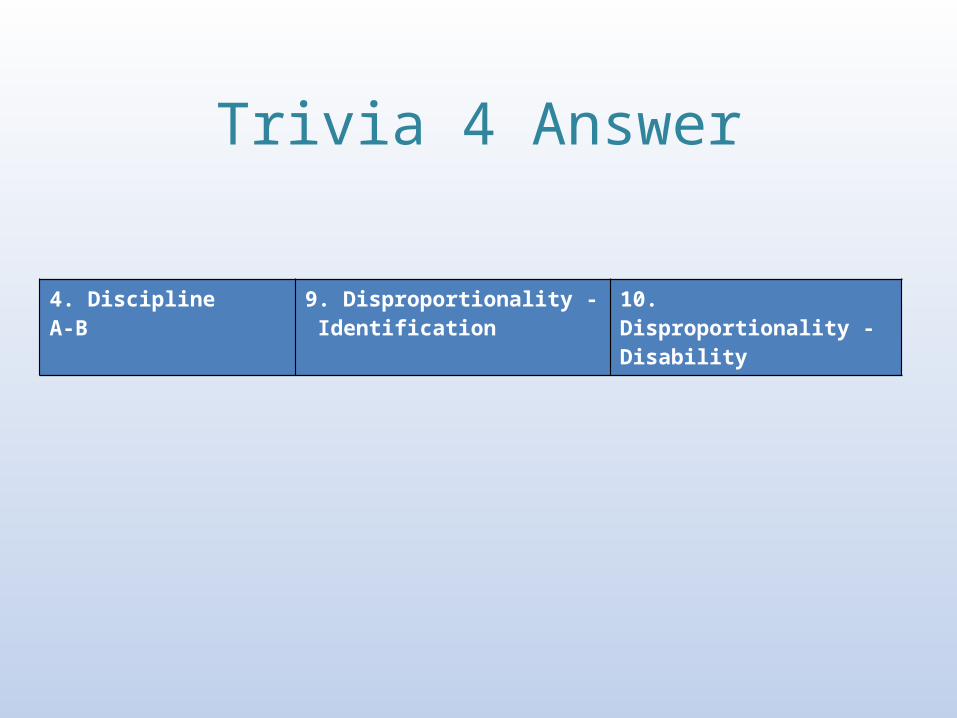
Trivia 4 Answer
4. DisciplineA-B
9. Disproportionality - Identification
10. Disproportionality - Disability

Indicator 4B: Disproportionality in Suspension and Expulsion
FFY 2005 2006 2007 2008 2009 2010 2011 2012
Target 0.00% 0.00% 0.00% 0.00% 0.00% 0.00% 0.00%
Data 0.00% 0.00% 0.00% 0.00%
Number of districts that have a significant discrepancy, by race or
ethnicity
Number of those districts that have policies, procedures, or practices that
contribute to the significant discrepancy and do not comply with requirements
Number of districts in the
StateFFY 2012
DataFFY 2013
TargetFFY 2013
Data
11 0 258 0.00% 0.00% 0.00%
Historical Data
FFY 2013 SPP/APR Data
FFY 2013 2014 2015 2016 2017 2018
Target 0.00% 0.00% 0.00% 0.00% 0.00% 0.00%
SPP/APR Targets
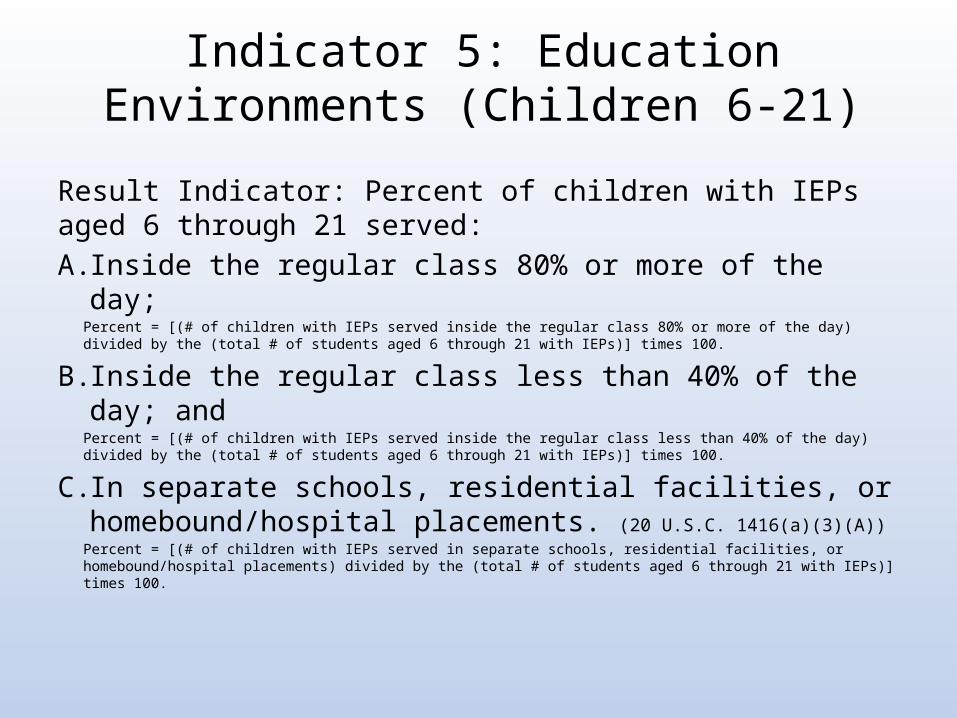
Indicator 5: Education Environments (Children 6-21)
Result Indicator: Percent of children with IEPs aged 6 through 21 served:A. Inside the regular class 80% or more of the day;
Percent = [(# of children with IEPs served inside the regular class 80% or more of the day) divided by the (total # of students aged 6 through 21 with IEPs)] times 100.
B. Inside the regular class less than 40% of the day; and Percent = [(# of children with IEPs served inside the regular class less than 40% of the day) divided by the (total # of students aged 6 through 21 with IEPs)] times 100.
C. In separate schools, residential facilities, or homebound/hospital placements. (20 U.S.C. 1416(a)(3)(A))
Percent = [(# of children with IEPs served in separate schools, residential facilities, or homebound/hospital placements) divided by the (total # of students aged 6 through 21 with IEPs)] times 100.

FFY 2005 2006 2007 2008 2009 2010 2011 2012
5A
Target ≥ 48.91% 51.49% 54.29% 56.93% 59.77% 59.77% 59.77%
Data 48.33% 51.05% 51.80% 52.15% 53.10% 53.87% 53.26% 52.88%
5B
Target ≤ 12.52% 12.52% 12.52% 12.51% 12.51% 12.51% 12.51%
Data 12.11% 12.02% 12.65% 13.60% 12.49% 12.42% 12.52% 13.18%
5C
Target ≤ 2.58% 2.57% 2.57% 2.56% 2.56% 2.56% 2.56%
Data 2.60% 2.69% 2.76% 2.82% 2.82% 2.80% 2.70% 2.57%
Historical Data
FFY 2013 2014 2015 2016 2017 2018Target A ≥ 53.97% 55.93% 57.89% 59.85% 61.81% 63.77%Target B ≤ 12.99% 13.62% 13.03% 12.64% 12.16% 12.00%Target C ≤ 2.55% 2.53% 2.49% 2.46% 2.43% 2.40%
SPP/APR Targets
Indicator 5: Education Environments (Children 6-21)
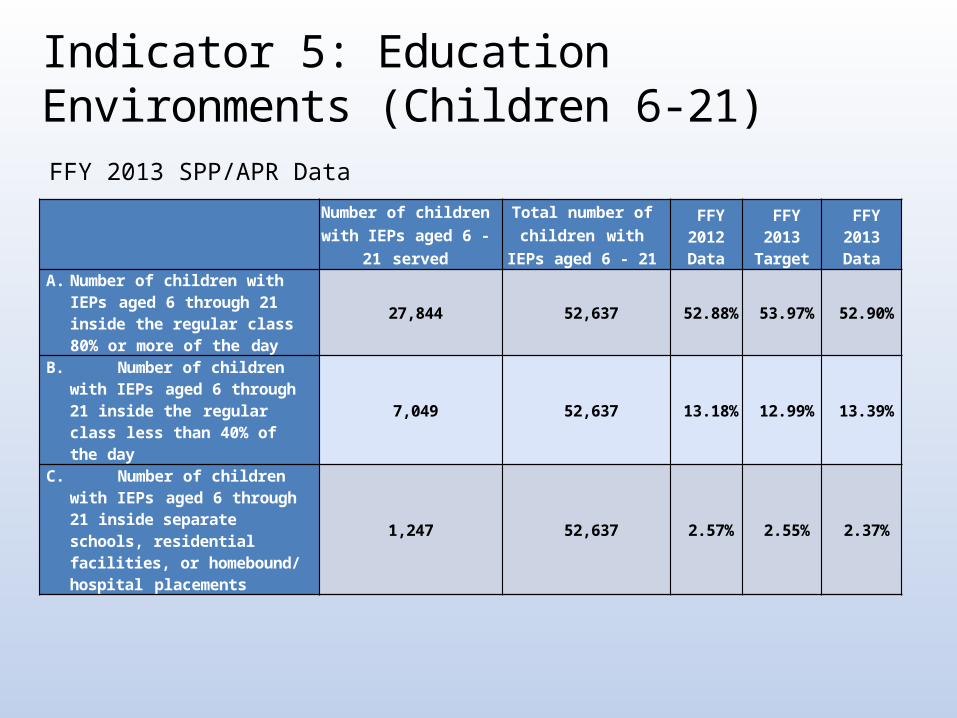
Number of children with IEPs aged 6 - 21 served
Total number of children with IEPs aged
6 - 21 FFY 2012
Data FFY 2013
Target FFY 2013
DataA. Number of children with IEPs aged 6
through 21 inside the regular class 80% or more of the day
27,844 52,637 52.88% 53.97% 52.90%
B. Number of children with IEPs aged 6 through 21 inside the regular class less than 40% of the day
7,049 52,637 13.18% 12.99% 13.39%
C. Number of children with IEPs aged 6 through 21 inside separate schools, residential facilities, or homebound/ hospital placements
1,247 52,637 2.57% 2.55% 2.37%
FFY 2013 SPP/APR Data
Indicator 5: Education Environments (Children 6-21)

Trivia 5True or FalseA review of policies, procedures, and practices is required if an LEA was identified as having too many students in other educational settings.
3 points

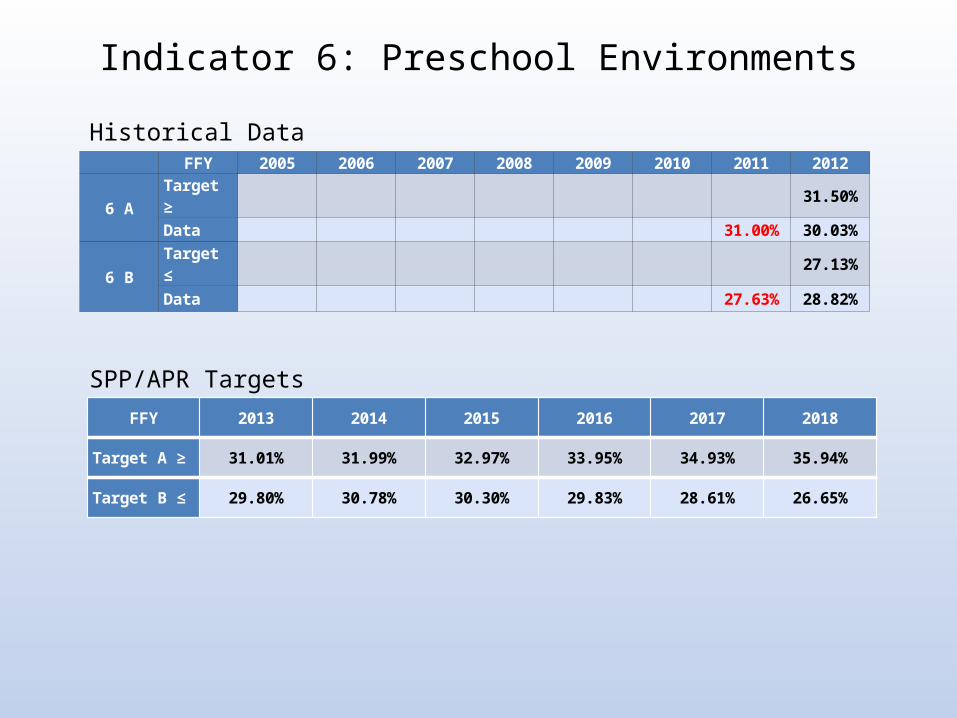
Indicator 6: Preschool Environments
Results indicator: Percent of children aged 3 through 5 with IEPs attending a: A. Regular early childhood program and receiving
the majority of special education and related services in the regular early childhood program; and
B. Separate special education class, separate school or residential facility. (20 U.S.C. 1416(a)(3)(A))

Indicator 6: Preschool EnvironmentsColumn 1 Column 2
Row set (A) CHILDREN ATTENDING A REGULAR EARLY CHILDHOOD PROGRAM AT LEAST 10 HRS PER WEEK, …
(A1) … and RECEIVING the majority of hours of SPECIAL EDUCATION and related SERVICES in the REGULAR EARLY CHILDHOOD PROGRAM
(A2) … and RECEIVING the majority of hours of SPECIAL EDUCATION and related SERVICES in some OTHER LOCATION
Row Set (B)
CHILDREN ATTENDING A REGULAR EARLY CHILDHOOD PROGRAM LESS THAN 10 HRS PER WEEK, …
(B1) …and RECEIVING the majority of hours of SPECIAL EDUCATION and related SERVICES in the REGULAR EARLY CHILDHOOD PROGRAM
(B2) …and RECEIVING the majority of hours of SPECIAL EDUCATION and related SERVICES in some OTHER LOCATION
Row Set (C)
CHILDREN ATTENDING A SPECIAL EDUCATION program (NOT in any regular early childhood program),...
(C1) …specifically, a SEPARATE SPECIAL EDUCATION CLASS
(C2) …specifically, a SEPARATE SCHOOL
(C3) …specifically, a RESIDENTIAL FACILITY
ROW Set (D)
CHILDREN ATTENDING NEITHER A REGULAR EARLY CHILDHOOD PROGRAM NOR A SPECIAL EDUCATION PROGRAM (NOT INCLUDED IN ROW SETS A, B OR C)
(D1) …and RECEIVING the majority of hours ofSPECIAL EDUCATION and related SERVICES atHOME
(D2) …and RECEIVING the majority of hours ofSPECIAL EDUCATION and related SERVICES atthe SERVICE PROVIDER LOCATION or someOTHER LOCATION not in any other category

Trivia 5
FALSE: In the APR, only Indicators 4A, 4B, 9 & 10 require a review of Policies, Procedures, and Practices
Indicator 6: Preschool Environments
FFY 2005 2006 2007 2008 2009 2010 2011 2012
6 ATarget ≥ 31.50%
Data 31.00% 30.03%
6 BTarget ≤ 27.13%
Data 27.63% 28.82%
FFY 2013 2014 2015 2016 2017 2018
Target A ≥ 31.01% 31.99% 32.97% 33.95% 34.93% 35.94%
Target B ≤ 29.80% 30.78% 30.30% 29.83% 28.61% 26.65%
Historical Data
SPP/APR Targets

Indicator 6: Preschool Environments
Number of children with IEPs aged 3 through 5 attending
Total number of children with IEPs aged 3 through 5
FFY 2012Data
FFY 2013Target
FFY 2013Data
A. A regular early childhood program and receiving the majority of special education and related services in the regular early childhood program
3,622 12,529 30.03% 31.01% 28.91%
B. Separate special education class, separate school or residential facility
3,579 12,529 28.82% 29.80% 28.57%
FFY 2013 SPP/APR Data

Trivia 6
What indicators use data collected in the referral tracking module?
4 points Number and Name; 2 points for Number or Name; 1 point for Number or Name for one

Indicator 7: Preschool Outcomes
Results indicator: Percent of preschool children aged 3 through 5 with IEPs who demonstrate improved:
A. Positive social-emotional skills (including social relationships);
B. Acquisition and use of knowledge and skills (including early language/ communication and early literacy); and
C. Use of appropriate behaviors to meet their needs.

Indicator 7: Preschool OutcomesIndicator Measurement for Each Outcome AreaA1. Of those preschool children who entered or exited the preschool program below age expectations in Outcome A, the
percent who substantially increased their rate of growth by the time they turned 6 years of age or exited the program. (c+d)/(a+b+c+d)
A2. The percent of preschool children who were functioning within age expectations in Outcome A by the time they turned 6 years of age or exited the program. (d+e)/(a+b+c+d+e)
B1. Of those preschool children who entered or exited the preschool program below age expectations in Outcome A, the percent who substantially increased their rate of growth by the time they turned 6 years of age or exited the program. (c+d)/(a+b+c+d)
B2. The percent of preschool children who were functioning within age expectations in Outcome A by the time they turned 6 years of age or exited the program. (d+e)/(a+b+c+d+e)
C1. Of those preschool children who entered or exited the preschool program below age expectations in Outcome A, the percent who substantially increased their rate of growth by the time they turned 6 years of age or exited the program. (c+d)/(a+b+c+d)
C2. The percent of preschool children who were functioning within age expectations in Outcome A by the time they turned 6 years of age or exited the program. (d+e)/(a+b+c+d+e)

Indicator 7: Preschool Outcomes FFY 2005 2006 2007 2008 2009 2010 2011 2012 A1
Target ≥ 90.00% 90.50% 90.50% 90.50%Data 89.56% 89.68% 89.61% 89.20% 90.17%
A2
Target ≥ 69.00% 69.50% 69.50% 69.50%Data 68.61% 66.74% 66.58% 68.25% 64.56%
B1
Target ≥ 90.00% 90.50% 90.50% 90.50%Data 89.64% 91.34% 90.31% 89.81% 90.80%
B2
Target ≥ 60.00% 60.50% 60.50% 60.50%Data 59.74% 57.67% 57.43% 57.68% 55.87%
C1
Target ≥ 92.00% 92.50% 92.50% 92.50%Data 91.68% 90.32% 90.82% 91.00% 91.40%
C2
Target ≥ 78.00% 78.50% 78.50% 78.50%Data 77.81% 76.23% 76.69% 78.03% 74.09%
Historical Data
FFY 2013 2014 2015 2016 2017 2018Target A1 ≥ 89.16% 89.64% 90.12% 90.60% 91.08% 91.56%Target A2 ≥ 66.32% 66.80% 67.28% 67.76% 68.24% 68.72%Target B1 ≥ 89.98% 90.46% 90.64% 91.42% 91.90% 92.38%Target B2 ≥ 57.17% 56.21% 57.19% 58.17% 59.64% 61.11%Target C1 ≥ 90.71% 89.73% 90.21% 91.17% 91.65% 92.13%Target C2 ≥ 75.95% 74.97% 73.99% 75.46% 76.93% 78.40%
FFY 2013 - FFY 2018 Targets

Trivia 6 Answer
11. Child Find – Timely Evaluation 12. C to B Transition
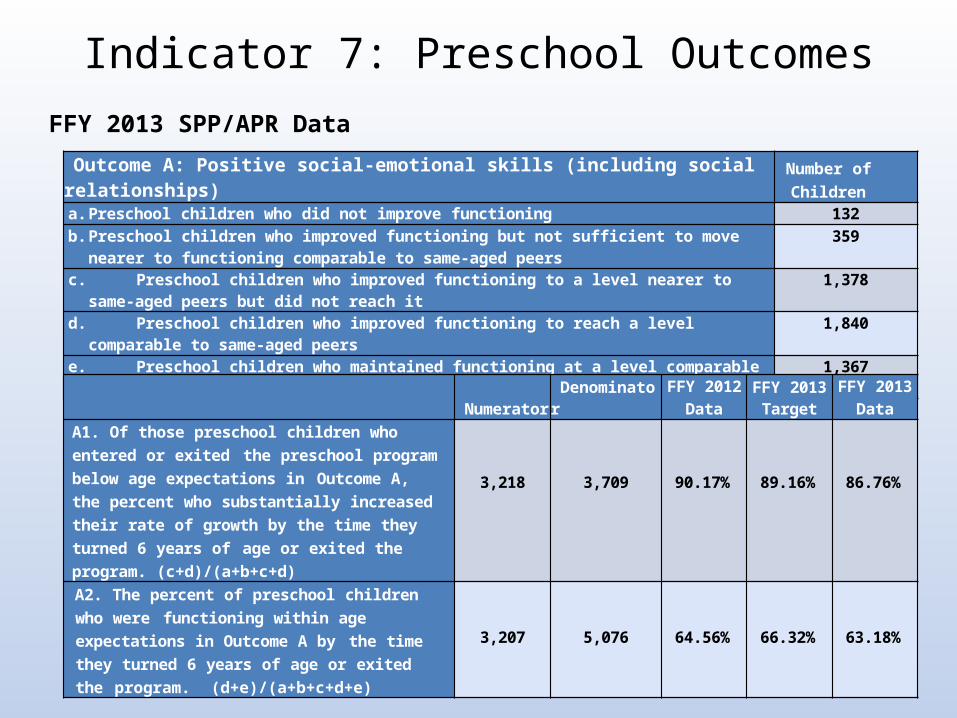
Indicator 7: Preschool Outcomes
Outcome A: Positive social-emotional skills (including social relationships)Number of Children
a. Preschool children who did not improve functioning 132b. Preschool children who improved functioning but not sufficient to move nearer to functioning comparable
to same-aged peers359
c. Preschool children who improved functioning to a level nearer to same-aged peers but did not reach it 1,378d. Preschool children who improved functioning to reach a level comparable to same-aged peers 1,840e. Preschool children who maintained functioning at a level comparable to same-aged peers 1,367
Numerator Denominator
FFY 2012Data
FFY 2013 Target
FFY 2013Data
A1. Of those preschool children who entered or exited the preschool program below age expectations in Outcome A, the percent who substantially increased their rate of growth by the time they turned 6 years of age or exited the program. (c+d)/(a+b+c+d)
3,218
3,709
90.17%
89.16%
86.76%
A2. The percent of preschool children who were functioning within age expectations in Outcome A by the time they turned 6 years of age or exited the program. (d+e)/(a+b+c+d+e)
3,207
5,076
64.56%
66.32%
63.18%
FFY 2013 SPP/APR Data

Indicator 7: Preschool Outcomes
Outcome B: Acquisition and use of knowledge and skills (including early language and communication)
Number of Children
a. Preschool children who did not improve functioning 110b. Preschool children who improved functioning but not sufficient to move nearer to functioning comparable to
same-aged peers419
c. Preschool children who improved functioning to a level nearer to same-aged peers but did not reach it 1,773d. Preschool children who improved functioning to reach a level comparable to same-aged peers 2,181e. Preschool children who maintained functioning at a level comparable to same-aged peers 593
Numerator Denominator
FFY 2012Data
FFY 2013 Target
FFY 2013Data
B1. Of those preschool children who entered or exited the preschool program below age expectations in Outcome A, the percent who substantially increased their rate of growth by the time they turned 6 years of age or exited the program. (c+d)/(a+b+c+d)
3,954
4,483
90.80%
89.98%
88.20%
B2. The percent of preschool children who were functioning within age expectations in Outcome A by the time they turned 6 years of age or exited the program. (d+e)/(a+b+c+d+e)
2,774
5,076
55.87%
57.17%
54.65%
FFY 2013 SPP/APR Data

Indicator 7: Preschool Outcomes
Outcome C: Use of appropriate behaviors to meet their needsNumber of
Childrena. Preschool children who did not improve functioning 90b. Preschool children who improved functioning but not sufficient to move nearer to functioning comparable
to same-aged peers282
c. Preschool children who improved functioning to a level nearer to same-aged peers but did not reach it 1,005d. Preschool children who improved functioning to reach a level comparable to same-aged peers 2,020e. Preschool children who maintained functioning at a level comparable to same-aged peers 1,679
Numerator Denominator FFY 2012Data*
FFY 2013 Target*
FFY 2013Data
C1. Of those preschool children who entered or exited the preschool program below age expectations in Outcome A, the percent who substantially increased their rate of growth by the time they turned 6 years of age or exited the program. (c+d)/(a+b+c+d)
3,025
3,397
91.40%
90.71%
89.05%
C2. The percent of preschool children who were functioning within age expectations in Outcome A by the time they turned 6 years of age or exited the program. (d+e)/(a+b+c+d+e)
3,699
5,076
74.09%
75.95%
72.87%
FFY 2013 SPP/APR Data

Indicator 8: Parent Involvement
Results Indicator: Percent of parents with a child receiving special education services who report that schools facilitated parent involvement as a means of improving services and results for children with disabilities.
• Do you use a separate data collection methodology for preschool children? Yes
• Will you be providing the data for preschool children separately?
Yes

Indicator 8: Parent Involvement
FFY
2005
2006
2007
2008
2009
2010
2011
2012
Preschool
Target ≥ 84.00% 85.00% 86.00% 87.00% 88.00% 88.00% 88.00%
Data 82.92% 88.50% 87.60% 90.90% 84.90% 90.50% 92.71% 92.57%
School Age
Target ≥ 93.00% 94.50% 94.50% 95.00% 96.00% 96.00% 96.00%
Data 95.35% 93.50% 94.40% 95.10% 93.60% 95.10% 95.18% 95.00%
Historical Data
FFY 2013 - FFY 2018 TargetsFFY 2013 2014 2015 2016 2017 2018
Preschool Target ≥ 89.94% 90.92% 91.90% 92.88% 93.86% 94.84%
School-age Target ≥ 94.05% 94.53% 95.01% 95.49% 95.97% 96.45%

Indicator 8: Parent Involvement
Number of respondent parents who report schools facilitated parent involvement as a means of improving
services and results for children with disabilities
Total number of respondent parents of
children with disabilities FY 2012
DataFY 2013Target
FFY 2013Data
Preschool 4,554 5,059 92.57% 89.94% 90.02%
School Age 17,195 18,376 95.00% 94.05% 93.57%
FFY 2013 SPP/APR Data
Also required to determine if the survey responses are representative of child count by race and disability by race
For information on completing and submitting family surveys check out the February IDEA Data & Research Newsletter at https://arksped.k12.ar.us/DataAndResearch/NewsletterArchives.html
Join the newsletter notification listserve@https://lists.ualr.edu/scripts/wa?SUBED1=idea&A=1

Trivia 7
What two indicators require an analysis of representativeness?
4 points for Number and Name of both; 2 points for Number or Name of both; 1 point for number or name of 1
Indicator 9: Disproportionate Representation
Compliance indicator: Percent of districts with disproportionate representation of racial and ethnic groups in special education and related services that is the result of inappropriate identification.
This indicator has two components: Identification and Clearance via a review of policies, procedures, and practices.

Indicator 9: Disproportionate RepresentationHow you get identified for Over-Representation
• A risk ratio methodology was used to determine if a district has disproportionate representation. District enrollment and special education child count data were examined and adjusted according to the following criteria.
• Students receiving services in a private residential treatment program are removed
from the special education child count numbers and the district October 1 enrollment numbers for the selected year. Students in private residential treatment facilities are excluded because the State rules governing private residential treatment facilities state that a student belongs to the district where the facility is located; therefore, enrollment of such students would artificially increase the district’s special education child count and district wide enrollment.
• After the October 1 enrollment and December 1 child count is adjusted for students in
private residential treatment facilities, weighted risk ratios are generated. Both risk ratios and weighted risk ratios are examined and the lowest value is selected as the districts risk for identifying students of a particular race for special education.

Trivia 7 Answer
8. Family Outcomes 14. Post-School Outcomes

Indicator 9: Disproportionate Representation
How you get identified? (cont)
• Risk ratios are considered invalid if (1) the district enrollment of a racial or ethnic group is less than 5% or (2) the number of students in a disability category is below 40.
• Once adjusted, Disproportionate Representation is defined as a district that has risk ratios greater than 4.00 for over-representation.
• In 2013-14, 16 districts with an “N” size less than 40 were excluded from being identified for this indicator. Additionally, numerous districts were excluded using the 5% criteria for specific racial or ethnic categories. Zero districts were excluded from all categories.

FFY 2005 2006 2007 2008 2009 2010 2011 2012
Target 0.00% 0.00% 0.00% 0.00% 0.00% 0.00% 0.00%
Data 0.00% 0.00% 0.00% 0.00% 0.00% 0.00% 0.00% 0.00%
Historical Data
FFY 2013 - FFY 2018 TargetsFFY 2013 2014 2015 2016 2017 2018
Target 0.00% 0.00% 0.00% 0.00% 0.00% 0.00%
Indicator 9: Disproportionate Representation
Number of districts with disproportionate representation of racial and ethnic groups in special
education and related services
Number of districts with disproportionate representation of racial and ethnic groups in special education and related services that is
the result of inappropriate identification
Number of districts that met the State’s
minimum n-size FFY 2012
Data FFY 2013
Target FFY 2013
Data0 0 242 0% 0% 0%
FFY 2013 SPP/APR Data

Indicator 10: Disproportionate Representation in Specific Disability Categories
Compliance indicator: Percent of districts with disproportionate representation of racial and ethnic groups in specific disability categories that is the result of inappropriate identification.
This indicator has two components: Identification and Clearance via a review of policies, procedures, and practices.
Indicator 10: Disproportionate Representation in Specific Disability Categories
How you get identified for Over-Representation
• There are six disability categories that must be examined under Indicator 10: Autism, Emotional Disturbance, Intellectual Disability, Other Health Impairments, Specific Learning Disabilities, and Speech Language Impairment. A risk ratio methodology was used to determine if a district had disproportionate representation within the six disabilities. However, the district enrollment and special education child count data were examined and adjusted according to the following criteria.
• Students receiving services in a private residential treatment program are removed from the
special education child count numbers and the district October 1 enrollment numbers for the selected year. Students in private residential treatment facilities are excluded because the State rules governing private residential treatment facilities state that a student belongs to the district where the facility is located; therefore, enrollment of such students would artificially increase the district’s special education child count and district wide enrollment.
• After the October 1 enrollment and December 1 child count are adjusted for students in
private residential treatment facilities, risk ratios are generated for each of the six disability categories.

FFY
2005
2006
2007
2008
2009
2010
2011
2012
Target 0.00% 0.00% 0.00% 0.00% 0.00% 0.00% 0.00%
Data 0.00% 0.00% 0.00% 0.00% 0.00% 0.00% 0.00% 0.00%
Historical Data
FFY 2013 - FFY 2018 TargetsFFY 2013 2014 2015 2016 2017 2018
Target 0.00% 0.00% 0.00% 0.00% 0.00% 0.00%
Indicator 10: Disproportionate Representation in Specific Disability Categories
Number of districts with disproportionate
representation of racial and ethnic groups in special
education and related services
Number of districts with disproportionate representation of racial
and ethnic groups in special education and related services that is the result of
inappropriate identification
Number of districts that met the State’s
minimum n-size FFY 2012
Data FFY 2013
Target FFY 2013
Data0 0 242 0% 0% 0%
FFY 2013 SPP/APR Data
Trivia 8What are the two types of indicators in the APR?
4 points for 2 of 21 point for 1 of 2

Indicator 11: Child Find
Compliance indicator: Percent of children who were evaluated within 60 days of receiving parental consent for initial evaluation or, if the State establishes a timeframe within which the evaluation must be conducted, within that timeframe.
Data Source: Referral Tracking

Indicator 11: Child Find
A. # of children for whom parental consent to evaluate was received.
B. # of children whose evaluations were completed within 60 days (or State-established timeline).
Account for children included in (a), but not included in (b). Indicate the range of days beyond the timeline when the evaluation was completed and any reasons for the delays.Percent = [(b) divided by (a)] times 100.

Trivia 8 Answer
Result indicators Compliance Indicators

FFY
2005
2006
2007
2008
2009
2010
2011
2012
Target 100% 100% 100% 100% 100% 100% 100%
Data 91.91% 98.93% 97.69% 98.50% 99.00% 99.41% 99.42% 99.60%
Historical Data
FFY 2013 - FFY 2018 Targets
FFY 2013 2014 2015 2016 2017 2018
Target 100.00% 100.00% 100.00% 100.00% 100.00% 100.00%
Indicator 11: Child Find
(a) Number of children for whom parental consent to evaluate was
received
(b) Number of children whose evaluations were completed within 60 days (or State- established
timeline)FFY 2012
DataFFY 2013
TargetFFY 2013
Data17,034 16,969 99.60% 100% 99.62%
FFY 2013 SPP/APR Data
Indicator 12: Early Childhood TransitionCompliance indicator: Percent of children referred by Part C prior to age 3, who are found eligible for Part B, and who have an IEP developed and implemented by their third birthdays.
Data Source: Referral Tracking

Trivia 9The measurement for Indicator 11 states, children are to be evaluated within 60 days of receiving parental consent for initial evaluation or, if the State establishes a timeframe within which the evaluation must be conducted within that timeframe.
Does Arkansas have a state established timeframe? Y/NIf yes, what is the timeframe?
3 points if correct

FFY
2005
2006
2007
2008
2009
2010
2011
2012
Target 100% 100% 100% 100% 100% 100% 100%
Data 75.91% 97.58% 97.38% 99.27% 99.14% 99.21% 99.53% 99.15%
Historical Data
FFY 2013 - FFY 2018 TargetsFFY 2013 2014 2015 2016 2017 2018
Target 100.00% 100.00% 100.00% 100.00% 100.00% 100.00%
Indicator 12: Early Childhood Transition

Indicator 12: Early Childhood TransitionFFY 2013 SPP/APR Data
a. Number of children who have been served in Part C and referred to Part B for Part B eligibility determination. 834
b. Number of those referred determined to be NOT eligible and whose eligibility was determined prior to third birthday. 106
c. Number of those found eligible who have an IEP developed and implemented by their third birthdays. 696
d. Number for whom parent refusals to provide consent caused delays in evaluation or initial services or to whom exceptions under 34 CFR §300.301(d) applied. 21
e. Number of children who were referred to Part C less than 90 days before their third birthdays. 10
Numerator (c) Denominator (a-
b-d-e)FFY 2012
DataFFY 2013
TargetFFY 2013
DataPercent of children referred by Part C prior to age 3 who are found eligible for Part B, and who have an IEP developed and implemented by their third birthdays. [c/(a-b-d-e)]x 100
696
697
99.15%
100%
99.86%
Number of children who have been served in Part C and referred to Part B for eligibility determination that are not included in b, c, d, e 1
Account for children included in (a), but not included in b, c, d, or e. Indicate the range of days beyond the third birthday when eligibility was determined and the IEP developed, and the reasons for the delays.
One (1) Part C to B referral did not have eligibility determined prior to the third birthday and the child was found to be not eligible for services. The number of days beyond the third birthday was 12. A root cause analysis found that the eligibility determination delay was due to LEA error.

Trivia 9 Answer
Yes, 60 days same as the federal timeline
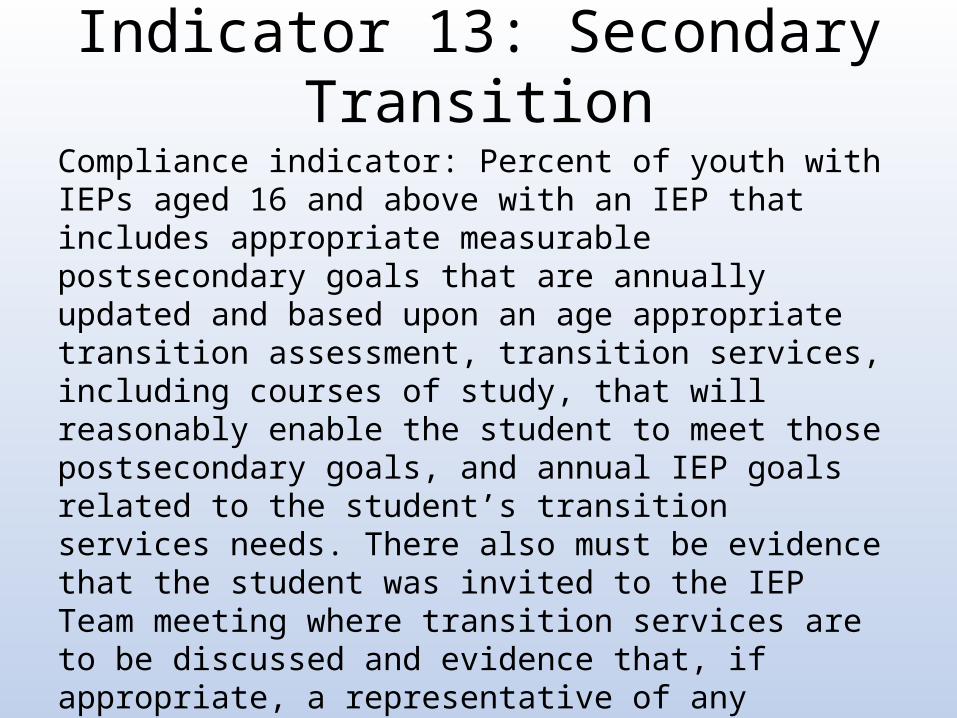
Indicator 13: Secondary TransitionCompliance indicator: Percent of youth with IEPs aged 16 and above with an IEP that includes appropriate measurable postsecondary goals that are annually updated and based upon an age appropriate transition assessment, transition services, including courses of study, that will reasonably enable the student to meet those postsecondary goals, and annual IEP goals related to the student’s transition services needs. There also must be evidence that the student was invited to the IEP Team meeting where transition services are to be discussed and evidence that, if appropriate, a representative of any participating agency was invited to the IEP Team meeting with the prior consent of the parent or student who has reached the age of majority.

Indicator 13: Secondary TransitionHistorical Data
FFY 2013 - FFY 2018 Targets
FFY 2005 2006 2007 2008 2009 2010 2011 2012
Target 100% 100% 100% 100% 100% 100% 100%Data 96.34% 96.19% 96.51% 89.07%
FFY 2013 2014 2015 2016 2017 2018
Target 100.00% 100.00% 100.00% 100.00% 100.00% 100.00%
FFY 2013 SPP/APR Data
Number of youth aged 16 and above with IEPs that contain each of the required components for secondary transition
Number of youth with IEPs aged 16 and above
FFY 2012Data
FFY 2013Target
FFY 2013 Data
209 212 89.07% 100% 98.58%
Indicator 14: Post-school Outcomes
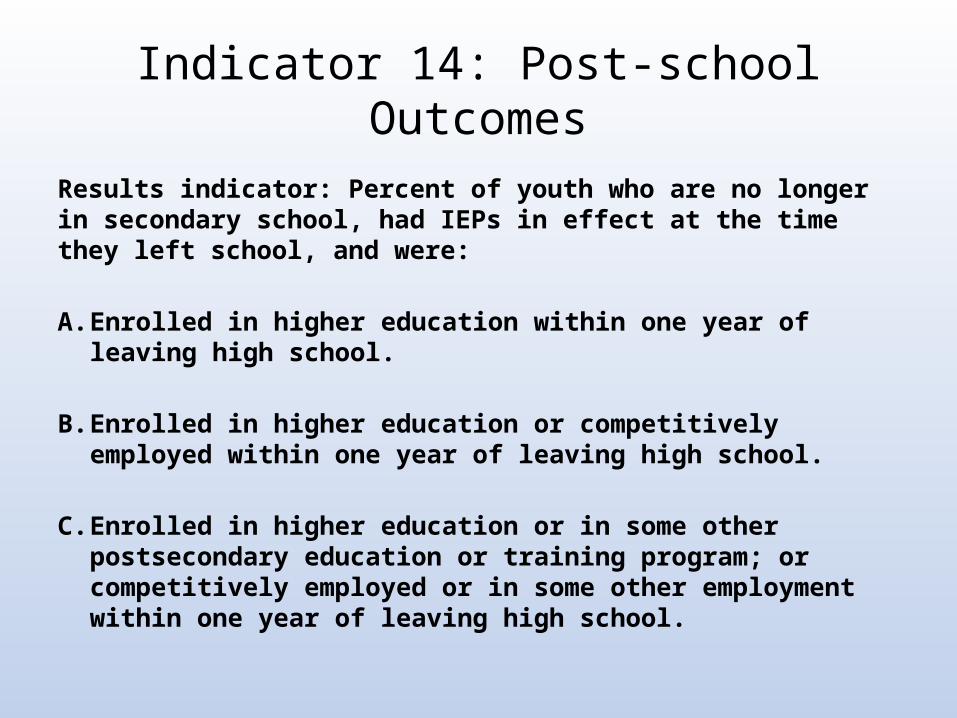
Results indicator: Percent of youth who are no longer in secondary school, had IEPs in effect at the time they left school, and were:
A. Enrolled in higher education within one year of leaving high school.
B. Enrolled in higher education or competitively employed within one year of leaving high school.
C. Enrolled in higher education or in some other postsecondary education or training program; or competitively employed or in some other employment within one year of leaving high school.

Indicator 14: Post-school OutcomesMeasurement:A. Percent enrolled in higher education = [(# of youth who are no longer in
secondary school, had IEPs in effect at the time they left school and were enrolled in higher education within one year of leaving high school) divided by the (# of respondent youth who are no longer in secondary school and had IEPs in effect at the time they left school)] times 100.
B. Percent enrolled in higher education or competitively employed within one year of leaving high school = [(# of youth who are no longer in secondary school, had IEPs in effect at the time they left school and were enrolled in higher education or competitively employed within one year of leaving high school) divided by the (# of respondent youth who are no longer in secondary school and had IEPs in effect at the time they left school)] times 100.
C. Percent enrolled in higher education, or in some other postsecondary education or training program; or competitively employed or in some other employment = [(# of youth who are no longer in secondary school, had IEPs in effect at the time they left school and were enrolled in higher education, or in some other postsecondary education or training program; or competitively employed or in some other employment) divided by the (# of respondent youth who are no longer in secondary school and had IEPs in effect at the time they left school)] times 100.
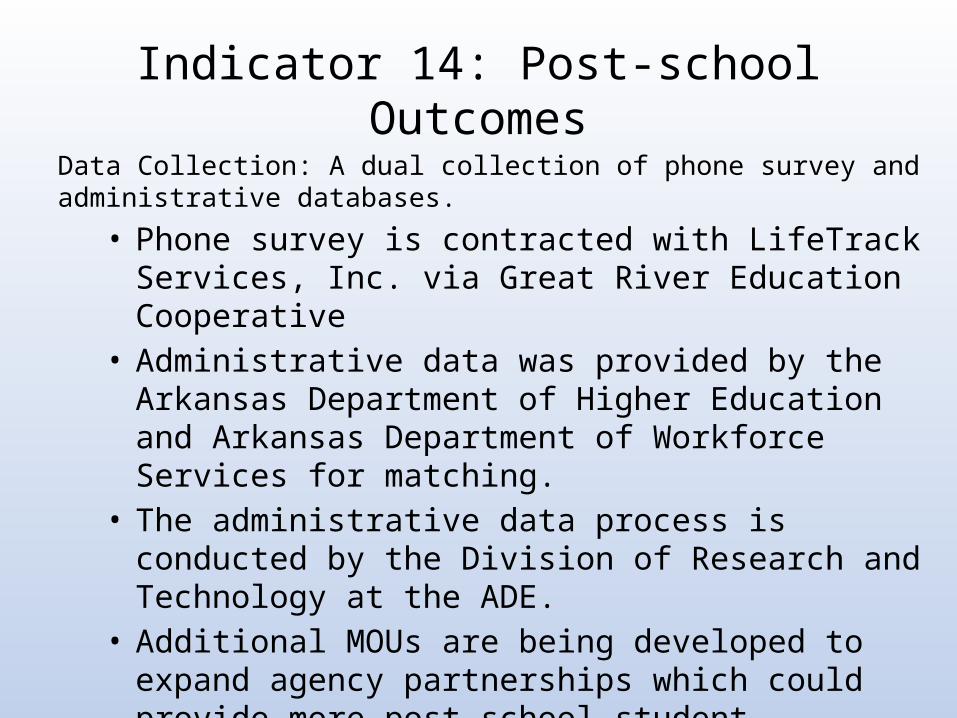
Indicator 14: Post-school OutcomesData Collection: A dual collection of phone survey and administrative databases.
• Phone survey is contracted with LifeTrack Services, Inc. via Great River Education Cooperative
• Administrative data was provided by the Arkansas Department of Higher Education and Arkansas Department of Workforce Services for matching.
• The administrative data process is conducted by the Division of Research and Technology at the ADE.
• Additional MOUs are being developed to expand agency partnerships which could provide more post-school student information, as well as increases in response rate and representativeness.

Trivia 10
What indicator does the school district have zero responsibility in the data collection process?
4 points

Indicator 14: Post-school Outcomes
FFY 2005 2006 2007 2008 2009 2010 2011 201214A Target ≥ 13.00% 13.00% 13.15%
Data 12.86% 14.54% 15.88% 18.42%14 B Target ≥ 49.00% 49.00% 49.15%
Data 48.55% 49.52% 42.95% 43.88%14 C Target ≥ 60.00% 60.00% 60.15%
Data 59.34% 61.05% 55.92% 58.13%
Historical Data
FFY 2013 - FFY 2018 TargetsFFY 2013 2014 2015 2016 2017 2018
Target A ≥ 13.35% 13.84% 14.33% 14.82% 15.31% 15.80%Target B ≥ 49.04% 49.53% 50.02% 50.51% 51.00% 51.49%Target C ≥ 59.36% 60.14% 60.92% 61.70% 62.48% 63.26%

Indicator 14: Post-school OutcomesFFY 2013 SPP/APR Data
Number of respondent youth who are no longer in secondary school and had IEPs in effect at the time they left school 732
1. Number of respondent youth who enrolled in higher education within one year of leaving high school 133
2. Number of respondent youth who competitively employed within one year of leaving high school 249
3. Number of respondent youth enrolled in some other postsecondary education or training program within one year of leaving high school (but not enrolled in higher education or competitively employed)
13
4. Number of respondent youth who are in some other employment within one year of leaving high school (but not enrolled in higher education, some other postsecondary education or training program, or competitively employed).
5
Number of respondent
youth
Number of respondent youth who are no longer in secondary school and had
IEPs in effect at the time they left schoolFFY 2012
DataFFY 2013
TargetFFY 2013
DataA. Enrolled in higher education (1) 133 732 18.42% 13.35% 18.17%
B. Enrolled in higher education or competitively employed within one year of leaving high school (1 +2)
382 732 43.88% 49.04% 52.19%
C. Enrolled in higher education, or in some other postsecondary education or training program; or competitively employed or in some other employment (1+2+3+4)
400 732 58.13% 59.36% 54.64%

Trivia 10 Answer
Indicator 14: Post-school Outcomes
Indicator 14: Post-school Outcomes
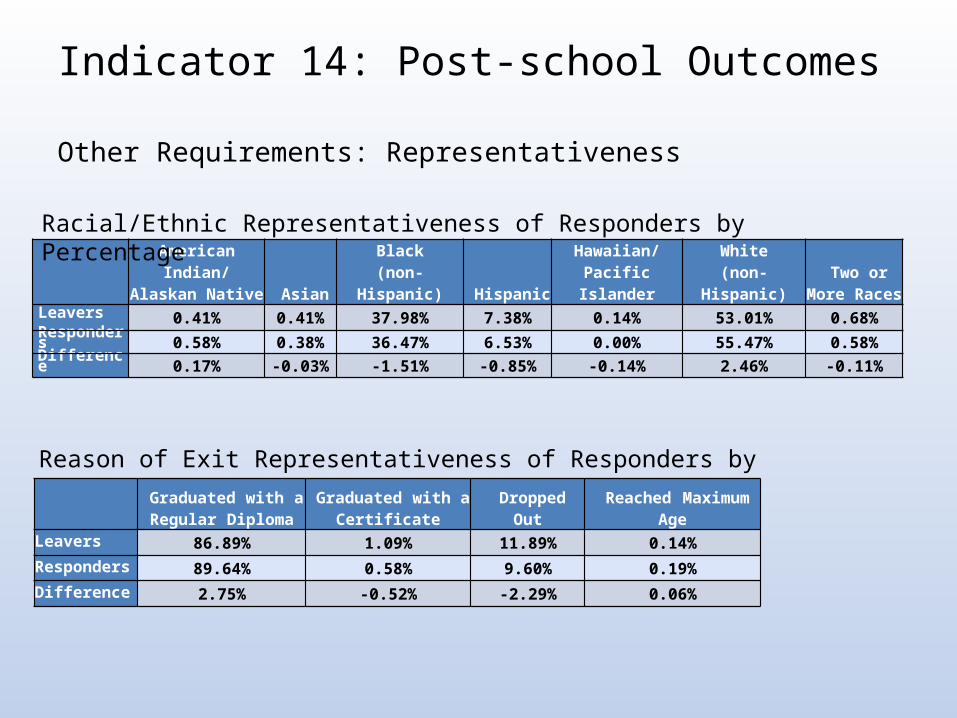
Other Requirements: Representativeness
American Indian/
Alaskan Native Asian Black
(non-Hispanic) Hispanic Hawaiian/
Pacific Islander White
(non-Hispanic) Two or More
RacesLeavers 0.41% 0.41% 37.98% 7.38% 0.14% 53.01% 0.68%Responders 0.58% 0.38% 36.47% 6.53% 0.00% 55.47% 0.58%Difference 0.17% -0.03% -1.51% -0.85% -0.14% 2.46% -0.11%
Racial/Ethnic Representativeness of Responders by Percentage
Reason of Exit Representativeness of Responders by Percentage
Graduated with a Regular Diploma
Graduated with a Certificate Dropped Out Reached Maximum Age
Leavers 86.89% 1.09% 11.89% 0.14%Responders 89.64% 0.58% 9.60% 0.19%Difference 2.75% -0.52% -2.29% 0.06%

Indicator 14: Post-school OutcomesOther Requirements: Representativeness
Disability Representativeness of Survey Responders by Percentages
AutismEmotional
Disturbance Deaf-Blindness Hearing ImpairedMultiple
DisabilitiesMental
RetardationLeavers 4.64% 2.60% 0.00% 0.96% 3.28% 13.39%
Responders 4.61% 1.73% 0.00% 0.77% 2.11% 8.83%
Difference -0.04% -0.87% 0.00% -0.19% -1.17% -4.56%
Other Health Impairment
Orthopedic Impairment
Speech/ Language Impairment
Specific Learning Disability
Traumatic Brain Injury
Visual Impairment
Leavers 20.77% 0.96% 1.64% 51.50% 0.27% 0.00%
Responders 22.07% 0.96% 1.92% 56.81% 0.19% 0.00%
Difference 1.31% 0.00% 0.28% 5.31% -0.08% 0.00%

Timely and Accurate Reporting
Includes:• Cycle 4 Data:
– Child Count– Educational Environment
• Cycle 7: – School Age Exits– EC Exits/Kindergarten
Conference – EC Outcomes– Referral Tracking– Discipline
• Does not include:• Cycle 4 Data:
– Special Education Employees
• Cycle 7: – Coordinated Early
Intervening Services (CEIS)
Compliance Indicator: District submitted required data elements on or before due dates; made revisions within the allotted review periods.

Who won!