Embed Size (px)
Citation preview
Article
Spatial expression pattern of the major Ca2+-buffer
proteins in the mouse retinal ganglion cells Tamás Kovács-Öller 1,2,3,4,+,*, Gergely Szarka 1,2,3,+, Ádám J Tengölics 1,2,3, Alma Ganczer 1,2,3,
Boglárka Balogh 1,2,3, Edina Szabó-Meleg1,4, Miklós Nyitrai1,4, Béla Völgyi 1,2,3,4
1 János Szentágothai Research Centre, University of Pécs, 7624, Pécs, Hungary; [email protected] (T.KÖ.);
[email protected] (G.Sz.); [email protected] (A.T.); [email protected] (A.G.);
[email protected] (B.B.); [email protected] (E. SM.), [email protected] (M.Ny.);
[email protected] (B.V.) 2 Retinal Electrical Synapses Research Group, National Brain Research Program (NAP 2.0), Hungarian
Academy of Sciences, 1051, Budapest, Hungary 3 Department of Experimental Zoology and Neurobiology, University of Pécs, 7624, Pécs, Hungary 4 Medical School, University of Pécs, 7624 Pécs, Hungary + Contributed equally
* Correspondence: [email protected]
Abstract: The most prevalent Ca2+-buffer proteins (CaBPs: parvalbumin—PV; calbindin—CaB;
calretinin—CaR) are widely expressed by various neurons throughout the brain, including the
retinal ganglion cells (RGCs). Even though their retinal expression has been extensively studied, a
coherent assessment of topographical variations is missing. To examine this, we performed
immunohistochemistry (IHC) in the mouse retina. We found variability in the expression levels
and cell numbers for CaR, with stronger and more numerous labels in the dorso-central area.
CaBP+ cells contributed to RGCs with all soma sizes, indicating heterogeneity. We separated 4-9
RGC clusters in each area based on expression levels and soma sizes. Besides the overall high
variety in cluster number and size, the peripheral half of the temporal retina showed the greatest
cluster number, indicating a better separation of RGC subtypes there. Multiple labels showed that
39% of the RGCs showed positivity for a single CaBP, 30% expressed two CaBPs, 25% showed no
CaBP expression and 6% expressed all three proteins. Finally, we observed an inverse relation
between CaB and CaR expression levels in CaB/CaR dually- and CaB/CaR/PV triple labeled RGCs,
suggesting a mutual complementary function.
Keywords: parvalbumin; calretinin; calbindin; expression; retina; topography; ganglion cell;
calcium buffer protein
1. Introduction
Vision is the most important perception modality for humans., however, it is still not entirely
known how the Ca2+ homeostasis of neurons in the visual signaling axis is controlled by the various
neuronal Ca2+-buffer proteins (CaBPs). One of the most extensively studied brain loci in this regard
is the mammalian retina where expression of CaBPs has been described in many different neuron
populations of various model animals [1] and also in a human specimen [2]. Retinal ganglion cells
(RGCs) serve as the only output of the retina, and besides simple integration of the converging
inputs, they preprocess information prior to relaying it to higher visual brain centers. Therefore,
RGCs play a key role in visual signal processing and thus the knowledge of the molecular makeup
underlying RGC function is essential both for further scientific endeavor and clinical diagnostics.
The RGC population in the mammalian retina is a collection of neurons encoding several different
visual features of the surrounding world. The diverse coding mechanism each RGC subtype
performs is heavily determined by a unique composition of intracellular molecules. Some of these
molecules, like CaBPs, can also be utilized as markers for one- or multiple distinct cell groups. The
more than 30 RGC subtypes of the mouse retina [3, 4] are currently in the crosshairs of modern
Preprints (www.preprints.org) | NOT PEER-REVIEWED | Posted: 11 February 2020 doi:10.20944/preprints202002.0145.v1
© 2020 by the author(s). Distributed under a Creative Commons CC BY license.
Peer-reviewed version available at Cells 2020, 9, 792; doi:10.3390/cells9040792

visual neuroscience and their CaBP expression patterns are in the focus of mainstream research.
Parvalbumin (PV) is one of the three most studied and best known Ca2+-binding buffer proteins and
it has been shown to be expressed by 8 different mouse RGC subtypes [5, 6]. 10 calretinin (CaR) and
10 calbindin (CaB) expressing RGCs have also been characterized [7, 8], among which five
populations co-express these two proteins. There is sparse evidence for a circadian and/or light
adaptation-dependent modulation of expression levels of the above three Ca2+-buffer proteins. Only
PV has been shown to have diurnal/light adaptation changes in the retina [9], although calbindin is
known to be expressed by interneurons in the SCN [10], which take part in circadian regulation.
Additionally, there is no evidence for CaB and CaR any adaptational changes in the retina. Due to
the fact that Ca2+-buffering is strongly related to the kinetics of the signal (action potential train)
RGCs send towards the brain, it is possible that individual RGCs of the same subtype might show a
range of CaBP expression levels that induces subtle changes in intracellular Ca2+ transients [11] and
correlate with the activity of the respective RGC or their topographical location. Here, we examine
how the expression levels of the three major CBPs differ and also how levels of each of these proteins
change across the retina and whether they display any topographically modulated pattern.
In this study, we present PV, CaR and CaB expression in the same subset of neurons for the first
time, which allows a direct comparison of the expression levels of the three CaBPs in mouse retinal
RGCs. We found heterogeneity in the expression levels and the number of expressing cells for CaR
with stronger and more numerous labels in the dorso-central area. The contribution of labeled cells
to the total cell count was homogenous for both CaB and CaR, whereas PV expressing cells comprise
about half of the RGCs in the center but only a quarter of peripheral RGCs. CaBP expressing cells
contributed to RGCs with all soma sizes, indicating the heterogeneous nature of CaB, CaR and PV
expression across various RGC subtypes. We separated 4-9 RGC clusters in each retinal area based
on CaBP expression levels and soma sizes. Besides the overall high variety in the number and size of
clusters, the peripheral half of the temporal retinal quadrant showed the highest number, possibly
indicating a better separation of functional RGC subtypes in this area. In addition, our multiple
labeling experiments showed that 39% of the RGCs showed positivity for a single CaBP, 30%
expressed two CaBPs, 25% showed no CaBP expression and 6% expressed all three proteins. Finally,
we observed an inverse relation of the CaB and CaR expression levels in CaB/CaR dually labeled and
CaB/CaR/PV triple labeled RGCs, suggesting a potential complementary function of these two
CaBPs.
2. Materials and Methods
2.1. Animals and preparation.
Animal handling, housing, and experimental procedures were reviewed and approved by the
ethical committee of the University of Pécs (BA02/2000-6/2006). All animals were treated in
accordance with the ARVO Statement for the Use of Animals in Ophthalmic and Vision Research.
All efforts were made to minimize pain and discomfort during the experiments. Eyes of mice (Mus
musculus, C57BL/6J, 1-12 months, n=10 animals, all male) were immediately removed after
termination. Eyeballs were cut at the ora serrata, lens and vitreous body were removed. Retinas were
fixed in 4% PFA in 1x PBS at room temperature for 15 min (for details, see: [12]).
2.2. Immunohistochemistry and microscopy
Following a thorough washing in PBS, the dorsal aspect and topographical areas (see Fig 1a)
(using the choroid marks [13]) were clearly marked. Next, the retinas were isolated (Fig 1a). Blocking
was performed with BTA (Bovine serum albumin 5%, Triton X-100 0.5%, Na-azid 0.05% in PBS) on the
bottom of a 24-well plate. Primary antibodies were used as indicated in Table 1. After washing (x3)
with PBS, secondary antibodies were added (Table 1). Retinas were mounted with VectaShield and
nr.1 cover slides and inspected using a Zeiss LSM 710 confocal laser scanning microscope
(PlanApochromat 20x and 63x objectives; NA: 1.4; Carl Zeiss Inc., Jena, Germany) with normalized
laser power and filter settings making 1.5 and 0.5 μm thin optical sections.
Preprints (www.preprints.org) | NOT PEER-REVIEWED | Posted: 11 February 2020 doi:10.20944/preprints202002.0145.v1
Peer-reviewed version available at Cells 2020, 9, 792; doi:10.3390/cells9040792
Table 1. Antibodies
Primary antibodies Secondary antibodies, dyes
Name Dilution Source Code Name Dilution Source Code
rb-Calretinin 1:2000 Invitrogen 180211 anti-rb-Alexa647 1:500 Invitrogen A21245
ms-Calbindin 1:1000 SySy 214 011 anti-ms-Alexa488 1:1000 Invitrogen A11017
ck-Parvalbumin 1:250 SySy 195 006 anti-ms-Cy3 1:500 Jackson 115-165003
rb-Parvalbumin 1:500 ThermoFisher PA1-933 anti-gp-DyLight405 1:500 Jackson 706-475-148
gp-NeuN/Fox 3 1:1000 SySy 266 004 anti-ck-Alexa568 1:500 AbCam ab175477
ms-SMI32 1:1500 Calbiochem NE1023 anti-rb-DyLight405 1:500 Jackson 711-475-152 DAPI 1:20 000 Sigma D9542
NeuroTrace 640/660 1:1000 ThermoFisher N21483
2.3. Measurement of protein expression
All measurements were performed using FIJI (NIH, USA, [14]). Firstly, a 100x100 µm square
was defined in all Z-stacks for each retinal region, then z-merge was performed. The regions of
interest (ROIs) for all retinal ganglion cells (RGCs) were selected based on the expression of NeuN, a
neuronal marker [15]. Mean gray value intensities and cell areas were measured. Intensity
grey-values were converted to relative percentage units by normalizing and rescaling values so that
expression levels covered the 0-100% range for all three proteins. These obtained relative percentage
values were then sorted into 10% bins for all cells (Figure 2). Due to the nature of the z-merge, the
measurable surface area is equal to the cell’s area at the widest cross-section, henceforth referred to
simply as area.
2.4. Statistical Analyses
One-way ANOVA analyses were performed using the Origin18 (Origin, Version 2018b,
OriginLab Corporation, Northampton, MA, USA.). Normal distribution was previously confirmed
through statistical analysis.
2.5 Clustering
All clustering was done using the Python SciKit-learn package [17] Gaussian Mixture Model
(GMM), which uses an iterative process of Expectation-Maximization (EM). This algorithm requires
the number of clusters (K) to be provided, in order to determine the correct number of clusters
represented in each dataset and the best covariance type (CT) of the model that fits the given dataset.
The models were run with all available parameters (K=1-20, CT= ‘diagonal’, ‘spherical’, ‘fitted’, ‘full’)
and their respective Bayesian Information Criterion (BIC) were calculated. Based on parsimony, the
model with the lowest BIC was selected for that specific dataset.
2.6 Background Filtering
Three mean grey-values (GV) were obtained for each ROI based on expression levels of the
three CaBPs. As ROIs were determined based on NeuN immuno-labels, even non-expressing cells
(negative for one or more CaBPs) were considered but their corresponding GVs were relatively low
(equal to background staining). Therefore, we assumed that GV values of non-expressing cells fall in
the lowest value GV cluster, and data corresponding to these clusters was handled as background in
subsequent analyses. We used Gaussian Mixture Model (GMM) clustering method (described in
more detail under the Clustering paragraph) to determine the background level, thus the
non-expressing cells could then be excluded from further analyses.
Preprints (www.preprints.org) | NOT PEER-REVIEWED | Posted: 11 February 2020 doi:10.20944/preprints202002.0145.v1
Peer-reviewed version available at Cells 2020, 9, 792; doi:10.3390/cells9040792

Figure 1. Measurement of CaBP expression levels in retinal samples. (a) Schematic drawing of
approximate locations of selected retinal areas (V-Ventral, N-nasal, D-Dorsal, T-Temporal; c-central,
p-peripheral). (b) Representative retinal areas with all utilized cellular markers. (c, d) Whereas DAPI
labels all cellular nuclei and therefore marks both neuronal and non-neuronal cells simultaneously,
NeuN stains neurons exclusively. In addition, NeuN provides brighter staining for RGCs, while at
the same time, displaced amacrine cells (ACs) appear dimmer. This provides a clear basis for
separating GCs from displaced ACs, allowing us to disregard ACs in our analysis. A central 100x100
μm homogeneous sub-area was selected from each 20x scanned and merged stack to measure the
expression levels of the three CaBPs. All NeuN+ cells were measured for CaR, PV, CB expression
levels (only triple- and quadruple labelings were included in the measurements). Cells were
numbered using FIJI’s ROI manager.
3. Results
In this study, the expression patterns of the three main CaBPs (PV, CaR, and CaB) were
examined across the mouse RGC population in order to detect any protein-specific topographical
Preprints (www.preprints.org) | NOT PEER-REVIEWED | Posted: 11 February 2020 doi:10.20944/preprints202002.0145.v1
Peer-reviewed version available at Cells 2020, 9, 792; doi:10.3390/cells9040792

distribution patterns. Both peripheral and central regions were used for measurements and further
analysis from all four retinal quadrants (dorsal, ventral, temporal and nasal) was performed for each
examined retina (Fig 1a). All retinal regions are represented with a high number of samples (n>5) in
order to average out errors due to both individual differences between mice and also the potential
methodological errors of immunolabeling. Please note that all steps of corresponding labels were
highly standardized to avoid methodological artifacts. There are numerous cell-types in the GCL of
the retina, as shown by the DAPI co-labels in Fig. 1c., thus we utilized the neuronal marker NeuN to
determine neuronal and non-neuronal cells in our preparation. We also used the NeuN labels to
define the region of interest (ROI) areas for further examination of CaBP expression levels. All NeuN
labeled RGC-somata, regardless of the CaBP content (or lack thereof) were considered in our
analyses. Co-labels of NeuN, RBPMS and GFP in the Thy1-GCaMP mouse retinas show that RGCs
were labeled with higher intensity (normalized gray-scale values>30%), while displaced ACs had a
weak NeuN immunoreactivity (Fig. 1d).
3.1. Expression of CaBPs in mouse RGCs
For the first time, to our best knowledge, we show PV, CaR and CaB expression in the same
subset of neurons of the mouse retina, allowing for a direct comparison of the expression levels of
the three CaBPs (see on Fig. 1b). In general, CaB labels of mouse RGCs were relatively weak
compared to those of the CaR and PV labels. This observation did not result from poor
antigen-antibody reaction or penetration problems, as horizontal cells in the deeper layers of the
same retinal samples displayed remarkably strong labels (Figure S1). As our intention was not to
compare expression levels of CaBPs to each-other, but rather to standardize labeling intensities
across samples, we normalized measured gray-scale values (GVs) and provided them in a range of
0-100%, where 100% was the maximum intensity level for each of the three markers. GVs were then
displayed on histograms with a bin size of 10% (Fig 2.).
In general, weak- and medium labeled cells were the most numerous for all three CaBPs (Figure
2a; note that the graphs contain data from all ROIs, even those above background levels). Certainly,
the most populous low-intensity bins contain a mixture of non-labeled and lightly labeled cells that
thus provide the highest peaks of the histograms in most retinal areas. On the other hand, the
brightest RGCs are likely composed of only a few (or only one) RGC subtypes as they form a
considerably smaller population for all three CaBPs and their groups are represented by small but
many times well-separable peaks in the histograms. In addition to these general features, a few
protein-specific patterns could also be discerned. One of them is the relatively high frequency of
medium-intensity PV stained cells, whereas such intensities were less numerous for both CaR and
CaB labels. As a result, the medium-intensity PV positive RGCs formed additional peaks in the
frequency diagrams in almost all retinal regions. The deviation from median expressions can be seen
color-coded on Figure 2b. The median value of CaR expression is higher to the dorsal side in the
central retina, while PV expression medians are higher in the ventral-central area. In the case of CaB
and PV expression medians, variance could be detected between different topological regions (Fig
2b).
We performed an area-specific comparison for each CaBP to see if their expression levels are
homogenous across the retina or display any regional specificity. We utilized the data from only the
medium- and strongly labeled cells for this analysis. We found that the expression levels of CaB and
PV are rather homogenous, whereas the expression of CaR varies somewhat (Figure 2c). More
specifically, there is an observable eccentric specific pattern difference in the CaR expression in the
dorsal, nasal and temporal regions (Fig. 2a,b).
Preprints (www.preprints.org) | NOT PEER-REVIEWED | Posted: 11 February 2020 doi:10.20944/preprints202002.0145.v1
Peer-reviewed version available at Cells 2020, 9, 792; doi:10.3390/cells9040792

Figure 2. Topographical differences of CaBP expression in the mouse retina. (a) Expression intensity
histograms. Individual bars show % of cells from the whole data-subset and from the marked central
or peripheral quadrant parts, those belong to the 10% bin-size of absolute expression intensity for
each. A higher number of cells express lower levels (0-30%) of CaR, CaB and PV than at middle-
(30-60%) and high (60-100%) levels in the dorsal (D), ventral (V), nasal (N), temporal (T) central (c)
and peripheral (p) areas of the mouse retina. (b) The deviation from median expressions can be seen
color-coded, representing cell numbers with higher expression level with red, lower numbers with
blue and white closest to the median. In all cases, except CaR and CaB ventral quadrant, show a
stronger expression in the central part of each quadrant. Variance in CaR expression is observable
between center and periphery. In the case of CaB and PV, some variance could be detected, that is
restricted only to the difference from median. (c) Matrices show significance levels of a pairwise
area-specific comparison in the expressional levels of CaBPs for medium (30-60 %) and high
expression level (60%+) cells. Red outlines mark p-values that represent significant differences (p <
0.05). pink color represents close-to-significant p-values, while white and blue background suggests
a no to small difference.
In order to demonstrate these expressional differences more precisely, we created three
categories based on the relative intensity levels for each CaBP, namely ‘high’, ‘medium’ and ‘low’
(high= 60-100 percentile, medium = 30-60 percentile, low = 30-0 percentile). A pairwise comparison
and a corresponding statistical analysis (n=8; one-way ANOVA) was then carried out to determine
Preprints (www.preprints.org) | NOT PEER-REVIEWED | Posted: 11 February 2020 doi:10.20944/preprints202002.0145.v1
Peer-reviewed version available at Cells 2020, 9, 792; doi:10.3390/cells9040792

any CaBP expressional difference between retinal regions (Figure 2c; numbers in the table represent
the significance level of the difference, > 0.5 shown in blue, < 0.05 shown in red).
We found that expression levels of PV and CaB were rather homogenous across retinal regions,
confirming our qualitative observations. However, we found a higher number of mid-intensity CaR
expressing cells in Dc areas when they were compared to those of Dp and Tp retinal areas. In these
two comparisons, the differences were statistically significant (Dc/Dp: p=0.03; Dc/Tp:p=0.02,
One-way ANOVA ). Moreover, indicative difference was also found between the Vc/Vp region in
the high-intensity (GV>60%) subset (Fig. 2a, c) of CaR expressing cells. The Dc area contains a higher
number of medium labeled CaR+ cells as well, compared to other regions (Dp-28%; Vc-20%, Vp-17%,
Np-21%, Tp-25%). In addition to Dc, the Nc area also maintains a somewhat higher number of
medium labeled CaR expressing RGCs than the Dp (20%) and Tp (17%) areas. The Vp and Nc areas
also displayed a somewhat higher number of highly stained CaR+ RGCs when it was compared to
numbers in Dc (5%), Vc (8%) and Tc (7%) locations (Fig. 2a, c). However, the observed differences in
these latter three comparisons were only indicative according to our statistical analysis. Altogether,
it appears that the central retinal areas in the dorsal and nasal quadrants maintain a higher number
of CaR expressing cells mostly among the medium labeled RGCs. However, all things considered,
the measured protein expression levels indicate no topographical differences in the distribution of
CaB and PV in RGCs, suggesting that their importance and function is also uniform throughout the
retina.
3.2. The soma size distribution of CaBP expressing RGCs
Based on the above first set of experiments, we suspected that low-expressing cells in our
dataset blend in with the background staining of the tissue. Therefore, prior to further analysis, we
cleaned up our dataset by a background filtering process (see Methods; Figure S2). First, we
performed a cluster analysis based on CaBP labeling intensities of RGCs. We assumed that labeling
intensities of non-expressing cells (background staining) fall in the lowest GV cluster, therefore data
corresponding to these clusters were merged with the background and RGCs comprising these
clusters were handled as non-expressing cells in the subsequent analysis. Next, the relative
frequencies of CaBP expressing RGCs were determined for each examined area. Approximately,
25% of all RGCs expressed CaB, more than half of them were positive for CaR and 25-53% of cells
were labeled with the a-PV serum. The greatest centro-peripheral difference was observed for PV+
RGCs in the dorsal retinal quadrant where only the 25% and 53% of RGCs expressed PV in the
peripheral and central areas, respectively (Table 2).
Table 2. Relative frequency of a given protein-expressing cells (given as a % of all RGCs in the
corresponding retinal region).
Dorsal Nasal Ventral Temporal
Central Peripheral Central Peripheral Central Peripheral Central Peripheral
CaB 22 35 17 20 23 23 22 37
CaR 60 50 50 68 62 60 52 58
PV 53 25 46 34 36 45 36 34
In the second set of analyses, we measured the area of somata, which we expressed in µm2 for
all RGCs and then compared the distribution histograms of CaBP expressing and non-expressing
cells. This analysis showed that somatic area histograms of CaBP expressing RGC populations fell
into a range as wide as those generated for all RGCs. Only slight differences could be detected in
case of the CaB and PV expressing RGCs that tend to fall in the right halves of the histograms (larger
cells) in certain areas (Figure 3; CaB – Nc, Np; PV – Dp, Np, Tp, Tc, and Vc). However, these
observed differences proved statistically insignificant and it appears that all three CaBPs can be
Preprints (www.preprints.org) | NOT PEER-REVIEWED | Posted: 11 February 2020 doi:10.20944/preprints202002.0145.v1
Peer-reviewed version available at Cells 2020, 9, 792; doi:10.3390/cells9040792

expressed by RGCs with any soma size. This finding further indicates that the three populations of
CaBP expressing RGCs are heterogeneous and contain several functional RGC subtypes.
Figure 3. Soma size distribution histograms of CaBP expressing RGCs. The cell size distribution of all
RGCs (light blue) and CaBP expressing RGCs (CaB: orange, CaR: blue, PV: red). The bin widths are
set at 10 µm2. Note, that only data from quadruple-labeling experiments (CaR, CaB, PV, NeuN) were
used for this analysis, thus light blue histograms (all cells) are the same across all rows present.
3.3. Clustering RGCs based on CaBP expression and soma sizes
In a subsequent analysis we plotted expression levels of CaBP positive RGCs as a function of
somatic areas; central and peripheral areas were examined separately in order to find any potential
differences. In fact, as shown in the scatter plots below (Fig 4, 5, 6.), we found a differential
expression pattern when central and peripheral regions were compared. We defined subgroups of
Preprints (www.preprints.org) | NOT PEER-REVIEWED | Posted: 11 February 2020 doi:10.20944/preprints202002.0145.v1
Peer-reviewed version available at Cells 2020, 9, 792; doi:10.3390/cells9040792

RGCs in each CaBP stained population based on the same two parameters - the labeling intensity,
and the soma size - with cluster analysis (see Materials & Methods), and presented the clusters in
scatterplots of Figure 4, 5 and 6. (For direct central-peripheral comparison see Figure S3.)
Figure 4. Cluster analysis of CaB expressing RGCs. Two features (RGC soma size, and CaB
expression level) were utilized to perform the clustering in both central (left) and peripheral (right)
retinal areas in each quadrant. Dots indicate individual cells from n=8 retinas. The clusters of RGCs
are color-coded (note that colors do not necessarily represent the same cluster in separate panels).
The number of clusters are shown in the top right corner of each graph.
Preprints (www.preprints.org) | NOT PEER-REVIEWED | Posted: 11 February 2020 doi:10.20944/preprints202002.0145.v1
Peer-reviewed version available at Cells 2020, 9, 792; doi:10.3390/cells9040792

Figure 5. Cluster analysis of CaR expressing RGCs. RGC soma size and CaR expression level, were
utilized to perform the clustering in both central (left) and peripheral (right) retinal areas separately
for each quadrant. Dots indicate individual cells from n=5 retinas. The clusters of RGCs are
color-coded (note that colors do not necessarily represent the same cluster in separate panels). The
number of clusters is shown in the top right corner of each graph.
Preprints (www.preprints.org) | NOT PEER-REVIEWED | Posted: 11 February 2020 doi:10.20944/preprints202002.0145.v1
Peer-reviewed version available at Cells 2020, 9, 792; doi:10.3390/cells9040792

Figure 6. Cluster analysis of PV expressing RGCs. Two features, RGC soma size, and PV expression
level, were utilized to perform the clustering in both central (left) and peripheral (right) retinal areas
separately for each quadrant. Dots indicate individual cells from n=6 retinas. The clusters of RGCs
are color-coded (note that colors do not necessarily represent the same cluster in separate panels).
The number of clusters is shown in the top right corner of each graph.
This analysis resulted in 4-9 RGC subpopulations for all three CaBPs (CaB: 4-9; CaR: 4-8; PV:
4-8) that varied somewhat depending on the retinal location. These observed location-specific
inhomogeneities obtained for a particular protein strongly suggest that the clusters are not
equivalent to morphological/functional RGC subtypes. However, the analysis further supports our
Preprints (www.preprints.org) | NOT PEER-REVIEWED | Posted: 11 February 2020 doi:10.20944/preprints202002.0145.v1
Peer-reviewed version available at Cells 2020, 9, 792; doi:10.3390/cells9040792
previous results and also prior experimental work [7, 17] showing that the three examined CaBPs are
expressed by a heterogeneous group of mouse RGCs. While the number of clusters may not be
equivalent to CaBP expressing cell types, these numbers can still provide a range to compare to
morphological clusters. Moreover, in many cases, scatterplots display cell groups (clusters) that can
easily be pointed out simply by eyeballing the presented data. These latter, well-separable clusters
likely define one or two RGC subpopulations that can easily be differentiated from the rest of the cell
groups in the IHC stained specimens as well. In addition, it is also evident from this analysis that
peripheral scatterplots are not simply right-shifted versions of the central counterparts. The
existence of such a shift would be expected if there were a significant centro-peripheral
eccentricity-dependent dimensional change (e.g. soma size) of cells in the same functional RGC
population. Interestingly, Tp areas contained the greatest number of clusters for all three CaBPs,
suggesting either a better separation of RGC subtypes here or a higher internal variability of CaBP
expression in one particular RGC type. Besides the Tp, only the nasal retinal quadrant showed high
cluster numbers in the case of CaB and PV (Fig. 4-6). Besides these general occurrences, we made the
following observations: the CaB+ Vc area, for example, has a population of cells characterized by
small somata and high CaB expression levels. These cells seem to be only present in small numbers
on the periphery (only 10 cells). We also observed a higher number of RGCs with large somata in
Dp, Vc, Np areas whose CaB expression levels varied considerably. Interestingly there were some
CaR-labeled cells with large somata and high CaR expression in Dp and Np, whereas other areas
showed only low CaR-expression among the population of large-somata cells (fig. 5.). Histograms of
PV+ cells displayed a greater variability in size on peripheral regions than in central areas, but cells
with large PV+ somata could not be separated into any further groups based on labeling intensities
alone. In summary, sole expressional data derived from CaB-, CaR- and PV-labels are not sufficient
for defining functional RGC cell types in the mouse retina. To sum it up, it is difficult to draw any
conclusion from the observed centro-peripheral changes without morphological identification of the
involved RGC subtypes, our data shows topological divergence between expression-clusters of
RGCs.
3.4. Expression of multiple CaBPs
Our next goal was to examine if the expression of the three CaBPs overlap, forming RGC
populations where individual cells co-express two or more CaBPs simultaneously. To this end, we
performed quadruple labeling (NeuN, CaR, CaB and PV) experiments which allowed us to measure
expression levels of all three CaBPs in the same RGC population (Figure 7). Following the
application of the background correction algorithm (see 3.2 for details), expression levels of CaBPs
were determined for a set of labeled RGCs (n=889; taken from all regions of n=3 retinas). We found
that about a quarter (25.3%) of our RGCs showed no CaBP label at all, whereas about one-third of the
cells were labeled by only one of the sera. Among these latter single labeled cells, CaR+ RGCs were
the most numerous (26.1%), whereas sole CaB or PV was expressed by smaller groups only (4.9%
and 7.8%, respectively). Besides RGC populations expressing only one CaBP, we also found a
sizeable population of CaR+/PV+ cells (18.1%), as well as smaller groups of CaB+/PV+ (6.5%) and
CaR+/CaB+ (5.8%) dually labeled cells. Finally, a small group of RGCs (5.4%) showed triple-labeling
in our sample (Figure 7a). Cells were also sorted based on their CaBP expression levels in order to
examine any possible correlation between intracellular protein levels (Figure 7b, c). Based on this
comparison, we made the following observations: (i) a small population of the CaR+/PV+ RGCs
expressed both proteins in relatively high levels; (ii) there is a seemingly inverse relation of the CaR
and CaB levels in the dually labeled CaB+/CaR+ RGC population and (iii) the inverse relation of CaB
and CaR levels can be detected in cells of the triple labeled CaB+/CaR+/PV+ population as well
(Figure 7b, c). According to this latter observation, cells with relatively bright CaR labels showed
faint signal for CaB, whereas cells with relatively good CaB staining presented a weaker CaR signal.
At the same time, many RGCs displayed intermediate label intensities for both CaR and CaB.
Preprints (www.preprints.org) | NOT PEER-REVIEWED | Posted: 11 February 2020 doi:10.20944/preprints202002.0145.v1
Peer-reviewed version available at Cells 2020, 9, 792; doi:10.3390/cells9040792

Figure 7. Comparison of multiple CaBP expressions in triple-labeled cells. Panel (a) showing a pie
chart representing the ratios of the RGCs on the basis of CaBP expression (none, singularly, double
and triple expressing) for the RGCs in our sample. Panel (b) is a stacked bar-chart, where the y-axis is
the relative expression level of the three studied CaBP (CaB=red,CaR=blue,PV=orange). A closer
view of the double and triple expressing population can be seen in panel labeling individual cellular
expression of CBPs (c).
Preprints (www.preprints.org) | NOT PEER-REVIEWED | Posted: 11 February 2020 doi:10.20944/preprints202002.0145.v1
Peer-reviewed version available at Cells 2020, 9, 792; doi:10.3390/cells9040792
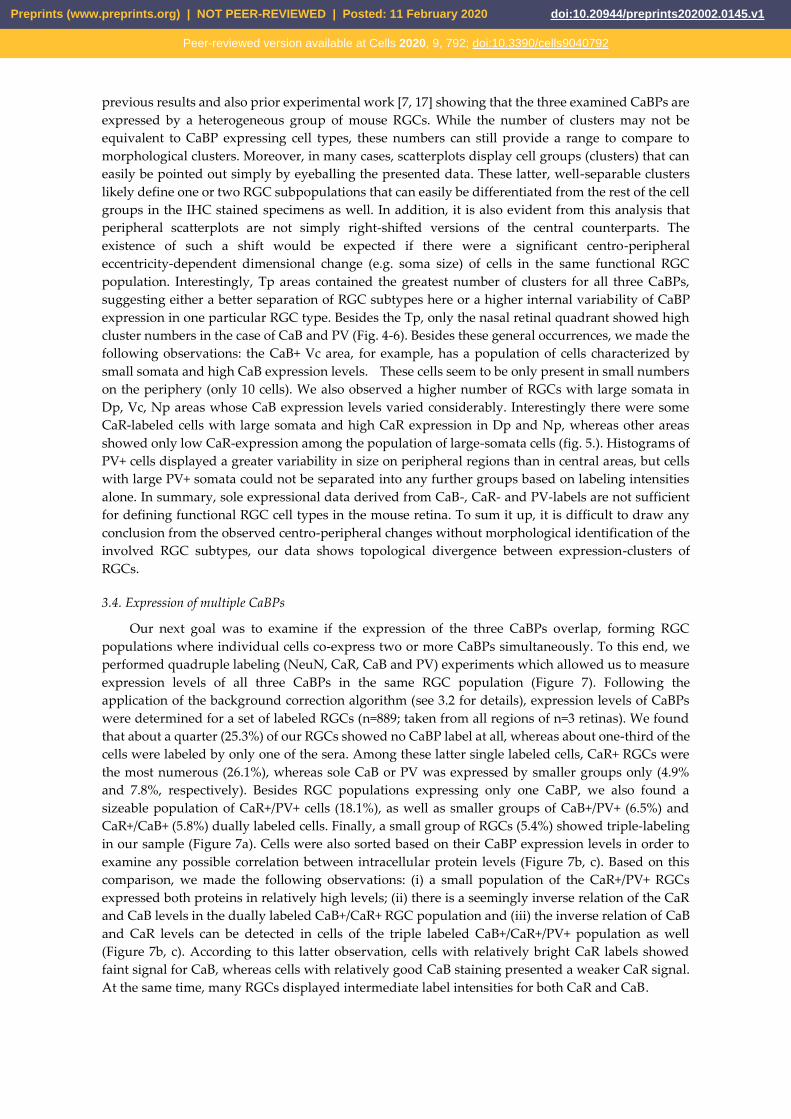
Figure 8. Correlating multiple labels with CBPs can help reveal individual differences between
antibodies and GC identity. Panel (a) shows the PV-tdTomato mouse retina with CaB, CaR and
NeuN labeling (composite image on the left and split into four channels on the right (all colors
correspond to the label above). Panel (b) displays the comparison between PV-tdTomato, rPV and
ckPV labeling performed on the same retina. (c) A histogram profile, acquired from the dashed area
shows a variance in normalized relative intensities of the PV-tdT (GMO, red) and rabbit- (green),
chicken-PV (blue) labels. (d) ON and OFF ɑGCs are brightly labeled with SMI32 (arrows) but not by
CaR. CaR, on the other hand, labels smaller GCs not labeled by SMI32. Neurons and vascular cells
are all labeled with the fluoro-Nissl stain Neurotrace-640/660 (NT).
Preprints (www.preprints.org) | NOT PEER-REVIEWED | Posted: 11 February 2020 doi:10.20944/preprints202002.0145.v1
Peer-reviewed version available at Cells 2020, 9, 792; doi:10.3390/cells9040792

3.5. Correlation of PV genetic markers to the PV antibody labeling
One may question how descriptions of CaBP labels in different studies utilizing different
antisera can be matched. In addition, GMO animals with markers under the control of CaBP
promoters may show discrepancies when compared to IHC samples. To examine this latter issue, we
utilized retinas of the parvalbumin-tdTomato (PV-tdT) mouse line (see Materials and Methods) and
performed a CaB/CaR/NeuN quadruple-labeling experiment where the PV-IHC label was
substituted with the PV-tdT staining. We found that the labeling patterns of all three markers in this
experiment (Figure 8a) were rather similar to those of quadruple-label IHCs (see also Figure 1a).
As pointed out above, different antisera may result in dissimilar labeling patterns. To examine
this issue we performed a dual IHC experiment in our PV-tdT mice by using two a-PV sera with
different hosts (rabbit – r, chicken - ck). Interestingly, label intensities of PV+ RGCs appeared
different when comparing the slides stained with the two PV specific antibodies. The most obvious
difference was the low-intensity labeling of the large cell bodied RGCs with the rabbit hosted serum,
whereas the same cells displayed strong labels with the chicken a-PV antibody (Fig. 8b). However,
we observed no single labeled PV+ RGCs in our sample, which in turn confirms the specificity of the
primary sera raised in two different host species.
4. Discussion
4.1. Comparison of the results to previous descriptions
RGCs in the mammalian retina have been described previously as heterogeneous populations
for all three examined CaBPs (reviewed in [1]). Therefore, none of them can be utilized effectively as
a subtype-specific RGC marker in retinal morphology studies. However, CaBP labels proved useful
for labeling retinal layers [18], or combined with other markers, served as a methodological
approach to selectively examine a subset of the RGC population. One such combined approach was
presented in a series of studies by the Jeon laboratory. They carried out intracellular dye/tracer
injections into RGCs that were immunohistochemically labeled to CaR [7, 19], CaB [8] or PV [17]. In
these studies, CaBP expressing RGC morphologies were described in detail, identified
morphologically and sorted into 6-8 RGC classes. Morphological descriptions of PV expressing
RGCs have also been performed by the dye injection of RGCs stained in GMO mice where GFP
fluorescence of cells was PV promoter-dependent [5]. Besides a few discrepancies (e.g. existence of
OFF alpha cells in the GMO but not in the IHC study among PV expressing cells), these two studies
were largely consistent in the number of defined PV expressing RGC subtypes as both differentiated
eight different groups in the examined RGC population. We tested our own PV-Cre line (see
Methods) and found that PV expressing RGCs in the GMO mice display a 100% match with our a-PV
IHC experiments, even though the labeling intensity could differ between certain cell populations
(Figure 8). This latter result further confirms the high degree overlap between genetic and IHC
markers in case of PV.
Similar to the above morphological descriptions, our cluster analysis also determined eight
RGC groups based on soma size and PV expression levels in the Dp and Tp retinal areas, whereas
other areas had 7 or 4 PV-IR RGC clusters. At this point, it is uncertain whether the observed PV+
clusters (at least in the Dp and Tp regions) are in a one-to-one relation with the above morphological
analyses. Soma sizes often show a strong correlation to the diameters of corresponding dendritic
fields, therefore it is likely that PV-IR RGC subtypes with smaller dendritic fields in the
morphological analyses correspond to cells of small somata of this study, and cells with larger cell
bodies maintain larger dendritic arbors as well. In fact, morphological analyses differentiated 2-3
large-field (PV1, PV5, PV6 [5]; PV7, PV8 [17]) and 5-6 small/medium-sized (PV2, PV3, PV4, PV7 [5];
PV3, PV4, PV5, PV6 [18]) PV expressing RGC populations. Moreover, these RGC populations
corresponded well to our cluster analyses in the Dp/Tp areas, where we found 1-2 clusters of RGCs
with large somata and more than 5 clusters with small-medium sized cell bodies. This putative
correlation is weaker in the rest of the retina (Dc, Nc, Tc, Vc, Np, and Vp areas) with < 8 identified
clusters.
Preprints (www.preprints.org) | NOT PEER-REVIEWED | Posted: 11 February 2020 doi:10.20944/preprints202002.0145.v1
Peer-reviewed version available at Cells 2020, 9, 792; doi:10.3390/cells9040792

Lee and colleagues have identified 10 morphologically distinct CaR expressing RGCs in the
mouse retina by using the above-mentioned combined IHC/dye injection method [7, 19]. The
identified cells were mostly RGCs with small- or medium field dendritic arbors. Our results were
consistent with this description as CaR-IR RGCs in our sample fell mostly in the clusters with small-
to medium soma sizes (< 200 μm2 area surface; assuming that soma and dendritic arbor diameters
are largely correlated; see Figures 4, 5 and 6). According to the morphological analysis by Lee and
colleagues, two additional RGC populations (CR10 ON and CR10 OFF) had large dendritic arbors
and they showed morphological characteristics similar to ON- and OFF alpha RGCs in the mouse
retina [3, 20]. This is consistent with studies in which a GMO mouse line was utilized, where the
presence of the CaR promoter in the animal induces GFP expression in OFF alpha RGCs [21]. Our
dataset also contained a small population of RGCs with relatively larger somata (> 120 μm2 area
surface) and low CaR expression levels. This population was present in all retinal areas and was less
populous than other clusters. The relatively low abundance of these cells points to the conclusion
that they are, in fact, alpha cells that are less numerous than most other RGC subtypes in the
mammalian retina [22]. The SMI32 antiserum has been shown to selectively label ON and OFF alpha
ganglion cells in the mouse retina [23-25]. In fact, our SMI32/CaR/NeuN triple labeling experiments
(Figure 8) showed a weak or no expression of CaR in a subset of SMI32 positive RGCs (Figure 8c),
whose visible soma-dendritic morphology resembled the ON alpha RGCs [3, 20, 26]. Therefore, we
conclude that one of our large cell bodied CaR expressing populations were likely the ON alpha
RGCs. In this scenario, the cluster of ON alpha RGCs were distinguishable in all retinal areas,
forming a weakly labeled CaR+ population with relatively large somata. This result could prove
useful in identifying the population of ON alpha RGCs in the mouse retina.
CaB has been shown to be expressed by 10 RGC populations according to the only relevant
morphological analysis covering this issue [8]. This, again, outnumbers the clusters detected in our
analysis (4-9 in various retinal regions). It is clear that our cluster analysis could not separate
efficiently the various CaB expressing RGC subtypes that were merely based on the CaB expression
levels and soma area measurements. Based on the results presented by Gu and colleagues, A2 RGCs
(equivalent to alpha RGCs) were the only large soma/large dendritic arbor cell type that displayed
CaB positivity. This suggests that the cells with the largest CaB+ somata in our analysis may, in fact,
correspond to these alpha RGCs. If so, then ON alpha cells are among the weakest CaR expressing
RGCs in the mouse retina but at the same time, they are relatively well-labeled with the CaB serum
(note that the a-CaB serum produced an overall weak label for all mouse RGCs). The weak CaR and
strong CaB staining of alpha cells suits the mutual substitution hypothesis of the two CaBPs we
pointed out in the results. According to this hypothesis, the weak CaR expression of RGCs is often
combined with strong CaB expression and vica versa (discussed in detail later). If this hypothesis
holds, alpha RGCs may comprise one of the example groups.
Based on previous IHC/cell injection studies [7, 8, 17], one may conclude that besides the few
RGC types that were not CaBP+ or shown expressing only one of the three CaBPs, most were dual or
triple stained [1]. However, the authors also stated that only a certain ratio of a single RGC subtype
expressed a given CaBP (e.g. 23.83% of ON-OFF directionally selective RGCs were CaB+, 31.58%
CaR+, and only 11.59% PV+). This suggests that rather than being multiple labeled, a certain RGC
subtype may contain subpopulations that express either one of the examined proteins. Our study
here showed data for the existence of RGC populations with dual and triple CaBP labels and thus
provides a direct answer to this question. Our findings do not rule out the possibility of the existence
of subpopulations in a certain RGC subtype but definitely shows that dual- and triple labeled RGCs
exist in the mouse retina in a relatively high number. This data therefore indicates a diversity of
CaBP functions and a shared labor and/or subcellular compartmentalization of these proteins that
potentially necessitates the expression of multiple CaBPs in a single cell.
One interesting finding was an inverse relationship of CaB and CaR levels in both the
CaB+/CaR+ and the CaB+/CaR+/PV+ RGC populations, suggesting a complementary intracellular
function of these two proteins in mouse retinal RGCs. In fact, the results of two separate studies from
the Jeon laboratory [7, 8] attested that the same ten mouse retinal RGC subtypes were found
expressing CaR and CaB as well. They also found that the highest number of CaR expressing RGCs
Preprints (www.preprints.org) | NOT PEER-REVIEWED | Posted: 11 February 2020 doi:10.20944/preprints202002.0145.v1
Peer-reviewed version available at Cells 2020, 9, 792; doi:10.3390/cells9040792

was in the central retinal regions whereas CaB expressing cells were more numerous in the
mid-peripheral retinal areas. Thus, each protein had its maximum in locations where the other
protein displayed a minimum. Although CaB/CaR dual staining was not performed in these studies
to test this possibility directly, these results strongly indicate that the same RGC population (cells of
the ten subtypes) express both CaB and CaR and the CaB/CaR expression ratio varies as we move
from the center of the retina towards the periphery, meaning that the CaB/CaR ratio increases with
eccentricity. On the other hand, the expression of PV does not seem to show a similar correlation to
either of the other two proteins. The observed inverse relationship of CaB and CaR expression levels
suggests that these two proteins play very similar intracellular roles so they might substitute for
each other (mutual substitution hypothesis). However, no examples of the same ten RGC subtypes
presenting standalone CaR+ labeling in the center and CaB+ afar have been presented as of now.
Nevertheless, our observation combined with previous studies strongly suggests the presence of a
mutual substitution mechanisms in RGCs. Moreover, the combined data further indicates that there
is a slight variation in the intracellular performance (or role) of the two CaBPs, by which one is
favored in more central regions (CaR) whereas the other protein is more prominently expressed in
the peripheral counterparts (CaB) of the same RGC subtypes. This second hypothesis needs to be
investigated in the future as well.
4.2. The topology of CaBP expressing RGCs in the mouse retina
One of the main goals of this study was to compare the expression levels of the three main
CaBPs in an extended retinal surface and detect any potential area-specific distributional variety in
terms of either the expression levels or the frequency of CaBP expressing RGCs. We observed that in
general, the CaB expression level was considerably lower across the whole RGC population than
levels of either CaR or PV. The lower intensity labeling of CaB was not the result of poor IHC
staining or penetration problems because the same serum provided a bright label in horizontal cells
of the same retinal samples (even though they are located in the middle of the tissue). Therefore, we
conclude that the weak CaB staining in RGCs is due to the low levels of intracellular CaB protein
molecules. In contrast, both the anti-CaR and anti-PV sera provided bright labels for at least one
RGC population. Overall, we found that the a-CaB labels resulted in the weakest RGC staining and
the least number of stained cells out of the three studied CaBPs. This was consistent with previous
descriptions [8].
Another goal of this study was to identify any retinal region-specific alteration in the expression
of a single CaBP. Interestingly, CaR and CaB have already been shown to be expressed in the same
10 morphologically identified RGCs in the mouse retina [7, 8]. This suggests a similar overall
distribution of CaR and CaB stained RGCs across the retina. Contrary to this, a centro-peripheral
density drop was shown for CaR+ RGCs [7], whereas a local density maximum in mid-peripheral
retinal areas was detected for CaB+ RGCs [8]. This discrepancy can only be explained if a given RGC
subtype can express either or both CaBPs in various retinal areas. Expression and lack of expression
for a certain RGC subtype have been shown for all three PVs in the previous morphological studies
[7, 8, 17]. This finding may explain the inconsistency of cluster formation of CaR, CaB and PV labeled
RGCs in the eight retinal areas of this study (Fig 4, 5, 6.).
Contrary to the findings that RGCs belonging even to the same subtype can display diverse
staining for a certain CaBP label, we found that the overall distribution of CaBPs was relatively
homologous in the quadrant/eccentricity specific comparison. This finding is in apparent conflict
with previous results showing the above mentioned centro-peripheral density decrease in the
numbers of CaR+ and PV+ RGCs [7] and a local mid-peripheral maximum of CaB+ RGCs [8]. In our
study, however, it was not the absolute cell counts but rather the relative density of RGCs with low-,
medium- and high label intensities that were compared. As a result, our region-specific intensity
measurements are not necessarily in conflict with previous descriptions. According to our findings,
only CaR expression levels displayed some area-specific heterogeneity, significantly favoring
medium labeled cells in Dc areas vs. Dp and Tp regions (Fig 2c). In addition, Nc areas also showed a
somewhat higher number of medium-labeled CaR+ somata when a comparison was performed with
Preprints (www.preprints.org) | NOT PEER-REVIEWED | Posted: 11 February 2020 doi:10.20944/preprints202002.0145.v1
Peer-reviewed version available at Cells 2020, 9, 792; doi:10.3390/cells9040792

Dp and Tp regions. Therefore, both Dc and Nc regions showed higher frequency of medium labeled
CaR+ RGCs when compared to most peripheral regions (Tp, Vp, and Np). We believe that this
finding is related to the centro-peripheral drop of the CaR+ cell count described by Lee and
colleagues [7]. Contrary to this, a higher number of brightly labeled CaR+ cells was observed in the
Vp when the comparison was performed with central regions (Dc, Vc, and Tc). This seemingly
contradicts the above-mentioned eccentricity-driven peripheral drop of CaR+ cells. However,
considering that brightly labeled CaR+ RGCs only provide a small fraction of the total number of
CaR+ RGCs, the centro-peripheral increase of their number (which is the exact opposite of those of
the medium labeled cells) likely does not affect the overall changes of CaR+ RGC numbers. In
contrast to the area-specific expression level differences of CaR+ RGCs, we observed no evident
expressional variations for PV or CaB levels. This fact might not entirely be surprising in the case of
CaB where the highest cell counts can be found in the mid-peripheral retinal regions [8] that
contributed to both central- and peripheral retinal regions in our comparison, thus impeding us to
find similar area-specific variation in CaB expression. The homogenous expression of PV in mouse
retinal RGCs is somewhat surprising in light of the described centro-peripheral drop of PV+ RGC
numbers [17], but again, the previous morphological analyses were performed based on cell counts
while this study, in turn, measured CaBP expression levels and therefore the two sets of values
cannot be directly compared. Altogether, based on the combination of the above results and also the
findings described in previous reports, we conclude that none of the examined CaBPs are expressed
in a subtype-specific manner. There are a number of RGC subtypes that can express one or more
CaBPs and individual RGCs of a certain subtype may appear very different in terms of expression
levels, however, our results show that clusters of CaBP expressing cells could be defined in future
multiple label studies.
Supplementary Materials: The following are available online at www.mdpi.com/xxx/s1;
www.mdpi.com/xxx/s2; www.mdpi.com/xxx/s3
Figure S1: Weak CaB expression in mouse RGCs are not the result of antibody specificity or penetration
problems. The image panels show CaB stained RGCs and horizontal cells (HC) in the same frame of the mouse
retina focusing on the ganglion cell layer (a) and the depth of the distal INL/OPL area (b). Even though
superficially locating RGCs show weak CaB staining, deep-layer HCs are heavily labeled with the same serum
contrary to the fact that these cells are in the middle of the tissue (prone to penetration problems). Arrows and
asterisks label the same cells on the side-view. Clearly, the weak CaB staining in RGCs is not a methodological
artifact.
Figure S2: Plots show two examples of scatterplots in which cells were ranked according to their CaBP
expression levels. Such plots were utilized to define ‘first-cluster background labels’ that allowed us to further
minimize our expressional analyses.
Figure S3: Scatterplots display expression level/soma size relations for RGCs in central and peripheral retinal
areas in each quadrant (central: blue, peripheral: red). The same scatterplots were also utilized to define RGC
clusters (see Figures 4, 5 and 6).
Author Contributions: conceptualization, T.KÖ. and B.V.; methodology, T.KÖ., G.Sz.; validation, T.KÖ., G.Sz,
B.V.; formal analysis, T.KÖ., G.Sz., A.J.T., B.V.; investigation, T.KÖ., G.Sz., B.B.; resources, B.V., M.Ny., E.SM.;
data curation, T.KÖ., G.Sz., A.J.T., B.B.; writing—original draft preparation, T.KÖ., G.Sz, A.G., B.V;
writing—review and editing, B.V., T.KÖ., G.Sz., A.G., A.J.T.; visualization, G.Sz., T.KÖ., B.V.; supervision, B.V.;
funding acquisition, B.V., T.KÖ, G.Sz.; see CRediT taxonomy
Funding: This study was supported by the Hungarian Brain Research Program 2 (2017-1.2.1.-NKP-2017) to
B.V., by NKFI (OTKA NN128293) to B.V., by the European Union and the State of Hungary, co-financed by the
European Social Fund in the framework of TAMOP-4.2.4.A/ 2-11/1-2012-0001 National Excellence Program
(B.V.) and by the ÚNKP-19-2-I-PTE-96 New National Excellence Program of the Ministry for Innovation and
Technology(G.SZ.).
Conflicts of Interest: The authors declare no conflict of interest.
Preprints (www.preprints.org) | NOT PEER-REVIEWED | Posted: 11 February 2020 doi:10.20944/preprints202002.0145.v1
Peer-reviewed version available at Cells 2020, 9, 792; doi:10.3390/cells9040792
References
1. Kovács-Öller, T.; Szarka, G.,; Ganczer, A.; Tengölics, Á.; Balogh, B.; Völgyi, B. Expression of Ca2+-Binding
Buffer Proteins in the Human and Mouse Retinal Neurons. International Journal of Molecular Sciences
2019, 20(9), 2229. doi:10.3390/ijms20092229
2. Kántor, O.; Mezey, Sz.; Adeghate, J.; Naumann, A.; Nitschke, R.; Énzsöly, A.; Szabó, A.; Lukáts, Á.;
Németh, J.; Somogyvári, Z.; Völgyi, B. Calcium buffer proteins are specific markers of human retinal
neurons. Cell and Tissue Research 2016, 365(1), 29–50. doi:10.1007/s00441-016-2376-z
3. Völgyi, B.; Chheda, S.; Bloomfield, S. A. Tracer coupling patterns of the ganglion cell subtypes in the
mouse retina. The Journal of Comparative Neurology 2009, 512(5), 664–687. doi:10.1002/cne.21912
4. Baden, T.; Berens, P.; Franke, K.; Román Rosón, M.; Bethge, M.; Euler, T. The functional diversity of retinal
ganglion cells in the mouse. Nature 2016, 529(7586), 345–350. doi:10.1038/nature16468
5. Münch, T. A.; da Silveira, R. A.,; Siegert, S.; Viney, T. J.; Awatramani, G. B.; Roska, B. Approach sensitivity
in the retina processed by a multifunctional neural circuit. Nature Neuroscience 2009, 12(10), 1308–1316.
doi:10.1038/nn.2389
6. Lee, E.-S.; Kim, T.-J.; Jeon, C.-J. Identification of parvalbumin-containing retinal ganglion cells in rabbit.
Exp. Eye Res. 2013, 110, 113–124. doi: 10.1016/j.exer.2013.02.018.
7. Lee, E.-S.; Lee, J.-Y.; Jeon, C.-J. Types and density of calretinin-containing retinal ganglion cells in mouse.
Neurosci. Res. 2010, 66, 141–150. doi: 10.1016/j.neures.2009.10.008.
8. Gu, Y.-N.; Lee, E.-S.; Jeon, C.-J. Types and density of calbindin D28k-immunoreactive ganglion cells in
mouse retina. Exp. Eye Res. 2016, 145, 327–336. doi: 10.1016/j.exer.2016.02.001.
9. Gábriel, R.; Lesauter, J.; Bánvölgyi, T.; Petrovics, G.; Silver, R.; Witkovsky, P. AII amacrine neurons of the
rat retina show diurnal and circadian rhythms of parvalbumin immunoreactivity. Cell Tissue Res. 2004,
315, 181–186. doi: 10.1007/s00441-003-0785-2.
10. Stadler, F.; Schmutz, I.; Schwaller, B.; Albrecht, U. Lack of calbindin-D28k alters response of the murine
circadian clock to light. Chronobiology International 2010, Jan;27(1), 68-82. DOI:
10.3109/07420521003648554.
11. Tengölics, Á.J.; Szarka, G.; Ganczer, A.; Szabó-Melegh, E.; Nyitrai, M.; Kovács-Öller, T.; Völgyi, B.
Response Latency Tuning by Retinal Circuits Modulates Signal Efficiency. Sci Rep 2019, 9, 15110.
https://doi.org/10.1038/s41598-019-51756-y
12. Ivanova, E.; Toychiev, A. H.; Yee, C. W.; Sagdullaev, B. T. Optimized Protocol for Retinal Wholemount
Preparation for Imaging and Immunohistochemistry. Journal of Visualized Experiments 2013, (82).
doi:10.3791/51018
13. Wei, W.; Elstrott, J.; Feller, M. B. Two-photon targeted recording of GFP-expressing neurons for light
responses and live-cell imaging in the mouse retina. Nature Protocols 2010, 5(7), 1347–1352.
doi:10.1038/nprot.2010.106
14. Schindelin, J.; Arganda-Carreras, I.; Frise, E.; Kaynig, V.; Longair, M.; Pietzsch, T.; Preibisch, S.; Rueden,
C.; Saalfeld, S.; Schmid, B.; Tinevez, J.-Y.; White, D. J.; Hartenstein, V.; Eliceiri, K.; Tomancak, P.; Cardona,
A. Fiji: an open-source platform for biological-image analysis. Nature Methods 2012, 9(7), 676–682.
doi:10.1038/nmeth.2019
15. Lin, Y-S., Kuo, K-T., Chen, S-K., Huang, H-S. RBFOX3/NeuN is dispensable for visual function. PLoS ONE
2018, 13(2): e0192355. https://doi.org/10.1371/journal.pone.0192355
16. Pedregosa, P.; Varoquaux, G.; Gramfort, A.; Michel, V.; Thirion, B.; Grisel, O.; Blondel, M.; Prettenhofer, P.;
Weiss, R.; Dubourg, V.; Vanderplas, J.; Passos, A.; Cournapeau, D.; Brucher, M.; Perrot, M.; Duchesnay, É.
Scikit-learn: machine learning in python. J. Mach. Learn. Res. 2011, 12, 2825–2830. arXiv:1201.0490v4
17. Kim, T.-J.; Jeon, C.-J. Morphological Classification of Parvalbumin-Containing Retinal Ganglion Cells in
Mouse: Single-Cell Injection after Immunocytochemistry. Investig. Opthalmol. Vis. Sci. 2006,
47:2757–2764. doi: 10.1167/iovs.05-1442.
18. Kovács-Öller, T.; Debertin, G.; Balogh, M.; Ganczer, A.; Orbán, J.; Nyitrai, M.; Balogh, L.; Kántor, O.;
Völgyi, B. Connexin36 Expression in the Mammalian Retina: A Multiple-Species Comparison. Front. Cell.
Neurosci. 2017, 11:220. doi: 10.3389/fncel.2017.00065.
19. Lee, E.-S.; Lee, J.-Y.; Kim, G.H.; Jeon, C.-J. Identification of calretinin-expressing retinal ganglion cells
projecting to the mouse superior colliculus. Cell Tissue Res. 2018, 376:153–163. doi:
10.1007/s00441-018-2964-1.
Preprints (www.preprints.org) | NOT PEER-REVIEWED | Posted: 11 February 2020 doi:10.20944/preprints202002.0145.v1
Peer-reviewed version available at Cells 2020, 9, 792; doi:10.3390/cells9040792

20. Völgyi, B.; Abrams, J.; Paul, D. L.; Bloomfield, S. A. Morphology and tracer coupling pattern of alpha
ganglion cells in the mouse retina. The Journal of Comparative Neurology 2005, 492(1), 66–77.
doi:10.1002/cne.20700
21. Huberman, A.D.; Manu, M.; Koch, S.M.; Susman, M.W.; Lutz, A.B.; Ullian, E.M.; Baccus, S.A.; Barres, B.A.
Architecture and Activity-Mediated Refinement of Axonal Projections from a Mosaic of Genetically
Identified Retinal Ganglion Cells. Neuron. 2008, 59:425–438. doi: 10.1016/j.neuron.2008.07.018.
22. Alpha ganglion cells in mammalian retinae: Common properties, species differences, and some comments
on other ganglion cells. Visual Neuroscience 1991, 7(1-2), 155–169. doi:10.1017/s0952523800011020
23. Berson, D.M. Retinal ganglion-cell types and their central projections In The Senses: A Comprehensive
Reference, Basbaum, A.I.; Kaneko, A.; Shepard, G.M.; Westheimer, G.; Eds.;Academic Press: San Diego
2008, pp. 491-520
24. Duan, X.; Qiao, M.; Bei, F.; Kim, I.-J.; He, Z.; Sanes, J. R. Subtype-Specific Regeneration of Retinal Ganglion
Cells following Axotomy: Effects of Osteopontin and mTOR Signaling. Neuron 2015, 85(6), 1244–1256.
doi:10.1016/j.neuron.2015.02.017
25. Roy, K.; Kumar, S.; Bloomfield, S. A. Gap junctional coupling between retinal amacrine and ganglion cells
underlies coherent activity integral to global object perception. Proceedings of the National Academy of
Sciences 2017, 114(48), E10484–E10493. doi:10.1073/pnas.1708261114
26. Schubert, T.; Degen, J.; Willecke, K.; Hormuzdi, S. G.; Monyer, H.; Weiler, R. Connexin36 mediates gap
junctional coupling of alpha-ganglion cells in mouse retina. The Journal of Comparative Neurology 2005,
485(3), 191–201. doi:10.1002/cne.20510
Preprints (www.preprints.org) | NOT PEER-REVIEWED | Posted: 11 February 2020 doi:10.20944/preprints202002.0145.v1
Peer-reviewed version available at Cells 2020, 9, 792; doi:10.3390/cells9040792

![Evidence of Ca2+-Dependent Carbohydrate Association ... · Ca2+I2+ and [2Lex + Ca2+]2+. The CID experiments of the [2Lex-LacCer + Ca2+I2+ dimers resulted in a neutral loss covalently](https://img.dokumen.tips/doc/110x75/5f8af1f17b5f935beb015692/evidence-of-ca2-dependent-carbohydrate-association-ca2i2-and-2lex-ca22.jpg)


![Embedded Software in Java mit KESO · "state migration "spatial isolation of applications (without hardware support) "... 4 void foo(char *str) {char buffer[100]; strcpy(buffer,str);}](https://img.dokumen.tips/doc/110x75/5b9f55c509d3f2fc778d5140/embedded-software-in-java-mit-state-migration-spatial-isolation-of-applications.jpg)