Embed Size (px)
Citation preview

Rural Water and Sanitation Support Programme - Phase VI
Sozi System Energy Efficiency Evaluation
THEMATIC REPORT
Output 2.6 Energy Efficiency
Dorsch International Consultants with
Community Development Initiatives
Prepared by:
Mario Roidt – Project Engineer
Frank Pool – International Energy Efficiency Expert
Date of issue: May 2021
Pristina, Kosovo

Rural Water and Sanitation Support Programme
Phase VI
Sozi Energy Efficiency Concept
Thematic Report – Output 2.6: Energy Efficiency
Dorsch International Consultants GmbH (Dorsch) - Community Development Initiatives (CDI)
i
TABLE OF CONTENTS
1 Executive Summary .............................................................................................. 1
2 Background and Context ..................................................................................... 5
2.1 Objectives ................................................................................................................. 5
2.2 EE Project Progress and Timeline for 1st stage ......................................................... 5
3 Existing Situation Before Rehabilitation ............................................................. 7
4 Concept ................................................................................................................. 9
5 Infrastructure Works........................................................................................... 11
5.1 Replacement of Pumps and Motors ........................................................................ 11
5.2 Pump Control and Automatization System .............................................................. 17
5.3 Other Works ............................................................................................................ 18
6 Pump and Motor Efficiency ................................................................................ 22
6.1 Efficiency of Old Pump-Motor Sets .......................................................................... 22
6.2 Efficiency of New Pump-Motor Sets ........................................................................ 22
6.3 Efficiency of Motors ................................................................................................. 23
6.4 Pump Curves of New Pumps .................................................................................. 23
7 Analysis of Energy and Cost Savings............................................................... 26
7.1 Energy Efficiency Key Performance Indicators ........................................................ 26
7.2 Baseline .................................................................................................................. 31
7.3 Evaluation ............................................................................................................... 32
8 Non-Revenue Water ............................................................................................ 43
8.1 DMA 62 Gorica ....................................................................................................... 43
8.2 DMA 63 Planea ....................................................................................................... 46
8.3 DMA 64 Gjonaj........................................................................................................ 49
8.4 DMA 65 Mazrek ...................................................................................................... 52
9 The Energy Monitoring Factsheet ..................................................................... 55
10 Recommendations and Lessons Learned ........................................................ 59
10.1 Recommendations for 2nd Stage Sozi System Renovations .................................... 59
10.2 Recommendations for Energy Efficiency for RWC Hidroregjoni Jugor .................... 60
10.3 Lessons learned ...................................................................................................... 60

Rural Water and Sanitation Support Programme
Phase VI Sozi Energy Efficiency Concept
Thematic Report – Output 2.6: Energy Efficiency
Dorsch International Consultants GmbH (Dorsch) - Community Development Initiatives (CDI)
ii
LIST OF FIGURES
Figure 1: Sozi Water Supply System Overview. ....................................................................... 8
Figure 2: Removal of Old Pumps at Nashec PS. ................................................................... 12
Figure 3: Installation of New Pumps at Nashec PS. ............................................................... 13
Figure 4: New Pumps and Motors at Nashec PS. .................................................................. 14
Figure 5: New Pumps and Motors at Kojush 1 PS. ................................................................ 15
Figure 6: New Pumps and Motors at Kojush 2 PS. ................................................................ 16
Figure 7: Control Cabinet and Soft Starter. ............................................................................ 17
Figure 8: Reactive Energy Controler. ..................................................................................... 18
Figure 9: House Connection with New Water Meter and Meter Box. ...................................... 19
Figure 10: Data Logger for Remote Monitoring of Bulk Water Meters. ................................... 19
Figure 11: Undetected Leaks Repaired During Rehabilitation Process. ................................. 20
Figure 12: Rehabilitated Nashec PS. ..................................................................................... 21
Figure 13: Nashec to Kobaj. .................................................................................................. 24
Figure 14 Nashec to Kojush 1. ............................................................................................... 24
Figure 15: Kojush 1 to Kojush 2. ............................................................................................ 25
Figure 16: Kojush 2 to Planea. ............................................................................................... 25
Figure 17: Key Performance Indicator Data Shown in Electricity Bills. ................................... 26
Figure 18: Calculating the Correct Pressure of a Pumping Station. ........................................ 29
Figure 19: Power Triangle of an AC Circuit. ........................................................................... 30
Figure 20: KPI 1 – Electricity Bill. ........................................................................................... 35
Figure 21: KPI 2 – Direct Cost. .............................................................................................. 36
Figure 22: KPI 3 – Electricity Consumption. ........................................................................... 37
Figure 23: KPI 4 – Percentage of Day-time Pumping. ............................................................ 38
Figure 24: KPI 5 – Specific Energy Consumption................................................................... 39
Figure 25: KPI 6 – Maximum Demand. .................................................................................. 41
Figure 26: KPI 7 – Reactive Energy. ...................................................................................... 42
Figure 27: Average Daily Demand Curve for Gorica DMA. .................................................... 43
Figure 28: NRW Factsheet for Gorica DMA. .......................................................................... 44
Figure 29. Average Daily Demand Curve for Planea DMA. .................................................... 46
Figure 30: NRW Factsheet for Planea DMA. .......................................................................... 47
Figure 31: Average Daily Demand Curve for the Gjonaj DMA. ............................................... 49
Figure 32: NRW Factsheet for Gjonaj DMA. .......................................................................... 50

Rural Water and Sanitation Support Programme
Phase VI Sozi Energy Efficiency Concept
Thematic Report – Output 2.6: Energy Efficiency
Dorsch International Consultants GmbH (Dorsch) - Community Development Initiatives (CDI)
iii
Figure 33: Average Daily Demand Curve for Mazrek DMA. ................................................... 52
Figure 34: NRW Factsheet for Mazrek DMA .......................................................................... 53
Figure 35: Screenshot of Data Entry Sheet. ........................................................................... 55
Figure 36: First Page of Energy Monitoring Factsheet. .......................................................... 57
Figure 37: Second Page of Energy Monitoring Factsheet. ..................................................... 58
Figure 38: Typical Annual Costs of a Pumping System. ......................................................... 62
Figure 39: Pump and Motor Name Plate for Nashec PS to Kojush 1 ..................................... 63
Figure 40: Pump and Motor Name Plates for Nashec PS to Kobaj ........................................ 64
Figure 41: Pump and Motor Name Plates for Kojush 1 PS to Kojush 2 .................................. 65
Figure 42: Pump and Motor Names Plate for Kojush 2 PS to Planea ..................................... 66
LIST OF TABLES
Table 1: Key Performance Indicators of the Baseline Period. ................................................ 32
Table 2: Key Performance Indicators of Post EE Implementation Evaluation Period. ............. 33
Table 3 Savings of Sozi Energy Efficiency Project for all KPIs. .............................................. 34
Table 4: Payback Periods of Investments. ............................................................................. 36
Table 5: Specific Energy Consumption and Cost per Pumping Station. ................................. 39
Table 6: Specific Energy Consumption and Transport Cost per Village. ................................ 40
Table 7: Payback Period of Installing Capacitors. .................................................................. 42
LIST OF ANNEXES
Annex 1: Name Plates of New Pumps and Motors................................................................. 63

Rural Water and Sanitation Support Programme
Phase VI Sozi Energy Efficiency Concept
Thematic Report – Output 2.6: Energy Efficiency
Dorsch International Consultants GmbH (Dorsch) - Community Development Initiatives (CDI)
iv
LIST OF ABBREVIATIONS
AC Alternating Current
BoQ Bill of Quantities
CCS Comprehensive Customer Survey
CDI Community Development Initiatives
DI Dorsch International Consultants GmbH
DMA District Metered Area
EE Energy Efficiency
HDPE High-Density Polyethylene
IE International Efficiency (for electric motors)
JV Joint Venture (between DI and CDI)
KEDS Kosovo Energy Distribution Services
KPI Key Performance Indicator
kVArh kilo-volt-ampere-hours-reactive
kW Kilowatt
kWh Kilowatt hours
m meters
m³/d Cubic meters per day
masl Meters above sea level
NRW Non-Revenue Water
O&M Operation and Maintenance
PS Pumping Station
RE Renewable Energy
RWC Regional Water Company
RWSSP-VI Rural Water and Sanitation Support Programme Kosovo phase VI
VAT Value Added Tax
Wh Watt hours
Rural Water and Sanitation Support Programme
Phase VI Sozi Energy Efficiency Concept
Thematic Report – Output 2.6: Energy Efficiency
Dorsch International Consultants GmbH (Dorsch) - Community Development Initiatives (CDI)
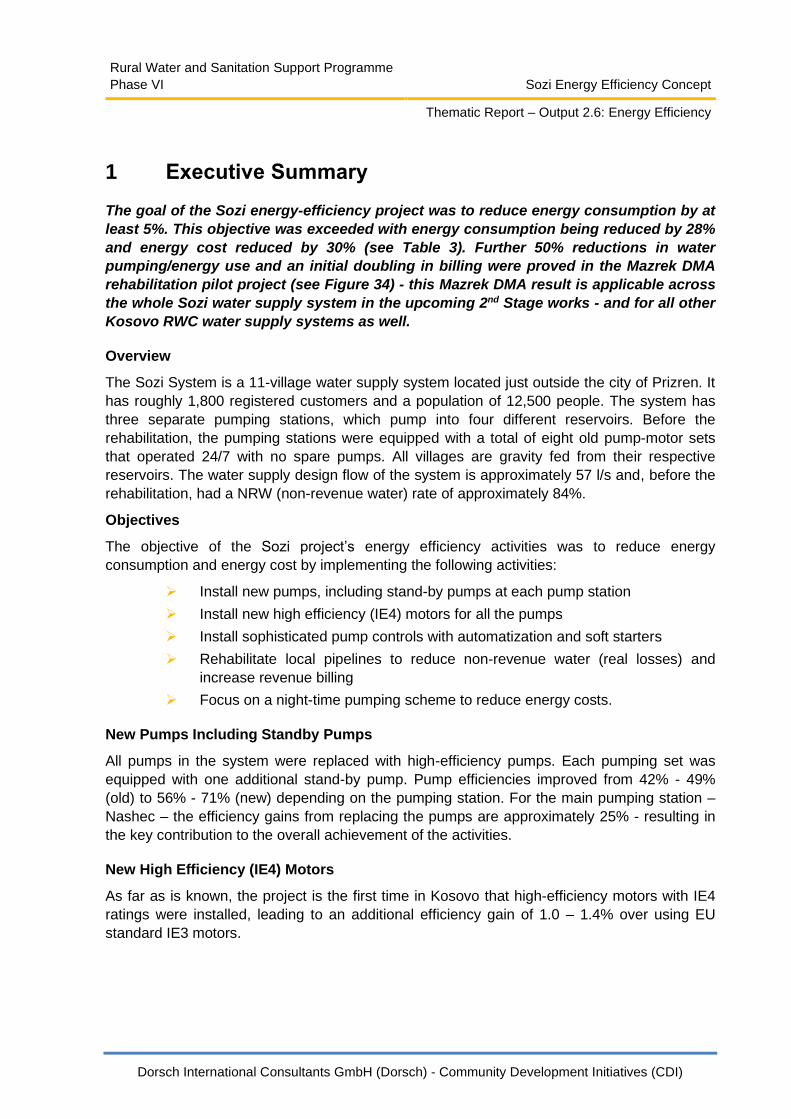
1 Executive Summary
The goal of the Sozi energy-efficiency project was to reduce energy consumption by at
least 5%. This objective was exceeded with energy consumption being reduced by 28%
and energy cost reduced by 30% (see Table 3). Further 50% reductions in water
pumping/energy use and an initial doubling in billing were proved in the Mazrek DMA
rehabilitation pilot project (see Figure 34) - this Mazrek DMA result is applicable across
the whole Sozi water supply system in the upcoming 2nd Stage works - and for all other
Kosovo RWC water supply systems as well.
Overview
The Sozi System is a 11-village water supply system located just outside the city of Prizren. It
has roughly 1,800 registered customers and a population of 12,500 people. The system has
three separate pumping stations, which pump into four different reservoirs. Before the
rehabilitation, the pumping stations were equipped with a total of eight old pump-motor sets
that operated 24/7 with no spare pumps. All villages are gravity fed from their respective
reservoirs. The water supply design flow of the system is approximately 57 l/s and, before the
rehabilitation, had a NRW (non-revenue water) rate of approximately 84%.
Objectives
The objective of the Sozi project’s energy efficiency activities was to reduce energy
consumption and energy cost by implementing the following activities:
➢ Install new pumps, including stand-by pumps at each pump station
➢ Install new high efficiency (IE4) motors for all the pumps
➢ Install sophisticated pump controls with automatization and soft starters
➢ Rehabilitate local pipelines to reduce non-revenue water (real losses) and
increase revenue billing
➢ Focus on a night-time pumping scheme to reduce energy costs.
New Pumps Including Standby Pumps
All pumps in the system were replaced with high-efficiency pumps. Each pumping set was
equipped with one additional stand-by pump. Pump efficiencies improved from 42% - 49%
(old) to 56% - 71% (new) depending on the pumping station. For the main pumping station –
Nashec – the efficiency gains from replacing the pumps are approximately 25% - resulting in
the key contribution to the overall achievement of the activities.
New High Efficiency (IE4) Motors
As far as is known, the project is the first time in Kosovo that high-efficiency motors with IE4
ratings were installed, leading to an additional efficiency gain of 1.0 – 1.4% over using EU
standard IE3 motors.

Rural Water and Sanitation Support Programme
Phase VI Sozi Energy Efficiency Concept
Thematic Report – Output 2.6: Energy Efficiency
Dorsch International Consultants GmbH (Dorsch) - Community Development Initiatives (CDI)
Pump Controls with Automatization and Soft Starters
The system was equipped with soft starters for gentle pump starts to increase pump and
motor life spans. The control cabinet further ensures automatic adjustment of the pumps, i.e.,
turn off if pumps are overheating, pump stop if reservoirs are full. The system is further
connected to the internet and can be controlled from the relevant regional water company
(RWC) utility headquarters in Prizren.
Rehabilitation of Pipelines to Reduce Real Losses
The Sozi System was divided into four isolated District Metered Areas (DMAs). One DMA –
Mazrek – was fully rehabilitated under the programme. The activities undertaken in the
Mazrek DMA included complete rehabilitation of the local water supply network and
installation of new house water meters located outside the customers' property.
In Mazrek the non-revenue water (NRW) was reduced from 86% to below 20% after
rehabilitation while billing was doubled. In the 12 months after rehabilitation, the NRW started
to increase again to currently 45% and billing reduced. This shows that reducing NRW and
increasing billing must be a continuous effort. Each month needs ongoing efforts to keep
NRW losses low and billing/revenue high. If water utilities turn their back on DMAs after
rehabilitation activities are finished, the NRW level will start to increase again through new
leaks, new illegal connections, meter tampering, and billing and payments will drop.
In other DMAs no significant NRW reduction investments were made under the programme.
Hence the NRW level in the other DMAs is as follows. In the Planea DMA the NRW reduced
from 77% to 73%. In the Gorica DMA, the NRW levels actually increased from 82% to 90%(!).
This DMA is the largest DMA in the Sozi System, and the extremely high NRW loss levels call
for immediate action by the RWC (regional water company). In Gjonaj, the RWC has invested
in infrastructure rehabilitation together with the municipality and NRW was reduced from 86%
to 68%.
Focus on a Night-Time Pumping Scheme to Reduce Cost.
Previously the Sozi System relied on 24/7 pumping. The new pumping scheme was designed
in such a way that significant reduction of NRW will lead to decreased inflow and hence
decreased pumping hours. These pumping hours can then be shifted into the night period and
costs can be reduced due to the lower energy tariff at night.
However, the extremely high NRW levels were not significantly reduced as this was not a
system-wide focus of stage 1, and hence shifting pumping into the night has not yet been
achieved. The recommendations in this report outline how this can be achieved in the future.
Evaluation of Investments
To understand the impact of the investments, simple payback periods are presented for the
energy efficiency activities.
The total investments for the energy efficiency activities incl. pump station rehabilitation,
stand-by pumps, materials, installation etc. amounts to 185,000 € while energy cost savings
are 39,144 €/a. Hence the simple payback period is below five years.

Rural Water and Sanitation Support Programme
Phase VI Sozi Energy Efficiency Concept
Thematic Report – Output 2.6: Energy Efficiency
Dorsch International Consultants GmbH (Dorsch) - Community Development Initiatives (CDI)
Key Performance Indicators
Under the programme, the consultant defined seven Key Performance Indicators (KPIs) to
evaluate different components of energy efficiency in pumping stations. These KPIs allow the
RWC to evaluate energy efficiency interventions but also support decision making for
investments of pumping stations that have not seen investments so far.
The Energy Monitoring Factsheet
The programme has developed an excel based energy evaluation factsheet for all RWCs. The
factsheet allows for simple entry of the energy bill and calculates the seven KPIs. By using the
factsheet, RWCs can keep track of the energy efficiency situation of their pumping stations
without time consuming energy audits. The factsheet can easily be printed as a PDF and
presented to technical management or international donors to decide on continued
investments. The factsheet is freely available, and it is recommended that RWCs create and
maintain this factsheet for all their pumping stations.
Lessons Learned
The work shows that significant cost-effective savings in both energy use and energy costs
can be made by replacing old pump-motor sets with the highest available energy efficiency
motor/pumps and by fitting the necessary power factor correction equipment.
The circa 30% energy and cost savings achieved in the Sozi System are just the beginning.
Even larger additional energy consumption and energy cost savings are possible with the
reinvestment of the new pump-motor energy cost savings to reduce the current extremely
high NRW levels - to bring about increased and sustainable energy cost reductions. See the
lessons learned from the water system reduction pilot in the Mazrek DMA in section 8.1.
The installation of capacitors in relevant pumping stations is highly cost effective with short
payback periods.
Replacement of pumps and motors is an important initial part of energy efficiency activities.
Due to the high energy use for water pumping, payback periods of around 5 years can be
expected.
Typical water pumping system costs are that around 70% is energy related, while only 13% is
related to equipment purchases.
Correct pump design is the key initial factor for energy efficiency activities. Investing in the
necessary expertise to recalculate pump design parameters ensures the high efficiency of
pumps and their reduced operating costs for many years into the future.
Accurately measured data and obtaining full information on the existing pump-motors and the
water supply network is critical for delivering the maximum possible energy efficiency gains in
any renovation work.
Significant gains are achieved at little cost when pump duty conditions are closely matched to
the pump load. Hence, a careful pump design will result in higher energy efficiency during
operation.
Using the highest possible efficiency electric motors improves the overall energy use
efficiency and minimizes the operating cost regardless of how the motors or pumps are
subsequently used.

Rural Water and Sanitation Support Programme
Phase VI Sozi Energy Efficiency Concept
Thematic Report – Output 2.6: Energy Efficiency
Dorsch International Consultants GmbH (Dorsch) - Community Development Initiatives (CDI)
IE4 motors is particularly good for smaller pumps as the relative energy efficiency gains are
higher (compared to IE3 or IE2 motors) than for larger motors/pumps. The payback period,
however, must be calculated based on motor prices.
Using the provided KPIs and the KPI Evaluation sheet will help RWCs to monitor water
pumping systems and adjust operations to further increase energy efficiency.
KPIs further help to compare different systems of a water utility and serve as a decision
support step for rehabilitation measures.

Rural Water and Sanitation Support Programme
Phase VI Sozi Energy Efficiency Concept
Thematic Report – Output 2.6: Energy Efficiency
Dorsch International Consultants GmbH (Dorsch) - Community Development Initiatives (CDI)
2 Background and Context
2.1 Objectives
➢ The main objective of this report is to present the energy efficiency evaluation
for the Sozi water supply system (operated under the Prizren RWC (Regional
Water Company) after the planned works and improvements were
implemented. The detailed objectives of this report are to:
➢ Describe the measures that were implemented
➢ Analyze the implemented measures with respect to the selected energy
efficiency indicators
➢ Make recommendations for the 2nd stage of the Sozi System energy efficiency
measures, which is primarily a major and sustained reduction in NRW
➢ Conclude with wider energy efficiency recommendations for the Prizren RWC
and other RWCs in Kosovo, and summarize the lessons learned.
This report views the Sozi system energy efficiency activities in two phases. The 1st stage was
part of the RWSSP VI project and lasts until mid-2021. This 1st stage thus includes the
immediate activities to reduce energy consumption and costs including the necessary
investments. The 2nd stage refers to the activities yet to be carried out by the Prizren RWC to
further reduce the Sozi system’s energy consumption and costs.
2.2 EE Project Progress and Timeline for 1st stage
➢ The #1 Consultants mission (by Frank Pool - international consultant and Agron
Bektashi - local consultant) developed Kosovo-wide EE and RE
context/concepts and demonstration options (May - June 2018). See the
Thematic Report on Output 2.6 from 2018 for further details.
➢ Dorsch/CDI reviewed and confirmed the EE/RE context, concepts and
demonstration options. The Sozi and Pozharan systems were chosen as the
initial EE demonstration projects.
➢ Dorsch/CDI decided to include several other activities in the Sozi System
updates and thus started detailed investigations in 2018 (See Sozi Inception
Report for further details).
➢ Dorsch/CDI gathered the Sozi and Pozharan demonstration projects’ water
supply and electricity demand/cost baselines and shared this data with the
international consultant.
➢ Dorsch/CDI produced the “Sozi Inception Report.” It was established that all
pumps were running with no clear seasonal patterns, due to a combination of a
lack of working reservoir level sensors to control pump operations on the Hasi-
side and excessive water losses/demand on the Kobaj-side of the Sozi-side
systems. It was also confirmed that the Sozi System had extremely high levels
of NRW (Non-Revenue Water) from an unknown combination of illegal
connections and high technical leakage losses.
Rural Water and Sanitation Support Programme
Phase VI Sozi Energy Efficiency Concept
Thematic Report – Output 2.6: Energy Efficiency
Dorsch International Consultants GmbH (Dorsch) - Community Development Initiatives (CDI)
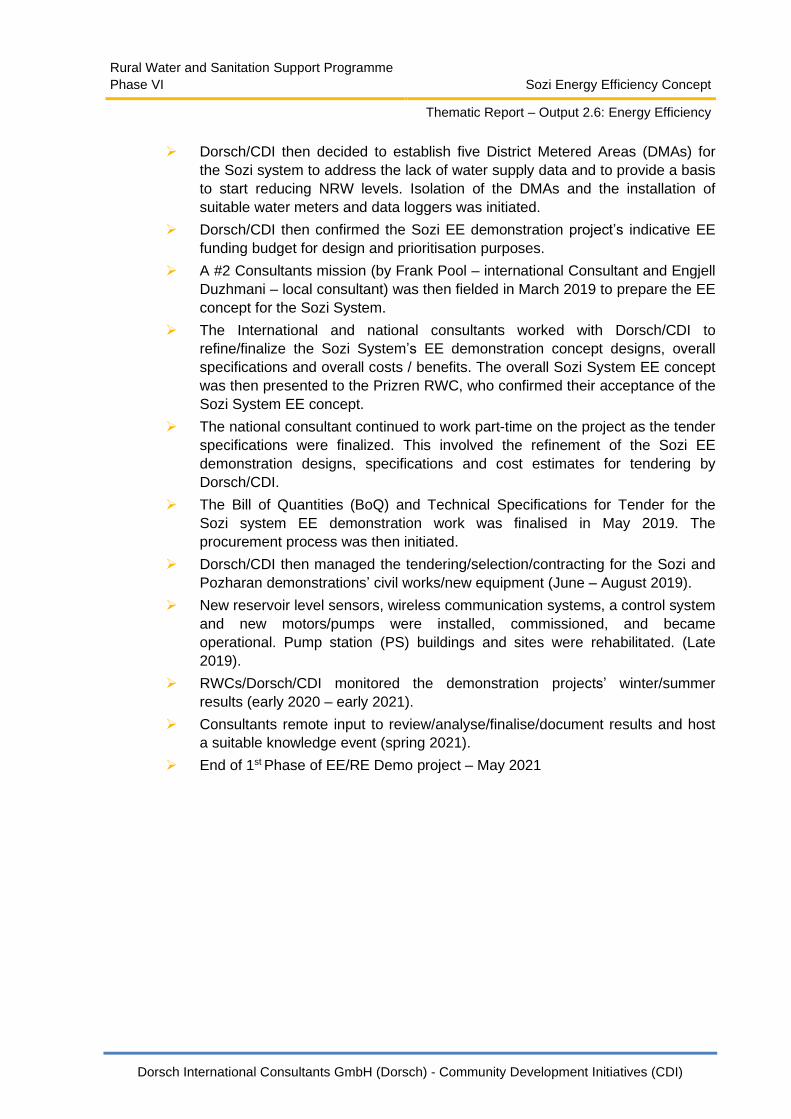
➢ Dorsch/CDI then decided to establish five District Metered Areas (DMAs) for
the Sozi system to address the lack of water supply data and to provide a basis
to start reducing NRW levels. Isolation of the DMAs and the installation of
suitable water meters and data loggers was initiated.
➢ Dorsch/CDI then confirmed the Sozi EE demonstration project’s indicative EE
funding budget for design and prioritisation purposes.
➢ A #2 Consultants mission (by Frank Pool – international Consultant and Engjell
Duzhmani – local consultant) was then fielded in March 2019 to prepare the EE
concept for the Sozi System.
➢ The International and national consultants worked with Dorsch/CDI to
refine/finalize the Sozi System’s EE demonstration concept designs, overall
specifications and overall costs / benefits. The overall Sozi System EE concept
was then presented to the Prizren RWC, who confirmed their acceptance of the
Sozi System EE concept.
➢ The national consultant continued to work part-time on the project as the tender
specifications were finalized. This involved the refinement of the Sozi EE
demonstration designs, specifications and cost estimates for tendering by
Dorsch/CDI.
➢ The Bill of Quantities (BoQ) and Technical Specifications for Tender for the
Sozi system EE demonstration work was finalised in May 2019. The
procurement process was then initiated.
➢ Dorsch/CDI then managed the tendering/selection/contracting for the Sozi and
Pozharan demonstrations’ civil works/new equipment (June – August 2019).
➢ New reservoir level sensors, wireless communication systems, a control system
and new motors/pumps were installed, commissioned, and became
operational. Pump station (PS) buildings and sites were rehabilitated. (Late
2019).
➢ RWCs/Dorsch/CDI monitored the demonstration projects’ winter/summer
results (early 2020 – early 2021).
➢ Consultants remote input to review/analyse/finalise/document results and host
a suitable knowledge event (spring 2021).
➢ End of 1st Phase of EE/RE Demo project – May 2021

Rural Water and Sanitation Support Programme
Phase VI Sozi Energy Efficiency Concept
Thematic Report – Output 2.6: Energy Efficiency
Dorsch International Consultants GmbH (Dorsch) - Community Development Initiatives (CDI)
3 Existing Situation Before Rehabilitation
The existing situation described in this report is limited to a brief overview relevant to the Sozi
system’s energy efficiency evaluation. It is recommended to refer to the “Sozi Inception
Report” and the “Sozi Energy Efficiency Concept Report” for more details if this is required.
The Sozi spring based 11-village system, located just outside the city of Prizren, had 1,807
registered customers in September 2018 and a population of 11,505 in November 2018,
based on a Comprehensive Customer Survey (CCS) undertaken by Dorsch/CDI. The Sozi
System had several bulk water supply meters installed (but not calibrated since their
installation in 2009). The system is primarily fed by one spring in the village of Nashec/Nasec,
and supplies four reservoirs (Kobaj, Kojush-1, Kojush-2, and Planeja).
One existing reservoir in the largest village of Gjonaj/ Djonaj is scheduled to be connected to
the system in the future. A spring, connected to a second reservoir in Gjonaj/Djonaj, is a
second small water source that supplies part of the village of Gjonaj/Djonaj.
The Sozi System has three separate pumping stations (Nashec, Kojush-1 and Kojush-2). The
water supply to all Sozi System customers is by gravity from reservoirs. The main pipes from
the pumping stations to the reservoirs are mainly old asbestos cement pipes (with some
dating back to 1975), with some newer HDPE pipes and some steel pipes, mainly in the
pipeline from the Nashec pumping station to the Kobaj reservoir.
The Sozi system overall Non-Revenue Water (NRW) rate was 84% according to the
preliminary water balance established in the Sozi Inception Report in 2018.
The total nominal pump capacity of the old pumps in the Sozi System was 342 kW, of which a
nominal 275 kW in 8 pumps operated 24/7 before the rehabilitation works were implemented.
The electricity use in 2019, before the rehabilitation works were implemented, was around
140,000€/year = 4.5€/customer/month.
Before the renovations, the revenue from the Sozi System customers did not even cover the
system’s electricity costs, let alone staff costs, O&M costs (including spare parts) and any
provision for eventual equipment and network replacement.
An overview of the system is given in Figure 1 while the PDF attached below gives a more
detailed insight.

Rural Water and Sanitation Support Programme
Phase VI Sozi Energy Efficiency Concept
Thematic Report – Output 2.6: Energy Efficiency
Dorsch International Consultants GmbH (Dorsch) - Community Development Initiatives (CDI)
Figure 1: Sozi Water Supply System Overview.
The “Hasi-side“ of the water supply system includes all the connected villages on the true right
of the river, while the “Kobaj-side“ includes all the connected villages on the true left side of
the river.
Sozi_Water_Sypply_System_Overview.pdf

Rural Water and Sanitation Support Programme
Phase VI Sozi Energy Efficiency Concept
Thematic Report – Output 2.6: Energy Efficiency
Dorsch International Consultants GmbH (Dorsch) - Community Development Initiatives (CDI)
4 Concept
The concept for this Energy Efficiency project was described in detail in the “Sozi Energy
Efficiency Concept Report.” This chapter is a summary to set the context for this report.
To avoid water shortages in the near term, yet still accommodate a significantly reduced water
supply in the medium-term future (when real water losses are significantly reduced from NRW
reductions) the operating principle for the new Sozi system energy efficiency design was to
provide the same supply as the current system with the possibility to reduce flows in the near
medium term as NRW losses are reduced.
For the Nashec pumping station this is realised through two sets (one set for the “Hasi-side“
and one set for the “Kobaj-side“ of the Sozi water supply system) of 2+1 pump arrangement
where two pumps operate in parallel as duty pumps and one pump serves as stand-by. When
NRW reduces significantly in the future the operation can be reduced to a single duty pump.
The Kojush 1 pumping station uses a 2 + 1 pumping arrangement as this pumping station
supplies the major Kojush-Mazrek-Gjonaj water supply area and flexibility was sought for
when NRW was greatly reduced in this water supply area. For the Kojush 2 pumping station a
1+1 pump arrangement is designed with one duty pump and one stand-by pump. Hence, a
total of 11 pump-motor sets were installed.
The total design flow for the system is:
Total design flow 57 l/s
Several interventions were implemented to reduce the overall energy consumption in the Sozi
System. The interventions were:
➢ New Pumps and Motors in 2+1 and 1+1 arrangements
o 2+1 for Nashec to Kojush 1
o 2+1 for Nashec to Kobaj
o 2+1 for Kojush 1 to Kojush 2
o 1+1 for Kojush 2 to Planea
o Higher pump efficiencies will reduce energy demand
o Revised design approach will reduce energy demand
o The 2+1 pumping schemes will allow for the need to pump less water when the
current excessive NRW levels are reduced.
➢ Pump Automatization System
o No reservoir overflow as NRW is reduced (saving energy)
o No reservoir running dry (ensuring an improved water supply)
o Cascade pumping between reservoirs to be smoother and better coordinated
o Possibility to shift pumping into the night where electricity tariffs are lower.
o Possibility to understand how the system behaves and to adapt if pumping
should be with one or two pumps.

Rural Water and Sanitation Support Programme
Phase VI Sozi Energy Efficiency Concept
Thematic Report – Output 2.6: Energy Efficiency
Dorsch International Consultants GmbH (Dorsch) - Community Development Initiatives (CDI)
➢ Night-Time Pumping
o Reduction in energy costs due to utilising lower night electricity tariffs.
➢ Soft Starters
o Ensure a gentler start for the motors and hence extend motor and pump life
o To investigate whether reduced maximum demand will have a financial
implication on the energy bill.
➢ NRW Reduction
o Establish five DMAs and improve NRW management
o Rehabilitation of the Mazrek DMA as a pilot demonstration project
o Undertake small rehabilitation works on the leakiest transmission pipes and
reservoirs

Rural Water and Sanitation Support Programme
Phase VI Sozi Energy Efficiency Concept
Thematic Report – Output 2.6: Energy Efficiency
Dorsch International Consultants GmbH (Dorsch) - Community Development Initiatives (CDI)
5 Infrastructure Works
5.1 Replacement of Pumps and Motors
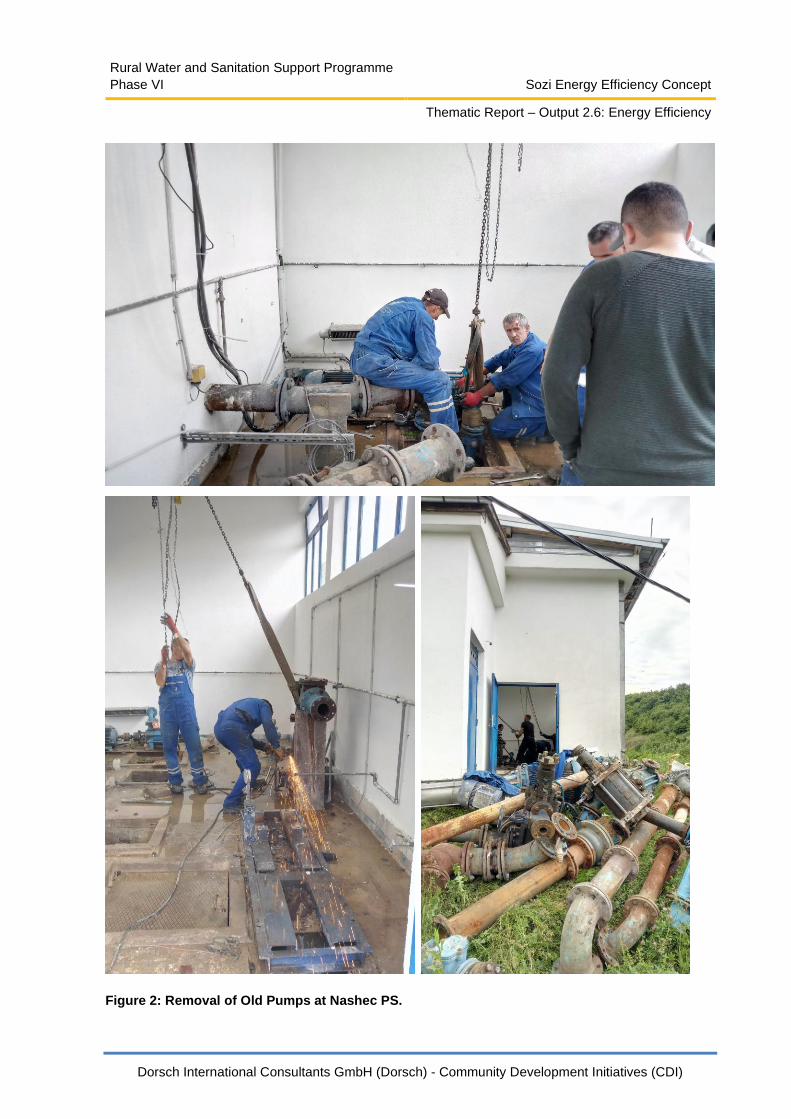
All pumps were replaced with new high efficiency pumps. All new pumps are now high
efficiency pumps with IE4 motors to ensure the maximum possible energy savings. The
figures below show examples of the new vertical axis pumps in the Nashec, Kojush 1 and
Kojush 2 pumping stations.
The rehabilitation measures of the pumps in the Kojush 1 and Kojush 2 pumping stations took
place in February 2020. The rehabilitation measures of the Nashec pumping station took
place in May/June 2020.
Annex 1 shows the name plates for the installed pumps.
Rural Water and Sanitation Support Programme
Phase VI Sozi Energy Efficiency Concept
Thematic Report – Output 2.6: Energy Efficiency
Dorsch International Consultants GmbH (Dorsch) - Community Development Initiatives (CDI)
Figure 2: Removal of Old Pumps at Nashec PS.

Rural Water and Sanitation Support Programme
Phase VI Sozi Energy Efficiency Concept
Thematic Report – Output 2.6: Energy Efficiency
Dorsch International Consultants GmbH (Dorsch) - Community Development Initiatives (CDI)
Figure 3: Installation of New Pumps at Nashec PS.

Rural Water and Sanitation Support Programme
Phase VI Sozi Energy Efficiency Concept
Thematic Report – Output 2.6: Energy Efficiency
Dorsch International Consultants GmbH (Dorsch) - Community Development Initiatives (CDI)
Figure 4: New Pumps and Motors at Nashec PS.

Rural Water and Sanitation Support Programme
Phase VI Sozi Energy Efficiency Concept
Thematic Report – Output 2.6: Energy Efficiency
Dorsch International Consultants GmbH (Dorsch) - Community Development Initiatives (CDI)
Figure 5: New Pumps and Motors at Kojush 1 PS.

Rural Water and Sanitation Support Programme
Phase VI Sozi Energy Efficiency Concept
Thematic Report – Output 2.6: Energy Efficiency
Dorsch International Consultants GmbH (Dorsch) - Community Development Initiatives (CDI)
Figure 6: New Pumps and Motors at Kojush 2 PS.

Rural Water and Sanitation Support Programme
Phase VI Sozi Energy Efficiency Concept
Thematic Report – Output 2.6: Energy Efficiency
Dorsch International Consultants GmbH (Dorsch) - Community Development Initiatives (CDI)
5.2 Pump Control and Automatization System
Soft motor starters ensure a gentle start of the pumps. They therefore reduce the pump’s
operation and maintenance needs and reduce the maximum power demand of the motors.
Soft starters are current state-of-the-art technology and should be installed with all pumps.
Each new pump was equipped with a soft starter. Figure 7 shows the control cabinet with all
its necessary control equipment and a close-up view of the soft starter.
Figure 7: Control Cabinet and Soft Starter.
The reactive energy controllers are small electrical cabinets equipped with capacitors that
reduce the reactive energy demand. Excess reactive energy is billed to the RWCs by KEDS
and hence a reduction of reactive energy demand directly lowers the energy bill. Reactive
energy controllers were already installed but were replaced due to their old age in Nashec PS
and Kojush 1 PS while in Kojush 2 PS they are not needed due to a different applicable
electricity tariff. Figure 8 shows the reactive energy device for Nashec PS that increases the
power factor above the required value of 0.95.

Rural Water and Sanitation Support Programme
Phase VI Sozi Energy Efficiency Concept
Thematic Report – Output 2.6: Energy Efficiency
Dorsch International Consultants GmbH (Dorsch) - Community Development Initiatives (CDI)
Figure 8: Reactive Energy Controler.
5.3 Other Works
In addition to the main works on energy efficiency, some additional works were carried out
mainly with regards to renovations of pumping stations and non-revenue water reduction.
Before rehabilitation, the village of Mazrek showed NRW of up to 86% due to high real losses,
unmetered house connections and illegal tapping of the network. Thus, the village was in
desperate need of rehabilitation. An intensive rehabilitation of the network was conducted.
The following activities were carried out:
➢ Isolation of Mazrek as a DMA with a new water meter and data logger.
➢ Replacement of the village’s network i.e., 4 km of network.
➢ Disconnection of illegal connections due to replacement of the network.
➢ Extension of network and connection of new customers.
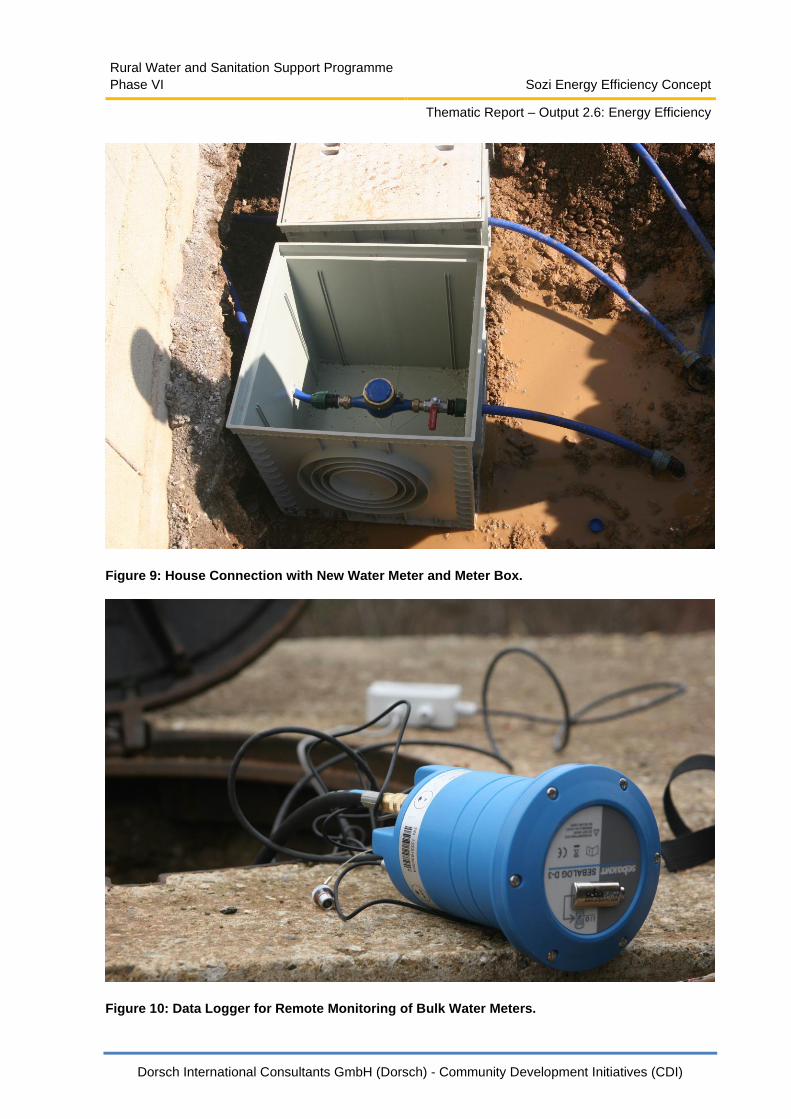
➢ New house connections for 160 household incl. water meter chambers outside
each property and new water meters for each house.
The figures below give an impression of the NRW reduction works in Mazrek.
Rural Water and Sanitation Support Programme
Phase VI Sozi Energy Efficiency Concept
Thematic Report – Output 2.6: Energy Efficiency
Dorsch International Consultants GmbH (Dorsch) - Community Development Initiatives (CDI)
Figure 9: House Connection with New Water Meter and Meter Box.
Figure 10: Data Logger for Remote Monitoring of Bulk Water Meters.
Rural Water and Sanitation Support Programme
Phase VI Sozi Energy Efficiency Concept
Thematic Report – Output 2.6: Energy Efficiency
Dorsch International Consultants GmbH (Dorsch) - Community Development Initiatives (CDI)
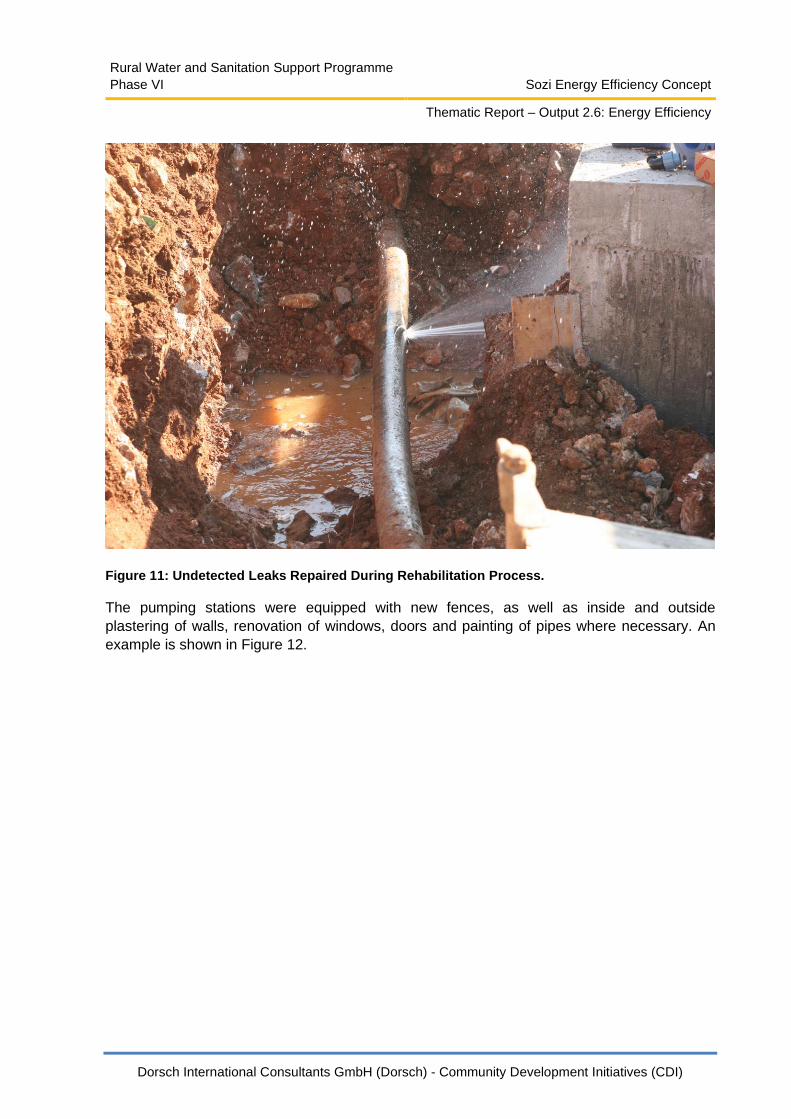
Figure 11: Undetected Leaks Repaired During Rehabilitation Process.
The pumping stations were equipped with new fences, as well as inside and outside
plastering of walls, renovation of windows, doors and painting of pipes where necessary. An
example is shown in Figure 12.

Rural Water and Sanitation Support Programme
Phase VI Sozi Energy Efficiency Concept
Thematic Report – Output 2.6: Energy Efficiency
Dorsch International Consultants GmbH (Dorsch) - Community Development Initiatives (CDI)
Figure 12: Rehabilitated Nashec PS.
Especially in the Nashec PS several cracks and leaks were closed. These water losses were
before the water meters and hence they do not directly contribute to a reduction in non-
revenue water, however it is important to reduce leaks also before water meters to increase
utilization of the spring and to reduce deterioration of the built infrastructure.

Rural Water and Sanitation Support Programme
Phase VI Sozi Energy Efficiency Concept
Thematic Report – Output 2.6: Energy Efficiency
Dorsch International Consultants GmbH (Dorsch) - Community Development Initiatives (CDI)
6 Pump and Motor Efficiency
6.1 Efficiency of Old Pump-Motor Sets
The “Energy Efficiency Report” from 2018 outlines that the existing pumps and motors were in
desperate need for replacement and that their efficiencies were expected to be well below
acceptable levels. Detailed efficiency measurements of all pumps and motors before
rehabilitation were not possible because the necessary water meters were not installed.
However, mobile water measurements were done at 2 pumps at the Nashec pumping station
(Nashec to Kojush 1) to serve as an indication for the efficiency of the pumps in the Sozi
System. The following pump-motor efficiencies were measured.
PS Pumps Efficiency Specific Energy Consumption
Nashec Pump 1 (Lowara) 42% 6.6 Wh/m3/m
Nashec Pump 2 (KSB) 49% 5.6 Wh/m3/m
Nashec Combined 46% 6.0 Wh/m3/m
6.2 Efficiency of New Pump-Motor Sets
After installation of the new pumps and motors, efficiency tests were carried out in October
2020 for the following pump-motor combinations representing normal operating hours.
PS Pumps Efficiency Specific Energy Consumption
Nashec P1 and P2 to Kobaj 70.6% 3.9 Wh/m3/m
Nashec P1 and P3 to Kojush 1 71.4% 3.8 Wh/m3/m
Kojush 1 P1 and P3 to Kojush 2 70.8% 3.8 Wh/m3/m
Kojush 2 P1 to Planea 56.2% 4.8 Wh/m3/m
Kojush 2 P2 to Planea 63.8% 4.2 Wh/m3/m
The new pumps and motors show a significantly higher efficiency than the old ones. When
comparing the NAshec pumping station, pump and motor efficiency gains of 25% were
achieved. This is a considerable level of energy efficiency gains. The pump-motor efficiencies
in Kojush 2 are lower because the pumps installed are substantially smaller capacity than in
other pumping stations and hence their efficiencies are lower.

Rural Water and Sanitation Support Programme
Phase VI Sozi Energy Efficiency Concept
Thematic Report – Output 2.6: Energy Efficiency
Dorsch International Consultants GmbH (Dorsch) - Community Development Initiatives (CDI)
6.3 Efficiency of Motors
The efficiencies as above are given as the total efficiency of the pumps and motors. Normally
the pumps would be delivered with standard EU specification IE3 efficiency level electric
motors. This project specifically focused on increasing efficiency by the use of the highest
realistic efficiency level electric motors (IE4).
The efficiency of IE3 electric motors compared to IE4 is as follows:
Pumps IE3 IE4 Difference
Nashec to Kobaj 94.0% 95.0% 1.0%
Nashec to Kojush1 93.7% 94.8 % 1.1%
Kojush 1 to Kojush 2 92.7% 94.0% 1.3%
Kojush 2 to Planea 91.9% 93.3% 1.4%
The trend shows that the difference is larger for smaller pump-motor sets and is in the range
of 1 – 1.4%.
According to a quote for the Nashec – Kobaj pumps, the price for an IE4 motor is an
additional 12% on the pump-motor set price with IE3 motors. Hence, the additional cost for all
six pumps and motors in the Nashec pumping station would be 5,700 €. The yearly direct
energy cost for the Nashec pumping station with 4 pumps running (+2 duty pumps) is on
average approximately 60,000 €. Hence 1% is 600 € per year energy cost saving. The
resulting payback period is thus approximately 9.5 years. If only duty pumps had used IE4
motors, the payback period would have been 6.5 years.
6.4 Pump Curves of New Pumps
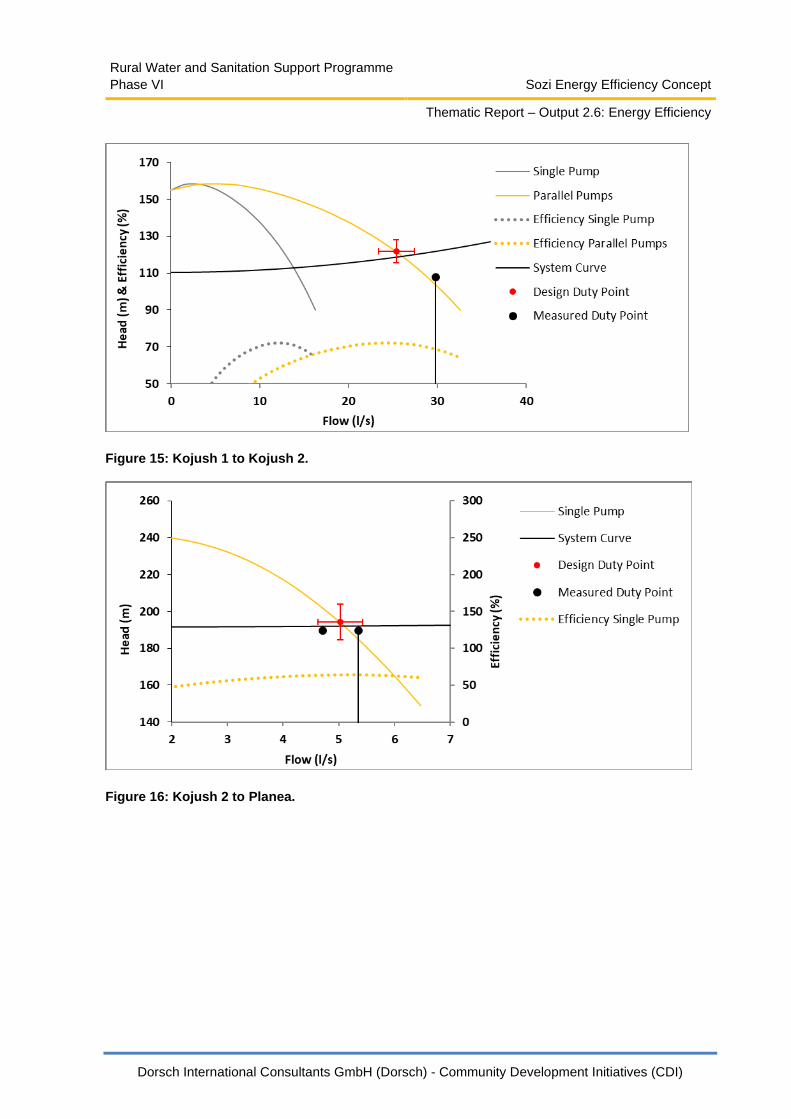
The graphs below show how the pumps in the designed operation mode behave. The point
where pump curve and system curve cross is the theoretical operation point of the pump. In
practice the pump curve of each individual pump is slightly different, and the system curves
tend to behave slightly differently than in the hydraulic design.
The red dot shows the operation point as designed by the project while the black dot shows
how the pumps work after installation.
Most pumps are designed for parallel pumping and work well and with high efficiency within
acceptable ranges close to their design points. The pumps in Kojush 1 and Kojush 2 work with
a slightly lower pressure than expected, however they still run with high efficiency and deliver
more water than designed. Thus, their operation time decreases, and the results are hence
acceptable.

Rural Water and Sanitation Support Programme
Phase VI Sozi Energy Efficiency Concept
Thematic Report – Output 2.6: Energy Efficiency
Dorsch International Consultants GmbH (Dorsch) - Community Development Initiatives (CDI)
Figure 13: Nashec to Kobaj.
Figure 14 Nashec to Kojush 1.
Rural Water and Sanitation Support Programme
Phase VI Sozi Energy Efficiency Concept
Thematic Report – Output 2.6: Energy Efficiency
Dorsch International Consultants GmbH (Dorsch) - Community Development Initiatives (CDI)
Figure 15: Kojush 1 to Kojush 2.
Figure 16: Kojush 2 to Planea.

Rural Water and Sanitation Support Programme
Phase VI Sozi Energy Efficiency Concept
Thematic Report – Output 2.6: Energy Efficiency
Dorsch International Consultants GmbH (Dorsch) - Community Development Initiatives (CDI)
7 Analysis of Energy and Cost Savings
7.1 Energy Efficiency Key Performance Indicators
To establish a meaningful baseline, a set of Key Performance Indicators (KPI) were
developed which facilitates the comparison of pre- and post-renovation energy usage and
cost factors. The KPIs set up a system on how to analyse and evaluate the energy use and
costs savings after the implementation of the energy efficiency measures. Figure 17 shows
where the indicators can be found on the energy bills.
Figure 17: Key Performance Indicator Data Shown in Electricity Bills.
Rural Water and Sanitation Support Programme
Phase VI Sozi Energy Efficiency Concept
Thematic Report – Output 2.6: Energy Efficiency
Dorsch International Consultants GmbH (Dorsch) - Community Development Initiatives (CDI)
7.1.1 Energy Cost
The total energy costs are reflected in the electricity bills for each pumping station. These bills
include the cost for electricity consumption as well as additional costs for reactive energy,
maximum demand, standing charge and VAT. The first KPI to measure the overall costs is as
follows:
1 Total Electricity Bill €
1a Electricity Bill Nashec PS €
1b Electricity Bill Kojush 1 €
1c Electricity Bill Kojush 2 €
KPI 1 is given in Euro and is measured as the total amount of the energy bill for each month
for each pumping station.
A second financial indicator is the direct energy cost from the energy consumption without
charges for reactive energy, standing charge, maximum demand charge and VAT. The direct
energy cost shows the financial implications of reducing energy consumption more clearly and
without the “noise” of other costs. (Financial savings from reducing reactive energy and
reducing the maximum demand charge will be analysed using indicators 6 and 7).
KPI 2 is described as:
2 Total Direct Energy Cost (A1+A2) €
2a Direct Energy Cost Nashec PS (A1+A2) €
2b Direct Energy Cost Kojush 1 (A1+A2) €
2c Direct Energy Cost Kojush 2 (A1+A2) €
KPI 2 is given in Euro and is measured as the energy costs of A1 and A2 as indicated in the
energy bill.
7.1.2 Energy Consumption
The energy consumption is an important indicator since it gives a direct figure of the energy
that was used, regardless of its price. Reduction of energy consumption is a key component
of the strategy followed for the Sozi System, alongside moving as much energy use as is
possible into the lower tariff night period.

Rural Water and Sanitation Support Programme
Phase VI Sozi Energy Efficiency Concept
Thematic Report – Output 2.6: Energy Efficiency
Dorsch International Consultants GmbH (Dorsch) - Community Development Initiatives (CDI)
The second indicator to measure the overall energy consumption is as follows:
3 Total Energy Consumption kWh
3a Energy Consumption Nashec PS kWh
3b Energy Consumption Kojush 1 kWh
3c Energy Consumption Kojush 2 kWh
This indictor is shown in kWh and is based on the energy readings of the electricity meter of
each pumping station and is given in the monthly electricity bills.
7.1.3 Percent Day Pumping
The time in which energy is used has no implications for the amount of energy used but has
an implication on its price due to the significant night/day tariff price difference. Energy that is
used at night is cheaper than energy used during the day. Thus, the ratio of day pumping vs.
night pumping is important and measured with KPI 4. The indicator is important to monitor
how successful water pumping was in being shifted into the night, as detailed in chapter 4.
4a Percent Day pumping Nashec PS %
4b Percent Day pumping Kojush 1 %
4c Percent Day pumping Kojush 2 %
This ratio is calculated as the ratio of the energy used in tariff A1 over the tariff of A1+A2. Both
are indicated on the energy bill.
7.1.4 Specific Energy Consumption
KPI 5 is the most reliable indicator for the energy efficiency of pumps and motors. It measures
energy used per meter pressure and unit of water transported. It is not influenced by changing
energy tariffs or changing amounts of water transported. It also facilitates the comparison of
energy consumption across different pumping stations.
5 Total specific energy consumption kWh/m/m3
5a Specific energy consumption Nashec PS kWh/m/m3
5b Specific energy consumption Kojush 1 kWh/m/m3
5c Specific energy consumption Kojush 2 kWh/m/m3

Rural Water and Sanitation Support Programme
Phase VI Sozi Energy Efficiency Concept
Thematic Report – Output 2.6: Energy Efficiency
Dorsch International Consultants GmbH (Dorsch) - Community Development Initiatives (CDI)
The indicator is calculated with the energy consumption from the electricity bill (kWh), divided
by the total static head of the pump (m) and also divided by the total water pumped (m3) in the
same period of the bill. For the total pressure head of the pumps (Pt), the suction pressure
(Ps) must be added if the suction reservoir is located below the pumps and subtracted if the
suction reservoir is located above the pumps (see Figure 18).
Figure 18: Calculating the Correct Pressure of a Pumping Station.
7.1.5 Maximum Demand
Maximum demand is the highest power demand in kilowatts that the electricity meter reads
within one month. This maximum demand is charged extra on the bill. The maximum demand
charge does not apply to all tariff categories and in this case only applies to Nashec PS and
Kojush 1.
KPI 6 therefore measures the maximum demand as indicated in the electricity bill.
6a Maximum demand Nashec PS kW
6b Maximum demand Kojush 1 kW

Rural Water and Sanitation Support Programme
Phase VI Sozi Energy Efficiency Concept
Thematic Report – Output 2.6: Energy Efficiency
Dorsch International Consultants GmbH (Dorsch) - Community Development Initiatives (CDI)
7.1.6 Reactive Energy Charges
Reactive energy is separately charged for by the electricity company if the power factor is
below 0.95. Reactive energy can be reduced by installing power factor compensators
(capacitors). The power factor charge does not apply to all tariff categories and in this case
only applies to Nashec PS and Kojush 1.
7a Reactive Energy Nashec PS kVArh
7b Reactive Energy Kojush 1 kVArh
KPI 7 reflects the reactive energy in kVArh which is charged for by the electricity utility and
indicated in the bill. The indicator is calculated as the sum of the reactive energy during the
day (R1-R1D) and the night (R2-R2D). The relationship between reactive energy and the
power factor is as follows.
Energy is divided into real power (P) which is the power that is used to provide useful work in
the motors, and reactive power (Q), which appears as a “side-product” of producing the real
power. Both together are combined in the apparent power (S) used (see Figure 19).
Figure 19: Power Triangle of an AC Circuit.
The real power P is given as active energy (A1/A2) in the energy bill. Reactive power Q is
given as reactive energy (R1/R2) in the energy bill. The apparent power is not shown in the
energy bills.
The power factor is the cos of the energy triangle and describes the relationship of the
reactive energy over the apparent energy.
cos𝜑 =𝑃
𝑆
If cos is <0.95, then the reactive energy is charged for.
The same value as cos is tan calculated from the reactive energy over the active energy.
tan𝜑 =𝑄
𝑃
Corresponding to cos <0.95 is tan >0.33. Reactive energy up to tan = 0.33 is free and
only the amounts exceeding this value are charged.

Rural Water and Sanitation Support Programme
Phase VI Sozi Energy Efficiency Concept
Thematic Report – Output 2.6: Energy Efficiency
Dorsch International Consultants GmbH (Dorsch) - Community Development Initiatives (CDI)
This reactive power exceeding amount is calculated with
𝑄𝑟 = 𝑄 − 0.33 ∗ 𝑃
Where Qr is the figure indicated as R1-R1D and R2-R2D in the energy bill.
7.2 Baseline
The baseline of each KPI refers to the average value of the past 12 months before the
rehabilitation measures. The evaluation of the KPIs is then compared to this baseline value.
The rehabilitation measures of the pumps in the Kojush 1 and Kojush 2 pumping stations took
place in February 2020 and have been in operation since 16 February 2020. Hence the
baseline period for the Kojush pumping stations is from March 2019 – February 2020.
The rehabilitation measures of the Nashec pumping station took place in May/June 2020 and
the pumps have been in operation since 6 June 2020. Hence the baseline period is from June
2019 – May 2020.
The table below shows the baseline value for each KPI. The graphic representation of the
baseline is given in Figure 20 to Figure 25 in chapter 7.3.

Rural Water and Sanitation Support Programme
Phase VI Sozi Energy Efficiency Concept
Thematic Report – Output 2.6: Energy Efficiency
Dorsch International Consultants GmbH (Dorsch) - Community Development Initiatives (CDI)
Table 1: Key Performance Indicators of the Baseline Period.
KPI Description Unit Baseline Period (Average per month)
1 Total Electricity Bill € € 11,019
1a Electricity Bill Nashec PS € € 7,978
1b Electricity Bill Kojush 1 € € 2,431
1c Electricity Bill Kojush 2 € € 609
2 Total Direct Energy Cost (A1+A2) € € 8,855
2a Direct Energy Cost Nashec PS (A1+A2) € € 6,276
2b Direct Energy Cost Kojush 1 (A1+A2) € € 2,018
2c Direct Energy Cost Kojush 2 (A1+A2) € € 561
3 Total Energy Consumption kWh 167,587
3a Energy Consumption Nashec PS kWh 126,574.50
3b Energy Consumption Kojush 1 kWh 33,492
3c Energy Consumption Kojush 2 kWh 7,520
4a Percent Day pumping Nashec PS % 62.2%
4b Percent Day pumping Kojush 1 % 61.5%
4c Percent Day pumping Kojush 2 % 39.3%
5 Total specific Energy Consumption kWh/m/m3 6.0*
5a Specific Energy Consumption Nashec PS kWh/m/m3 6.0*
5b Spec. Energy Consumption Kojush 1 kWh/m/m3 6.0*
5c Spec. Energy Consumption Kojush 2 kWh/m/m3 6.0*
6a Maximum demand Nashec PS kW 208
6b Maximum demand Kojush 1 kW 78
7a Reactive Energy Billed Nashec PS kVArh 0
7b Reactive Energy Billed Kojush 1 kVArh 0
*Average value from the energy efficiency test described in chapter 6.1
7.3 Evaluation
For the evaluation period, the improvements in energy efficiency made in the renovation works are measured against the baseline.
The evaluation period for Kojush 1 and Kojush 2 is from March 2020 – February 2021 while
the evaluation period for the Nashec pumping station is from June 2020 – March 2021.
Table 2 shows the results for all KPIs during the evaluation period. A comparison between the baseline and evaluation period is given in Table 3.

Rural Water and Sanitation Support Programme
Phase VI Sozi Energy Efficiency Concept
Thematic Report – Output 2.6: Energy Efficiency
Dorsch International Consultants GmbH (Dorsch) - Community Development Initiatives (CDI)
Table 2: Key Performance Indicators of Post EE Implementation Evaluation Period.
KPI Description Unit Evaluation Period (Average per month)
1 Total Electricity Bill € € 7,756
1a Electricity Bill Nashec PS € € 5,588
1b Electricity Bill Kojush 1 € € 1,644
1c Electricity Bill Kojush 2 € € 522
2 Total Direct Energy Cost (A1+A2) € € 6,405
2a Direct Energy Cost Nashec PS (A1+A2) € € 4,528
2b Direct Energy Cost Kojush 1 (A1+A2) € € 1,383
2c Direct Energy Cost Kojush 2 (A1+A2) € € 493
3 Total Energy Consumption kWh 120,522
3a Energy Consumption Nashec PS kWh 91,289
3b Energy Consumption Kojush 1 kWh 22,893
3c Energy Consumption Kojush 2 kWh 6,340
4a Percent Day pumping Nashec PS % 62.3%
4b Percent Day pumping Kojush 1 % 62.5%
4c Percent Day pumping Kojush 2 % 46.0%
5 Total specific Energy Consumption kWh/m/m3 4.32
5a Specific Energy Consumption Nashec PS kWh/m/m3 4.05
5b Spec. Energy Consumption Kojush 1 kWh/m/m3 4.13
5c Spec. Energy Consumption Kojush 2 kWh/m/m3 4.79
6a Maximum demand Nashec PS kW 156
6b Maximum demand Kojush 1 kW 53
7a Reactive Energy Nashec PS kVArh 0
7b Reactive Energy Kojush 1 kVArh 0

Rural Water and Sanitation Support Programme
Phase VI Sozi Energy Efficiency Concept
Thematic Report – Output 2.6: Energy Efficiency
Dorsch International Consultants GmbH (Dorsch) - Community Development Initiatives (CDI)
Table 3 Savings of Sozi Energy Efficiency Project for all KPIs.
KPI Description Unit
Average change
(Per month)
Specific change reduction
(percentage)
1 Total Electricity Bill € € 3,263 -29.6%
1a Electricity Bill Nashec PS € € 2,389 -29.9%
1b Electricity Bill Kojush 1 € € 786 -32.3%
1c Electricity Bill Kojush 2 € € 87 -14.3%
2 Total Direct Energy Cost (A1+A2) € € 2,449 -27.7%
2a Direct Energy Cost Nashec PS (A1+A2) € € 1,747 -27.8%
2b Direct Energy Cost Kojush 1 (A1+A2) € € 634 -31.4%
2c Direct Energy Cost Kojush 2 (A1+A2) € € 68 -12.2%
3 Total Energy Consumption kWh 47,064 -28.1%
3a Energy Consumption Nashec PS kWh 35,285 -27.9%
3b Energy Consumption Kojush 1 kWh 10,599 -31.6%
3c Energy Consumption Kojush 2 kWh 1,180 -15.7%
4a Percent Day pumping Nashec PS % 62.3% +0.1%
4b Percent Day pumping Kojush 1 % 62.5% +1.0%
4c Percent Day pumping Kojush 2 % 46.0% +6.7%
5 Total specific Energy Consumption kWh/m/m3 1.68 -28.0%
5a Specific Energy Consumption for Nashec PS kWh/m/m3 1.95
-32.5%
5b Spec. Energy Consumption Kojush 1 kWh/m/m3 1.87 -31.2%
5c Spec. Energy Consumption Kojush 2 kWh/m/m3 1.21. -20.2%
6a Maximum demand Nashec PS kW 52 -25.2%
6b Maximum demand Kojush 1 kW 25 -32.4%
7a Reactive Energy Nashec PS kVArh 0 0%
7b Reactive Energy Kojush 1 kVArh 0 0%
Table 3 shows the key results of the project. It shows the average change in KPIs in absolute
and relative values. With the energy efficiency project undertaken, a total reduction of 30% in
electricity cost and 28% in energy consumption was achieved.

Rural Water and Sanitation Support Programme
Phase VI Sozi Energy Efficiency Concept
Thematic Report – Output 2.6: Energy Efficiency
Dorsch International Consultants GmbH (Dorsch) - Community Development Initiatives (CDI)
7.3.1 KPI 1 Electricity Bill
The total electricity bill (KPI 1) of the Sozi System reduced by more than 3,000€ which is a
29.6% reduction in total energy cost. The reduction started with Kojush 1 and Kojush 2 in
February 2020, but the most significant effect occurred after the rehabilitation of the Nashec
pumping station.
Figure 20: KPI 1 – Electricity Bill.
KPI1 is the main indicator to understand the payback periods and hence if the investments
were meaningful in a financial sense. The table below gives an overview of the payback
periods of the project. The total investment costs include the equipment of pumps and motors,
pump controls and all fittings as well as installation and mobilization of the contractor. In
addition, one must keep in mind that this project not only replaced existing pumps but
included installing additional stand-by pumps.
The payback period of the total project is between 4 – 5 years. In the case that the energy
efficiency project had not been carried out under the Dorch/CDI development project, the
water utility would have to bear the costs for the necessary engineering services provided by
the development project. This effort is estimated to add an additional 15% of the contract
value which would increase the payback period to 4.7 years.
While for the Nashec and Kojush 1 pumping stations the payback period is small, the payback
periods in Kojush 2 are longer due to the small water quantities pumped and the smaller
efficiency gains achieved.

Rural Water and Sanitation Support Programme
Phase VI Sozi Energy Efficiency Concept
Thematic Report – Output 2.6: Energy Efficiency
Dorsch International Consultants GmbH (Dorsch) - Community Development Initiatives (CDI)
Table 4: Payback Periods of Investments.
Pump
Station
Average Savings
[€/year]
Total Investment Cost
[€]
Simple Payback Period
[years]
Nashec 28,668 104,697 3.7
Kojush 1 9,432 35,950 3.8
Kojush 2 1,044 20,225 19.4
Total 39,144 160,872 4.1
Total + 15% 39,144 185,002 4.7
7.3.2 KPI 2 Direct Energy Cost
KPI 2 is similar to KPI 1, with total savings of 27.7%. The fact that it is 2 percentage points
less shows that additional costs, i.e., maximum demand charges that are not part of electricity
consumption further reduced the electricity bill. Figure 20 shows the changes of the indicator
in the same pattern as KPI 1 and KPI 3.
Figure 21: KPI 2 – Direct Cost.

Rural Water and Sanitation Support Programme
Phase VI Sozi Energy Efficiency Concept
Thematic Report – Output 2.6: Energy Efficiency
Dorsch International Consultants GmbH (Dorsch) - Community Development Initiatives (CDI)
7.3.3 KPI 3 Energy Consumption
Similar to the total electricity bill, KPI 3 shows an overall reduction in energy consumption of
28.1 %. The data show that the savings are highest in Kojush 1 and lowest in Kojush 2. The
lower changes in Kojush 2 are due to the smaller pumps in the pumping station. Smaller
pumps and lower energy consumption give a lower potential for efficiency gains. However, a
reduction of approximately 15% still shows that the energy efficiency measures were worth
the effort at Kojush 2. Figure 21 shows that after the rehabilitation of Kojush 1 and Kojush 2 in
February 2020 small reductions are visible. The main reduction, however, is visible after the
larger energy demand Nashec pumping station was rehabilitated in May 2020.
Figure 22: KPI 3 – Electricity Consumption.
7.3.4 KPI 4 Percent Day Pumping
KPI 4 – showing the percent day-time pumping – has not significantly changed. To increase
energy cost efficiency, more water pumping must be shifted into the night and hence KPI 4
must be reduced. This would result in reduced energy costs due to the great use of the lower
night tariff. Shifting the pumping time into the night was not achieved during the project.
Previously the Sozi System relied on 24/7 pumping and shifting pumping into the night was
not possible. A significant reduction in non-revenue water demands would reduce the overall
pumping requirement, and hence would open up the possibility to shift more pumping into the
night period. However, non-revenue water has not yet been reduced by a significant amount.
Therefore, the task of reducing non-revenue water and then shifting the remaining pumping
time into the lower electricity night-time remains a key cost reduction opportunity for the 2nd
stage of the project.

Rural Water and Sanitation Support Programme
Phase VI Sozi Energy Efficiency Concept
Thematic Report – Output 2.6: Energy Efficiency
Dorsch International Consultants GmbH (Dorsch) - Community Development Initiatives (CDI)
Activities in this regard can then be monitored with KPI 4. Figure 23 shows that the day
pumping did not change for Nashec and Kojush 2 and remains stable at 62% (i.e., 15 of the
24 hours per day). Kojush 2 pumps more during the day since the rehabilitation. This trend
must be reversed, and pumping should be shifted back into the night-time.
Figure 23: KPI 4 – Percentage of Day-time Pumping.
7.3.5 KPI 5 Specific Energy Consumption
The specific energy consumption (KPI 5) could not be monitored before the rehabilitation
period and hence no comparison is possible. However, when the data from the energy
efficiency test (chapter 6.1) is used the reduction in specific energy consumption is
approximately 30% and therefore well in line with the energy and cost reductions. For the
future operation of the Sozi system, this indicator will enable the Sozi system to be compared
the results to other water pumping stations. Figure 24 shows that after rehabilitation the
indicator is stable at around 4-5 Wh/m/m3.

Rural Water and Sanitation Support Programme
Phase VI Sozi Energy Efficiency Concept
Thematic Report – Output 2.6: Energy Efficiency
Dorsch International Consultants GmbH (Dorsch) - Community Development Initiatives (CDI)
Figure 24: KPI 5 – Specific Energy Consumption.
Additional useful information in addition to KPI 5 is the pumping cost per cubic meter of water
pumped. Table 5 indicates first the kWh that are consumed per cubic meter for each pumping
station. It furthermore shows the cost per kWh and then the average specific transport cost of
water in €cent per cubic meter for each pumping station. The difference per pumping station
depends on the transported vertical distance, the efficiency of the pumps and the specific
energy cost per kWh.
Table 5: Specific Energy Consumption and Cost per Pumping Station.
Nashec - Kobaj
Nashec - Kojush1
Kojush 1 - Kojush 2
Kojush 2 - Planea
Average Specific Energy Consumption [kWh/m3]
0.71 0.69 0.43 0.90
Average specific energy cost [€cent/kWh] 6.285 6.285 7.279 8.391
Average specific transport cost [€cent/m3] 4.460 4.340 3.130 7.550

Rural Water and Sanitation Support Programme
Phase VI Sozi Energy Efficiency Concept
Thematic Report – Output 2.6: Energy Efficiency
Dorsch International Consultants GmbH (Dorsch) - Community Development Initiatives (CDI)
Depending on where different villages are located, the water passes through more than one
pumping station and hence the total water transport (pumping) cost to each village is different.
Table 6 gives an overview of the energy (kWh) and cost (€cent) for each cubic meter of water
supplied to the village in question. Based on this information, the cost of non-revenue water or
specific leak events can be calculated. The cheapest transport cost per m3 is for the villages
located in the Gorica DMA (Kobaj side) and the houses fed directly from the Kojush 1
reservoir, while the water that passes through three pumping stations into the Planea DMA is
three times the cost per m3.
Table 6: Specific Energy Consumption and Transport Cost per Village.
Village kWh/m3 €cent/m3
Kobaj 0.71 4.46
Tupec 0.71 4.46
Nashec 0.71 4.46
Atmaxhë 0.71 4.46
Grazhdanik 0.71 4.46
Mazrek 1.12 7.47
Kojush 1.12 7.47
Gjonaj 1.12 7.47
Gorozhup 2.02 15.02
Milaj 2.02 15.02
Planea 2.02 15.02
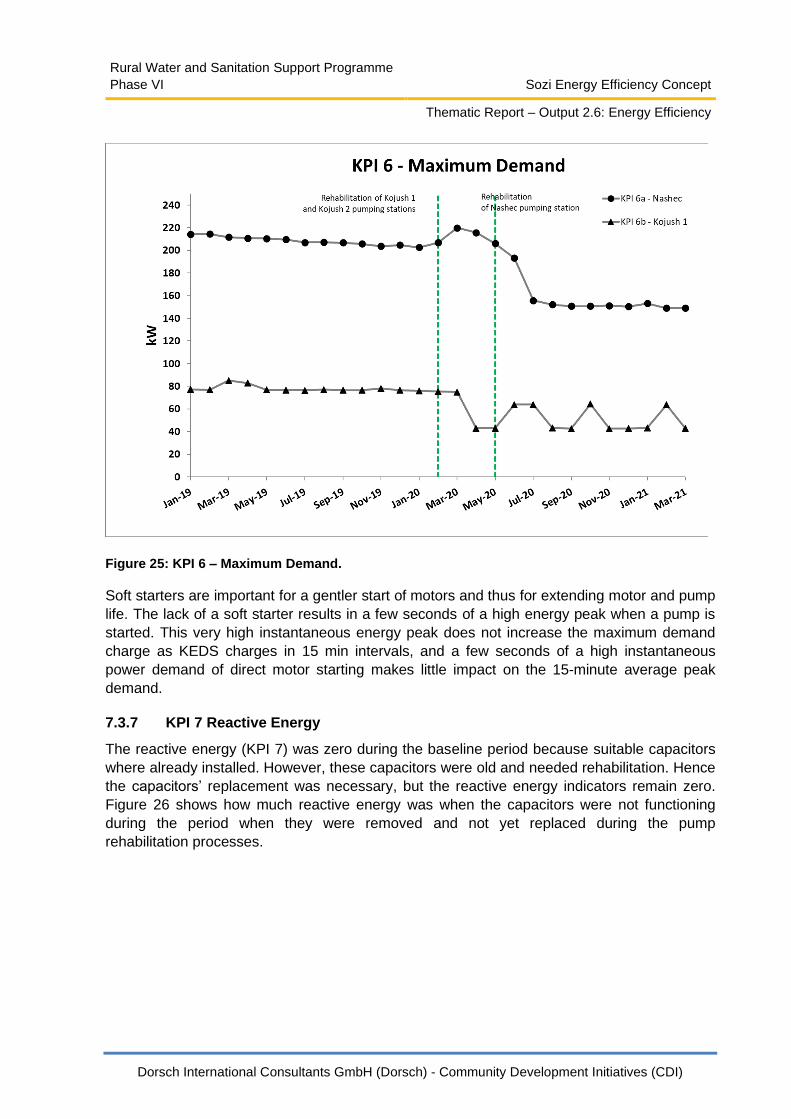
7.3.6 KPI 6 Maximum Demand
The newly installed pump-motor sets are significantly more efficient than the older pump-
motor sets that were replaced, and therefore are of lower rated power. The new lower power
pump-motor sets lead to a reduced maximum demand (KPI 6). Figure 25 shows how the
maximum demand dropped significantly. For Kojush 1 the indicator in some months is high.
This occurs when the third (stand-by pump) is also turned on. Even if three pumps are turned
on for only 15 min the maximum demand goes up. Hence, this should be avoided. For Kojush
2 no maximum demand charge is applicable on the particular tariff used.
Rural Water and Sanitation Support Programme
Phase VI Sozi Energy Efficiency Concept
Thematic Report – Output 2.6: Energy Efficiency
Dorsch International Consultants GmbH (Dorsch) - Community Development Initiatives (CDI)
Figure 25: KPI 6 – Maximum Demand.
Soft starters are important for a gentler start of motors and thus for extending motor and pump
life. The lack of a soft starter results in a few seconds of a high energy peak when a pump is
started. This very high instantaneous energy peak does not increase the maximum demand
charge as KEDS charges in 15 min intervals, and a few seconds of a high instantaneous
power demand of direct motor starting makes little impact on the 15-minute average peak
demand.
7.3.7 KPI 7 Reactive Energy
The reactive energy (KPI 7) was zero during the baseline period because suitable capacitors
where already installed. However, these capacitors were old and needed rehabilitation. Hence
the capacitors’ replacement was necessary, but the reactive energy indicators remain zero.
Figure 26 shows how much reactive energy was when the capacitors were not functioning
during the period when they were removed and not yet replaced during the pump
rehabilitation processes.

Rural Water and Sanitation Support Programme
Phase VI Sozi Energy Efficiency Concept
Thematic Report – Output 2.6: Energy Efficiency
Dorsch International Consultants GmbH (Dorsch) - Community Development Initiatives (CDI)
Figure 26: KPI 7 – Reactive Energy.
To understand if the investment of capacitors is reasonable, baseline data from earlier years
was used (< 2018).
At the Nashec pumping station the savings due to the installation of capacitors was
approximately 214€/month or 2,570€/year and at Kojush the savings were 198€/month or
1,176€/year.
The data in Figure 26 show that the capacitors reduced the reactive energy, and therefore its
cost, to zero. The investment costs include the equipment including installation by the
contractor. Depending on the pumping station the simple payback period is between 3.7 and
4.6 years. Nashec is the larger pumping installed capacity with larger investment costs but
even larger savings. Hence the payback period is shorter.
Table 7: Payback Period of Installing Capacitors.
Pump
Station
Average Savings
[€/year]
Total Investment Cost
[€]
Simple Payback Period
[years]
Nashec 2,570 9,600 3.7
Kojush 1 1,176 5,400 4.6

Rural Water and Sanitation Support Programme
Phase VI Sozi Energy Efficiency Concept
Thematic Report – Output 2.6: Energy Efficiency
Dorsch International Consultants GmbH (Dorsch) - Community Development Initiatives (CDI)
8 Non-Revenue Water
8.1 DMA 62 Gorica
The most problematic DMA (District Metered Area) in the Sozi System is the Gorica DMA on
the Kobaj side of the Sozi water supply system. Before the project started, the Gorica DMA
NRW level was at 82% of the applicable water supply. The project advised the RWC on the
adverse NRW trends in the Gorica DMA and proposed suitable NRW reduction activities that
were recommended to be undertaken by the RWC. However, no NRW reduction investments
were made by the RWC for this DMA during the project period. During the project period, the
Gorica NRW ratio increased to 90%. While the number of customers significantly increased
(+18%), the billed amount of water decreased (-16%). The installation of the new pump-motor
sets at the Nashec pump station to the Kobaj reservoir and the rehabilitation of the Kobaj
reservoir led to a higher availability of water to the Gorica DMA and hence increased the NRW
level. It is assumed that the increased supply to the Gorica DMA reduced water shortages that
were previously not met due to a lack of water (empty reservoir, and less water transported by
the applicable Kobaj-side pump-motor sets at the Nashec pumping station).
Figure 27: Average Daily Demand Curve for Gorica DMA.
Figure 27 shows the average daily flow curve of February 2021. It shows that there are no
apparent differences between day and night or any other daily flow patterns. The overview in
the Mini Water Balance shows a minimum night flow of 32.7 l/s which underlines the massive
losses in the Gorica DMA network. Anecdotal evidence indicates that illegal connections are
connected to private wells “filling” the wells for private use. Hence illegal connections and real
losses lead to excessive water losses in this DMA.

Rural Water and Sanitation Support Programme
Phase VI Sozi Energy Efficiency Concept
Thematic Report – Output 2.6: Energy Efficiency
Dorsch International Consultants GmbH (Dorsch) - Community Development Initiatives (CDI)
Figure 28: NRW Factsheet for Gorica DMA.

Rural Water and Sanitation Support Programme
Phase VI Sozi Energy Efficiency Concept
Thematic Report – Output 2.6: Energy Efficiency
Dorsch International Consultants GmbH (Dorsch) - Community Development Initiatives (CDI)
Bottom – Up Water Balance for Gorica DMA
Period February2021 DMA
HRJ – 62
Gorica
MNF 32.7 [l/s] 2824.2 [m3/d]
Night Use 2.2 [l/s] 190.1 [m3/d]
Real Losses 30.5 [l/s] 2634.1 [m3/d]
Mini Water Balance
System Input 34.4 [l/s] 2973.6 [m3/d] 100 [%]
Billed Consumption 3.9 [l/s] 339.5 [m3/d] 11 [%]
Non-Revenue Water 30.5 [l/s] 2634.1 [m3/d] 89 [%]
Administrative Losses 0.0 [l/s] 0.0 [m3/d] 0 [%]
Real Losses and
Illegal Connections
30.5 [l/s] 2634.1 [m3/d] 89 [%]
Conclusion The losses in the Gorica DMA are so high that a day/night
pattern is not visible and the MNF is at a very high level.
The main problems in the DMA are the excessive real losses
and illegal connections.
No pattern is visible, indicating very high real losses and illegal connections.
Rural Water and Sanitation Support Programme
Phase VI Sozi Energy Efficiency Concept
Thematic Report – Output 2.6: Energy Efficiency
Dorsch International Consultants GmbH (Dorsch) - Community Development Initiatives (CDI)
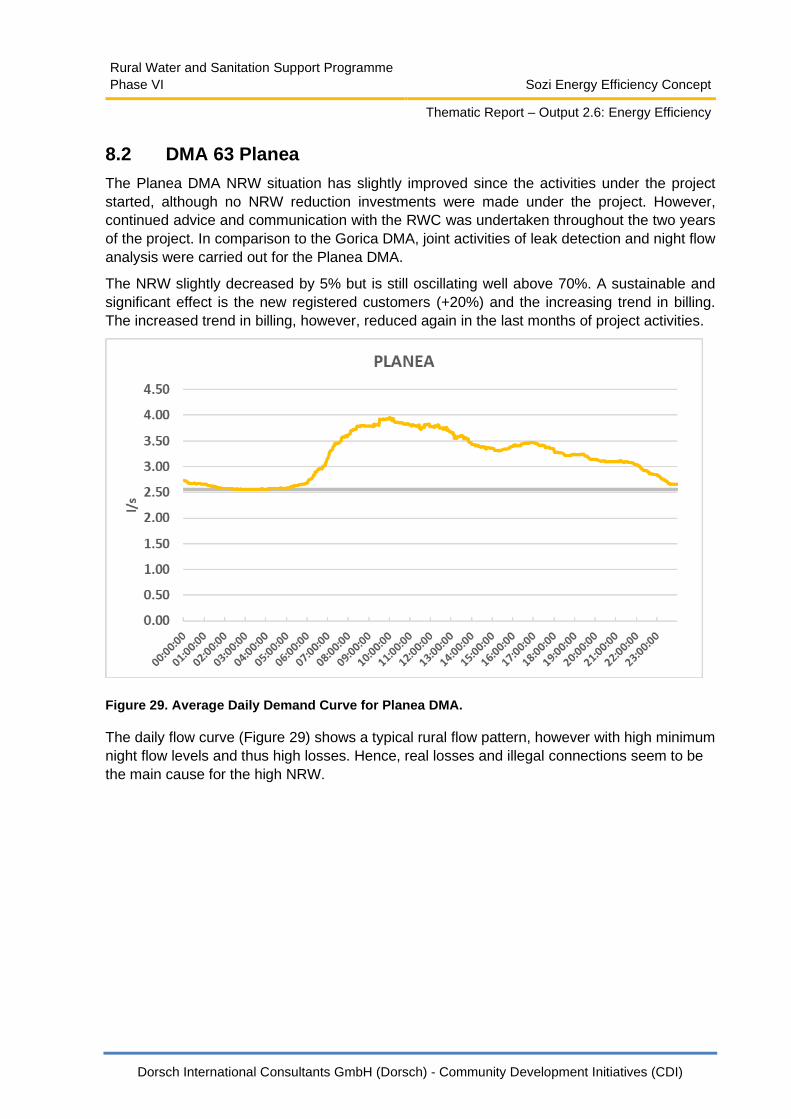
8.2 DMA 63 Planea
The Planea DMA NRW situation has slightly improved since the activities under the project
started, although no NRW reduction investments were made under the project. However,
continued advice and communication with the RWC was undertaken throughout the two years
of the project. In comparison to the Gorica DMA, joint activities of leak detection and night flow
analysis were carried out for the Planea DMA.
The NRW slightly decreased by 5% but is still oscillating well above 70%. A sustainable and
significant effect is the new registered customers (+20%) and the increasing trend in billing.
The increased trend in billing, however, reduced again in the last months of project activities.
Figure 29. Average Daily Demand Curve for Planea DMA.
The daily flow curve (Figure 29) shows a typical rural flow pattern, however with high minimum
night flow levels and thus high losses. Hence, real losses and illegal connections seem to be
the main cause for the high NRW.

Rural Water and Sanitation Support Programme
Phase VI Sozi Energy Efficiency Concept
Thematic Report – Output 2.6: Energy Efficiency
Dorsch International Consultants GmbH (Dorsch) - Community Development Initiatives (CDI)
Figure 30: NRW Factsheet for Planea DMA.

Rural Water and Sanitation Support Programme
Phase VI Sozi Energy Efficiency Concept
Thematic Report – Output 2.6: Energy Efficiency
Dorsch International Consultants GmbH (Dorsch) - Community Development Initiatives (CDI)
Bottom – Up Water Balance for Planea DMA
Period February 2021 DMA
HRJ – 63
Planea
MNF 2.6 [l/s] 223.8 [m3/d]
Night Use 0.3 [l/s] 25.9 [m3/d]
Real Losses 2.3 [l/s] 197.9 [m3/d]
Mini Water Balance
System Input 3.0 [l/s] 257.5 [m3/d] 100 [%]
Billed Consumption 0.7 [l/s] 59.6 [m3/d] 13 [%]
Non-Revenue Water 2.3 [l/s] 197.9 [m3/d] 77 [%]
Administrative Losses 0.0 [l/s] 0.0 [m3/d] 0 [%]
Real Losses and
Illegal Connections
2.3 [l/s] 197.9 [m3/d] 77 [%]
Conclusion The main component of the high NRW levels appears to be real
losses and illegal connections. NRW remains high at more than
70%.
Typical rural water supply pattern, however, with high minimum night flow levels

Rural Water and Sanitation Support Programme
Phase VI Sozi Energy Efficiency Concept
Thematic Report – Output 2.6: Energy Efficiency
Dorsch International Consultants GmbH (Dorsch) - Community Development Initiatives (CDI)
8.3 DMA 64 Gjonaj
The Gjonaj DMA NRW situation has significantly improved since the activities under the
project started. No direct investments were made by the project. However, continued advice
and communication with the RWC was made throughout the two years of the project. In
addition, the RWC, together with the Municipality, has invested in significant rehabilitation of
the network, which was finished in January 2021. The NRW reduction efforts and
rehabilitation of the network have shown appreciable results.
The NRW level reduced by 17% yet remains at around 70%. However, the RWC is on the
right track to reduce NRW levels by continuously increasing customer registration and the
amount of billing, while at the same time reducing inflow into the DMA.
Figure 31: Average Daily Demand Curve for the Gjonaj DMA.
Similar to the Gorica DMA, the Gjonaj daily water supply curve shows an undesirable pattern
indicating a high level of losses and illegal connections (See Figure 31). Anecdotal evidence
and occasional field visits indicate some illegal pipelines were “filling” wells or private
reservoirs on properties through a non-stop water flow.
This results in an extremely high minimum night flow and hence real losses that are so high
that administrative losses are within the margin of error.

Rural Water and Sanitation Support Programme
Phase VI Sozi Energy Efficiency Concept
Thematic Report – Output 2.6: Energy Efficiency
Dorsch International Consultants GmbH (Dorsch) - Community Development Initiatives (CDI)
Figure 32: NRW Factsheet for Gjonaj DMA.

Rural Water and Sanitation Support Programme
Phase VI Sozi Energy Efficiency Concept
Thematic Report – Output 2.6: Energy Efficiency
Dorsch International Consultants GmbH (Dorsch) - Community Development Initiatives (CDI)
Bottom – Up Water Balance for Gjonaj DMA
Period February2021 DMA
HRJ – 64
Gjonaj
MNF 11.7 [l/s] 1010.8 [m3/d]
Night Use 1.7 [l/s] 146.8 [m3/d]
Real Losses 10.0 [l/s] 864.0 [m3/d]
Mini Water Balance
System Input 13.9 [l/s] 1205.7[m3/d] 100 [%]
Billed Consumption 3.9 [l/s] 344.3 [m3/d] 29 [%]
Non-Revenue Water 10.0 [l/s] 864.0 [m3/d] 71 [%]
Administrative Losses 0.0 [l/s] 0.0 [m3/d] 0 [%]
Real Losses and
Illegal Connections
10.0 [l/s] 864.0 [m3/d] 71 [%]
Conclusion The losses in the Gjonaj DMA are so high that a day/night
pattern is not visible and the MNF is at a very high level.
The main problem in the Djonaj DMA appear to be the high level
of real losses and illegal connections.
After rehabilitation, a more typical supply pattern is starting to be visible.

Rural Water and Sanitation Support Programme
Phase VI Sozi Energy Efficiency Concept
Thematic Report – Output 2.6: Energy Efficiency
Dorsch International Consultants GmbH (Dorsch) - Community Development Initiatives (CDI)
8.4 DMA 65 Mazrek
The Mazrek DMA is the area in which the project had the most NRW reduction and enhanced
billing focus. The project provided not only advice but also undertook constant field visits with
RWC staff, and network rehabilitation was part of the project’s activities. As described in
Chapter 5, the entire network was rehabilitated and extended.
On the one hand this led to the registration of 29% more customers. On the other hand, billing
was almost doubled, and the water inflow was cut in half. This resulted in a NRW level of
between 12% - 20% after rehabilitation of the network in spring 2021.
This example shows that with increased efforts and investment, a significant reduction in
NRW is possible. Mazrek is a rather small DMA underlining the importance of the DMA
approach with small DMAs. The intensive focus enabled the RWC to understand where the
problems were (the Mazrek DMA had a previous NRW level of up to 90%) and to act
accordingly to significantly reduce NRW water and revenue losses.
After a few months, the on-the-ground activities of the consultant were reduced in the Mazrek
DMA. Since then, an ongoing increase in NRW levels is visible. Reasons might be new leaks
that are not fixed or the return of illegal connections. This trend shows that reducing NRW
must be a continuous effort. Each month needs ongoing effort to keep losses low. If water
utilities turn their back on DMAs after NRW reduction activities are finished, the NRW level will
start to increase again.
Figure 33: Average Daily Demand Curve for Mazrek DMA.

Rural Water and Sanitation Support Programme
Phase VI Sozi Energy Efficiency Concept
Thematic Report – Output 2.6: Energy Efficiency
Dorsch International Consultants GmbH (Dorsch) - Community Development Initiatives (CDI)
Figure 34: NRW Factsheet for Mazrek DMA

Rural Water and Sanitation Support Programme
Phase VI Sozi Energy Efficiency Concept
Thematic Report – Output 2.6: Energy Efficiency
Dorsch International Consultants GmbH (Dorsch) - Community Development Initiatives (CDI)
Bottom – Up Water Balance for DMA
Period February2021 DMA
HRJ – 65
Mazrek
MNF 0.9 [l/s] 82.0 [m3/d]
Night Use 0.3 [l/s] 25.9 [m3/d]
Real Losses 0.6 [l/s] 56.1 [m3/d]
Mini Water Balance
System Input 1.7 [l/s] 148.8 [m3/d] 100 [%]
Billed Consumption 0.9 [l/s] 82.0 [m3/d] 65 [%]
Non-Revenue Water 0.8 [l/s] 66.8 [m3/d] 45 [%]
Administrative Losses 0.2 [l/s] 16.1 [m3/d] 10 [%]
Real Losses and
Illegal Connections
0.6 [l/s] 50.7 [m3/d] 35 [%]
Conclusion The Mazrek NRW levels dropped significantly but then started
to steadily increase. Hence an ongoing focus on reducing real
losses, illegal connections and apparent losses is necessary.
Typical rural water supply pattern visible.

Rural Water and Sanitation Support Programme
Phase VI Sozi Energy Efficiency Concept
Thematic Report – Output 2.6: Energy Efficiency
Dorsch International Consultants GmbH (Dorsch) - Community Development Initiatives (CDI)
9 The Energy Monitoring Factsheet
As part of the capacity building activities in the energy efficiency component, an energy
monitoring factsheet was developed.
The purpose of the factsheet was to monitor all pumping stations of the Kosovo water utilities
and summarize the Key Performance Indicators (KPIs). This factsheet could then help the
RWC technical management to prioritize energy efficiency investments and monitor their
effects.
The factsheet is a simple excel tool with one input sheet “Data Entry” and one output
“Factsheet”.
Data Entry Sheet
Each month, the pumping station data must be entered in 13 columns. Most of the data is
based on the electricity bill and includes the number shown in Figure 35. In addition to the
electricity bill data, the average pressure of the pumping station and the water production
must be entered. The screenshot of Figure 35 shows the data entry sheet.
All calculations of indicators are automatically done in the background.
Figure 35: Screenshot of Data Entry Sheet.
Factsheet
The factsheet consists of 5 pages that can be printed as a PDF. The factsheet is shown in the
Annex while the first page is shown in Figure 36.
In the upper grey area, the (i) pumping station, (ii) water utility and (iii) unit are entered and
hence one excel-sheet is created for each pumping station.
The user can then choose between a baseline period and an evaluation period. This gives the
user the possibility to compare two periods (e.g., before and after investments) to calculate
the savings. If no comparison is to be made (e.g., because no investments were made), both
periods should be set to the same Start and End.
In addition, the user further has the possibility to choose the Start and End of the data shown
in the diagram.
Based on these entries, the factsheet produces a table with the results of the seven KPIs for
the chosen periods.

Rural Water and Sanitation Support Programme
Phase VI Sozi Energy Efficiency Concept
Thematic Report – Output 2.6: Energy Efficiency
Dorsch International Consultants GmbH (Dorsch) - Community Development Initiatives (CDI)
The user can then save the factsheet including all diagrams as a PDF with one simple click.
English and Albanian can be chosen as the applicable language.
The bottom part of the factsheet shows a short explanation of each KPI for the reader of the
factsheet. On further pages, the user can manually enter an interpretation of the data and
recommendations to the management and print the factsheet.
This Energy Evaluation Factsheet has been sent to all water utilities participating under the
programme.
It is recommended that energy engineers of the water utilities implement such a sheet for
each pumping station and enter the data monthly. Also, data from the past can be entered.
Based on 12 months of data, engineers can then interpret the data and formulate investment
recommendations to technical and general management at the water utility.

Rural Water and Sanitation Support Programme
Phase VI Sozi Energy Efficiency Concept
Thematic Report – Output 2.6: Energy Efficiency
Dorsch International Consultants GmbH (Dorsch) - Community Development Initiatives (CDI)
Figure 36: First Page of Energy Monitoring Factsheet.

Rural Water and Sanitation Support Programme
Phase VI Sozi Energy Efficiency Concept
Thematic Report – Output 2.6: Energy Efficiency
Dorsch International Consultants GmbH (Dorsch) - Community Development Initiatives (CDI)
Figure 37: Second Page of Energy Monitoring Factsheet.

Rural Water and Sanitation Support Programme
Phase VI Sozi Energy Efficiency Concept
Thematic Report – Output 2.6: Energy Efficiency
Dorsch International Consultants GmbH (Dorsch) - Community Development Initiatives (CDI)
10 Recommendations and Lessons Learned
10.1 Recommendations for 2nd Stage Sozi System Renovations
The 1st stage project in the Sozi water supply system achieved significant energy efficiency
gains of around 30% by replacing the system’s old and inefficient pumps and motors with the
highest efficiency available modern pumps and motors.
However, a much larger energy and energy cost potential remains for the 2nd Stage when the
current extremely high levels of non-revenue water (NRW) are reduced.
The work on the Mazrek DMA network rehabilitation and extension reduced its NRW level
from 90% to initially 20% and simultaneously doubled household water supply billing. The
halving of water supply then enabled further cost reductions from enhanced water supply
being in the lower tariff night period.
So halving water pumping costs and doubling billing (water supply revenue) should be the
target in the 2nd Stage work for the Sozi water supply system.
Therefore, the following recommendations are given for the 2nd Stage Sozi System
renovations.
➢ Shift pumping into the night
o Continue demand reduction – in particular through rehabilitation of the Gjonaj
water supply network as that is the largest and most readily reducible source of
excessive NRW and this will reduce pump operation hours and hence
energy costs.
o Continue monitoring administrative and real losses and take prompt, strong
and ongoing corrective action to keep NRW down to a very low level of around
20% and billing and payment up to nearly 100%.
o Put the existing Gjonaj reservoir into operation to increase storage.
o Increase buffer reservoir capacities.
o Reduction in NRW and increased storage will lead to less pump operating
hours and a shift to pumping into the lower tariff night-time.
o Monitor results with KPI 4
The NRW level in the Gorica DMA on the Kobaj side of the Sozi system is close to 90%, and
the NRW on the Hasi side of the Sozi system is above 70%. Significant amounts of this NRW
are real losses. Reducing real losses will reduce energy costs. Reducing apparent losses will
increase revenues. A halving of water supply with a simultaneous doubling of revenue has
been proved to be possible with the Mazrek DMA rehabilitation undertaken in Stage 1.
➢ Reduce Non-Revenue Water and save money
o Make the fast detection and repair of new leaks through monitoring flows
through the use of data loggers a routine and high priority RWC activity

Rural Water and Sanitation Support Programme
Phase VI Sozi Energy Efficiency Concept
Thematic Report – Output 2.6: Energy Efficiency
Dorsch International Consultants GmbH (Dorsch) - Community Development Initiatives (CDI)
o Undertake regular leak detection campaigns, especially in the Gorica DMA and
in all water transmission pipelines.
o Have a strong ongoing effort to promptly detect and disconnect illegal
connections
o Have a strong focus on enhanced metering/billing/payment
10.2 Recommendations for Energy Efficiency for RWC
Hidroregjoni Jugor
Based on the learnings of this project, the following activities are recommended to be
undertaken in all other pumping stations of the Hidroregjioni Jugor RWC.
➢ Conduct energy audits of all pumping stations incl. pump efficiency tests
➢ Evaluate KPIs of past 24 months in the Evaluation Sheet for all pumping
stations
➢ Consider the following activities based on energy audit and KPI results
➢ Progressively replace all old pumps and motors with the highest available
energy efficiency models
➢ Reevaluate pump sizing and replace pumps and motors where they are
oversized
➢ Evaluate the cost effectiveness of IE4 motors when pumps are replaced
➢ Progressively move water pumping to the lower electricity tariff night period
when reservoir capacity is sufficient for this
➢ Install suitable power factor correction capacitors to eliminate maximum
demand charges at all relevant pumping stations
➢ Create priority plans for progressive pump station rehabilitation.
➢ Prepare the necessary data basis to optimise pump-motor sizing.
➢ Invest in expertise for exact pump design.
10.3 Lessons learned
➢ The work undertaken by the 1st Stage Programme for the Sozi water supply
system shows that significant (around 30%) cost-effective savings in both
energy use and energy costs can be made by simply replacing pumps with the
highest available energy efficiency level motor/pumps and by fitting the
necessary power factor correction equipment.
➢ Further cost savings are possible with a greater use of night pumping when the
Gjonaj reservoir is connected to the water supply network.
➢ The installation of capacitors in relevant pumping stations is almost certainly
cost effective with short payback periods.
➢ Replacement of pumps and motors is an important part of energy efficiency
activities. Due to the high energy use for water pumping, payback periods are
often less than 10 years; especially when the original energy efficiency is not
high. Figure 38 for typical water pumping system costs shows that around 70%
is energy related, while only 13% is related to equipment purchases.

Rural Water and Sanitation Support Programme
Phase VI Sozi Energy Efficiency Concept
Thematic Report – Output 2.6: Energy Efficiency
Dorsch International Consultants GmbH (Dorsch) - Community Development Initiatives (CDI)
➢ Correct pump design is a key factor for energy efficiency activities. Investing in
expertise to recalculate pump design parameters ensures high efficiency of
pumps and reduced cost for many years in the future.
➢ The exact cost-effectiveness and magnitude of potential savings from reducing
Non-Revenue Water (NRW) losses is unknown for the Sozi system, but the
cost savings from reducing NRW in Stage 2 are expected to be even more
significant than from the replacement of pumps and motors in Stage 1. The
Stage 1 Mazrek DMA reduction of NRW from 90% to 10% while simultaneously
doubling household billing clearly shows what is possible.
➢ The circa 30% energy and cost savings achieved in the Sozi system are just
the beginning. More savings are almost certainly possible with a continued
reinvestment of energy cost savings to bring about continuous ongoing energy
cost reductions.
➢ Accurately measured data and obtaining full information on the existing
situation is necessary for delivering the maximum possible efficiency gains in
any renovation work.
➢ Soft starters are important for a gentle start of motors and thus extending motor
life. The lack of a soft starter results in a few seconds of high energy peak when
a pump is started. Contrary to common belief, this very high energy peak is not
charged for by KEDS. KEDS charges in 15 min intervals with an average of the
past 15 minutes in which a few seconds of high energy starting peaks are not
significant.
➢ Significant gains can be achieved at little cost when pump duty conditions are
closely matched to the pump load. Hence, a careful pump design will result in
higher energy efficiency during operation.
➢ Using the highest possible efficiency electric motors improves the overall
energy use efficiency and minimizes the operating cost regardless of how the
motors or pumps are subsequently used.
➢ IE4 motors is particularly good for smaller pumps as energy efficiency gains are
higher (compared to IE3 or IE2 motors) than for larger motors/pumps. The
payback period, however, must be calculated based on motor prices.
➢ Using the provided KPIs and the KPI Evaluation sheet will help RWCs to
monitor water pumping systems and adjust operations to further increase
energy efficiency.
➢ KPIs further help to compare different systems of a water utility and serve as a
decision support step for rehabilitation measures.
➢ The RWC for the Sozi system was very aware of the high cost that they pay to
cover energy costs. The investments made by the project to reduce energy
costs were highly valued by the RWC and as a result, communication and
cooperation regarding this component of the program have been easy and
smooth. The project has always received a positive response to every request
or suggestion made to the RWC.

Rural Water and Sanitation Support Programme
Phase VI Sozi Energy Efficiency Concept
Thematic Report – Output 2.6: Energy Efficiency
Dorsch International Consultants GmbH (Dorsch) - Community Development Initiatives (CDI)
Figure 38: Typical Annual Costs of a Pumping System.
Source: https://empoweringpumps.com/managing-life-cycle-costs-of-pumping-systems-henri-azibert/

Rural Water and Sanitation Support Programme
Phase VI Sozi Energy Efficiency Concept
Thematic Report – Output 2.6: Energy Efficiency
Dorsch International Consultants GmbH (Dorsch) - Community Development Initiatives (CDI)
Annex 1: Name Plates of New Pumps and Motors
Figure 39: Pump and Motor Name Plate for Nashec PS to Kojush 1

Rural Water and Sanitation Support Programme
Phase VI Sozi Energy Efficiency Concept
Thematic Report – Output 2.6: Energy Efficiency
Dorsch International Consultants GmbH (Dorsch) - Community Development Initiatives (CDI)
Figure 40: Pump and Motor Name Plates for Nashec PS to Kobaj

Rural Water and Sanitation Support Programme
Phase VI Sozi Energy Efficiency Concept
Thematic Report – Output 2.6: Energy Efficiency
Dorsch International Consultants GmbH (Dorsch) - Community Development Initiatives (CDI)
Figure 41: Pump and Motor Name Plates for Kojush 1 PS to Kojush 2

Rural Water and Sanitation Support Programme
Phase VI Sozi Energy Efficiency Concept
Thematic Report – Output 2.6: Energy Efficiency
Dorsch International Consultants GmbH (Dorsch) - Community Development Initiatives (CDI)
Figure 42: Pump and Motor Names Plate for Kojush 2 PS to Planea