Embed Size (px)
Citation preview

Multi-Period Excess Earnings Method
Southeast Chapter of Business AppraisersSeptember 19-20, 2014
Presented By:Bob Morrison, ASA BV/IA
Morrison Valuation & Forensic Services, LLC
1

2
“In God we trust.
All others must bring data.”-W. Edwards Deming

3
Objectives• Understand premise of MPEEM• Identify assets for which MPEEM may apply• Identify key assumptions and inputs• Understand the attrition analysis• Understand role of contributory assets• Identify an appropriate discount rate • Understand the purpose of the
IRR/WACC/WARA reconciliation

4
• Start with the income from all assets combined
• Peel back the income from all other assets leaving only income generated by the subject asset
• Value the residual or “excess” earnings• Original model developed in the 1920s
Premise

5
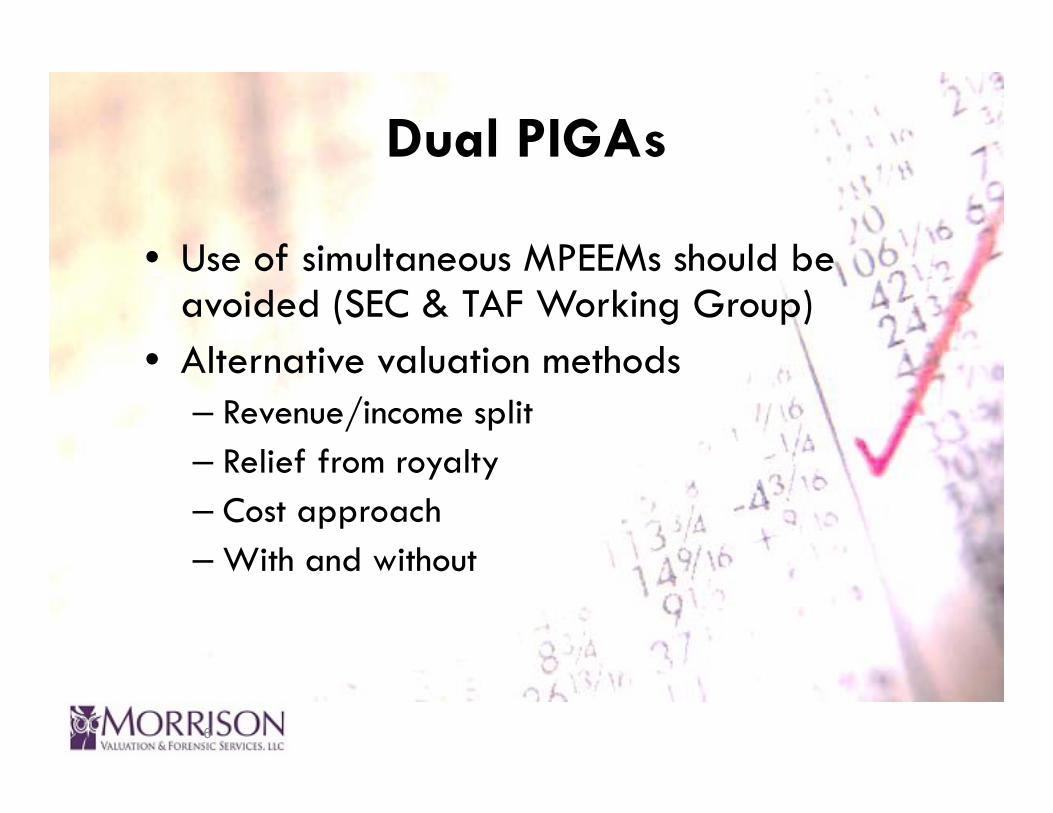
• PIGA: Primary income generating asset• Dual PIGAs:
Applicable Assets
Customers and/or
TechnologyCustomers
Technology Goodwill
TechnologyExisting New
Custom
ers
New
Existing
6
• Use of simultaneous MPEEMs should be avoided (SEC & TAF Working Group)
• Alternative valuation methods– Revenue/income split– Relief from royalty– Cost approach– With and without
Dual PIGAs

7
Key Assumptions and Inputs• Projected revenue from acquired asset• Attrition rate• Profitability of the asset• Contributory asset charges• Life of the asset• Discount rate

8
Projected Revenue• Base year revenue• What growth rate to use: different than the
consolidated growth rate?• May require stratification (customer mix or
product mix)

9
Attrition• Loss of customers over time• Constant attrition rate method (CAM)
– Likelihood of loss is independent of the age of the relationship
• Variable attrition rate method (VAM)– Likelihood of loss is age-dependent– More rigorous analysis
• Challenge: Data

10
Attrition• Factors that affect attrition
– Length of relationship– Switching costs– Porter’s Five Forces
• Product/service differentiation; substitutes• Competitive rivalry• Barriers to entry• Customers’ bargaining power• Suppliers’ bargaining power

11
Attrition• Attrition rate considerations
– Basis: dollars or number of customers?– Historical experience versus market participant
expectations
• Grouping of customers– Age of relationship– Annual revenues– Type of product/service

12
Attrition• Attrition rate calculations – CAM
Historical Revenue by Customer
TTM ‐4 TTM ‐3 TTM ‐2 TTM ‐1 TTM
Customer 1 $ 1,000 $ 1,100 $ 1,210 $ 500
Customer 2 100 50 50
Customer 3 250 250 250 ‐
Customer 4 200 210 220
Customer 5 250 200 150 100 50
Customer 6 500 400
Customer 7 250 500 750 1,000 1,250
Customer 8 300 250 300 300
Customer 9 250 250 250 250 250
Customer 10 500 600 700
Total revenues $ 2,000 $ 2,700 $ 3,610 $ 3,460 $ 3,220
yr/yr growth 35.0% 33.7% ‐4.2% ‐6.9%
CAGR to 20x5 12.6% 6.0% ‐5.6% ‐6.9%
Customer count 5 7 9 8 9

13
Attrition• Attrition rate calculations – CAM
Historical Revenue by Customer
20x1 20x2 20x3 20x4 20x5
Customer 1 $ 1,000 $ 1,100 $ 1,210 $ 500
Customer 2 100 50 50
Customer 3 250 250 250 ‐
Customer 4 200 210 220
Customer 5 250 200 150 100 50
Customer 6 500 400
Customer 7 250 500 750 1,000 1,250
Customer 8 300 250 300 300
Customer 9 250 250 250 250 250
Customer 10 500 600 700
Total revenues $ 2,000 $ 2,700 $ 3,610 $ 3,460 $ 3,220
yr/yr growth 35.0% 33.7% ‐4.2% ‐6.9%
CAGR to 20x5 12.6% 6.0% ‐5.6% ‐6.9%
Customer count 5 7 9 8 9
Retained # of Customers
TTM ‐4, ‐3 TTM ‐3, ‐2 TTM ‐2, ‐1 TTM ‐1, TTM TTM ‐4, TTM
Customer 1 1 1 1 0 0
Customer 2 0 1 0 0 0
Customer 3 1 1 0 0 0
Customer 4 0 0 1 1 0
Customer 5 1 1 1 1 1
Customer 6 0 0 0 1 0
Customer 7 1 1 1 1 1
Customer 8 0 1 1 1 0
Customer 9 1 1 1 1 1
Customer 10 0 0 1 1 0
Total retained customers 5 7 7 7 3
% retained customers 100% 100% 78% 88% 33%
Compounded annual attrition rate 12%
Compounded annual retention rate 88%

14
Attrition• Attrition rate calculations – CAM
Historical Revenue by Customer
20x1 20x2 20x3 20x4 20x5
Customer 1 $ 1,000 $ 1,100 $ 1,210 $ 500
Customer 2 100 50 50
Customer 3 250 250 250 ‐
Customer 4 200 210 220
Customer 5 250 200 150 100 50
Customer 6 500 400
Customer 7 250 500 750 1,000 1,250
Customer 8 300 250 300 300
Customer 9 250 250 250 250 250
Customer 10 500 600 700
Total revenues $ 2,000 $ 2,700 $ 3,610 $ 3,460 $ 3,220
yr/yr growth 35.0% 33.7% ‐4.2% ‐6.9%
CAGR to 20x5 12.6% 6.0% ‐5.6% ‐6.9%
Customer count 5 7 9 8 9
Retained # of Customers
20x1‐20x2 20x2‐20x3 20x3‐20x4 20x4‐20x5 20x1‐20x5
Customer 1 1 1 1 0 0
Customer 2 0 1 0 0 0
Customer 3 1 1 0 0 0
Customer 4 0 0 1 1 0
Customer 5 1 1 1 1 1
Customer 6 0 0 0 1 0
Customer 7 1 1 1 1 1
Customer 8 0 1 1 1 0
Customer 9 1 1 1 1 1
Customer 10 0 0 1 1 0
Total retained customers 5 7 7 7 3
% retained customers 100% 100% 78% 88% 33%
Compounded annual attrition rate 12%
Compounded annual retention rate 88%
Retained Customer Revenues
TTM ‐4, ‐3 TTM ‐3, ‐2 TTM ‐2, ‐1 TTM ‐1, TTM TTM ‐4, TTM
Customer 1 $ 1,000 $ 1,100 $ 1,210 $ ‐ $ ‐
Customer 2 ‐ 100 ‐ ‐ ‐
Customer 3 250 250 ‐ ‐ ‐
Customer 4 ‐ ‐ 200 210 ‐
Customer 5 250 200 150 100 50
Customer 6 ‐ ‐ ‐ 500 ‐
Customer 7 250 500 750 1,000 1,250
Customer 8 ‐ 300 250 300 ‐
Customer 9 250 250 250 250 250
Customer 10 ‐ ‐ 500 600 ‐
Total retained customers $ 2,000 $ 2,700 $ 3,310 $ 2,960 $ 1,550
% retained customer revenue 100% 100% 92% 86% 78%
Compounded annual attrition rate 6%
Compounded annual retention rate 94%

15
Attrition• Attrition rate calculations – VAM
– Exponential distributions– Weibull distributions– Iowa curves– Requires a significant amount of data to be
valid

16
Profitability of the Asset• Realistically, rarely does the subject asset
have the exact same profitability as the business enterprise
• New customer acquisition costs vs. existing customer retention costs– Marketing costs– Use of assets– Management attention

17
Contributory Assets • Typical contributory assets
– Operating working capital– Tangible assets– Identifiable intangible assets– Workforce in place
• Contributory asset charges– Return of vs. return on assets– Loads the subject asset’s income with cost for
use of the other assets

18
Contributory Assets• Calculation of contributory asset charge
TTM TTM +1 TTM +2 TTM +3 TTM +4 TTM +5
Total projected revenue $ 3,220 $ 3,542 $ 3,808 $ 3,998 $ 4,198 $ 4,324 yr/yr growth 10.0% 7.5% 5.0% 5.0% 3.0%
Acquired customer revenues $ 3,220 $ 3,381 $ 3,516 $ 3,621 $ 3,730 $ 3,842 yr/yr growth 5.0% 4.0% 3.0% 3.0% 3.0%
Retained customers and revenue (mid year) 94.0% 82.7% 72.8% 64.1% 56.4%
Revenue from acquired customers $ 3,178 $ 2,908 $ 2,636 $ 2,391 $ 2,167 % of total revenue 89.7% 76.4% 65.9% 57.0% 50.1%
Fixed asset contributory charges (return on):Beginning balance $ 345 $ 350 $ 355 $ 360 $ 365 Capital expenditures 70 70 70 70 70 Economic depreciation (65) (65) (65) (65) (65)Ending balance $ 350 $ 355 $ 360 $ 365 $ 370
Average balance $ 348 $ 353 $ 358 $ 363 $ 368 Contributing asset cost of capital 5.0% 5.0% 5.0% 5.0% 5.0%
Return on 100% of contributing asset $ 17 $ 18 $ 18 $ 18 $ 18 % of contributing assets used by subject asset 89.7% 76.4% 65.9% 57.0% 50.1%
Contributory asset charge $ 15 $ 14 $ 12 $ 10 $ 9

19
Contributory Assets• Life of the asset – how many periods
Total Projected Revenue
Revenue from Acquired Customers %
TTM +1 $ 3,542 $ 3,178 89.7%TTM +2 3,808 2,908 76.4%TTM +3 3,998 2,636 65.9%TTM +4 4,198 2,391 57.0%TTM +5 4,324 2,167 50.1%TTM +6 4,454 1,963 44.1%TTM +7 4,588 1,271 27.7%TTM +8 4,726 1,015 21.5%TTM +9 4,868 811 16.7%TTM +10 5,014 646 12.9%TTM +11 5,164 585 11.3%TTM +12 5,319 531 10.0%TTM +13 5,479 481 8.8%TTM +14 5,643 437 7.7%TTM +15 5,812 397 6.8%TTM +16 5,986 360 6.0%TTM +17 6,166 325 5.3%

20
Discount Rate• Earnings versus cash flow• Asset/risk hierarchy

21
Discount Rate• Asset/Risk Hierarchy
DebtNWC
TangibleAssets
Identifiable IntangibleAssets
Equity
Residual
Net Assets Invested Capital0%
40%
Asset R
equired Re
turn
0%
40%
Cost of Capital

22
Discount Rate• Asset/Risk Hierarchy
0%
40%
Asset R
equired Re
turn
0%
40%
Cost of Capital
WARA WACC=
Subject A
sset? Subject Asset?

23
Discount Rate• Risk in the customer relationship asset
– Low switching costs– Low product/service differentiation– Low barriers to entry– High customer purchasing power– Customer concentration– High competitive rivalry

24
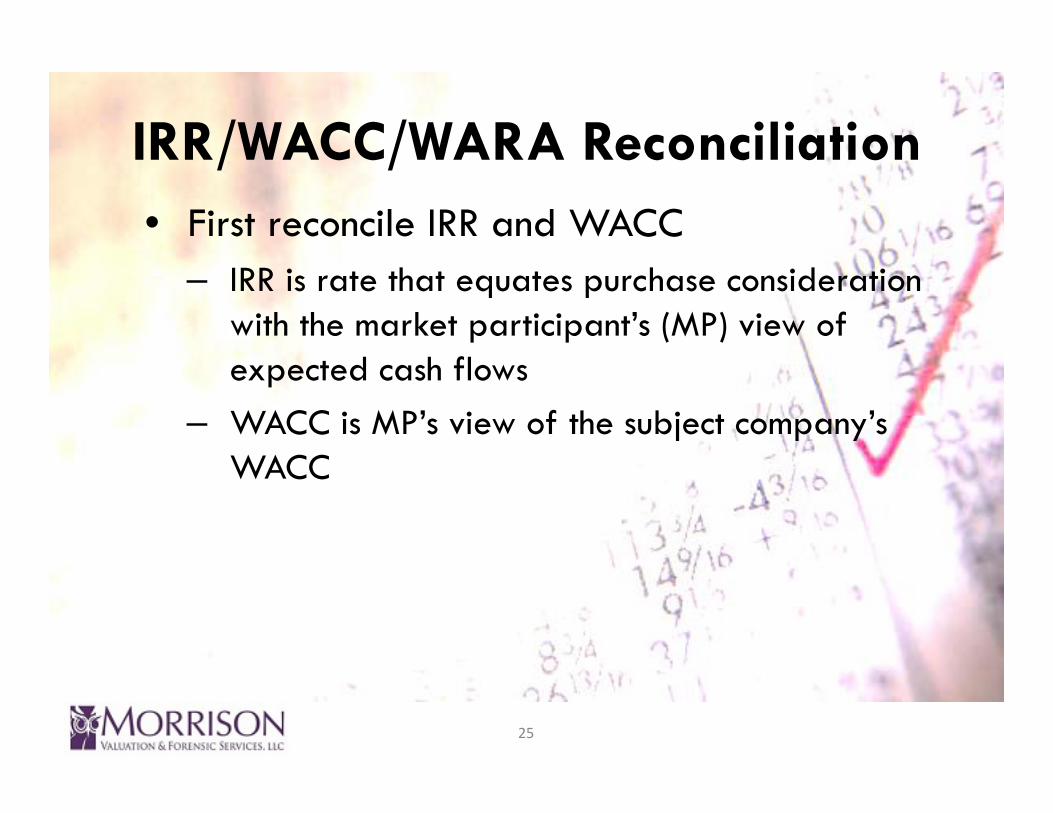
IRR/WACC/WARA Recon• IRR Cash flows• WACC Capital• WARA Assets
• Why is reconcilliation important?– May highlight asset cost of capital issues– May highlight allocation issues
25
IRR/WACC/WARA Reconciliation• First reconcile IRR and WACC
– IRR is rate that equates purchase consideration with the market participant’s (MP) view of expected cash flows
– WACC is MP’s view of the subject company’s WACC

26
IRR/WACC/WARA Reconciliation• If IRR > WACC
– Optimistic cash flows– Unique synergies in cash flows– Bargain purchase– Inadequate risk assessment in WACC
• If WACC > IRR– Opposite to above

27
IRR/WACC/WARA Reconciliation• Fair (market) value: IRR = WACC = WARA• What happens when WARA < WACC?• What happens when WARA > WACC?
• Reconciliation of IRR/WACC to WARA is iterative…

28
IRR/WACC/WARA Reconciliation
Fair (Market) Value % of Total Return on Asset
Weighted Return on Asset
Operating working capital $ 500 12.0% 3.0% 0.36%
Tangible assets 1,000 24.1% 8.0% 1.93%
Customer relationships 1,500 36.1% 20.0% 7.22%
Trade name 50 1.2% 20.0% 0.24%
Workforce 100 2.4% 20.0% 0.48%
Subtotal 3,150 10.23%
SOLVE
Goodwill 1,000 24.1% 40.5% 9.77% (20.00% ‐ 10.23%)
Total assets $ 4,150 100.0% 20.00%
WACC = IRR 20.00%
Cost of equity 25.00%
Cost of debt 3.00%

29
IRR/WACC/WARA Reconciliation
Fair (Market) Value % of Total Return on Asset
Weighted Return on Asset
Operating working capital $ 500 12.0% 3.0% 0.36%
Tangible assets 1,000 24.1% 8.0% 1.93%
Customer relationships 1,500 36.1% 22.0% 7.94%
Trade name 50 1.2% 20.0% 0.24%
Workforce 100 2.4% 20.0% 0.48%
Subtotal 3,150 10.95%
SOLVE
Goodwill 1,000 24.1% 37.6% 9.75% (20.00% ‐ 10.95%)
Total assets $ 4,150 100.0% 20.00%
WACC = IRR 20.00%
Cost of equity 25.00%
Cost of debt 3.00%

30
Excess EarningsTTM +1 TTM +2 TTM +3 TTM +4 TTM +5
Total customer revenues $ 3,542 $ 3,808 $ 3,998 $ 4,198 $ 4,324
Acquired customer revenues $ 3,381 $ 3,516 $ 3,621 $ 3,730 $ 3,842 Retention rate 60.0% 80.0% 48.0% 28.8% 17.3% 10.4%
Revenue from acquired customers $ 2,705 $ 1,688 $ 1,043 $ 645 $ 400 % of total revenue 76.4% 44.3% 26.1% 15.4% 9.3%
Gross profit 15.0% $ 406 $ 253 $ 156 $ 97 $ 60 Operating costs 5.0% (135) (84) (52) (32) (20)Trade name 2.0% (54) (34) (21) (13) (8)Depreciation (50) (29) (17) (10) (6)
EBIT $ 167 $ 106 $ 66 $ 42 $ 26 Taxes 40.0% (67) (42) (26) (17) (10)
NOPAT $ 100 $ 64 $ 40 $ 25 $ 16 Contributory asset charges:Working capital (10) (6) (4) (2) (1)Fixed assets (13) (8) (5) (3) (2)Non‐compete (8) (4) ‐ ‐ ‐Workforce (5) (3) (2) (1) (1)
Excess earnings $ 64 $ 43 $ 29 $ 19 $ 12

31
Resources• Identification of Contributory Assets and Calculation of
Economic Rents: Toolkit. The Appraisal Foundation, 2010. • Best Practices for Valuations in Financial Reporting:
Intangible Asset Working Group – Contributory Assets. The Appraisal Foundation, 2010.
• ASA BV301: Valuation of Intangible Assets. American Society of Appraisers.
• ASA BV302: Special Topics in the Valuation of Intangible Assets. American Society of Appraisers.

32
Objectives• Understand premise of MPEEM• Identify assets for which MPEEM may apply• Identify key assumptions and inputs• Understand the attrition analysis• Understand role of contributory assets• Identify an appropriate discount rate • Understand the purpose of the
IRR/WACC/WARA reconciliation