Embed Size (px)
Citation preview

South Ayrshire Community Health Partnership
Summary of key SOA health priority information – September
2012

High level indicator% of babies exclusively breastfed at 6-8 week review as a % of all
babies receiving a 6-8 week review
Source: ISD Scotland, sent by e-mail-June 2012 Notesp = provisional

High level indicatorb) % of babies exclusively breastfed at 6-8 week review as a % of all babies
receiving a 6-8 week review for the Regeneration Areas
Source: ISD Scotland, by e-mail-June 2012 Notesp= provisionalDeprivation data are derived from postcodes which fall within the 15% most deprived datazones, based on the SIMD 2009
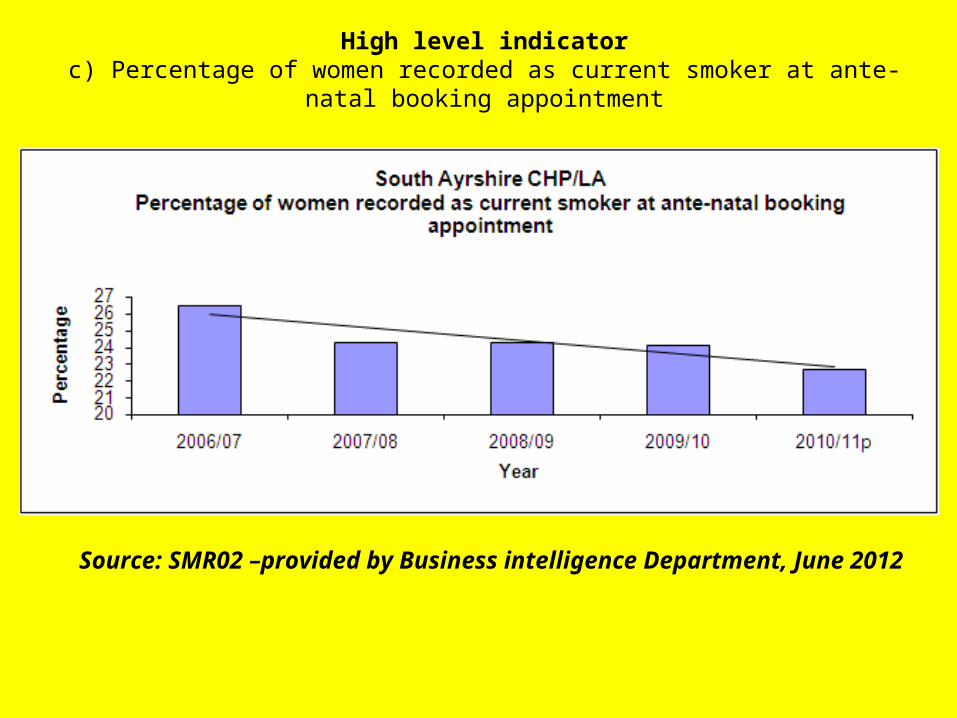
High level indicatorc) Percentage of women recorded as current smoker at ante-natal booking
appointment
Source: SMR02 –provided by Business intelligence Department, June 2012

High level indicator% of overweight or obese children a) P1
Source: ISD Scotland Childhood BMI Statistics, June 2012

High level indicatorLi12d(2) Number of hospital admissions as a result of unintentional injuries
for a) children (<15 years)
Source: ISD Scotland website June 2012

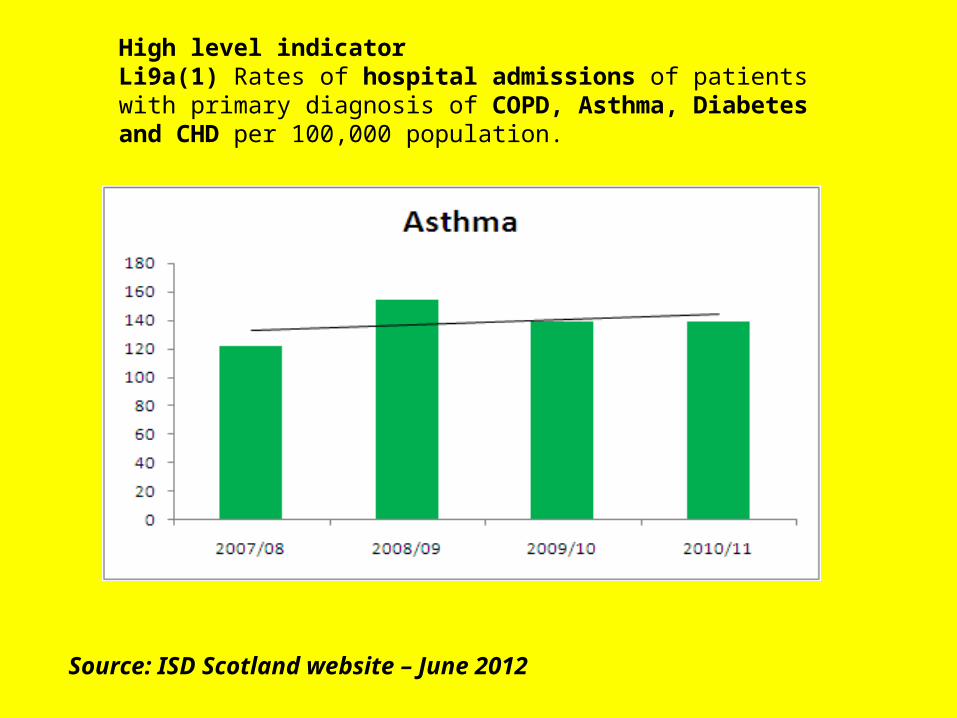
High level indicatorLi9a(1) Rates of hospital admissions of patients with primary diagnosis of
COPD, Asthma, Diabetes and CHD per 100,000 population.
Source: ISD Scotland website – June 2012
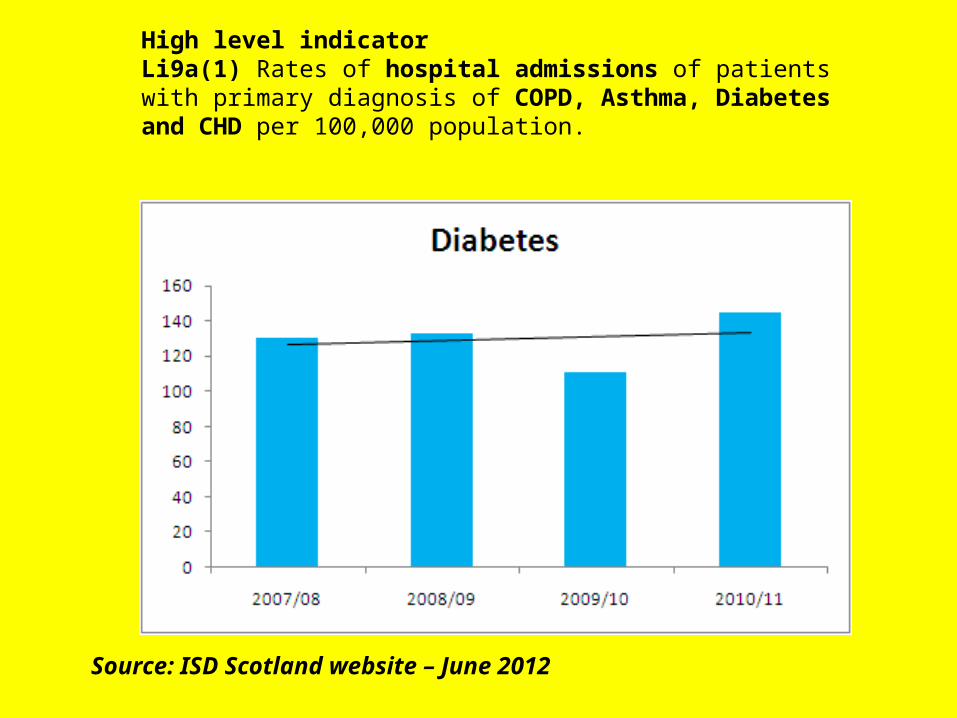
High level indicatorLi9a(1) Rates of hospital admissions of patients with primary diagnosis of COPD, Asthma, Diabetes and CHD per 100,000 population.
Source: ISD Scotland website – June 2012
High level indicatorLi9a(1) Rates of hospital admissions of patients with primary diagnosis of COPD, Asthma, Diabetes and CHD per 100,000 population.
Source: ISD Scotland website – June 2012

High level indicatorLi9a(1) Rates of hospital admissions of patients with primary diagnosis of COPD, Asthma, Diabetes and CHD per 100,000 population.
Source: ISD Scotland website – June 2012

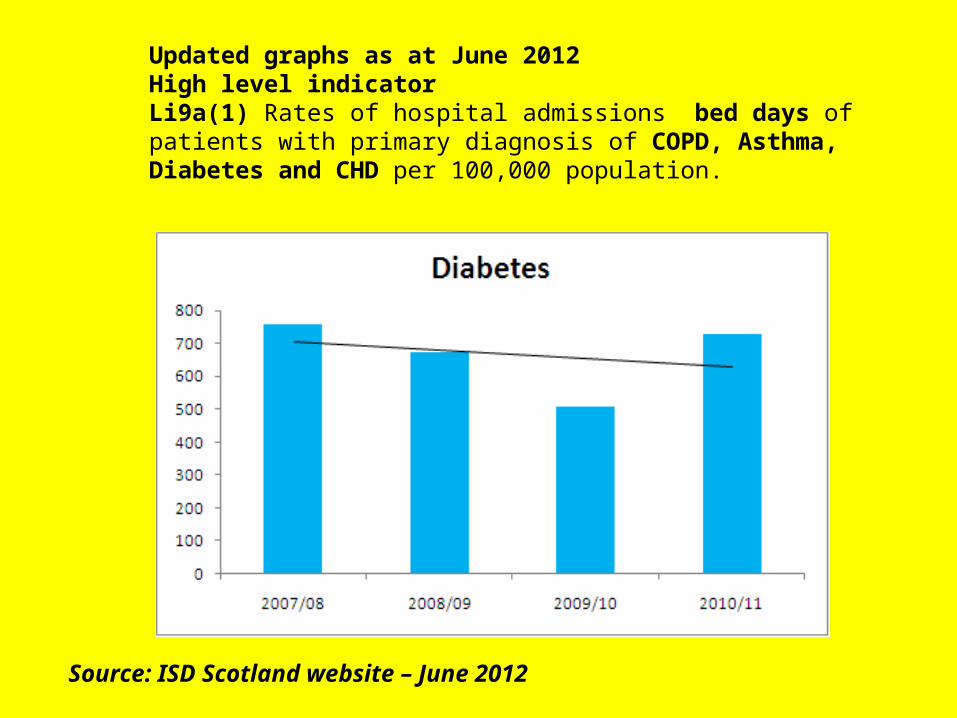
Updated graphs as at June 2012High level indicator
Li9a(1) Rates of hospital emergency admission bed days of patients with primary diagnosis of COPD, Asthma, Diabetes and CHD per 100,000
population.
Source: ISD Scotland website – June 2012

Updated graphs as at June 2012High level indicatorLi9a(1) Rates of hospital admissions bed days of patients with primary diagnosis of COPD, Asthma, Diabetes and CHD per 100,000 population.
Source: ISD Scotland website – June 2012
Updated graphs as at June 2012High level indicatorLi9a(1) Rates of hospital admissions bed days of patients with primary diagnosis of COPD, Asthma, Diabetes and CHD per 100,000 population.
Source: ISD Scotland website – June 2012

Updated graphs as at June 2012High level indicatorLi9a(1) Rates of hospital admissions bed days of patients with primary diagnosis of COPD, Asthma, Diabetes and CHD per 100,000 population.
Source: ISD Scotland website – June 2012
Source: ISD Scotland website – June 2012

Updated graph as at June 2012High level indicator
Li9b(1) Premature mortality rates in under 75s in relation to CHD (All Heart Disease)
Source: ISD Scotland website – June 2012

Updated graph as at June 2012High level indicator
Li9b(2) Life Expectancy at birth (Male)
Source: General Register Office for Scotland (June 12)

Li9b(2) Life Expectancy at birth (Female)
Li9b(2) Life Expectancy at birth (Male & Female)

Updated graph as at June 2012High level indicator
Li9e(2) Annual rate of increase in the number of daily defined dose per capita of anti-depressants
Source: Extracted from PRISMS – June 2012

High level indicatorLi9e(3) Number of people with a diagnosis of dementia on the Quality
and Outcomes Framework Dementia Register
Source: ISD Scotland national statistics release – extracted from site - June 2012

High level indicatorLi11a(1). Number of inpatient discharges with an alcohol-related
diagnosis per 100,000 population
Source: Publication: “Alcohol Related Hospital Statistics 2012.”ISD Scotland (smr01) - Date extracted June 2012
Note: EASR = European Age Standardised Rate per 100,000 population
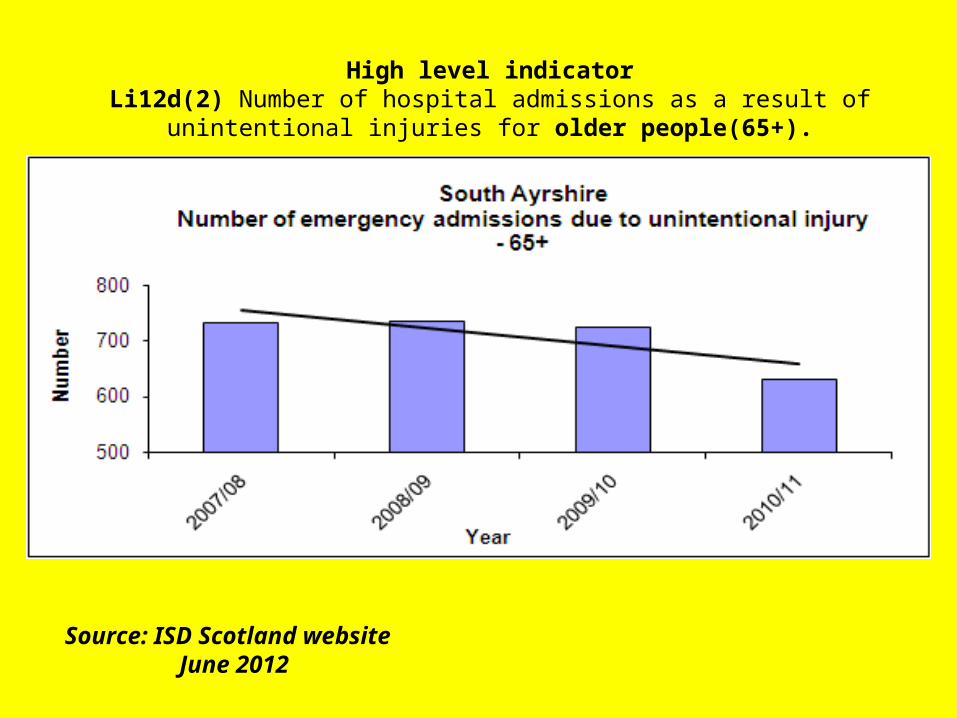
High level indicatorLi12d(2) Number of hospital admissions as a result of unintentional injuries for
older people(65+).
Source: ISD Scotland website June 2012

Delayed Hospital Discharge
Delayed discharge – number of people waiting more than 6 weeks for discharge to appropriate setting
The table below shows that South Ayrshire is performing well in relation to Delayed Discharge with none beyond the initial 6 week target, none beyond the 4 week (new target) and reducing numbers for the future 2 week target.
Table 1 - Comparison of censuses10 11 12 13
Length of delay
Census date up to 2 weeks 2-4 weeks 4-6 weeks 6 weeks plus
South Ayrshire2007 (Apr) 3 7 7 0
2008 (Apr) 3 6 3 0
2009 (Apr) 4 1 5 0
2010 (Apr) 5 4 3 0
2011 (Apr) 4 7 4 0
2012 (Apr) 4 3 0 0
SCOTLAND 2007 (Apr) 131 206 185 233
2008 (Apr) 142 163 129 0
2009 (Apr) 122 199 147 0
2010 (Apr) 203 219 156 0
2011 (Apr) 224 223 206 12
2012 (Apr) 219 207 95 13
Source : ISD Delayed Discharges

0
0.05
0.1
0.15
0.2
0.25
0.3
0.35
0.4
No
rth
La
na
rksh
ire
Sh
etla
nd
Isla
nd
s
Cla
ckm
an
na
nsh
ire
Gla
sgo
w C
ity
An
gu
s
Eile
an
Sia
r
Sco
ttish
Bo
rde
rs
Fa
lkir
k
Ork
ne
y Is
lan
ds
Ea
st A
yrsh
ire
We
st L
oth
ian
So
uth
La
na
rksh
ire
Du
nd
ee
City
We
stD
un
ba
rto
nsh
ire
Inve
rcly
de
Stir
ling
No
rth
Ayr
shir
e
Mid
loth
ian
Ea
stD
un
ba
rto
nsh
ire
Re
nfr
ew
shir
e
Ea
st R
en
fre
wsh
ire
Ea
st L
oth
ian
Fife
Mo
ray
SO
UT
H A
YR
SH
IRE
City
of E
din
bu
rgh
Arg
yll &
Bu
te
Du
mfr
ies
&G
allo
wa
y
Pe
rth
& K
inro
ss
Ab
erd
ee
nsh
ire
Ab
erd
ee
n C
ity
Hig
hla
nd
Pro
po
rtio
n o
f 75
+ p
op
ula
tio
n
Scotland
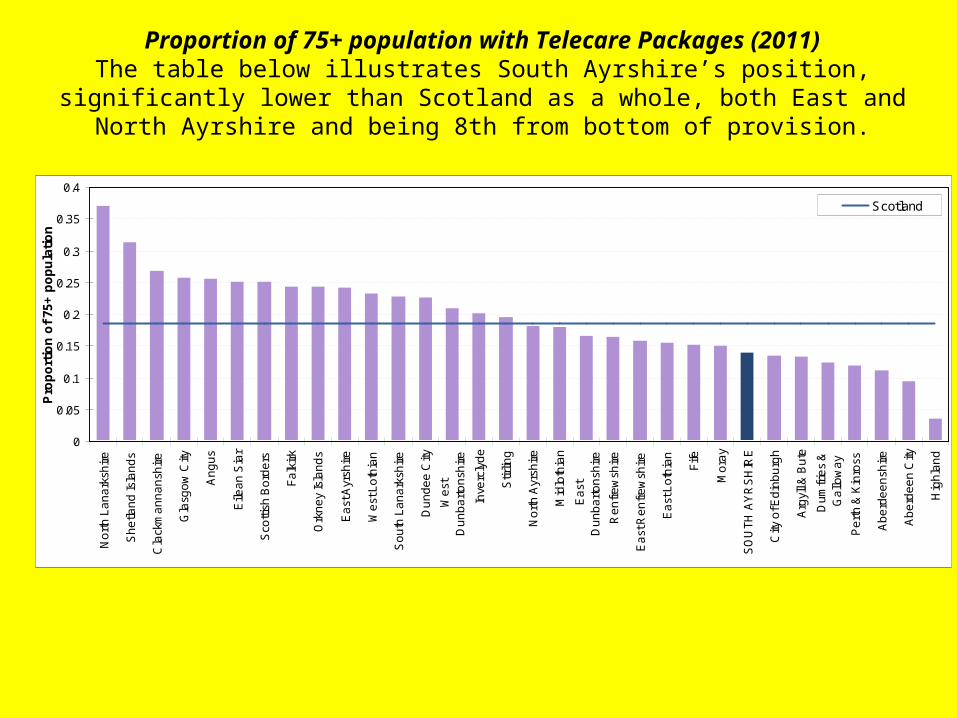
Proportion of 75+ population with Telecare Packages (2011)The table below illustrates South Ayrshire’s position, significantly lower than
Scotland as a whole, both East and North Ayrshire and being 8th from bottom of provision.

0%
20%
40%
60%
80%
100%
Shetla
nd Isla
nds
East R
enfr
ew
shire
Dum
frie
s &
Gallo
way
West D
unbart
onshire
SO
UT
H A
YR
SH
IRE
Eile
an S
iar
Nort
h L
anark
shire
Mora
y
Gla
sgow
City
Inverc
lyde
Cla
ckm
annanshire
South
Lanark
shire
Arg
yll
& B
ute
Mid
loth
ian
West Loth
ian
East Loth
ian
Stir
ling
Falk
irk
Scotla
nd
Ork
ney Isla
nds
Nort
h A
yrs
hire
Dundee C
ity
Scottis
h B
ord
ers
City
of E
din
burg
h
Pert
h &
Kin
ross
East A
yrs
hire
Aberd
een C
ity
Renfr
ew
shire
Fife
East D
unbart
onshire
Hig
hla
nd
Aberd
eenshire
Angus
Home care Care Homes CC Census
% 65+ receiving 10 hours+ Home Care 2011The table below illustrates South Ayrshire’s position in relation to Home Care
although with the introduction of Re-ablement across South Ayrshire the percentage is likely to fall. Consequently, this target is ambiguous and less
helpful.

Updated graph as at June 2012Li9b(1) Premature mortality rates in under 75s in relation to CHD

Updated graph as at June 2012High level indicator
Li9c(2) Number of people aged 65 and over admitted as an emergency inpatient 2 or more times in a single year per 100,000 population.
Source: ISD Scotland website – June 2012

High level indicatorLi9c(2) Number of people aged 65 and over admitted as an emergency
inpatient 2 or more times in a single year per 100,000 population.
Source: ISD Scotland website – June 2012

89.5
90.0
90.5
91.0
91.5
92.0
2005/06 2006/07 2007/08 2008/09 2009/10
South AyrshireCHP
SCOTLAND
Last 6 months of life spent at home or communityThe table below illustrates this target as being a challenging one for South Ayrshire with the overall trend being in the wrong direction (compared to NHS Ayrshire and Arran and Scotland, overall. However, South Ayrshire was markedly better than Scotland in 2007/8 and still remains at a higher rate than Scotland albeit it with
this negative trajectory.


![SOA June 2011 Health Meeting Tn 5 17 11]](https://img.dokumen.tips/doc/110x75/5498b67bb479593b038b45f4/soa-june-2011-health-meeting-tn-5-17-11.jpg)