Embed Size (px)
Citation preview

Report No. 45
South Asia Human Development Sector
Strengthening Science Education in Sri Lanka August 2011
Discussion Paper Series
Pub
lic D
iscl
osur
e A
utho
rized
Pub
lic D
iscl
osur
e A
utho
rized
Pub
lic D
iscl
osur
e A
utho
rized
Pub
lic D
iscl
osur
e A
utho
rized
Pub
lic D
iscl
osur
e A
utho
rized
Pub
lic D
iscl
osur
e A
utho
rized
Pub
lic D
iscl
osur
e A
utho
rized
Pub
lic D
iscl
osur
e A
utho
rized
Report No.45 South Asia Human Development Sector Strengthening Science Education in Sri Lanka August 2011 Discussion Paper Series

Discussion Papers are published to communicate the results of the World Bank’s work to the development community with the least possible delay. The typescript manuscript of this paper therefore has not been prepared in accordance with the procedures appropriate to the formally edited texts. Some sources cited in the paper may be informal documents that are not readily available. The findings, interpretations, and conclusions expressed herein do not necessarily reflect the views of the International Bank for Reconstruction and Development / The World Bank and its affiliated organizations, or those of the Executive Directors of the World Bank or the government they represent. The World Bank does not guarantee the accuracy of the data included in this work. The boundaries, colors, denominations, and other information shown on any map in this work do not imply any judgment on the part of the World Bank concerning the legal status of any territory or the endorsement or acceptance of such boundaries.

Table of Contents Acknowledgements ..................................................................................................................... - 1 - List of acronyms ......................................................................................................................... - 2 - Introduction ................................................................................................................................. - 9 - Section One: Learning Achievements in Science .................................................................... - 10 - Section Two: Science Education Policy, Goals and Reforms ................................................. - 21 - Section Three: Science Education in Schools .......................................................................... - 22 - Section Four: The Way Forward.............................................................................................. - 32 - Annex 1 ..................................................................................................................................... - 34 - Annex 2 ..................................................................................................................................... - 35 - References ................................................................................................................................. - 42 - Tables Table 1: Themes in the Secondary Science Programs in USA, Singapore & Sri Lanka .......... - 25 - Table 2: Teacher Cadre and Availability by Province .............................................................. - 27 -
Figures Figure 1: The learning outcomes in science of students by gender, 2005-2008. ...................... - 10 - Figure 2: The learning outcomes in science of students in urban and rural ............................. - 11 - Figure 3: The learning outcomes of students in science by school type, 2005-2008. .............. - 12 - Figure 4: The learning outcomes of students in science by sub-skill, 2005-2008 .................... - 13 - Figure 5: Performance of students in science at the GCE O/L examination 2002 – 2009. ...... - 14 - Figure 6: Performance of students in science at the GCE O/L examination ............................ - 15 - Figure 7: Performance of students in science at the GCE O/L examination by zone, 2009 ..... - 16 - Figure 8: Comparison of student performance in science at the GCE O/L examination in National
and Provincial schools, 2009 ..................................................................................... - 17 - Figure 9: Pass rates of subjects in the GCE A/L biological science stream, 2004 – 2009 ....... - 18 - Figure 10: Pass rates of main subjects in the GCE A/L science stream, 2009 ......................... - 18 - Figure 11: Performance of students at the GCE A/L (biological science stream) examination by
province, 2009 .......................................................................................................... - 19 - Figure 12: Performance of students at the GCE A/L examination (biological science stream) by
district, 2009 ............................................................................................................. - 20 - Boxes Box 1: Aims of Singapore Lower Secondary Science Syllabus (2008) ................................... - 24 - Box 2: Scottish Schools Digital Network ................................................................................. - 28 -

Authors
Harsha Aturupane (Lead Education Specialist, the World Bank),
Visaka Dissanayake (Consultant),
Romaine Jayewardene (University of Colombo),
Mari Shojo (Education Specialist, the World Bank),
and
Upul Sonnadara(University of Colombo),
Team Support
Anita Fernando and Alejandro Welch

- 1 -
Acknowledgements The authors acknowledge with sincere gratitude the assistance of several World Bank colleagues and Sri Lankan counterparts in the preparation of this study report. In particular, Diaretou Gaye (Country Director for Sri Lanka and the Maldives), Michal Rutkowski (Sector Director, Human Development), Amit Dar (Education Sector Manager, The World Bank); Mr. S.U. Wijeratne, Additional Secretary, Planning and Performance Review, Ministry of Education, Ms. Madura Wehella (Director, Policy and Planning, Ministry of Education), Dr. Jayantha Balasuriya (Deputy Director, Policy and Planning, Ministry of Education), Mr. M.P. Wipulasena (Director, Science, Ministry of Education), Ms. Gayathri Abeygunesekera (Commissioner, Department of Examinations), Ms. Priyanthi Samaraweera (Assistant Commissioner, Education Publications Department), Dr. Jayanthi Gunasekera (Assistant Director-General, National Institute of Education), Mr. C.M.R. Anthony (Director, Science, National Institute of Education), Mr. K.A.D.P. Sarathchandra, (Director - Acting, Department of Early Childhood Development and Primary Education, National Institute of Education), Dr. S. Karunaratne (Science Education Unit, Faculty of Science, University of Peradeniya), the National Education Research and Evaluation Centre (NEREC) of the University of Colombo for making available the National Assessment results and the Technical Support Unit of the Finance Commission for organizing and supporting field visits. The authors also wish to thank the Provincial, Zonal and Divisional Education Authorities and Principals and Mathematics Teachers in schools for their participation in discussions on Science Education and for sharing their ideas, and the National Education Research and Evaluation Centre (NEREC) of the University of Colombo for making available National Assessment results. The study was financed by the World Bank and the Education Program Development Fund (EPDF) of the Education for All: Fast Track Initiative. This financing is acknowledged with gratitude.

- 2 -
List of acronyms DOE Department of Examinations EPD Education Publications Department GCE O/L General Certificate of Education Ordinary Level GCE A/L General Certificate of Education Advanced Level ICT Information and Communication Technologies ISA In-service advisor MOE Ministry of Education NCOE National Colleges of Education NEC National Education Commission NEREC National Education Research and Evaluation Centre NIE National Institute of Education NSF National Science Foundation PISA Program of International Student Assessment S&T Science and Technology SLAAED Sri Lanka Association for the Advancement of Education SLAAS Sri Lanka Association for the Advancement of Science TIM Teacher’s Instructional Manual TIMSS Trends in Mathematics and Science Study

- 3 -
Executive Summary Scientific literacy is essential to stimulate an environment conducive to new knowledge generation, discovery and innovation. A quality school science education is central to building a scientifically literate population. Science education in Sri Lanka has progressed both quantitatively and qualitatively since the 1950s. Access to science education has grown steadily. Curriculum reforms through the years have sought to improve the quality of science education and important strides have been made. Despite this progress there is concern about the outcomes of science education. Students are not able to demonstrate acceptable levels of achievement in applying their knowledge to everyday situations and to the workplace. This paper addresses the challenges to providing a good science education and considers pathways to the future. Policy initiatives supporting science education at present are considered. The science programme in schools is reviewed taking into account parameters such as curriculum, teaching and learning methods, learning assessments, teaching material and deployment and training of science teachers. First, learning achievements in science are assessed in the context of test scores in national assessments administered at grade 8 and of GCE O/L and A/L pass rates. It is assumed that the national examinations are a suitable instrument to test learning outcomes and that at least in part reflect the quality of education. Learning Achievements in Science National cognitive achievement tests in science were conducted by the National Education Research and Evaluation Centre (NEREC) of the University of Colombo at Grade 8 in 2005 and 2008. Results reveal that achievement levels of students in learning outcomes in science have improved between 2005 and 2008. The national mean score increased from 53.2 percent in 2005 to 56.3 percent in 2008. The mean score of females increased from 53.2 percent to 56.6 percent and of males from 52.7 percent to 56.0 percent. An increase in the achievement levels of students in science learning outcomes is seen in both urban and rural schools between 2005 and 2008. In the urban sector, the mean score increased from 57.5 percent in 2005 to 58.0 percent in 2008 and in the rural sector, the mean score increased from 52.4 percent to 55.1 respectively. The scores in the rural sector show a greater improvement and the gap between the two sectors has reduced from 5 percent to 3 percent in the three years. There is a significant difference between the test scores in science of students in type 1AB schools and those in type 1C and type 2 schools. In type 1AB, type 1C and type 2 schools respectively the mean scores were 61.3 percent, 53.2 percent and 51.0 percent in 2005. In 2008 the corresponding values were 64.2 percent, 54.1 percent and 48.9 percent. The sub-skills of knowledge, comprehension, application, analysis and synthesis were tested by NEREC national assessments in science in 2005 and 2008. There is an improvement in mean scores of students in all five sub-skills in the three years. The mean score in comprehension, the strongest sub-skill, increased from 58 percent (2005) to 63 percent (2008). The mean score in

- 4 -
knowledge, which ranks second, increased from 54 percent to 58 percent. A modest improvement in the mean score from 53 percent to 55 percent was seen in the sub-skill, analysis. The mean score of application increased from 49 percent to 52 percent. The weakest sub-skill is synthesis where the mean score increased from 37 to 42 percent. The low scores in the two latter sub-skills may be attributed to the weakness in application of concepts to real life situations and to insufficient use of experiments at the class room level. Effort should be made to increase the overall student achievement level in science, to reduce disparities in test scores between urban and rural schools and to reduce the gap in test scores between school types. It is also necessary to aim for better scores in higher order skills of analysis, application and synthesis - skills required of a modern work force. The national assessments in science should be designed and developed so that results would help policy makers, planners and implementers take a research-based approach to improve education. Participation in international assessment examinations such as Trends in Mathematics and Science Study (TIMSS) and Program of International Student Assessment (PISA) should also be considered to benchmark the performance of Sri Lankan students. There was a 7 percent decline in the GCE O/L pass rates in science of school candidates from 55 percent to 48 percent in the period 2002 to 2009. The pass rates are inadequate considering that more than half those who sat the exam failed to pass during this time period. The decline in results is not reflected in the mean score which has consistently been 34±2 during the given time period. The 2010 GCE O/L pass rate is 60 percent. Since the pass rate represents a substantial increase from 48 percent in the previous year, further studies are required to assess these findings. There is a large disparity in the GCE O/L science results in the provinces. In 2009, there was a 20 percent difference in the pass rate between the province gaining the highest (Western) and lowest (Uva) results. The Western, Southern, North-Western and Sabaragamuwa provinces obtained better results than the rest. There is also a substantial difference in results gained in the 93 zones of the country. In 2009, the Colombo zone ranked first with a pass rate of 68 percent, while Madu lagged behind with a pass rate of 9 percent. The zones in the bottom ten percent of the ranking table belong to the Northern, Central, Eastern and Uva provinces. The zones are located in conflict-affected or plantation areas in the province. A striking variance is observed in the GCE O/L science results of students in national and provincial schools in the country. In 2009, the pass rate in national and provincial schools was 73 percent and 41 percent respectively. Differences in pass rates translate to the provinces.
It would be prudent to understand and analyze the underlying reasons for the decline in GCE O/L science results between 2002 and 2009, the variance in results in the provinces, districts and zones, the variance in results in national and provincial schools and for the poor performance of students in conflict-affected and plantation areas, in order that measures are taken to improve science education in schools throughout the country.

- 5 -
In the GCE A/L biological science stream, biology pass rates of school candidates were more or less constant from 2004 to 2009 while physics and chemistry pass rates increased. The overall trend is promising. The pass rate in biology in 2009 was 74 percent. This is high in comparison to the pass rates in physics (63 percent), chemistry (59 percent) and combined mathematics (45 percent). Physics and Chemistry are common to both biological and physical science students. Thus there is a distinct difference in the attainments of the two groups of students. A substantial disparity is observed in biological science stream pass rates of 1st time school candidates in the provinces. In 2009, the Northern Province had the highest pass rate (50 percent) whilst the North Central Province followed far behind (28 percent) and the variation is a substantial 22 percent. Results in the Northern and Eastern Provinces are praiseworthy considering the disruption caused to education during the conflict period. The success rate is influenced to an extent by the low number of students who sat the examination. District level data point to disparities in pass rates in the districts within the province. For example in the North, pass rates vary from 57 percent in Vavuniya to 17 percent in Killinochchi. Science Education Policy, Goals and Reforms
The National Education Commission has outlined the National Goals for General Education and presented guidelines for curriculum development of content and process strands in primary and secondary education. The desired goals have been considered broadly in the preparation of the curriculum.
There is a need to formulate a clear policy framework that sets goals of science education of the country and pathways to reach the goals. The preparation of a Science Education Policy by the Ministry of Education (MOE) is presently under consideration and its development would be beneficial to curriculum developers, planners and implementers.
The National Science and Technology Policy developed in 2010 has implications for science education. Several elegant strategies have been delineated for school science education which encourage student-directed inquiry and practical skills, to reach the objective of ‘fostering a science, technology and innovative culture that effectively reaches all citizens of the country.’ The national development needs outlined in the Science and Technology (S&T) policy could be used as a base to derive the science education policy.
The MOE as well as the two premier national scientific bodies, the Sri Lanka Association for the Advancement for Science (SLAAS) and the National Science Foundation (NSF) through their Science Education Committee, have introduced many projects to increase interest in the sciences and to build capacity of school children and teachers alike. Projects undertaken are ‘Olympiad’, ‘School Science Project’ and ‘School Science Day’. These interventions are seen to encourage engagement in science education.
Key reforms in the science curriculum and teaching learning methodology were introduced in the last decade with the intention of improving learning outcomes. Competency-based teaching, learning and assessment practices were introduced. New teaching methodologies were adopted to

- 6 -
increase teacher effectiveness and to improve student-teacher interaction. The reforms were brought in at all levels of school education.
These were positive interventions consistent with international trends. A competency-based curriculum promotes student-directed inquiry wherein students are encouraged to use modes of reasoning, problem-solving and higher-order thinking skills to apply knowledge concepts within the subject discipline or to real or new situations. These skills are raw material for innovation. Science Education in Schools Primary Education An activity-based curriculum has been developed for primary students. At primary level, basic science is taught in grades 1 and 2 (key stage 1), grades 3 and 4 (key stage 2) and grade 5 (key stage 3) as a component part of an integrated ‘Environment Related Activities (ERA)’ curriculum. Six hours a week are devoted to ERA. All primary subjects including science are taught in the mother tongue. The ERA syllabus is based on 16 themes into which science topics relevant to the local and global context are cleverly woven.
Activity-based teaching is employed to a fair extent and science is successfully taught in primary school. Students are able to get hands on experience and have the opportunity to learn in collaboration with peers. Teachers are guided by a Teacher’s Instructional Manual (TIM) prepared by the National Institute of Education (NIE). Competencies that must be acquired and content learnt under each theme are described in the TIM together with activities necessary to understand the concepts. However, the balance of knowledge, skills/processes and attitudes necessary to acquire a specific competency is not explicitly stated in the syllabus or TIM although some skills and processes are encouraged in the activities. More emphasis in placed on teaching content.
For a seamless transition from primary to secondary science, teaching science as a standalone course at primary level may be considered sometime in the future. Junior Secondary and GCE O/L Education In the junior secondary (grades 6 to 9) and GCE O/L (grades 10 to 11) cycle of education science is offered as a standalone subject in an integrated curriculum. Physics, Chemistry and Biology are taught as separate units within the integrated curriculum in grades 10 and 11. At the end of grade 11, the first national examination the GCE O/L is held. The medium of instruction is the mother tongue or English (bilingual schools).
The competency-based curriculum was launched in 2007 but several drawbacks are identified in the system. The bias is still towards teaching content. In the syllabus, outcomes for learning content are described but not for skills/processes and attitudes. In the TIM, teachers are not provided with guidance on how to merge the three components necessary to acquire a specific competency. Therefore student-directed inquiry is not encouraged. A change in the organizational structure of the science syllabus and TIM needs to be considered to reflect the manner in which the essential components of content, skills/processes and attitudes are to be balanced to achieve learning outcomes within a scientific topic.

- 7 -
The curriculum is overburdened. The depth of material detailed under some topics is excessive. A careful review of and reduction in content of the syllabus in grades 6-11 is needed. In addition, review and refinement in the sequence plan of grades 6 to 11 is necessary to ensure that an appropriate amount of content is distributed through the grades to ensure that students are properly prepared for the first national examination.
Practical work, a distinct feature of science education receives little attention in the science curriculum for several reasons which are elaborated. Practical work including hands-on laboratory experimentation should be promoted as a compulsory part of the curriculum in grades 6-13 and assessed as part of the examination system. School-based testing of practical work could be introduced and included as part-requirement for the GCE A/L. Laboratory facilities need to be improved and distribution of lab chemicals streamlined throughout the country. Both aspects receive insufficient attention.
Schools need to be supplied with well-trained teachers. Data of science and mathematics teacher distribution in grades 6-13 indicate shortages in many provinces. In all provinces, even those adequately supplied, teacher shortages exist in rural schools due to teacher excess in urban schools. This situation needs to be addressed and remedied to remove inequities in the provision of science teaching.
Teachers are found to be of variable quality. In order to improve teacher quality, greater subject specific training in theory and practical work, both in pre-service and continuing teacher training programs could be offered. The practice of school-based teacher development presently being successfully implemented in some schools could be considered for all schools. Facilities for pre-service training may be improved by upgrading one of the six National Colleges of Education (NCOEs) designated for science, to a National Centre for Excellence in Science Teaching.
The use of Information Communication Technology (ICT) in education enables learning by making it dynamic, lively and interactive. ICT is now increasingly being integrated to international school science programmes. The Sri Lanka syllabus or TIM has not yet included direction on how to use whatever ICT is available in schools. Further, ‘schoolnet’ a digital network set up for Sri Lankan schools, presently connecting over 300 schools in Sri Lanka may be effectively used to work alongside the school curriculum and support science education. The coverage of ‘schoolnet’ is expected to increase in the future.
Curriculum reforms in 2007 introduced teachers to the 5E learning cycle to teach activities but teachers are experiencing difficulties in adapting the method in classroom teaching for a variety of reasons. All activities that are to take place in the class room described in the TIM follow the same format and prescribe the same teaching strategy. However, teachers need to be given the freedom to use the teaching strategy best suited for a learning outcome by mixing and matching teaching strategies. They should be encouraged to innovate.
Examinations need to be adapted to the competency-based curriculum by close collaboration between curriculum writers and the Department of Examinations. It is necessary for the two groups to reach a consensus on the learning outcomes that has to be included in testing for the full spectrum of content and process strands in the curriculum documents once the latter are
- 8 -
revised. Assessments should essentially measure what is intended by the curriculum. The change in the testing system also needs to be applied to term tests in all grades in school.
The Education Publication Department has taken several steps to improve the quality of textbooks in recent times but further improvement is necessary to remedy prevalent shortcomings. Teams of writers with the required skills should be appointed and greater accountability brought into the process of producing text books. Text books in all languages need to be consistent.
GCE A/L Education In the GCE A/L cycle of education (grades 12 and 13), students undertake 3 subjects of study. The options available for science stream students are physics, chemistry, biology, combined mathematics, higher mathematics, IT and agriculture. The medium of instruction is the mother tongue or English (bilingual schools).
The syllabus of the GCE A/L science subjects is competency-based, student-centred and activity-oriented and aim to develop personal, interpersonal and higher order thinking skills of the target student group. Many issues relating to the junior secondary and GCE O/L science curriculum are also common to the GCE A/L. Discussions with school teachers and provincial education authorities revealed that issues such as content overload, lack of emphasis on student-directed enquiry, teacher shortages and variable quality of teachers, lack of focus on practical work and poor laboratory facilities were equally applicable to science education at the GCE A/L.
The GCE A/L teacher has been given greater freedom to follow the teaching learning method of their choice to achieve the relevant learning outcome. Use of practical components, supplementary reading materials and teaching learning aids such as computer-assisted material, co-curricular activities, for example science clubs, field trips, exhibitions and competitions, publications, debates and science days are encouraged in the syllabus. Although the 5E-model of activities has been advocated, most teachers adopt lecture-based teaching due to time constraints resulting from overloaded syllabi. The GCE A/L examination following newly adopted A/L science syllabus will be held for the first time in August 2011. The exam is expected to test competencies and learning outcomes descried in the new syllabus.
Measures need to be taken as described for the junior secondary and GCE O/L curriculum to reduce content in the GCE A/L syllabus, to review and refine the sequence plan of grades 12-13 and place more emphasis on student-directed inquiry and practical and laboratory experimentation.
Finally there is a need to collect research evidence on parameters affecting science education in order that a research-based approach to improving education is adopted. It is vital that strategies that link research firmly with the formation of policy and its implementation are devised and practiced. There is a great need therefore for all authorities in science education to work closely together.

- 9 -
Introduction The future of Sri Lanka lies in developing human capital that can deliver rapid growth in a knowledge-driven global economy. To generate new knowledge and use it innovatively a country requires a scientifically literate population. A quality science education is vital for scientific literacy. If students understand the basic concepts, appreciate important ideas and know how science is applied to everyday situations, high scientific literacy can be achieved. Access to science education has grown steadily in Sri Lanka in response to the need to widen scientific literacy. The study of science up to the GCE O/L was available to a selected minority pre-independence but grew as the social demand for science education increased. Presently students in all secondary schools offer the subject at GCE O/L. Curriculum reforms through the years have also sought to improve the quality of science education and important strides have been made. Despite this progress there is concern about the outcomes of science education. Students are not able to demonstrate acceptable levels of achievement in applying their knowledge to everyday situations and to the workplace. This paper addresses the challenges to providing a good science education and considers pathways to the future. Policy initiatives to support science education are discussed. The science programme in schools is reviewed taking into account parameters such as curriculum, teaching and learning methods, learning assessments, teaching material and deployment and training of science teachers. First, learning achievements in science are discussed in the context of test scores in national assessments administered at grade 8 and of GCE O/L and A/L pass rates. It is assumed that the national examinations are a suitable instrument to test learning outcomes and that at least in part reflect the quality of education.

- 10 -
Section One: Learning Achievements in Science National Assessment at Grade 8 Performance in learning outcomes of students by gender: The performance of students in learning outcomes in science is presented in Figure 1. The national mean score increased from 53.0 percent in 2005 to 56.3 percent in 2008. Achievement levels of both boys and girls, show a positive trend and interestingly girls perform marginally better. The increase in mean scores between 2005 and 2008 is statistically significant at 99 percent for both groups. The increase is substantial considering the studies were conducted only 3 years apart and it is hoped that the trend will continue.
Figure 1: The learning outcomes in science of students by gender, 2005-2008
Source: National Assessments of Learning Outcomes, Grade 8, 2005 and 2008, National Education
Research and Evaluation Center, University of Colombo.
53.2
56.6
52.7
56.0
50
52
54
56
58
2005 2008
Mea
n Sc
ore
in S
cien
ce (%
)
Year of Examination
Female Male Sri Lanka

- 11 -
Performance in learning outcomes by sector: The performance in learning outcomes in science of students in urban and rural sector schools is presented in Figure 2. Achievement levels of students in urban schools are higher than those in rural schools. However, students in rural schools show a greater improvement and the gap between the two groups has begun to close by 2008. The increase in mean scores between 2005 and 2008 is statistically significant at 99 percent and 90 percent for students in rural and urban schools respectively.
Figure 2: The learning outcomes in science of students in urban and rural sector schools, 2005-2008.
Source: National Assessments of Learning Outcomes, Grade 8, 2005 and 2008, National Education
Research and Evaluation Center, University of Colombo. Performance in learning outcomes by school type: The performance in learning outcomes in science of students by school type is presented in Figure 3. Both in 2005 and in 2008, students in type 1AB schools clearly outperformed those in type 1C and type 2 schools. It is necessary to note that the overall mean score in science learning outcomes is negatively affected by the weaker performance of students in type 1C and type 2 schools. While type 1AB schools show an increase in student performance in 2008, type 2 schools show a reduction both of which are significant at 99 percent. Type 1AB schools offer science education at GCE A/L and it is safe to surmise from this data that the overall science education in type 1AB schools (even at lower levels as in grade 8) is far stronger than in the remaining schools. Whilst the better performance of type 1AB schools is commendable, there is clear evidence in this data set for the need of policy to improve science
57.558.0
52.4
55.1
48
50
52
54
56
58
60
2005 2008
Mea
n Sc
ore
in S
cien
ce (%
)
Year of Examination
Urban Rural Sri Lanka

- 12 -
programmes in type 1C and type 2 schools. This need is urgent as >70 percent of the students in the country attend type 1C and type 2 schools. The presence of a high quantum of bright students in 1 AB schools may in part explain the above observation. This situation results from the transfer to type 1 AB schools in grade 6 of students gaining good grades in the grade 5 scholarship exam, from both type 1C and type 2 schools.
Figure 3: The learning outcomes of students in science by school type, 2005-2008
Source: National Assessments of Learning Outcomes, Grade 8, 2005 and 2008, National Education
Research and Evaluation Center, University of Colombo. Performance in learning outcomes by sub-skill: The grade 8 national assessments can be used to test learning outcomes of sub-skills in science [NEREC (2005); NEREC (2008)]. In science, five sub-skills of knowledge, comprehension, application, analysis and synthesis have been tested. Figure 4 shows the results of learning outcomes in science in each of the above sub-skills. The improvement in all five sub-skills in science between 2005 and 2008 is promising. Comprehension is the strongest science sub-skill while synthesis is the weakest. That the ranking of the mean scores of all five sub-skills has remained unchanged in 3 years is interesting. The strengths of students are still in comprehension, assimilating knowledge and analysis. They are weaker in application and synthesis. The findings may be attributed to the weakness in the application of concepts to real life situations and insufficient use of experiments at the class room level [NEREC (2008)]. It is expected that reforms brought in 2007 to better understand basic concepts and appreciate how science is applied to everyday life, will begin to show results in the future.
61.3
64.2
53.254.1
51.0
48.9
40
45
50
55
60
65
70
2005 2008
Mea
n Sc
ore
in S
cien
ce (%
)
Year of Examination
1AB 1C Type 2 Sri Lanka

- 13 -
Figure 4: The learning outcomes of students in science by sub-skill, 2005-2008
Source: National Assessments of Learning Outcomes, Grade 8, 2005 and 2008, National Education
Research and Evaluation Center, University of Colombo.
54
5858
63
49
5253
55
37
42
30
35
40
45
50
55
60
65
70
2005 2008
Faci
lity
valu
e (%
)
Year of Examination
Comprehension
Application
AnalysisKnowledge
Synthesis
- 14 -
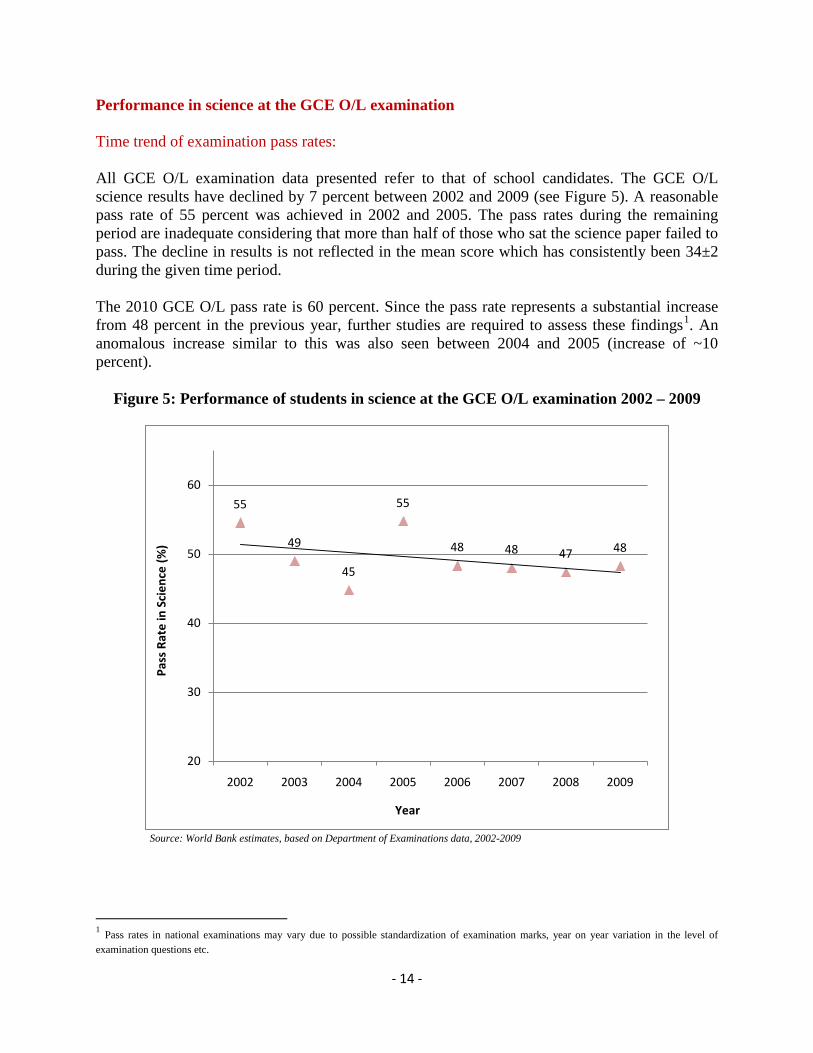
Performance in science at the GCE O/L examination Time trend of examination pass rates: All GCE O/L examination data presented refer to that of school candidates. The GCE O/L science results have declined by 7 percent between 2002 and 2009 (see Figure 5). A reasonable pass rate of 55 percent was achieved in 2002 and 2005. The pass rates during the remaining period are inadequate considering that more than half of those who sat the science paper failed to pass. The decline in results is not reflected in the mean score which has consistently been 34±2 during the given time period. The 2010 GCE O/L pass rate is 60 percent. Since the pass rate represents a substantial increase from 48 percent in the previous year, further studies are required to assess these findings1
. An anomalous increase similar to this was also seen between 2004 and 2005 (increase of ~10 percent).
Figure 5: Performance of students in science at the GCE O/L examination 2002 – 2009
Source: World Bank estimates, based on Department of Examinations data, 2002-2009
1 Pass rates in national examinations may vary due to possible standardization of examination marks, year on year variation in the level of examination questions etc.
55
49
45
55
48 48 47 48
20
30
40
50
60
2002 2003 2004 2005 2006 2007 2008 2009
Pass
Rat
e in
Sci
ence
(%)
Year

- 15 -
Regional disparity in pass rates: Figure 6 compares the GCE O/L science pass rates in the nine provinces (2009). A substantial regional disparity is observed in science results as for mathematics [Jayewardene & Sonnadara (2011)]. The Western, Southern, North-Western and Sabaragamuwa provinces show higher pass rates than the remaining ones. The difference in results between the province gaining the best pass rate (58 percent) and the lowest pass rate (38 percent) is 20 percent. Reasons for such a large variation should be understood and investigated and necessary action taken to improve results in provinces that perform poorly.
Figure 6: Performance of students in science at the GCE O/L examination
by province, 2009
Source: World Bank estimates, based on Department of Examinations data, 2006 and 2009
The next set of results accentuates regional differences in performance even further. Data in figure 7 show examination pass rates of students in all zones in the country in 2009 where data points are arranged according to the zone’s pass rate ranking in 2006. A range of nearly 60 percent is observed between the highest (Colombo, 68 percent) and lowest performing (Madu, pass rate 9 percent) zones. The zones in the bottom ten percent of the ranking in 2009 belong to the Northern, Central, Eastern and Uva provinces and include conflict affected and plantation areas.
58
41
52
4845 46
39 38
48
0
10
20
30
40
50
60
70
Pass
Rat
e in
Sci
ence
(%)

- 16 -
Figure 7: Performance of students in science at the GCE O/L examination by zone, 2009
Source: World Bank estimates, based on Department of Examinations data, 2009 Note: The order of zones in the figure corresponds to the order of highest to lowest
performing zones in 2006. Identities of zones are not shown. Performance of students in National and Provincial schools: A striking variance is observed in the GCE O/L pass rate in science of students in national and provincial schools in the country (where a greater proportion of students study in provincial schools) and where the overall pass rate was 73 percent and 41 percent respectively in 2009. This disparity translates to the provinces as well. Figure 8 shows the performance of students in national schools versus provincial schools in each of the provinces (2009). The above observation leads to an important question i.e. is a two-tiered system being created in the country at least when it comes to science education? This question is also relevant to mathematics education as a similar difference is evident in mathematics results [Jayewardene & Sonnadara (2011)]. Are we delivering an equitable education in the light of disparities we are seeing in the performance of students in different circumstances?
0
10
20
30
40
50
60
70
80
1 11 21 31 41 51 61 71 81 91
Pass
Rat
e in
Sci
ence
(%)
Zone

- 17 -
Figure 8: Comparison of student performance in science at the GCE O/L examination in National and Provincial schools, 2009
Source: World Bank estimates, based on Department of Examinations data, 2009
Performance at the GCE A/L examination Time trend of examination pass rates in science stream: In figure 9, the performance of school candidates at the GCE A/L examination with respect to subjects offered in the biological science steam, from 2004 to 2009, is shown. Biology pass rates are more or less constant while physics and chemistry pass rates are tending to increase. The overall trend is promising. Figure 10 presents the performance of school candidates at the 2009 GCE A/L examination, in the four main subjects in the science stream. While 74 percent of the students pass biology at the GCE A/L, only 45 percent pass mathematics. The pass rates in physics and chemistry, subjects common to both physical and biological science students, are 63 percent and 59 percent respectively. Thus, there is a distinct difference in the attainment of students in the biological and physical science streams.
0
20
40
60
80
100
Pass
Rat
es in
Sci
ence
(%)
National Provincial

- 18 -
Figure 9: Pass rates of subjects in the GCE A/L biological science stream, 2004 – 2009
Source: World Bank estimates, based on Department of Examinations data, 2009
Figure 10: Pass rates of main subjects in the GCE A/L science stream, 2009
Source: World Bank estimates, based on Department of Examinations data, 2009.
74 74
58
63
49
59
30
40
50
60
70
80
2004 2005 2006 2007 2008 2009
Pass
Rat
es (%
)
Year
Biology
Physics
Chemistry
6359
74
45
0
10
20
30
40
50
60
70
80
Physics Chemistry Biology Mathematics
Pass
rat
es (%
)

- 19 -
Regional disparities in pass rates: Figure 11 compares the GCE A/L biological science pass rates of 1st time school candidates in the nine provinces in 2009. A substantial disparity is observed in pass rates in the provinces similar to that seen in the GCE O/L. The Northern province has the highest pass rate (50 percent) whilst the North Central province lags behind (28 percent) and the variation is a substantial 22 percent. There is no correlation in the order of pass rates in each of the provinces, in the two national examinations. Results in the Northern and Eastern provinces are praiseworthy considering the disruption caused to education during the conflict period. The high success rate is influenced to an extent by low numbers who sat the examination. Further, in the two provinces a large percentage of those obtaining good results at the GCE O/L take up sciences in the A/L. In the remaining provinces students performing well at the GCE O/L opt for the commerce stream in preference to science.
Figure 11: Performance of students at the GCE A/L (biological science stream) examination by province, 2009
Source: World Bank estimates, based on Department of Examinations data, 2009
The GCE A/L examination pass rates (biological science stream) disaggregated by zone are not available but district level data is presented. District level data point to disparities in pass rates within the province (see Figure 12). For example in the North, pass rates vary from 57 percent in
46
37 36
50
45
34
2830 31
0
10
20
30
40
50
Pass
Rat
es in
Bio
logi
cal S
cien
ce (%
)

- 20 -
Vavuniya to 17 percent in Killinochchi. District- and zone-disaggregated data is useful to authorities to understand and address specific factors that contribute to weaknesses in the system.
Figure 12: Performance of students at the GCE A/L examination (biological science
stream) by district, 2009
Source: World Bank estimates, based on Department of Examinations data, 2009
5238
3939
3632
4336
2855
1752
5726
4641
5133
372828
3321
3033
0 10 20 30 40 50 60
ColomboGampaha
KalutaraKandy
MataleNuwara Eliya
GalleMatara
HambantotaJaffna
KilinochchiMannar
VavuniyaMullativuBatticaloa
AmparaTrincomaleeKurunegala
PuttalamAnuradhapura
PolonnaruwaBadulla
MonaragalaRatnapura
Kegalle
GCE A/L Pass Rates

- 21 -
Section Two: Science Education Policy, Goals and Reforms The National Education Commission (NEC) has outlined the National Goals for General Education and presented guidelines for curriculum development of content and process strands in primary and secondary education. The desired goals have been considered broadly in the preparation of the curriculum (SLAAED, 2010). A discrete policy framework that sets goals for teaching and learning science, for assessments and skills and values to be achieved through science education and for strategies to achieve the goals is lacking. The preparation of a Science Education Policy by the Ministry of Education (MOE) is presently under consideration. The importance of science education has been recognized in Sri Lanka’s science and technology policy. The National Science and Technology Policy acknowledges that Science and Technology (S&T) plays a key role in economic development and that education is central to achieving this goal [NASTEC (2010)]. It recognizes that investment in research and development as well as in a strong S&T resource base is essential to compete successfully in the rapidly growing technology-intensive global market. This is necessary given that high technology exports form only one percent of Sri Lanka’s manufactured exports compared with 27 percent in Thailand, 55 percent in Malaysia and 57 percent in Singapore. The S&T policy strongly advocates a quality science education which encourages an inquiring mind in students and fosters a culture of innovation and entrepreneurship. The two premier national scientific bodies, the Sri Lanka Association for the Advancement of Science (SLAAS) and the National Science Foundation (NSF) through their Science Education Committee, have committed themselves to the development of science education in Sri Lanka. Many projects have been introduced by them as well as by the MOE and other agencies to increase interest in the sciences and to build capacity of school children and teachers alike. Projects undertaken are ‘Olympiad’, ‘School Science Project’ and ‘School Science Day’. These interventions are seen to encourage engagement in science. Key reforms in curriculum and teaching learning methodology were introduced in 1999 and in 2007 to improve the learning of science. This is in response to findings that students were not able to apply their learning to everyday situations and to findings that their skills in open-ended problem solving and decision making relating to innovation and creativity were weak. Few were able to demonstrate the ability to use higher order thinking skills [McCaul (2007)]. Competency-based teaching, learning and assessment practices were introduced. A competency-based curriculum is expected to set outcomes for learning of content as well as for skills/processes and attitudes that students should acquire, in an activity-based learning environment. The skills and processes enable students to apply knowledge concepts within the subject discipline itself or to real situations using higher-order thinking skills. New teaching methodologies to increase teacher effectiveness and to improve student-teacher interaction were adopted [Ginige (2008)]. The reforms were introduced at all three levels of school education.

- 22 -
Section Three: Science Education in Schools The primary, junior secondary, GCE O/L and A/L school science curriculum of Sri Lanka is developed and the syllabus and Teacher’s Instructional Manual (TIM) prepared for each grade by the Department of Science, Health and Physical Education, Faculty of Science and Technology of the National Institute of Education (NIE), Sri Lanka (NIE, 2010). Primary Education (Grades 1-5) At primary level, basic science is taught in grades 1 and 2 (key stage 1), grades 3 and 4 (key stage 2) and grade 5 (key stage 3) as a component part of an integrated ‘Environment Related Activities (ERA)’ curriculum. Six hours a week are devoted to ERA. All primary subjects including science are taught in the mother tongue. Text books are not issued at primary level. The TIM that includes ERA and the three languages for the primary education cycle contains eleven common competencies to be developed in key stages 1-5. Each TIM also specifies another set of competencies for each grade, the subject content and the learning teaching methodology. An assessment report card is provided at the back of the TIM. Essential learning competencies (ELCs) for key stages 1, 2 and 3 are published in three separate documents where the teachers’ attention is drawn to the essential core of knowledge, skills and attitudes that must be balanced to develop a competency. The ERA syllabus is based on 16 themes. The syllabus has a spiral approach where the concepts are revisited at each grade with increasing depth. The themes provide a broad-based understanding of the social, biological and physical aspects of the environment. Within these themes, science topics of observing the environment, organisms and diversity, cycles, earth and space, energy and force have been cleverly introduced. The topics are relevant to the local and global context and compare well with those of diversity, cycles, systems, interaction and energy taught in the primary science syllabus of Singapore, a country which has a strong science programme. Activity-based teaching is employed to a fair extent and science is being successfully taught in primary school. Competencies that must be acquired and content learnt relevant to each topic in science are delineated in the TIM followed by a description of activities necessary to understand the concepts. Some skills/processes and attitudes are encouraged in the activities described in the TIM. However, there is a shortcoming in that teachers lack guidance on how to merge the three components necessary to acquire a specific competency as the balance of the three components is not explicitly stated in the syllabus or TIM. More emphasis is placed on teaching content but teachers should pay greater attention to developing the investigative skills of the student. Teachers are encouraged to use a variety of strategies to facilitate the teaching learning process. Students are able to get hands on experience and have the opportunity to learn in collaboration with peers. The lack of material and equipment for activities hampers teaching but teachers do adapt, whenever possible, using local materials.

- 23 -
Class teachers are responsible for teaching science. The pre-service training of primary teachers in the National Colleges of Education (NCOEs) is thought to be adequate although facilities for training e.g. laboratories need improvement. Graduates appointed to primary school teaching positions need special training for primary education which is provided through the NIE. In-service training is provided from time to time but a structured continuous teacher development programme is absent but essential to improve the quality of teachers. Junior Secondary and GCE O/L Education (Grades 6-11) In the junior secondary (grades 6 to 9) and GCE O/L (grades 10 to 11) cycle of education science is offered as a standalone subject in an integrated curriculum. Physics, Chemistry and Biology are taught as separate units within the integrated curriculum in grades 10 and 11. At the end of grade 11, the first national examination the GCE O/L is held. The medium of instruction is the mother tongue or English (bilingual schools). Text books are issued to students in each grade and are available in all three languages.
Curriculum documents:
The objectives of the science program in grades 6-11 are described in the syllabus and TIM (Annex 1) and refer to the application of scientific knowledge and concepts to everyday living and to the Nation’s well-being using inquiry skills, problem solving and scientific reasoning. In this respect they are valuable outcomes of science education. In order to clearly define the skills, abilities and attributes students need to acquire through the study of science, narrowing the focus of the aims may be considered. Such precise aims are described in the Singapore syllabus (see Box 1).

- 24 -
Box 1: Aims of Singapore Lower Secondary Science Syllabus (2008)
Source: Ministry of Education, Singapore, Lower Secondary Science Syllabus (2008)
a) Enable students to acquire understanding and knowledge so as: • to become confident citizens in a technological world, able to take or develop an
interest in matters relating to science and technology; • to recognize and appreciate the usefulness and limitations of the scientific method to
investigating and solving problems; • to be prepared for science studies at upper secondary level and beyond.
b) Develop abilities and skills that • are relevant to the study and practice of science; • are useful in everyday life; • encourage effective communication; • encourage safety consciousness and safe practice.
c) Develop attributes relevant to the study and/or practice of science such as: • concern for accuracy, • objectivity, • inquisitiveness, • initiative, • innovativeness, • integrity, • perseverance, • critical analysis.
d) Stimulate • curiosity, interest and enjoyment in science and its methods of inquiry; • interest in, and care for, the environment.
e) Promote an awareness: • that the study and practice of science is cooperative and cumulative and are subject to
social, economic, technological, ethical and cultural influences and limitations; • that the applications of science are generally beneficial; but the abuse of scientific
knowledge can be detrimental of the importance of the use of IT for communications and as a tool for data collection and analysis.
It is hoped that teachers will incorporate the social, environmental, economic and technological aspects of science whenever possible throughout the syllabus [see Aims (e) and (e)]. Where appropriate, students should also have opportunities to discuss the ethical implications of science and technology.

- 25 -
The Sri Lanka syllabus is structured on broad themes (or standards) to help students appreciate the big ideas in science. The syllabus has a spiral approach where the concepts are revisited at each grade with increasing depth. Table 1 compares the themes in the secondary science program of three countries including Sri Lanka. When account is taken of the competencies as well as themes, the Sri Lanka syllabus shows broad agreement with those of USA and Singapore. The main areas the Sri Lanka syllabus does not address are ‘Science as a Human Endeavour’ and ‘History and Nature of Science’.
Table 1: Themes in the Secondary Science Programs in USA, Singapore & Sri Lanka
The five themes selected are not used to structure the Sri Lanka syllabus. Instead a set of eight competencies is used to organize the teaching sequence in grades 6-11. The competencies provide a general description of expected learning. Each competency is further specified as a number of competency levels. The statements under each competency level describe the content. The content described under the large number of competency levels specified in a grade (35-50) is excessive resulting in an overburdened curriculum. The time allocated to complete the topics is unrealistic and arbitrary. Syllabi are impossible to cover in the given three terms. The depth of material covered under some topics is excessive. Although the content is described under each competency level in the syllabus, the remaining core components of skills/processes and attitudes are absent. To clarify this point, the syllabi of four countries, Sri Lanka, Malaysia, Singapore, and the USA in relation to the topic ‘Animal Diversity’ are compared (Annex 2). The Malaysian and Singapore2
2 Malaysia and Singapore achieve high rankings in international assessment examinations such as Trends in Mathematics and Science Study (TIMSS) and the Program of International Student Assessment (PISA).
syllabi have an organizational structure and detail of expected learning outcomes that are measurable within the framework of the three core components. An organizational structure for guiding teachers on how to weave content, skills/processes and attitudes is also lacking in the TIM. The activities relating to the competency levels also are directed towards learning content and not so much to promote student directed inquiry [see also McCaul (2007)].
USA (National Standards for The Education of Science
Singapore Sri Lanka
(Grades 5-8) Unifying Concepts and Processes Science as Inquiry Physical Sciences Life Science Earth and Space Science Science and Technology Science in Personal and Social Perspectives Science Perspectives Science as Human Endeavour History and Nature of Science
(Lower Secondary) Science and Technology Measurement Diversity Models and Systems Energy Interactions
(Grades 6-11) Observing the Environment Organisms and Life Processes Matter, their Properties and Interactions Earth and Space Energy, Force and Work

- 26 -
Practical work: Practical work, a distinct feature of science education receives little attention in the science curriculum for several reasons. The lack of laboratory resources in schools appears to be the main reason but the absence of an examination system to test practical skills also contributes to this neglect. Practical work is necessary for a real understanding of how science works and for developing student aptitude particularly if they take up advanced science courses. The S&T policy document recognizes the need for field and laboratory exercises in school science programs as they help to promote a science, technology and innovation culture in the country [NASTEC (2010)]. Other initiatives encouraged are the establishment of science centres and science exploration. The MOE has made progress by establishing 36 on-site environmental education centres island-wide useful for observing and studying the environment. The MOE and the Science Education Committees of the SLAAS and the NSF have also undertaken a series of successful programs to enhance the appeal of science in schools and which are resulting in increased interest in the practical aspect of science. Teaching learning strategies: The 5E learning cycle of engagement, explanation, exploration, elaboration and evaluation was introduced to classrooms in 2007 in order to make teaching more effective [Ginige (2008)], but there are still challenges. According to several studies, there is difficulty in implementing the 5E teaching methodology due to time constraints. Teachers are reverting to lecture-based teaching in order to complete the vast syllabi in time. Lack of awareness about the new teaching strategies among teachers and inadequate training given on 5E methodology are also reasons for poor implementation [McCaul (2007), NIE (2008), and NIE (2009)]. Deployment and training of teachers: Several provinces face teacher shortages. Even when the cadre is exceeded in a province, teacher shortages prevail in rural schools due to teacher excess in urban schools (Table 2). The majority of junior secondary and GCE O/L science teachers are trained in NCOEs, in six of the seventeen NCOEs which have specialized training in the sciences. Teacher training college qualified teachers and science graduates are also recruited. The quality of science teachers is found to be variable. Poor quality is attributed partly to the quality of pre- and in-service training.

- 27 -
Table 2: Teacher Cadre and Availability by Province
Province
Junior Secondary and GCE O/L GCE A/Level Cadre Availability
(Math/Science trained)
% Cadre Availability (Science graduates)
%
Western 4,920 5,092 103 1,547 2,198 142 Central 3,191 3,183 100 732 824 113 Southern 3,014 3,692 122 917 1,081 118 North-Western 2,897 2,709 94 638 871 137 Northern 1,634 1,255 77 420 588 140 Eastern 2,193 1,763 80 466 552 118 North-Central 1,568 1,416 90 175 273 156 Uva 1,836 1,678 91 397 402 101 Sabaragamuwa 2,311 2,360 102 438 583 133 Sri Lanka 23,564 23,148 98 5,730 7,372 129 Continuing teacher training was previously done using the ‘cascade model’ but the method was found to have limitations due to dilution of the message in transmission. In 2010 the NIE commenced ‘direct training’ involving NIE staff and teacher trainers in the province. They encounter much hardship in the conduct of training due to lack of funds and deficient training facilities in the province. Information and Communication Technologies (ICT):
The use of ICT in education enables learning by making it dynamic, lively and interactive. ICT is now increasingly being integrated to international school science programmes. The Sri Lanka syllabus or TIM has not yet included direction on how to use whatever ICT is available in schools. Further, ‘schoolnet’ a digital network set up for Sri Lankan schools, presently connecting over 300 schools may be effectively used to work alongside the school curriculum and support science education. The coverage of ‘schoolnet’ is expected to increase in the future. ‘Schoolnet’ could be used in a manner described for Glow in Scotland (see Box 2).

- 28 -
Box 2: Scottish Schools Digital Network
Source: School Science Summit, Dunfermline, Scotland: Report of Proceedings (2009) Learning assessment: The GCE O/L examination papers need to test competencies and learning outcomes delineated in the new syllabi. A study carried out in 2009 found that the GCE O/L examination had not adjusted to testing competencies and learning outcomes but was placing more emphasis on measuring cognitive abilities as in the past [NIE (2009)]. This may partly be due to the absence of clearly spelt out learning outcomes for the full spectrum of content and skills/process strands in the curriculum documents. Teachers were also found to not have significantly changed their assessment practices in term tests [McCall (2007)].
Glow is a model in the use of modern technology in education. It is the Scottish Schools Digital Network and is the world’s first national intranet for education. Glow is transforming the way education is being delivered. Its aim is to break geographical and social barriers and allow collaboration along the length and breadth of Scotland. Glow has been designed to work alongside the school curriculum to build capacity and underpin new approaches to delivering a first-class education to Scotland’s children and young people. This innovative intranet is a “digital blackboard” which every student and teacher in Scotland can share, for regular lessons as well as extra-curricular activities. For example, it enables smaller schools to work with larger schools on science projects, exchanging ideas and accessing central resources. This offers considerable opportunities especially for schools in remote areas. As well as facilitating discussion boards, forums and webcasts, Glow can create a “virtual classroom” experience. Data gathered or research done by a teacher can be placed on glow so that it can be easily accessed by all other teachers and students, instead of being locked up in a single location. If anyone needs specialist knowledge, they can contact other members or ask advice from academic “experts” and then share their experience with the rest of the network. New findings and information can be broadcast live in a webcast so that schools throughout Scotland could interact in real time with each other as well as with specialists in the field. This enables pupils to ask and have answered live questions. It has also the potential of supporting teachers and making science relevant and exciting for young people.

- 29 -
Text books: The Education Publication Department (EPD) has taken several steps to improve the quality of textbooks in recent times. The material is attractive and colourful and presented reasonably well. However, there are still issues including factual errors, lack of clarity of subject matter, change in context of subject material after translation, variation and inconsistencies in the texts of the three languages, grammatical errors and typographical errors. Further some diagrams are unattractive, small and inaccurate.
GCE A/L Education (grades 12 and 13) In the GCE A/L cycle of education, students undertake 3 subjects of study. The options available for science stream students are physics, chemistry, biology, combined mathematics, higher mathematics, IT and agriculture. The medium of instruction is the mother tongue or English (bilingual schools). The GCE A/L examination which is held at the end of grade 13 has a dual purpose. It is a terminal achievement test with regard to senior secondary education and it is also the selection instrument for admission to the 14 national universities. Success at the GCE A/L examination is critical because of limited entry to the national universities. The number of schools providing GCE A/L science subjects (type 1AB schools) is low and accounts for only 26 percent of the total number teaching GCE A/L subjects. Students, predominantly in rural areas, are deprived the opportunity to study science at a higher level owing to non-availability of type 1AB schools in their locality. Some move a long distance away from home to enrol in one. The syllabus of the GCE A/L science subjects is competency-based, student-centred and activity-oriented and aim to develop personal, interpersonal and higher order thinking skills of the target student group. Many issues relating to the junior secondary and GCE O/L science curriculum are also common to the GCE A/L. Discussions with school teachers and provincial education authorities revealed that issues such as content overload, lack of emphasis on student-directed enquiry, teacher shortages and variable quality of teachers, lack of focus on practical work and poor laboratory facilities were equally applicable to science education at the GCE A/L. The GCE A/L teacher has been given greater freedom to follow the teaching learning method of their choice to achieve the relevant learning outcome. Use of practical components, supplementary reading materials and teaching learning aids such as computer-assisted material, co-curricular activities, for example science clubs, field trips, exhibitions and competitions, publications, debates and science days are encouraged in the syllabus. Although the 5E-model of activities has been advocated, most teachers adopt lecture-based teaching due to time constraints resulting from overloaded syllabi. The GCE A/L examination following newly adopted A/L science syllabus will be held for the first time in August 2011. The exam is expected to test competencies and learning outcomes described in the new syllabus. Model papers have only recently been issued to schools. There are no public practical examinations at the A/L stage. Compulsory questions on the theory of practical work warrant some familiarity with practical experimentation.

- 30 -
An excess of GCE A/L science and maths teachers is reported in all provinces (see Table 2). In spite of this, teacher shortages prevail in schools in challenging circumstances due to teacher excess in urban schools. Students in these schools are highly disadvantaged and are forced to transfer to other schools or travel vast distances to a neighbouring province during weekends to attend tuition classes. Students in Badulla in the Uva province travel to Kandy in the Central province for example. Science graduates are recruited to teach GCE A/L science. The quality of science teachers is said to be variable. Poor quality is attributed partly to the quality of pre- and in-service training. In-service training of GCE A/L teachers is conducted by the NIE through direct training. University lecturers are invited to conduct training but it appears that many are unfamiliar with the A/L curriculum. Further the university staff would only address content knowledge and not pedagogical issues. Hence teachers do not get maximum benefit from the training. Challenges Identified in focus group discussions In order to better grasp the issues relating to science education, focus group discussions were conducted in situ with curriculum developers of the NIE, education authorities of the MOE, provinces, zones and divisions and with school science teachers and principals in many provinces of the country. The main findings are recorded below. The teachers pointed out an overburdened curriculum from grades 6 to 13. They stated that students are simply unable to cope with the volume of scientific knowledge they have to learn and that the time assigned to complete the syllabus is insufficient. Teachers have lost the joy of teaching science and students no longer enjoy learning the subject. Many schools arrange classes after school and during the holiday period to complete the syllabus. Cooperative activity-based learning is being abandoned in favour of lecture-based teaching due to time constraints. Some teachers stated that they are compelled to follow the activities prescribed in TIM and hence lose the freedom to innovate. The majority of teachers and education authorities are in favour of competency-based teaching in science. They stated that the given activities are original and interesting although the aim of several is unclear. They also stated that all scientific concepts do not warrant the use of activities and teachers should have the freedom to select the strategy best suited for a learning outcome. Teachers mentioned that in some instances learning material was not ordered in sequence, for example the application of a principal is found in a chapter preceding the chapter describing the principle [see also SLAAED (2010)]. Teachers stated that laboratory work was not being given sufficient importance (grades 6-13). Due to lack of time, certain schools hold practical classes after school as class time is taken up for teaching theory. Students in some schools complete the GCE O/L without any practical knowledge and experience. They stated that part of the reason for neglect of practical work is the absence of a public examination. The majority of schools visited lack laboratory resources particularly lab chemicals.

- 31 -
The shortage of good quality science teachers was regarded a serious problem. Furthermore, some zonal staff mentioned that teachers were not appropriately trained and lacked practical skills and were therefore reluctant to teach laboratory work. Teachers stated that in-service training was inadequate. Awareness seminars about new reforms were insufficient and unclear. The lack of clear direction given in the training sessions left them confused and less confident. Principals and staff in some schools mentioned that they employ methods of school-based teacher development through the formation of ‘quality circles’. Activities of peer learning, peer coaching and visits to other classrooms are practised and found to be beneficial. Teachers mentioned several problems relating to term tests set by the school or the zone. English medium questions are translated incorrectly (bilingual schools). In term examinations set by zones, marks assigned on question papers are at times different to those in the marking scheme. Teachers in one of the provinces stated that the questions try to ascertain the manner in which students performed activities in the classroom and not the learning outcome. Most teachers stated that a good proportion of in-service advisors (ISAs) are not proficient in science (grades 6-13). They are unable to guide teachers as the latter in many instances are more knowledgeable. Teachers lack confidence in ISAs. NIE primary education officials stated that primary school ISAs are a good resource base and form a strong network in the provinces by maintaining regular contact with schools and the NIE. They provide valuable feedback from schools on issues that teachers face in the primary programme. Their progress is reviewed once a year at a meeting at the NIE. The teachers and education authorities stated that students in many schools miss second and third term classes in grade 13 to attend private revision classes. These classes attract students as tutors offer attractive handouts and tutorials with model answers. They focus exclusively on preparing students for the exam.
- 32 -
Section Four: The Way Forward There is a need to formulate a clear policy framework that sets goals of science education of the country and pathways to reach the goals. The preparation of a Science Education Policy by the MOE is presently under consideration and its development would be beneficial to curriculum developers, planners and implementers. The science education policy can be derived on the basis of national development needs outlined in the S&T policy. The study of science needs to move away from learning of large volumes of scientific knowledge to one of student-directed inquiry. This would be helped by a change in the organizational structure of the science syllabus to reflect the manner in which the essential components of content, skills/processes and attitudes are to be balanced to achieve learning outcomes within a scientific theme. An organizational structure for guiding teachers on how to weave content, skills/processes and attitudes needs also to be included in the TIM. The activities relating to the competency levels must be directed to student-directed inquiry and not so much towards learning content. Achievement levels in national assessments to test learning outcomes of sub-skills in science at grade 8 reflect this bias in that mean scores of students are higher in knowledge assimilation and comprehension than in analysis, application and synthesis. A careful review of and reduction in content of the science syllabus in grades 6-13 is needed to eliminate curriculum overloading. In addition, review and refinement in the sequence plan of grades 6 to 11 and 12 to 13 is also necessary to ensure that an appropriate amount of content is distributed through the grades to ensure that students are properly prepared for the two national examinations. For a seamless transition from primary to secondary science, teaching science as a standalone course at primary level may be considered sometime in the future. The precise aims of a basic science education could be described in the primary syllabus and may be developed on the lines of the Singapore primary science syllabus (MOE, Singapore, 2008).
Practical work could be promoted as a compulsory part of the curriculum in grades 6-13 and assessed as part of the examination system. School-based testing of practical work could be introduced and included as part-requirement for the GCE A/L. Improvement of laboratory facilities and a proper and efficient system of distribution of lab chemicals is essential within the framework of practical examinations. Teachers need the freedom to use the teaching strategy best suited for a learning outcome by mixing and matching teaching strategies. All activities that are to take place in the class room described in the TIM follow the same format and prescribe the same teaching strategy. However, teachers need to be given the freedom to use the teaching strategy best suited for a learning outcome by mixing and matching teaching strategies. They should be encouraged to innovate.
The integration of ICT to education should be considered using whatever ICT resources available to make learning of science dynamic and interactive. Further, the use of ‘schoolnet’ a

- 33 -
digital network set up for Sri Lankan schools should be encouraged to work alongside the school curriculum and support science education. Examinations need to be adapted to the competency-based curriculum by close collaboration between curriculum writers and the Department of Examinations (DOE). It is necessary for the two groups to reach a consensus on the learning outcomes that has to be included in testing for the full spectrum of content and process strands in the curriculum documents once they are revised. The change in the testing system also needs to be applied to term tests in all grades in school. The quality of text books needs to be improved to remedy all shortcomings. Teams of writers with the required skills should be appointed and greater accountability brought into the process of producing text books. Text books in all languages should be consistent. The problem of teacher deployment needs to be addressed and remedied to remove inequities in the provision of science teaching. Further, the training and quality of teachers need to be improved as the quality of learning is largely depended on the teacher. Deployment of high quality teachers in all schools would result in island-wide improvement of standards and would serve to significantly eliminate wide regional disparities in performance at national examinations.
In order to improve teacher quality, greater subject specific training in theory and practical work, both in pre-service and continuing teacher training programs could be offered. Teachers could be incentivized to undertake a broad range of recognized continuing teacher training activities which include for example their participation in scientific research in universities and industry. The practice of school-based teacher development presently being successfully implemented in some schools could be further developed. Facilities for pre-service training may be improved by upgrading one of the six NCOEs designated for science, to a National Centre for Excellence in Science Teaching. Measures need to be taken as described for the junior secondary and GCE O/L science curriculum to reduce content in the GCE A/L syllabus, to review and refine the sequence plan of grades 12-13 and place more emphasis on student-directed inquiry and practical and laboratory experimentation. Finally there is a need to collect research evidence on parameters affecting science education in order that a research-based approach to improving education is adopted. It is vital that strategies that link research firmly with the formation of policy and its implementation are devised and practiced. There is a great need therefore for all authorities in science education to work closely together.

- 34 -
Annex 1
The aims and objectives of the science programme in grades 6-11 are to: ▪ Develop scientific concepts and principles systematically through a joyful learning
environment ▪ Develop competencies related to problem solving by using processes in science and
scientific method appropriately ▪ Develop competencies pertaining to managing environmental resources intelligently by
understanding the potential of such resources ▪ Develop competencies related to the usage of scientific knowledge to lead a physically
and mentally healthy life ▪ Develop competencies pertaining to becoming a successful individual who will
contribute to the development of the nation through collaborative processes, engage in further studies and undertake challenging job prospects in the future
▪ Develop competencies related to understanding the scientific basis of the natural phenomena and the universe
▪ Use appropriate technology to maintain efficiency and effectiveness at an optimum level utilizing energy and force
▪ Develop competencies related to evaluation of day to day life experiences and information acquired through media by employing scientific criteria with a background of limitations and dynamic nature of science

- 35 -
Annex 2 Secondary School Science SINGAPORE THEME: DIVERSITY OF PLANT AND ANIMAL LIFE
Learning Outcomes Knowledge, Understanding and Application
Skills and Processes Ethics and Attitudes
Diversity of plant and animal life - Classification of plant and animal life • show an understanding of the
need to classify living organisms
• classify living organisms according to commonly observable characteristics
• classify living organisms into major taxonomic groups
(Students are not required to use Prokaryotic and Eukaryotic classification, only general classification of animals and plants is expected) • construct a dichotomous key • use simplified dichotomous
keys in identifying and classifying living organisms
• show an appreciation of the importance for man to understand and maintain the connections among living things
• show an appreciation of man’s responsibility to have care and concern
for living things and the environment

- 36 -
MALAYSIA THEME: DIVERSITY OF LIVING THINGS
Specific Expectations Understanding Basic Concepts Developing Skills of Inquiry ,
Design and Communication Relating Science and Technology to the World Outside the School
By the end of Grade 6, students will • explain why formal
classification systems are usually based on structural characteristics (e.g. type of skeleton, circulatory system) rather than on physical appearance or behavioural characteristics:
• recognize that the essential difference between cold- and warm-blooded animals lies in different means of regulating body temperature;
• identify and describe the characteristics of vertebrates, and use these characteristics to classify vertebrates as mammals, birds, amphibians, reptiles and fish (the five main classes);
• identify and describe the characteristics of invertebrates and classify invertebrates into phyla (e.g. sponges, worms, molluscs, arthropods);
• compare the characteristics of vertebrates and invertebrates;
• compare the characteristics of different kinds of arthropods (e.g. crustaceans such as crayfish, shrimp; insects such as grasshoppers, butterflies, mealworms);
• describe microscopic living
By the end of Grade 6, students will • formulate questions about and
identify the needs of different types of animals, and explore possible answers to these questions and ways of meeting these needs (e.g. design an experiment to study whether certain insects will grow larger if given large quantities of food);
• plan investigations for some of these answers and solutions, indentifying variables that need to be held constant to ensure a fair test and identifying criteria for assessing solutions;
• use appropriate vocabulary, including correct science and technology terminology, in describing their investigations and observations (e.g. use terms such as organism, species, structure and kingdom in describing classification of animals);
• complies data gathered through investigation in order to record and present results, using charts, tables, labeled graphs and scatter plots produced by hand or with a computer (e.g. make an inventory of animals found in
By the end of Grade 6, students will • identify various kinds of
classifications systems that are based on specific criteria and used to organize information (e.g. in a telephone system, numbers are classified according to country code, area code, telephone number, extension number);
• identify inherited characteristics (e.g. eye colour, hair colour) and learned or behavioural characteristics (e.g. habits of cleanliness)
• explain why characteristics related to physical appearance (e.g. size, shape, colour, texture) or behavior are not suitable attributes for classifying living things;
• identify various kinds of plant or animal organisms in a given plot using commercially produced biological or classification keys (e.g. organisms observed in a pond study, in the school yard, in wildlife centers);
• describe specific characteristics or adaptations that enable each group of vertebrates to live in its

- 37 -
things using appropriate tools to assist them with their observations (e.g. nets and microscopes for study);
• describe ways in which micro-organisms meet their basic needs (e.g. for food, water, air, movement).
a specific location); • communicate the procedures
and results of investigations for specific purposes and to specific audiences, using media works, oral presentations, written notes and descriptions, charts, graphs and drawings (e.g. create a clearly labeled chart or organisms observed and identified during a pond study).
particular habitat (e.g. fish in water) and explain the importance of maintaining that habitat for the survival of species;
• explain how fossils provide evidence or changes in animals over geological time;
• compare similarities and differences between fossils and animal of the present

- 38 -
National Science Education Standards USA THEME: LIFE SCIENCE
Learning Outcomes Developing Student Understanding
Skills and Processes
Life Science As a result of their activities in grades 5-8, all students should develop an understanding of • structure and function of
living systems • reproduction and heredity • regulation and behaviour • populations and ecosystems • diversity and adaptations of
organisms Fundamental concepts and principles that underlie diversity and adaptation of organisms: • Millions of species of
animals, plants, and microorganisms are alive today. Although different species might look dissimilar, the unity among organisms becomes apparent
• from an analysis of internal structures, the similarity of their chemical processes, and the evidence of common ancestry.
• Biological evolution accounts for the diversity of species developed through gradual processes over many genera tions. Species acquire many of their unique characteristics through biological adaptation which involves the selection of
• students learn skills, such as observation, inference, and experimentation. The new vision includes the “processes of science” and requires that students combine processes and scientific knowledge as they use scientific reasoning and critical thinking to develop their understanding of science.
students should expand their investigations of living systems to include the study of cells. Observation and investigations should become increasingly quantitative, incorporating the use of computers and conceptual and mathematical models. Students can draw on their own experiences to develop models of interactions between organisms and environments.
- 39 -
• naturally occurring variations in populations. Biological adaptations include changes in structures, behaviors, or physiology that enhance
• survival and reproductive success in a particular
• environment. • Extinction of a species
occurs when the environment changes and the adaptive
• characteristics of a species are insufficient to allow its survival. Fossils indicate that many organisms that lived long ago are extinct.
• Extinction of species is common; most of the species that have lived on the earth no
• longer exist.

- 40 -
SRI LANKA THEME: ORGANISMS AND LIFE PROCESSES
Competencies and Competency Levels Competencies and Competency Levels Content Investigates animal diversity • investigates similarities and dissimilarities
among organisms • investigates animal diversity in relation to the
environment they live in • investigates animal diversity in relation to their
external characteristics • investigates animal diversity in relation to their
type of food • investigates animal diversity in relation to
locomotion • classifies animals using suitable criteria and
• need to identify diversity among organisms • characteristics common to organisms • characteristics common to plants • characteristics common to animals • differences between plants and animals • types of animals according to the environment
they live in • aquatic • terrestrial • tree living • soil
• animal diversity based on the environment they live in
• external characteristics that favour diversity among animals • colour • shape • symmetry • appendages
• animal diversity based on external characteristics
• groups of animals in relation to their type of food • herbivore • carnivore • omnivore
• animal diversity based on the type of food • animal groups based on locomotion
• locomotion possible • locomotion not possible
• Methods of locomotion among animals • flying • creeping • walking • swimming
• Animal diversity based on methods of
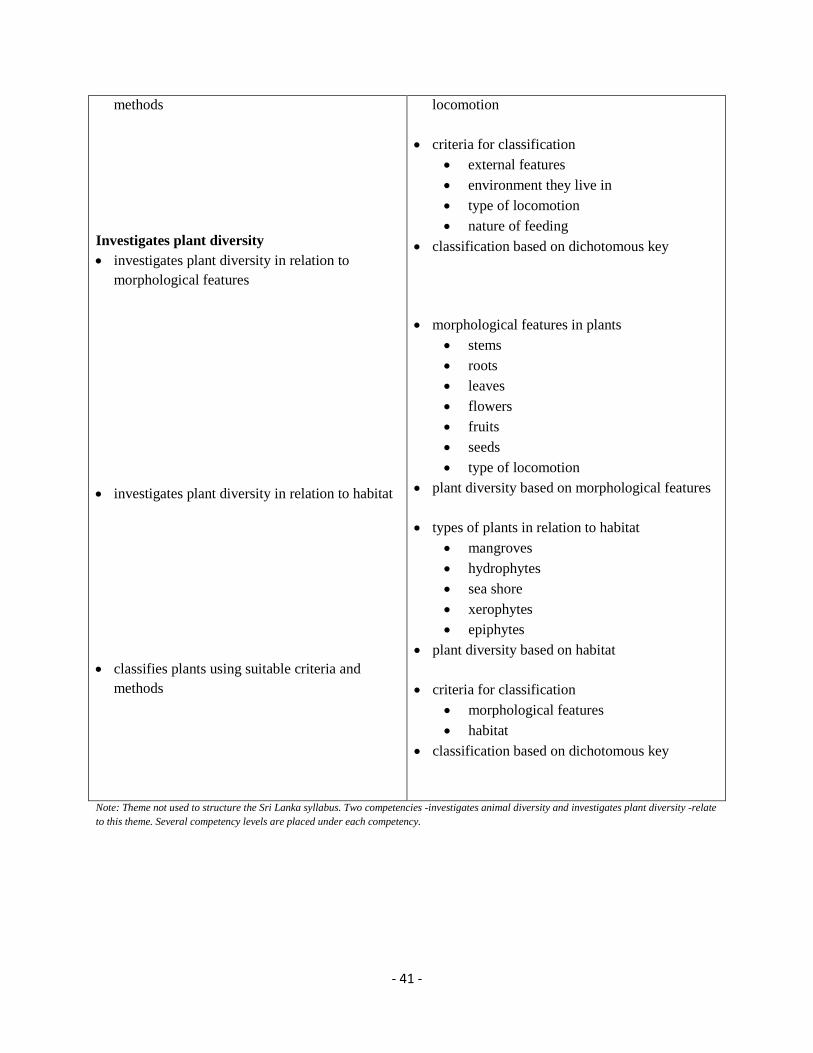
- 41 -
methods Investigates plant diversity • investigates plant diversity in relation to
morphological features • investigates plant diversity in relation to habitat • classifies plants using suitable criteria and
methods
locomotion
• criteria for classification • external features • environment they live in • type of locomotion • nature of feeding
• classification based on dichotomous key
• morphological features in plants • stems • roots • leaves • flowers • fruits • seeds • type of locomotion
• plant diversity based on morphological features
• types of plants in relation to habitat • mangroves • hydrophytes • sea shore • xerophytes • epiphytes
• plant diversity based on habitat
• criteria for classification • morphological features • habitat
• classification based on dichotomous key
Note: Theme not used to structure the Sri Lanka syllabus. Two competencies -investigates animal diversity and investigates plant diversity -relate to this theme. Several competency levels are placed under each competency.

- 42 -
References
1. Ginige, I.L. (2008). The Vision of the New Curriculum and the Expected Paradigm Shift in School
Education. Vocational Skills Development Centre, Sri Lanka. 2. Jayewardene, R. and Sonnadara, U. (2011). Strengthening Mathematics Education, Colombo Sri
Lanka. In preparation.
3. McCaul, T. (2007). Study of the Implementation of Mathematics and Science Curriculum in Grade 6 and 10 (International Consultancy), NIE.
4. MOE (2008). Lower Secondary-Science Syllabus. Ministry of Education, Singapore. http://www.MOE.gov.sg/education/syllabuses/sciences/
5. MOE (2008). Primary-Science Syllabus. Ministry of Education, Singapore. http://www.MOE.gov.sg/education/syllabuses/sciences/
6. NASTEC (2010). National Science & Technology Policy of Sri Lanka. National Science and Technology Commission. Ministry of Science and Technology Sri Lanka. http://www.nastec.lk/assets/templates/plastic/
7. NEREC (2005). National Assessment of Achievement of Grade 8 & 10 Students in Sri Lanka, National Education Research and Evaluation Centre, University of Colombo, Sri Lanka.
8. NEREC (2008). National Assessment of Achievement of Grade 8 Students in Sri Lanka, National Education Research and Evaluation Centre, University of Colombo, Sri Lanka.
9. NIE (2008). An Evaluation of the Process of Development and Implementation of the New Curriculum in Grades 6 and 10, NIE.
10. NIE (2009). An Evaluation of the Process of Development and Implementation of the New Curriculum in Grades 7 and 11, NIE.
11. NIE (2010). Primary and Junior Secondary Syllabus, National Institute of Education, http://www.nie.lk/page/syllabus.html
12. School Science Summit (2009). Report of Proceedings. Dunfermline, Scotland. http://www.scotland.gov.uk/Resource/Doc/91982/0087311.pdf 13. SLAAED (2010). A Study to Examine the Degree of Horizontal Integration of the Modernized
Curriculum Introduced at Secondary Level (Grade 6-11) since 2007.