Embed Size (px)
Citation preview
Journal of Fish Biology (2016) 88, 51–64
doi:10.1111/jfb.12851, available online at wileyonlinelibrary.com
Sources of variation in oxygen consumption of aquaticanimals demonstrated by simulated constant oxygen
consumption and respirometers of different sizes
M. B. S. Svendsen*†, P. G. Bushnell‡, E. A. F. Christensen*and
J. F. Steffensen*
*Marine Biological Section, Department of Biology, University of Copenhagen,Strandpromenaden 5, DK-3000 Helsingør, Denmark and ‡Department of Biological Sciences,
Indiana University South Bend, South Bend, IN 46634, U.S.A.
As intermittent-flow respirometry has become a common method for the determination of restingmetabolism or standard metabolic rate (SMR), this study investigated how much of the variabilityseen in the experiments was due to measurement error. Experiments simulated different constant oxy-gen consumption rates (MO2) of a fish, by continuously injecting anoxic water into a respirometer,altering the injection rate to correct for the washout error. The effect of respirometer-to-fish volumeratio (RFR) on SMR measurement and variability was also investigated, using the simulated constantMO2 and the MO2 of seven roach Rutilus rutilus in respirometers of two different sizes. The resultsshow that higher RFR increases measurement variability but does not change the mean SMR estab-lished using a double Gaussian fit. Further, the study demonstrates that the variation observed whendetermining oxygen consumption rates of fishes in systems with reasonable RFRs mainly comes fromthe animal, not from the measuring equipment.
© 2016 The Fisheries Society of the British Isles
Key words: aquatic respirometry; intermittent-flow respirometry; measurement error.
INTRODUCTION
Measurements of oxygen consumption of fishes and other aquatic organisms havebeen made over time using a variety of respirometry techniques such as closedrespirometry (Ege & Krogh, 1914; Scholander et al., 1943), flow-through (or open)respirometry (Niimi, 1978) and intermittent-flow (or stop-flow) respirometry (Forstner,1983; Steffensen et al., 1984; Steffensen, 1989). Oxygen consumption using closedrespirometry should, however, be avoided due to problems associated with the pro-gressive hypoxia and simultaneous hypercapnia that inevitably develop during theexperiment. Flow-through respirometry is also problematic due to issues of equilibra-tion time, caused by the exponential washout effect of water in the respirometer (Keys,1930a, b; Niimi, 1978; Steffensen, 1989; Eriksen, 2002; Svendsen et al., 2016). Atpresent, intermittent-flow respirometry is probably the easiest method of accurately
†Author to whom correspondence should be addressed. Tel.: +45 23235265; email: [email protected]
51
© 2016 The Fisheries Society of the British Isles
52 M . B . S . S V E N D S E N E T A L.
determining oxygen consumption in aquatic animals at high frequency and for longdurations, and it has become widely used.
Regardless of the technique employed, a source of variation in the measured oxygenconsumption is noise from the data collection system. The type of oxygen sensors (e.g.polarographic, galvanic or optical), amplifiers and recording equipment can all poten-tially affect the quality of the data being recorded (Shannon, 1949). This can be seenas signal noise inherent in the calibrated probe and associated electronics, which canresult in an over or under-estimation of the measured oxygen consumption of the ani-mal and contribute to variability in the measurements. As far as is known, no previousstudies have tried to examine and quantify such noise in aquatic respirometry systems.Instead, variation in oxygen consumption data has usually been attributed to differ-ences among individual animals. A series of experiments were therefore undertakenusing an artificial fish with a constant oxygen consumption to evaluate how much ofthe variability in metabolic rate measurements was biological in nature (i.e. the fish)and how much was inherent to the measurement system itself.
In addition to signal variability in the instrumentation, it is also interesting to assessthe effect of the respirometer-to-fish volume ratio (RFR) on the scatter in measure-ments of oxygen consumption when using intermittent-flow respirometry. Comparedwith a large fish, a small fish in a large respirometer (high RFR) will produce a slowerdecline in oxygen content over time and hence a lower (flatter) slope, reduced coeffi-cient of determination (r2) and larger variation. The information provided in this studywill be useful in aiding experimenters in the use of appropriately sized respirometersto obtain accurate standard metabolic rate (SMR) measurements with lower variation.
MATERIALS AND METHODS
E X P E R I M E N TA L A N I M A L S
The experiments were conducted with roach Rutilus rutilus (L. 1756), caught in streamsin Mølleåen, Denmark (55∘ 46′ 20′′ N; 12∘ 29′ 47′′ E) in December 2013. Rutilus rutiluswas chosen as a test animal due to its availability and similar behaviour to the rainbow troutOncorhynchus mykiss (Walbaum 1792) in a respirometer. The fish, ranging in mass from 19⋅3to 28 g (23⋅1± 3⋅6 g, mean± s.d.), were kept in recirculated filtered fresh water and acclimatedto 25∘ C for at least 2 weeks before being used in the experiment. Fish were fed Tetramin (UnitedPet Group; www.unitedpetgroup.com) flaked aquarium fish food every day. Food was withheld2 days prior to experimentation to ensure that animals were in a post-absorptive state.
E X P E R I M E N TA L P RO C E D U R E : T H E E F F E C TO F R E S P I RO M E T E R VO L U M E O N R. RU T I L U S
The experiments were carried out using intermittent-flow respirometers designed to measureSMR, defined as the oxygen consumption of a resting, non-digesting and non-reproducing ani-mal, which thus reflects the minimum maintenance cost (Beamish & Mookherjii, 1964; Forstner,1983; Schurmann & Steffensen, 1997; Svendsen et al., 2013; Chabot et al., 2016).
To test the effect of RFR on SMR measurements, experiments were carried out onR. rutilus (n= 7) in respirometers with a volume of 0⋅6 and 0⋅9 l. Although the metabolicrate measurements were done consecutively, the initial respirometer size was determinedrandomly to avoid any confounding effects of temporal habituation to the respirometers. Therespirometer was immersed in a temperature-controlled water bath (30 l) connected via anoverflow to a 40 l sump in order to increase the total holding volume of water and maintaina constant pressure in the respirometer. Water in the bath and sump was vigorously aerated
© 2016 The Fisheries Society of the British Isles, Journal of Fish Biology 2016, 88, 51–64
VA R I AT I O N I N I N T E R M I T T E N T- F L OW R E S P I RO M E T RY 53
to maintain oxygen tension at normoxic levels and passed through a UV sterilizer (TetraPond UV10000; www.tetra-fish.com) to keep background respiration low. The temperatureof the system was kept at 25⋅0∘ C, range± 0⋅1∘ C, by a programmable temperature regulator(PR 5714, PR Electronics; www.prelectronics.dk) with a pt-100 temperature probe (Ametek;www.ametek.com) and a submersible pump (Eheim 1004; www.eheim.com) which pumpedwarm water through a stainless steel coil in a thermostatted water bath (Heto CBN 8-30;www.holm-halby.dk) kept at 30∘ C. This pump was only activated when temperature in theholding tank fell below 25∘ C, thus maintaining constant temperature in the experimental setup.Oxygen content (% air saturation) was measured with a fibre optic oxygen sensor (FirestingO2, Optical Oxygen Meter, 4 channel; www.pyro-science.com) calibrated to 0 and 100% airsaturation using chemically oxygen-depleted water and air-saturated water. The experimentalprotocol used was similar to that described in Steffensen et al. (1984) with each measurementcycle consisting of flush, wait and measurement periods. During the flush period (300 s), therespirometer was flushed with fresh water using a pump (Eheim 1046) with a 5 l min−1 flowrate which effectively replaced 99⋅99% of the chamber water (Steffensen, 1989). At the endof the flush period, the pump was turned off and the water allowed to mix during a 30 s waitperiod. The measurement cycle concluded with 300 s measurement period where the lineardecline in oxygen content was recorded every second. Flush-pump cycling and data collectionwere controlled via AquaResp (University of Copenhagen) a free programme for respirometryof aquatic animals available on the web (www.aquaresp.com).
OX Y G E N C O N S U M P T I O N
Oxygen consumption was calculated using the formula MO2 = 𝛽O2VR WF− 1𝛿pO2 𝛿t− 1,
where 𝛽O2 is the oxygen solubility (of the water) at the measurement temperature, salinity andatmospheric pressure, VR is the respirometer water volume, 𝛿pO2 𝛿t−1 is the slope of the linearregression calculated from the decline in oxygen during the measurement periods and WF isthe mass of the fish (Ege & Krogh, 1914; Steffensen, 1989; Svendsen et al., 2016). Conversionfrom oxygen content or oxygen saturation to partial pressure was completed by using Henry’sLaw (Svendsen et al., 2016).
Respirometer volume (VR) was calculated using VR =VT −WF𝜌F− 1, where VT is the total
volume of the empty respirometer, associated recirculating system tubing and pump and 𝜌 is thedensity of the fish (for calculation purposes, the fish was assumed to be neutrally buoyant, i.e.same density as the water).
E X P E R I M E N TA L P RO C E D U R E : T H E E F F E C TO F R E S P I RO M E T E R VO L U M E O N S I M U L AT E D F I S H
Custom-made software, Artifishal, was used to simulate a constant and precise oxygen con-sumption of a fish by driving a voltage-controlled peristaltic pump (Minipulse 3, Gilson Inc.;www.gilson.com) which delivered anoxic water into the respirometer at a rate that was altered tomaintain a constant decline in the oxygen content in the respirometer. The peristaltic pump flowrate was controlled with the analogue output of a digital-to-analogue converter (USB1208LS,Measurement Computing; www.mccdaq.com) connected to a PC.
Pumping anoxic water into the respirometer at a constant rate during the measurement periodwould result in an exponential decrease in oxygen content due to a decreasing difference inoxygen content between the injected anoxic water and the mixed water in the respirometer (Stef-fensen, 1989). As a linear decrease in oxygen in the respirometer was required, the injectionrate was continuously increased to mimic both the oxygen consumption of a real fish during themeasurement period as well as during the washout of the metabolic chamber during the flushingperiod.
The linear oxygen content decrease of a fish (Fig. 1) over time, f (t), will have the form f (t) ∶𝛿CO2 𝛿t−1 = −RO2t + CO2, where RO2 is the oxygen consumption rate (mg O2 h−1), t is timeand CO2 is the total content of oxygen in the respirometer. The washout function, w(t), canbe expressed as w (t) ∶ 𝛿CO2 𝛿t−1 = CO2e𝜏t, with 𝜏 being the washout constant (Steffensen,1989), determined by the infusion rate, r, and the volume of the respirometer (V r) 𝜏 =− rV r
− 1.
© 2016 The Fisheries Society of the British Isles, Journal of Fish Biology 2016, 88, 51–64

54 M . B . S . S V E N D S E N E T A L.
100
(a) (b)
(c) (d)
98
96
94
92
90
100
98
96
94
92
0
90
100
98
96
94
92
90
100
Air
sat
urat
ion
(%)
Air
sat
urat
ion
(%)
98
96
94
92
90
50 100 150
Time (s)200 250 300 0 50 100 150 200 250 300
Fig. 1. A plot of air saturation during one measurement period (300 s) for (a) computer-controlled oxygen con-sumption (MO2), small MO2 in a large respirometer (average r2 = 0⋅975), (b) computer-controlled highMO2 in a small respirometer (average r2= 0⋅999), (c) Rutilus rutilus in a large respirometer (averager2= 0⋅998) and (d) R. rutilus in a small respirometer (average r2= 0⋅998). There are four randomly selectedslopes from the experiments on each part. Note that in (a) and (b), both from the Artifishal experiment, linesfall on top of each other, whereas in data from the R. rutilus experiments (c) and (d), lines from four randommeasurement periods do not fall on top of each other, and do not have similar slope. The y-values fromwhere the slopes start is dependent on oxygen consumption, flush volume and mixing in the respirometer(Svendsen et al., 2016). Noise in the data, scatter around the slope, is considered the same in all experi-ments, and arise from non-instantaneous mixing and possibly from the oxygen sensor. Data are obtainedfrom the Pyroscience Firesting (www.aquarespt.com) logger at 1 Hz.
To approximate the infusion rate to obtain a linear decrease in the respirometer, the follow-
ing formula was used: r =[f (t)CO−1
2
]t−1
− 1, the experiments were carried out using the samerespirometers as the R. rutilus experiments in order to imitate RFRs of 26:1 and 39:1 and sim-ulate oxygen consumption rates of 1562, 4688 and 7500 μmol O2 kg−1 h−1. Due to pump flowrate limitation and degassing capacity, it was not possible to produce an oxygen consumptionrate that exceeded 7500 μmol O2 kg−1 h−1.
S TA N DA R D M E TA B O L I C R AT E
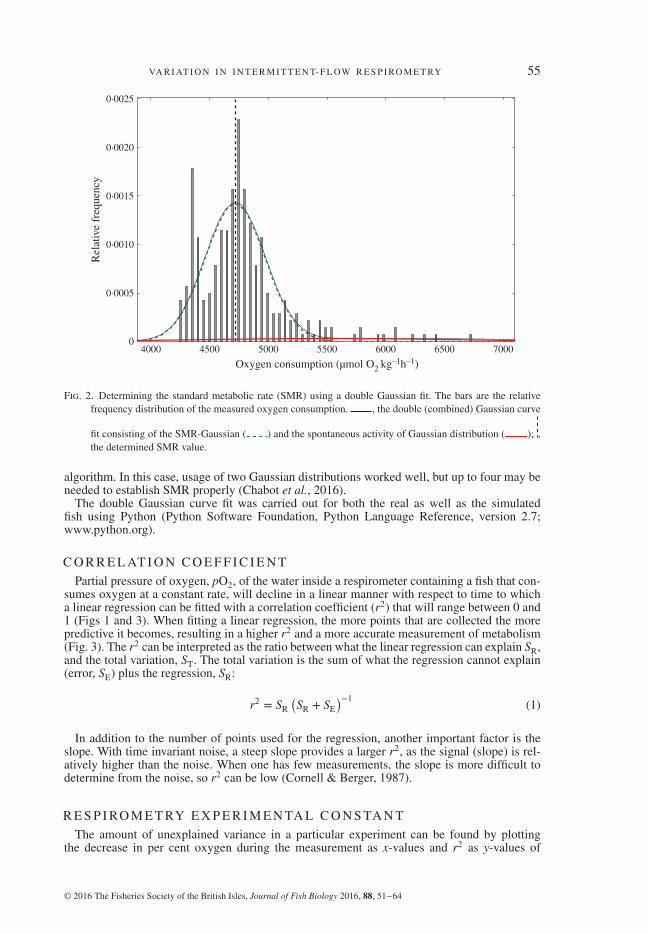
SMRs were determined by fitting the sum of two Gaussian distributions to the histogram ofthe oxygen consumption (MO2) data with a bin size of 25 μmol O2 kg−1 h−1 (Fig. 2) as outlinedby Steffensen et al. (1994). Fitting the sum of two normal distributions will give two meanvalues. The mean of the left (low values on x-axis) peaked distribution (green bell in Fig. 2)represents SMR and the width its s.d. The right peak (red bell) represents spontaneous activity(SA) defined as intermittent and prolonged bouts of higher oxygen consumption. The SMR andSA distributions each have an s.d., and thus variance that can be derived from the curve-fitting
© 2016 The Fisheries Society of the British Isles, Journal of Fish Biology 2016, 88, 51–64
VA R I AT I O N I N I N T E R M I T T E N T- F L OW R E S P I RO M E T RY 55
Rel
ativ
e fr
eque
ncy
0·0025
0·0020
0·0015
0·0010
0·0005
04000 4500 5000 5500
Oxygen consumption (μmol O2 kg–1h–1)6000 6500 7000
Fig. 2. Determining the standard metabolic rate (SMR) using a double Gaussian fit. The bars are the relativefrequency distribution of the measured oxygen consumption. , the double (combined) Gaussian curve
fit consisting of the SMR-Gaussian ( ) and the spontaneous activity of Gaussian distribution ( ); ,the determined SMR value.
algorithm. In this case, usage of two Gaussian distributions worked well, but up to four may beneeded to establish SMR properly (Chabot et al., 2016).
The double Gaussian curve fit was carried out for both the real as well as the simulatedfish using Python (Python Software Foundation, Python Language Reference, version 2.7;www.python.org).
C O R R E L AT I O N C O E F F I C I E N TPartial pressure of oxygen, pO2, of the water inside a respirometer containing a fish that con-
sumes oxygen at a constant rate, will decline in a linear manner with respect to time to whicha linear regression can be fitted with a correlation coefficient (r2) that will range between 0 and1 (Figs 1 and 3). When fitting a linear regression, the more points that are collected the morepredictive it becomes, resulting in a higher r2 and a more accurate measurement of metabolism(Fig. 3). The r2 can be interpreted as the ratio between what the linear regression can explain SR,and the total variation, ST. The total variation is the sum of what the regression cannot explain(error, SE) plus the regression, SR:
r2 = SR
(SR + SE
)−1(1)
In addition to the number of points used for the regression, another important factor is theslope. With time invariant noise, a steep slope provides a larger r2, as the signal (slope) is rel-atively higher than the noise. When one has few measurements, the slope is more difficult todetermine from the noise, so r2 can be low (Cornell & Berger, 1987).
R E S P I RO M E T RY E X P E R I M E N TA L C O N S TA N TThe amount of unexplained variance in a particular experiment can be found by plotting
the decrease in per cent oxygen during the measurement as x-values and r2 as y-values of
© 2016 The Fisheries Society of the British Isles, Journal of Fish Biology 2016, 88, 51–64
56 M . B . S . S V E N D S E N E T A L.
r2
1·0
0·8
0·6
0·4
0·2
00 50 100 150
Measurement time (s)200 250 300
0·010
0·005
0
–0·005
–0·010
–0·015
Slop
e (δ
pO2δ
t–1)
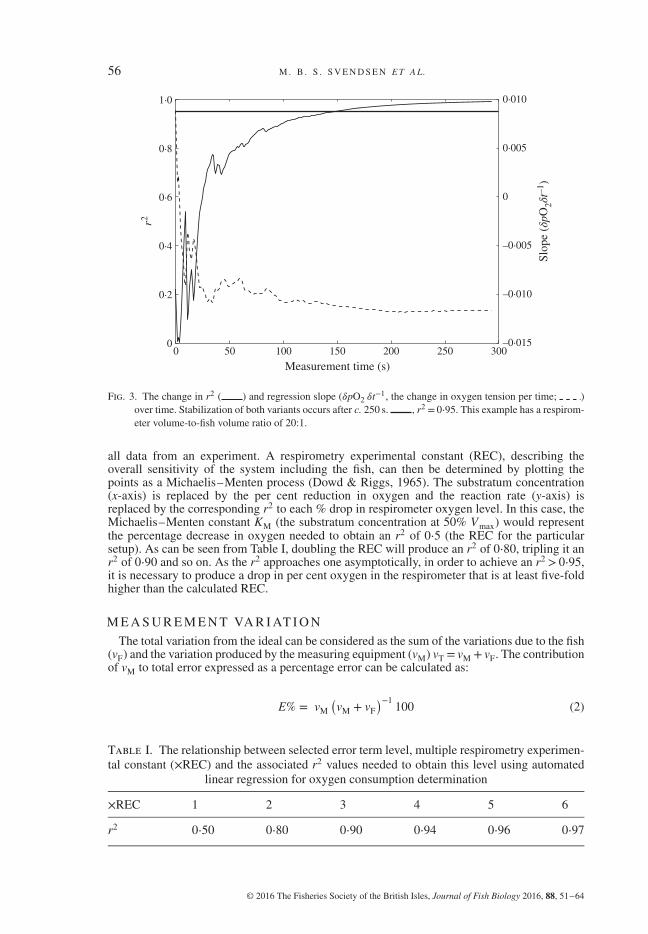
Fig. 3. The change in r2 ( ) and regression slope (𝛿pO2 𝛿t−1, the change in oxygen tension per time; )over time. Stabilization of both variants occurs after c. 250 s. , r2 = 0⋅95. This example has a respirom-eter volume-to-fish volume ratio of 20:1.
all data from an experiment. A respirometry experimental constant (REC), describing theoverall sensitivity of the system including the fish, can then be determined by plotting thepoints as a Michaelis–Menten process (Dowd & Riggs, 1965). The substratum concentration(x-axis) is replaced by the per cent reduction in oxygen and the reaction rate (y-axis) isreplaced by the corresponding r2 to each % drop in respirometer oxygen level. In this case, theMichaelis–Menten constant KM (the substratum concentration at 50% Vmax) would representthe percentage decrease in oxygen needed to obtain an r2 of 0⋅5 (the REC for the particularsetup). As can be seen from Table I, doubling the REC will produce an r2 of 0⋅80, tripling it anr2 of 0⋅90 and so on. As the r2 approaches one asymptotically, in order to achieve an r2 > 0⋅95,it is necessary to produce a drop in per cent oxygen in the respirometer that is at least five-foldhigher than the calculated REC.
M E A S U R E M E N T VA R I AT I O N
The total variation from the ideal can be considered as the sum of the variations due to the fish(vF) and the variation produced by the measuring equipment (vM) vT = vM + vF. The contributionof vM to total error expressed as a percentage error can be calculated as:
E% = vM
(vM + vF
)−1100 (2)
Table I. The relationship between selected error term level, multiple respirometry experimen-tal constant (×REC) and the associated r2 values needed to obtain this level using automated
linear regression for oxygen consumption determination
×REC 1 2 3 4 5 6
r2 0⋅50 0⋅80 0⋅90 0⋅94 0⋅96 0⋅97
© 2016 The Fisheries Society of the British Isles, Journal of Fish Biology 2016, 88, 51–64
VA R I AT I O N I N I N T E R M I T T E N T- F L OW R E S P I RO M E T RY 57
In order to gauge the magnitude of vM in response to different RFRs and measurement times,the measurement error was calculated using the average variance determined in the R. rutilusexperiments as a proxy for vF and the average variance from the simulated fish experiments asan approximate value of vM.
S TAT I S T I C S
Statistical analysis was conducted in SPSS (IBM Corp. Released 2013. IBM SPSS Statisticsfor Windows, Version 22.0; www.ibm.com). Levene’s test (Brown & Forsythe, 1974) was usedto test for equality of the variances and paired t-test for means between treatments. Tests wereconsidered significant at P< 0⋅05. Values listed in texts and figures are mean± s.d.
RESULTS
E F F E C T O F T H E R E S P I RO M E T E R VO L U M E O N S M RE S T I M AT I O N
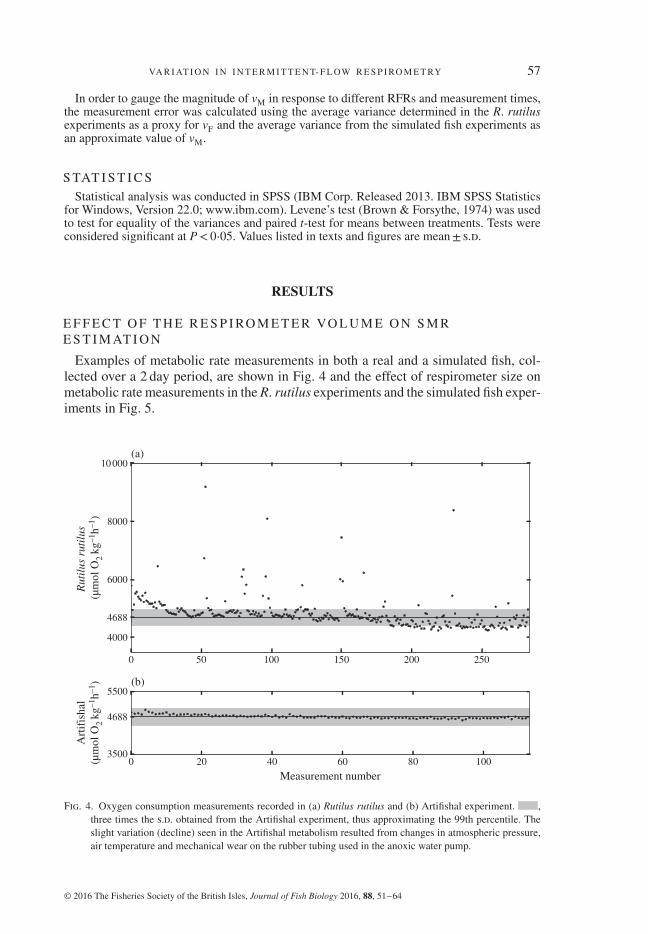
Examples of metabolic rate measurements in both a real and a simulated fish, col-lected over a 2 day period, are shown in Fig. 4 and the effect of respirometer size onmetabolic rate measurements in the R. rutilus experiments and the simulated fish exper-iments in Fig. 5.
10 000
8000
6000
4688
4688
5500
3500
4000
Measurement number
0 50 100 150 200 250
0 20 40 60 80 100
Art
ifis
hal
(μm
ol O
2 kg
–1h–1
)R
util
us r
util
us
(μm
ol O
2 kg
–1h–1
)
(a)
(b)
Fig. 4. Oxygen consumption measurements recorded in (a) Rutilus rutilus and (b) Artifishal experiment. ,three times the s.d. obtained from the Artifishal experiment, thus approximating the 99th percentile. Theslight variation (decline) seen in the Artifishal metabolism resulted from changes in atmospheric pressure,air temperature and mechanical wear on the rubber tubing used in the anoxic water pump.
© 2016 The Fisheries Society of the British Isles, Journal of Fish Biology 2016, 88, 51–64

58 M . B . S . S V E N D S E N E T A L.
Rel
ativ
e fr
eque
ncy
0·06(a) (b)
0·05
0·04
0·03
0·02
0·01
0
Rel
ativ
e fr
eque
ncy
0·06
0·05
0·04
0·03
0·02
0·01
00 1000 2000 3000 4000 5000 4640 4660 4680 4700 4720 4740
Oxygen consumption (μmol O2 kg–1h–1)
Fig. 5. (a) The frequency distributions from Artifishal experiments where oxygen consumption rate was set totwo different values and conducted in a small (respirometer-to-fish volume ratio, RFR, 26:1, ) and large(RFR= 39:1, dotted line) respirometer. A single Rutilus rutilus experiment with similar SMR in a small(RFR= 20:1) respirometer ( ) is included for comparison. Due to the overlapping graphics and differ-ences in scaling between the lines, (b) is shown. In (b), the x-axis is changed to visualize the results between4000 and 5000 μmol O2 kg−1 h−1 range. The Artifishal experiments are small (RFR= 26:1, ) and large(RFR= 39:1, ) respirometer. Due to the expanded x-axis scaling, the single Rutilus rutilus experimentappears as an apparently horizontal line ( ).
While SMR (4979⋅6± 288⋅5 μmol O2 kg−1 h−1) of the R. rutilus in the smallrespirometer (Table II) was not significantly different from SMR determined in thelarge chamber (4678⋅5± 445⋅3 μmol O2 kg−1 h−1), the variance of the two group’soxygen consumption measurements was statistically different (P< 0⋅001, F1,12 = 43⋅1,Levene’s test), with the latter having the largest variation. In addition, there was a sig-nificant difference in the means of the r2 values between the two treatments (Table II),with the smallest respirometer having the highest values.
Table II. Oxygen consumption (MO2), s.d., r2 and respirometer volume-to-fish volume ratio(RFR) of Rutilus rutilus (n= 7) with a mean± s.d. body mass of 23⋅1± 3⋅6 g measured inrespirometers with a volume of 0⋅6 or 0⋅9 l. Significant differences between the two sizes are
noted
Respirometervolume (l)
Mean± s.d. MO2
(μmol O2 kg−1 h−1) r2 RFR
0⋅6 4979⋅6± 288⋅5 0⋅997± 0⋅000 26⋅20⋅9 4678⋅5± 445⋅3 0⋅987± 0⋅004 39P <0⋅001 <0⋅01 <0⋅001
© 2016 The Fisheries Society of the British Isles, Journal of Fish Biology 2016, 88, 51–64
VA R I AT I O N I N I N T E R M I T T E N T- F L OW R E S P I RO M E T RY 59
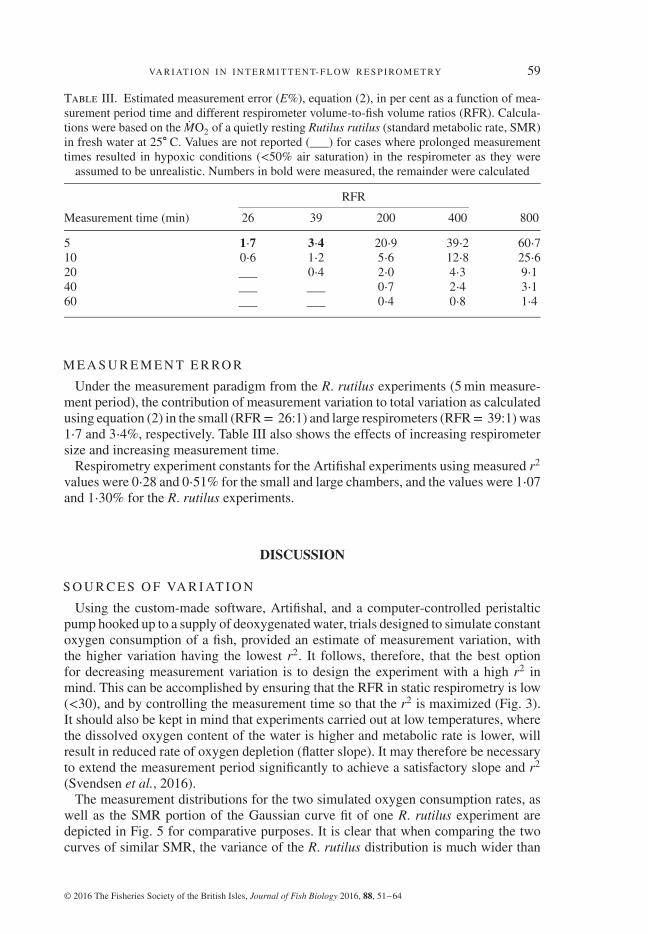
Table III. Estimated measurement error (E%), equation (2), in per cent as a function of mea-surement period time and different respirometer volume-to-fish volume ratios (RFR). Calcula-tions were based on the MO2 of a quietly resting Rutilus rutilus (standard metabolic rate, SMR)in fresh water at 25∘ C. Values are not reported (___) for cases where prolonged measurementtimes resulted in hypoxic conditions (<50% air saturation) in the respirometer as they were
assumed to be unrealistic. Numbers in bold were measured, the remainder were calculated
RFR
Measurement time (min) 26 39 200 400 800
5 1⋅7 3⋅4 20⋅9 39⋅2 60⋅710 0⋅6 1⋅2 5⋅6 12⋅8 25⋅620 ___ 0⋅4 2⋅0 4⋅3 9⋅140 ___ ___ 0⋅7 2⋅4 3⋅160 ___ ___ 0⋅4 0⋅8 1⋅4
M E A S U R E M E N T E R RO R
Under the measurement paradigm from the R. rutilus experiments (5 min measure-ment period), the contribution of measurement variation to total variation as calculatedusing equation (2) in the small (RFR= 26:1) and large respirometers (RFR= 39:1) was1⋅7 and 3⋅4%, respectively. Table III also shows the effects of increasing respirometersize and increasing measurement time.
Respirometry experiment constants for the Artifishal experiments using measured r2
values were 0⋅28 and 0⋅51% for the small and large chambers, and the values were 1⋅07and 1⋅30% for the R. rutilus experiments.
DISCUSSION
S O U R C E S O F VA R I AT I O N
Using the custom-made software, Artifishal, and a computer-controlled peristalticpump hooked up to a supply of deoxygenated water, trials designed to simulate constantoxygen consumption of a fish, provided an estimate of measurement variation, withthe higher variation having the lowest r2. It follows, therefore, that the best optionfor decreasing measurement variation is to design the experiment with a high r2 inmind. This can be accomplished by ensuring that the RFR in static respirometry is low(<30), and by controlling the measurement time so that the r2 is maximized (Fig. 3).It should also be kept in mind that experiments carried out at low temperatures, wherethe dissolved oxygen content of the water is higher and metabolic rate is lower, willresult in reduced rate of oxygen depletion (flatter slope). It may therefore be necessaryto extend the measurement period significantly to achieve a satisfactory slope and r2
(Svendsen et al., 2016).The measurement distributions for the two simulated oxygen consumption rates, as
well as the SMR portion of the Gaussian curve fit of one R. rutilus experiment aredepicted in Fig. 5 for comparative purposes. It is clear that when comparing the twocurves of similar SMR, the variance of the R. rutilus distribution is much wider than
© 2016 The Fisheries Society of the British Isles, Journal of Fish Biology 2016, 88, 51–64

60 M . B . S . S V E N D S E N E T A L.
that of the simulated fish. This indicates that, in this case, the animal is the major sourceof variation in oxygen consumption and not the experimental setup.
It can also be seen from Figs 4 and 5 that there is nonetheless a certain error in theArtifishal setup, as MO2 decreased slightly over time, although initial testing of thesystem showed no change in injected water mass and oxygen content over the courseof the experiment. Over prolonged test periods, the tygon tubing on the peristaltic pumpwears down, which introduces variation in the amount of injected water. Small changesin room temperature and barometric pressure will also alter the solubility of oxygen inthe injected water and thus create a certain variance, which in this experiment was notquantified. Given the sources of variation in the Artifishal setup, the real measurementerror must therefore be even lower.
Since SA and behaviour are not experimental variables that can be controlled fully,they can only be minimized by reducing external sources of disturbance. As is reflectedin Fig. 4, the R. rutilus, similar to O. mykiss, is a fairly calm fish that settles down inthe respirometer and remains so, with relatively infrequent bouts of SA.
The r2 value of the linear regression provides a useful tool for assessing quality ofoxygen consumption determinations. In published papers where it has been noted, it isoften the case that only measurements with r2 higher than 0⋅90 and 0⋅95 are used incalculations, or that measurement times have been adjusted to obtain a given decrease inoxygen content (Behrens & Steffensen, 2007; Casselman et al., 2012; Svendsen et al.,2013). Forstner (1983) proposed that measurement times should be set to produce adrop in oxygen content of 10%. Using this as a rough guide, it can be seen from Fig. 6(a)that a 10% drop in oxygen content would result in a r2 value of at least 0⋅98 at thehighest calculated error level (1% unexplained error line). Thus, using this decreasein oxygen content as a set point will provide determinations of high r2 even with afair amount of noise. At lower noise levels, a smaller decrease in oxygen content canbe used, as long as the r2 remains high. Rather than choosing an arbitrary per centdrop in oxygen as a basis for setting the measurement time of the data collection cycle,an r2 value should be chosen that is acceptable, 0⋅95 perhaps, and the data collectioninterval set for a time period sufficient to achieve that goal. By calculating a system’sREC after the first experiment, this can be done. An REC value of 0⋅28% for smallrespirometers and 0⋅51% for the larger respirometers reflects the fact that a larger RFRproduces increased variation, which will therefore require a more substantial drop inper cent oxygen to achieve the same r2 (i.e. 0⋅28% reduction in oxygen for an r2 of0⋅5 in the small respirometer v. 0⋅51% for the larger respirometer). Multiplying theREC by 5 (c.f. Table I) will produce a reduction in per cent oxygen large enough toproduce an r2 > 0⋅96 so that the measurement period should be long enough for thedecrease in oxygen to exceed this threshold. As exemplified in Table III and Figs 3 and6, however, extending the measurement time to produce a further reduction in oxygenin the chamber will only nominally increase the r2.
As unexplained variance of the regression is determined by the slope of the regressionand the noise around the mean, a regression can be obtained with a low slope and lownoise that has the same unexplained variance as a determination with a high slope withhigh noise (see Figs 1, 3 and 6). Thus, oxygen consumption determinations with lowr2 values should not be used. A minimum threshold for r2 should be set (at least 0⋅95)and all MO2 values below the r2 threshold discarded. Likewise, using long runningmeans on raw oxygen data during or after an experiment can make r2 appear largerby smoothing both data and noise (moving points upwards in parallel to the y-axis in
© 2016 The Fisheries Society of the British Isles, Journal of Fish Biology 2016, 88, 51–64
VA R I AT I O N I N I N T E R M I T T E N T- F L OW R E S P I RO M E T RY 61r2
1·02
1·00
0·98
0·96
0·94
0·92
0·90
1·0
0·9
0·8
0·7
0·6
0·5
0·4
0·88
0·86
0 2 4 6 8 10 12 14
Decrease in O2 (%)
(a)
(b)
0 5 10 15 20 25
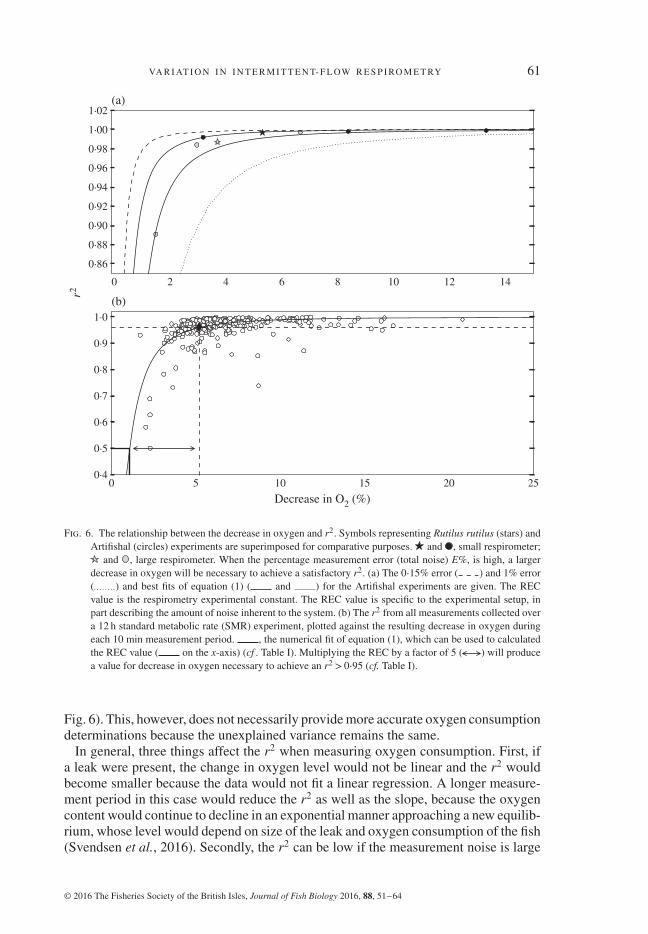
Fig. 6. The relationship between the decrease in oxygen and r2. Symbols representing Rutilus rutilus (stars) andArtifishal (circles) experiments are superimposed for comparative purposes. and , small respirometer;
and , large respirometer. When the percentage measurement error (total noise) E%, is high, a largerdecrease in oxygen will be necessary to achieve a satisfactory r2. (a) The 0⋅15% error ( ) and 1% error( ) and best fits of equation (1) ( and ) for the Artifishal experiments are given. The RECvalue is the respirometry experimental constant. The REC value is specific to the experimental setup, inpart describing the amount of noise inherent to the system. (b) The r2 from all measurements collected overa 12 h standard metabolic rate (SMR) experiment, plotted against the resulting decrease in oxygen duringeach 10 min measurement period. , the numerical fit of equation (1), which can be used to calculatedthe REC value ( on the x-axis) (cf . Table I). Multiplying the REC by a factor of 5 ( ) will producea value for decrease in oxygen necessary to achieve an r2 > 0⋅95 (cf. Table I).
Fig. 6). This, however, does not necessarily provide more accurate oxygen consumptiondeterminations because the unexplained variance remains the same.
In general, three things affect the r2 when measuring oxygen consumption. First, ifa leak were present, the change in oxygen level would not be linear and the r2 wouldbecome smaller because the data would not fit a linear regression. A longer measure-ment period in this case would reduce the r2 as well as the slope, because the oxygencontent would continue to decline in an exponential manner approaching a new equilib-rium, whose level would depend on size of the leak and oxygen consumption of the fish(Svendsen et al., 2016). Secondly, the r2 can be low if the measurement noise is large
© 2016 The Fisheries Society of the British Isles, Journal of Fish Biology 2016, 88, 51–64

62 M . B . S . S V E N D S E N E T A L.
compared with the decline in oxygen level (i.e. a low signal-to-noise ratio). In Fig. 1for instance, the linear decline in oxygen content was due to the fish and the noise wasthe variability in the oxygen trace itself. How the r2 and linear regression slope of theexperiment in Fig. 1 changed as the measurement period progressed is plotted in Fig. 3.Clearly, as the measurement time increased, the decline in oxygen content increasedthus increasing the signal-to-noise ratio. Along with the higher drop in oxygen, moredata points are sampled, both improving the r2, up to a point. Lastly, low r2 values canoccur owing to random periods of short-term increases in oxygen consumption due toSA. This will result in a non-linear change in oxygen depletion and therefore a smallerr2. Unfortunately while there are some steps the experimenter can take to reduce theexternal stimulation of the fish in the metabolic chamber, SA is often a characteristicof the fish itself.
R E S P I RO M E T E R VO L U M E- T O- F I S H VO L U M E R AT I O
Using an excessively large volume of water compared with the oxygen consump-tion, i.e. a large RFR, combined with an insufficiently long measurement period woulddecrease the signal-to-noise ratio, and is the primary cause of a low r2. The largevolume of water acts as an oxygen reservoir or bank that the fish has to consumein order for the decline in oxygen to be large enough for the experimenter to reli-ably determine metabolism. The R. rutilus experiment showed that a minor increase inrespirometer volume had a negative effect on the precision of the SMR measurement,thus using excessively large static respirometer volumes (e.g. RFR> 200) should beavoided whenever possible.
The results demonstrate that less than a doubling of RFR from 26 to 39 has significanteffects on the variation and r2 in measured metabolic rates in the R. rutilus experiment.With this in mind, caution must be taken about interpreting literature reports whereRFRs are extremely large [e.g. RFR c. 3⋅4–3499 (Graham & Baird, 1984) and RFR c.110–999 (Urbina et al., 2011)]. For instance, based on the reported oxygen consump-tion by Wardle et al. (1996), it can be calculated that a measuring period of>10 h wouldbe needed to reach a decline of 10%, leading to a conclusion that the measurementscan only reflect routine oxygen consumption. In theory, measurement error associatedwith large RFR can be reduced by increasing the measurement time to achieve a sub-stantial enough decrease in oxygen content and a measurement with high r2. A singlemeasurement point that is calculated over a period of 1 h or more, however, may not berepresentative for a resting state of a fish, but rather expresses a combination of restingand routine metabolic rates. Thus, to get improved temporal resolution, it is importantto achieve an appropriate RFR. Trying to correct for a large RFR with a long mea-surement period will presumably reduce scatter in MO2 associated with SA during themeasurement period (Nyquist, 1928; Shannon, 1949).
Design constraints inherent to swimming respirometers (Wardle et al., 1996) make itdifficult to produce systems with RFRs lower than 150–200. As active metabolic rateis typically five to ten times higher than SMR, determination of oxygen consumptionrates at higher swimming speeds is more precise. At low swimming speeds, however,it is necessary to use extended measurement periods to obtain satisfactory r2 valuesdue to the lower metabolism. It is important to note, therefore, that most swimmingrespirometry protocols (Brett, 1964) utilize identical measurement periods at all swim-ming speeds. As a consequence, metabolic rates determined at low swimming speeds
© 2016 The Fisheries Society of the British Isles, Journal of Fish Biology 2016, 88, 51–64
VA R I AT I O N I N I N T E R M I T T E N T- F L OW R E S P I RO M E T RY 63
in large respirometers will results in lower r2 and thus less precise oxygen consump-tion values. For these reasons, RFR values of higher than c. 500 should be avoided inswim tunnel respirometry [e.g. RFR c. 630 (Wardle et al., 1996), RFR c. 720 (Payneet al., 2015), RFR c. 5100 (Dewar & Graham, 1994) or RFR c. 17 000 (Graham et al.,1990)].
In summary, whenever possible, it is advisable to avoid large respirometer-to-fishvolumes, as detecting a decrease in oxygen tension requires a longer measurementperiod. As a single measurement period will provide the average metabolism duringthis time, the longer the period, the more likely SA can occur. Further, the larger therespirometer used, the smaller the signal-to-noise ratio (O2 decrease- to-noise) due tothe oxygen reservoir problem. In order to ensure the veracity of the oxygen consump-tion measurement, therefore, the coefficient of determination, r2, should be used. Asa rule of thumb, this measure should be above 0⋅95 (REC× c. 5) to be certain of theprecision of the determined oxygen consumption (slope of the linear regression).
References
Beamish, F. W. H. & Mookherjii, P. S. (1964). Respiration of fishes with special emphasison standard oxygen consumption: I. Influence of weight and temperature on respira-tion of goldfish, Carassius auratus l. Canadian Journal of Zoology 42, 161–175. doi:10.1139/z64-015
Behrens, J. W. & Steffensen, J. F. (2007). The effect of hypoxia on behavioural and physiologicalaspects of lesser sandeel, Ammodytes tobianus (Linnaeus, 1785). Marine Biology 150,1365–1377. doi: 10.1007/s00227-006-0456-4
Brett, J. R. (1964). The relation of size to rate of oxygen consumption and sustained swimmingspeed of sockeye salmon (Oncorhynchus nerka). Journal of the Fisheries Research Boardof Canada 22, 1491–1501.
Brown, M. B. & Forsythe, A. B. (1974). Robust tests for the equality of variances. Journal ofthe American Statistical Association 69, 364–367. doi: 10.2307/2285659
Casselman, M. T., Anttila, K. & Farrell, A. P. (2012). Using maximum heart rate asa rapid screening tool to determine optimum temperature for aerobic scope inPacific salmon Oncorhynchus spp. Journal of Fish Biology 80, 358–377. doi:10.1111/j.1095-8649.2011.03182.x
Chabot, D., Steffensen, J. F. & Farrell, A. P. (2016). The determination of standard metabolicrate in fishes. Journal of Fish Biology (in press, this issue).
Cornell, J. A. & Berger, R. D. (1987). Factors that influence the value of the coefficient of deter-mination in simple linear and nonlinear regression models. Phytopathology 77, 63–70.
Dewar, H. & Graham, J. (1994). Studies of tropical tuna swimming performance in a large watertunnel - energetics. Journal of Experimental Biology 192, 13–31.
Dowd, J. E. & Riggs, D. S. (1965). A comparison of estimates of Michaelis-Menten kineticconstants from various linear transformations. Journal of Biological Chemistry 249,863–869.
Ege, R. & Krogh, A. (1914). On the relation between the temperature and the respiratoryexchange in fishes. Internationale Revue der gesamten Hydrobiologie und Hydrographie7, 48–55. doi: 10.1002/iroh.19140070105
Eriksen, N. T. (2002). Accuracy and precision of aquatic respirometers with empha-sis on monophase oxystats. Fish Physiology and Biochemistry 26, 139–147. doi:10.1023/A:1025461900063
Forstner, H. (1983). An automated multiple-chamber intermittent-flow respirometer. In Polaro-graphic Oxygen Sensors (Gnaiger, D. E. & Forstner, D. H., eds), pp. 111–126. Berlin:Springer. doi: 10.1007/978-3-642-81863-9_12
Graham, J. B. & Baird, T. A. (1984). The transition to air breathing in fishes: III. Effects ofbody size and aquatic hypoxia on the aerial gas exchange of the swamp eel Synbranchusmarmoratus. Journal of Experimental Biology 108, 357–375.
© 2016 The Fisheries Society of the British Isles, Journal of Fish Biology 2016, 88, 51–64
64 M . B . S . S V E N D S E N E T A L.
Graham, J. B., Dewar, H., Lai, N. C., Lowell, W. R. & Arce, S. M. (1990). Aspects of sharkswimming performance determined using a large water tunnel. Journal of ExperimentalBiology 151, 175–192.
Keys, A. B. (1930a). The relation of the oxygen tension in the external respiratory medium tothe oxygen consumption of fishes. Science 71, 195–196.
Keys, A. B. (1930b). The measurement of the respiratory exchange of aquatic animals. Biolog-ical Bulletin 59, 187–198.
Niimi, A. J. (1978). Lag adjustment between estimated and actual physiological responses con-ducted in flow-through systems. Journal of the Fisheries Research Board of Canada 35,1265–1269. doi: 10.1139/f78-197
Nyquist, H. (1928). Certain topics in telegraph transmission theory. Transactions of the Ameri-can Institute of Electrical Engineers 47, 617–644.
Payne, N. L., Snelling, E. P., Fitzpatrick, R., Seymour, J., Courtney, R., Barnett, A., Watanabe,Y. Y., Sims, D. W., Squire, L. & Semmens, J. M. (2015). A new method for resolvinguncertainty of energy requirements in large water breathers: the “mega-flume” seago-ing swim-tunnel respirometer. Methods in Ecology and Evolution 6, 668–677. doi:10.1111/2041-210X.12358
Scholander, P. F., Haugaard, N. & Irving, L. (1943). A volumetric respirometer for aquatic ani-mals. Review of Scientific Instruments 14, 48–51. doi: 10.1063/1.1770119
Schurmann, H. & Steffensen, J. F. (1997). Effects of temperature, hypoxia and activity onthe metabolism of juvenile Atlantic cod. Journal of Fish Biology 50, 1166–1180. doi:10.1111/j.1095-8649.1997.tb01645.x
Shannon, C. E. (1949). Communication in the presence of noise. Proceedings of the IRE 37,10–21.
Steffensen, J. F. (1989). Some errors in respirometry of aquatic breathers: how to avoid andcorrect for them. Fish Physiology and Biochemistry 6, 49–59. doi: 10.1007/BF02995809
Steffensen, J. F., Johansen, K. & Bushnell, P. G. (1984). An automated swimmingrespirometer. Comparative Biochemistry and Physiology A 79, 437–440. doi:10.1016/0300-9629(84)90541-3
Steffensen, J. F., Bushnell, P. G. & Schurmann, H. (1994). Oxygen consumption in four speciesof teleosts from Greenland: no evidence of metabolic cold adaptation. Polar Biology 14,49–54. doi: 10.1007/BF00240272
Svendsen, J. C., Banet, A. I., Christensen, R. H. B., Steffensen, J. F. & Aarestrup, K. (2013).Effects of intraspecific variation in reproductive traits, pectoral fin use and burst swim-ming on metabolic rates and swimming performance in the Trinidadian guppy (Poeciliareticulata). Journal of Experimental Biology 216, 3564–3574. doi: 10.1242/jeb.083089
Svendsen, M. B. S., Bushnell, P. G. & Steffensen, J. F. (2016). Design and setup ofintermittent-flow respirometry system for aquatic organisms. Journal of Fish Biology (inpress, this issue).
Urbina, M. A., Glover, C. N. & Forster, M. E. (2011). A novel oxyconforming response in thefreshwater fish Galaxias maculatus. Comparative Biochemistry and Physiology A 161,301–306. doi: 10.1016/j.cbpa.2011.11.011
Wardle, C. S., Soofiani, N. M., O’Neill, F. G., Glass, C. W. & Johnstone, A. D. F. (1996). Mea-surements of aerobic metabolism of a school of horse mackerel at different swimmingspeeds. Journal of Fish Biology 49, 854–862. doi: 10.1111/j.1095-8649.1996.tb00084.x
© 2016 The Fisheries Society of the British Isles, Journal of Fish Biology 2016, 88, 51–64