Embed Size (px)
Citation preview

Journal of Fish Biology (2016) 88, 26–50
doi:10.1111/jfb.12797, available online at wileyonlinelibrary.com
Design and setup of intermittent-flow respirometry systemfor aquatic organisms
M. B. S. Svendsen*†, P. G. Bushnell‡ and J. F. Steffensen*
*Marine Biological Section, Department of Biology, University of Copenhagen,Strandpromenaden 5, DK-3000 Helsingør, Denmark and ‡Department of Biological Sciences,
Indiana University South Bend, South Bend, IN 46634, U.S.A.
Intermittent-flow respirometry is an experimental protocol for measuring oxygen consumption inaquatic organisms that utilizes the best features of closed (stop-flow) and flow-through respirometrywhile eliminating (or at least reducing) some of their inherent problems. By interspersing shortperiods of closed-chamber oxygen consumption measurements with regular flush periods, accu-rate oxygen uptake rate measurements can be made without the accumulation of waste products,particularly carbon dioxide, which may confound results. Automating the procedure with easilyavailable hardware and software further reduces error by allowing many measurements to be madeover long periods thereby minimizing animal stress due to acclimation issues. This paper describessome of the fundamental principles that need to be considered when designing and carrying outautomated intermittent-flow respirometry (e.g. chamber size, flush rate, flush time, chamber mixing,measurement periods and temperature control). Finally, recent advances in oxygen probe technologyand open source automation software will be discussed in the context of assembling relatively lowcost and reliable measurement systems.
© 2015 The Fisheries Society of the British Isles
Key words: automated respirometry; metabolism; oxygen consumption.
INTRODUCTION
One hundred years after Ege & Krogh (1914) investigated the effect of temperature ongas exchange in goldfish Carassius auratus (L. 1758), the basic technique of measuringmetabolism in aquatic organisms still remains an important tool for estimating energyexpenditure in a variety of circumstances. For instance, standard metabolic rate (SMR),the minimum aerobic metabolic rate of a poikilothermic animal (at rest, post-absorptiveand non-reproducing) at a specific temperature (Beamish, 1964; Beamish & Mookher-jii, 1964; Chabot et al., 2016) is often a widely reported value in the literature of manyfields (Ultsch et al., 1981; Ultsch & Duke, 1990). It is therefore important that it ismeasured in a reliable and repeatable fashion (Clark et al., 2013). While this paperwill describe how to design an intermittent-flow respirometry system, issues relatingto fish physiology or the use of metabolic rate measurements in theoretical modellingare beyond the scope of the topic. Instead, this review focuses on some of the under-lying assumptions, technical pitfalls and limitations that affect the design and functionof an aquatic intermittent-flow respirometer.
†Author to whom correspondence should be addressed. Tel.: +45 23235265; email: [email protected]
26
© 2015 The Fisheries Society of the British Isles
H OW T O S E T U P A N AQ UAT I C R E S P I RO M E T RY S Y S T E M 27
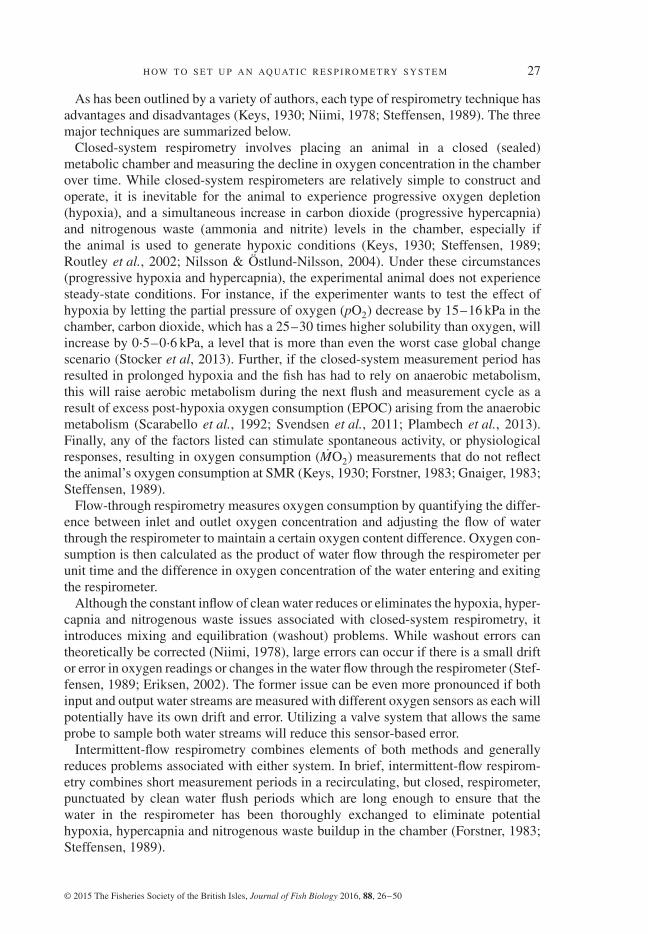
As has been outlined by a variety of authors, each type of respirometry technique hasadvantages and disadvantages (Keys, 1930; Niimi, 1978; Steffensen, 1989). The threemajor techniques are summarized below.
Closed-system respirometry involves placing an animal in a closed (sealed)metabolic chamber and measuring the decline in oxygen concentration in the chamberover time. While closed-system respirometers are relatively simple to construct andoperate, it is inevitable for the animal to experience progressive oxygen depletion(hypoxia), and a simultaneous increase in carbon dioxide (progressive hypercapnia)and nitrogenous waste (ammonia and nitrite) levels in the chamber, especially ifthe animal is used to generate hypoxic conditions (Keys, 1930; Steffensen, 1989;Routley et al., 2002; Nilsson & Östlund-Nilsson, 2004). Under these circumstances(progressive hypoxia and hypercapnia), the experimental animal does not experiencesteady-state conditions. For instance, if the experimenter wants to test the effect ofhypoxia by letting the partial pressure of oxygen (pO2) decrease by 15–16 kPa in thechamber, carbon dioxide, which has a 25–30 times higher solubility than oxygen, willincrease by 0⋅5–0⋅6 kPa, a level that is more than even the worst case global changescenario (Stocker et al, 2013). Further, if the closed-system measurement period hasresulted in prolonged hypoxia and the fish has had to rely on anaerobic metabolism,this will raise aerobic metabolism during the next flush and measurement cycle as aresult of excess post-hypoxia oxygen consumption (EPOC) arising from the anaerobicmetabolism (Scarabello et al., 1992; Svendsen et al., 2011; Plambech et al., 2013).Finally, any of the factors listed can stimulate spontaneous activity, or physiologicalresponses, resulting in oxygen consumption (MO2) measurements that do not reflectthe animal’s oxygen consumption at SMR (Keys, 1930; Forstner, 1983; Gnaiger, 1983;Steffensen, 1989).
Flow-through respirometry measures oxygen consumption by quantifying the differ-ence between inlet and outlet oxygen concentration and adjusting the flow of waterthrough the respirometer to maintain a certain oxygen content difference. Oxygen con-sumption is then calculated as the product of water flow through the respirometer perunit time and the difference in oxygen concentration of the water entering and exitingthe respirometer.
Although the constant inflow of clean water reduces or eliminates the hypoxia, hyper-capnia and nitrogenous waste issues associated with closed-system respirometry, itintroduces mixing and equilibration (washout) problems. While washout errors cantheoretically be corrected (Niimi, 1978), large errors can occur if there is a small driftor error in oxygen readings or changes in the water flow through the respirometer (Stef-fensen, 1989; Eriksen, 2002). The former issue can be even more pronounced if bothinput and output water streams are measured with different oxygen sensors as each willpotentially have its own drift and error. Utilizing a valve system that allows the sameprobe to sample both water streams will reduce this sensor-based error.
Intermittent-flow respirometry combines elements of both methods and generallyreduces problems associated with either system. In brief, intermittent-flow respirom-etry combines short measurement periods in a recirculating, but closed, respirometer,punctuated by clean water flush periods which are long enough to ensure that thewater in the respirometer has been thoroughly exchanged to eliminate potentialhypoxia, hypercapnia and nitrogenous waste buildup in the chamber (Forstner, 1983;Steffensen, 1989).
© 2015 The Fisheries Society of the British Isles, Journal of Fish Biology 2016, 88, 26–50

28 M . B . S . S V E N D S E N E T A L.
One period (loop)
WaitFlush Measure
Chamber closed
Fig. 1. During intermittent-flow respirometry, one complete measurement cycle (loop) consists of three timingperiods: the flush period where the chamber is open (i.e. water is flowing through it) followed by two closedperiods, wait and measure, when the flush pump is off. A short wait period is needed before the measurementperiod to allow all the water in the chamber to mix and the oxygen content to begin declining in a linearfashion. Data from measurement period are used for determining the oxygen consumption of the organism.
While this method is the best approach currently available for measuring oxygenconsumption, it does require more equipment and a slightly more complex exper-imental setup than closed respirometry. The remainder of this paper will thereforefocus on some of the factors that should be considered when using intermittent-flowrespirometry.
CALCULATING OXYGEN CONSUMPTION (MO2) USINGINTERMITTENT-FLOW RESPIROMETRY
Intermittent-flow respirometry is a series of short-term, closed respirometry experi-ments, interrupted by flushing intervals to replace the respirometer water. One completemeasurement cycle (loop) will therefore consist of an open-system flush period anda closed-system, metabolism determination cycle, which itself is made up of a waitperiod and a measurement period (Fig. 1; see list of abbreviations in Appendix):
tperiod = tf + tw + tm (1)
Changes in oxygen content in the chamber during a complete measurement cycle areillustrated in Fig. 2. When there is no organism present in the respirometer, the air sat-uration of the water should approach 100% [Fig. 2(a)]. Once an animal is introducedinto the chamber, the oxygen level in the chamber will drop to a new, lower equilib-rium level, even though the flush pump is still on [Fig. 2(b)]. The magnitude of thedecline will be dependent on the size of the chamber, the flush rate and the organism’smetabolic rate. When carrying out an experiment in normoxia, it is recommended thatthe chamber water air saturation is above 90% at the end of the flushing period, andthat it does not decline to <80% saturation at the end of the measuring period lest theanimal become hypoxic and stressed. Once the flush pump is turned off, oxygen con-tent in the respirometer will begin to fall in a linear fashion [Fig. 2(c)] until the flushpump is reactivated, at which point the oxygen level in the chamber should rise in anexponential manner [Fig. 2(d)] eventually reaching the pre-measurement period levels[Fig. 2(b)]. When the flush pump is off during the measurement cycle [Fig. 2(c)], themetabolic chamber is functionally closed, so the data points collected during the linear
© 2015 The Fisheries Society of the British Isles, Journal of Fish Biology 2016, 88, 26–50

H OW T O S E T U P A N AQ UAT I C R E S P I RO M E T RY S Y S T E M 29
100O
xyge
n (%
air
sat
urat
ion)
Time (s)
Flush pump on
Flush pump off
Animal in chamber
(a)(b)
(c) (d)
90
200 400 600 800 1000 1200 1400 1600 1800
Fig. 2. Ideally, an intermittent-flow respirometry experiment should consist of a series of linear declines in oxy-gen content during the measurement period interrupted by exponential increases during the flush period.Before an organism is placed in the chamber, oxygen levels should be near air saturation (a) and will declineslightly and reach a new equilibrium after the animal is introduced (b). Once the flush pump is turned off, alinear decline in oxygen levels should occur (c), the slope of which is used to calculate oxygen consumption.Turning the flush pump back on should cause oxygen levels in the chamber to increase in an exponentialfashion (D).
decline can be used to calculate the oxygen consumption rate using the same formulaapplied to closed-system respirometry (Steffensen, 1989) specifically:
y = VREW−1o
dCO2
dt(2)
where y is MO2, VRE is the effective respirometer volume (l) of water in the respirom-eter (calculated as total respirometer volume minus the organism volume), Wo is themass of the organism and 𝛿CO2
𝛿tis the slope of the linear decrease in oxygen content
during the time the chamber is closed [Fig. 2(c)]. Once the flush pump is turned off,there is a small period of time during which the flush water and chamber water mixcompletely and a new equilibrium is established. The decline in chamber oxygen dur-ing this period is often initially non-linear, due to mixing in the respirometer and dueto the response time of the oxygen sensor, so a wait period (tw; equation 1) shouldbe introduced into the measurement cycle before data for the oxygen consumptionmeasurement is collected.
When the organism is placed into the respirometer, a volume of water equivalent tothe organism’s volume will be displaced so the respirometer volume used in calculatingoxygen consumption must be reduced accordingly. Because measuring the actual vol-ume of the organism is often difficult and stressful for the organism (and experimenter),a reasonable approximation of VRE is calculated using the formula:
VRE = VRT − Wo𝜌−1o (3)
© 2015 The Fisheries Society of the British Isles, Journal of Fish Biology 2016, 88, 26–50

30 M . B . S . S V E N D S E N E T A L.
where VRT is the total volume (l) of the empty respirometer including the recircula-tion loop and 𝜌o is the density of the organism. If it is assumed that the animal isneutrally buoyant, then 𝜌o is equal to the density of the water which can range between1⋅000 kg l−1 in fresh water and 1⋅025 kg l−1 in full strength seawater as density is depen-dent on both salinity and temperature (Fofonoff, 1985). For the sake of expediency,especially with fishes, it is a common practice to simply subtract the mass of the fishin kg from the volume of the respirometer in l to arrive at a reasonable measure of VREas most fish species can be assumed to be neutrally buoyant.
Finally, depending on the type of oxygen monitoring equipment in use, the output ofthe instrument may measure the change in pO2 rather than oxygen content or concen-tration. In this case, the value will have to be converted to concentration units, therebyaltering equation (2) to be:
y = 𝛽O2VREW−1o
𝛿pO2
𝛿t(4)
where 𝛽O2 is the oxygen solubility at the given temperature, salinity and atmosphericpressure, and 𝛿pO2 is the change in partial pressure of oxygen in the chamber.Tables for determining for 𝛽O2 are available from a variety of sources both inprint (Green & Carritt, 1967; Benson & Krause, 1984; Garcia & Gordon, 1992)and online (water.usgs.gov/software/DOTABLES/) and at the Aquaresp homepage(www.aquaresp.com/oxygen).
C A L C U L AT I O N A S S U M P T I O N S
Inherent in the application of equations (2–4) are the following assumptions: (1)complete water mixing occurs in the respirometer (equations 2 and 4); (2) oxygen sol-ubility is constant (equations 2 and 4) (temperature, atmospheric pressure and salinityare constant); (3) mass of organism is constant (equations 2 and 4); (4) volume of therespirometer is constant (equations 2–4) (density and mass of organism are constant).Water mixing in the respirometer is a common problem and is considered separately.While it is rare that any of the values from atmospheric pressure through to mass ofthe organism will change during a single experimental cycle, it is not unusual for smallchanges to occur in these values over the course of a 2–3 day experiment. Clearlythen, the figures used in calculating oxygen consumption would need to be adjustedto reflect this, in order to measure metabolic rate accurately. For practical reasons andif not obviously wrong, some factors must be assumed to be constant, i.e. density ofthe organism, salinity of the water and volume of the respirometer. If for some rea-son it is suspected that the organism is losing a significant amount of mass duringthe experiment, then it should be taken into account, and as effective respirometerwater volume (VRE) depends on fish mass as well, the volume of the respirometershould also be corrected (E. F. Christensen, M. B. S. Svendsen & J. F. Steffensen,unpubl. data).
In instruments that give a choice in how the oxygen measurement is recorded (e.g.content, % saturation or other pO2), it must be kept in mind the relationship betweenoxygen content in the water and partial pressure of oxygen in the air, which is summa-rized by Henry’s law and can be described as (Hastala & Berger, 1996): CO2 = 𝛽O2pO2.
© 2015 The Fisheries Society of the British Isles, Journal of Fish Biology 2016, 88, 26–50

H OW T O S E T U P A N AQ UAT I C R E S P I RO M E T RY S Y S T E M 31
Changes in atmospheric pressure over the course of the experiment will alter pO2in the air above the water, while temperature and salinity changes will alter 𝛽O2 [e.g.increasing temperature and salinity will decrease oxygen solubility (𝛽O2)]. These areall issues that affect the oxygen solubility used in equation (4); temperature and salinitywill probably have an effect on the metabolism of the organism as well. Logging thedata in kPa, mmHg or % saturation units will reflect the changes in atmospheric pres-sure and allow the experimenter to apply their own solubility coefficient in equation(4) and correct for changes in temperature or salinity.
L I N E A R R E G R E S S I O N
Assuming that oxygen consumption is constant during the measurement period,a linear regression relating the change in oxygen content over time can be usedto calculate the rate of oxygen decline (slope) during the measurement period:CO2 (t) =
𝛿CO2
𝛿tt + b. As this formula describes a line in the form of Y =mX + b, Y
(CO2) would be the oxygen content in the respirometer at time (t), m(
𝛿CO2
𝛿t
)is the
slope, X (t) is time and b is where the fitted regression line intersects the y-axis at time0 (i.e. the starting level of the CO2 at the end of the wait period). Since the time (t)and CO2 depend on the units of time (e.g. s, min or h), oxygen content (e.g. mg O2 orml O2) and partial pressure (e.g. mmHg or kPa) used, the slope and thus the oxygenconsumption will have that same unit. Methods for fitting a linear regression to thedecline in oxygen are typically included in freely available software packages such asR (www.r-project.org) and Python (www.python.org) or commercial software such asMicrosoft Excel (www.microsoftstore.com). In addition to the linear regression outputmost software packages provide a term describing the goodness of fit, usually r2 for aregression coefficient between 0 and 1. While a discussion of the statistical meaningof r2 is beyond this paper, it is an important measure for evaluating the resulting slopeas it reflects how well the data fits the linear regression. In the case of respirometry,the r2 statistic is important in determining whether the chamber CO2 (or pO2) fell in alinear fashion over the measurement period. An r2 of 1 is the ideal as it indicates thatall the data points fit on a straight line and there is no deviation from the predicted dropof oxygen. If the r2 is below 0⋅9 (or 0⋅95), it means that >10% (or 5%) of the variancein measured CO2 (or pO2) cannot be explained by the linear model. In general, anr2 < 1 can be attributed to four general causes. (1) A leak that allows new oxygeninto the chamber. In this case, the r2 will be reduced as the change in oxygen contentin the chamber will not be linear, but more likely exponential in nature (dotted line;Fig. 3) as it is essentially a small oxygen washin (Steffensen, 1989). Interestingly,with this type of error, increasing the measurement period will further decrease the r2
as the oxygen decline trace will be exponentially levelling off to a new equilibrium[Fig. 2(b)]. This has to be solved by finding the leak and removing it. (2) Biologicallyproduced alterations in metabolism during the measurement period. This can occurwhen the organism’s activity level changes during the metabolism measurement periodand is usually due to movement or restlessness in a static respirometer during SMRexperiments or inconsistent swimming speed during active metabolism measurements.Reducing the measurement period will sometimes help in this regard as one gets amore homogeneous activity level using a shorter time period. Other steps that can betaken include setting up the experimental system in a quiet room or area, shieldingthe chamber from visual and vibratory disturbance and allowing the fish sufficient
© 2015 The Fisheries Society of the British Isles, Journal of Fish Biology 2016, 88, 26–50

32 M . B . S . S V E N D S E N E T A L.
Oxy
gen
(% a
ir s
atur
atio
n)
Time (s)1000500 1500
100
95
90
85
Fig. 3. Due to the washin of oxygen from outside the chamber, the decline in oxygen in a leaking respirometrychamber will be non-linear ( ) when compared with the expected linear decline in oxygen that occursin a tight or non-leaking chamber ( ).
acclimation time in the respirometer. (3) Measurement noise due to an unstable oxygenprobe or electrical interference in the measurement and recording system. As this willresult in low signal:noise ratio, tracking down the source of the noise and eliminatingit is important. The r2 can also be improved by either decreasing the respirometerto fish-volume ratio or by increasing the measurement period. Applying a movingaverage to the measured oxygen values will also mitigate this error to some degree.Care must be taken, however, of using a very long running average (e.g. 20 s) as it willprolong the beginning of the recorded linear decline in oxygen at the conclusion of theflush. In this case, the wait time will have to be lengthened to ensure the linear portionof the oxygen decline is truly being recorded. (4) Incomplete mixing of the water inthe chamber during the measurement period. Pockets of water that are heterogeneousin their oxygen content (low near the organism and high in other regions) will generatea highly variable decline in oxygen content over the course of the measurementwhich can dramatically reduce r2. Keeping the water well mixed in the chamberduring the measurement period when the flush pump is off will help reduce this error(Rodgers et al., 2016).
Effects of noise and chosen way of analysing data can be seen in Fig. 4. This figuredepicts the simulated differences in how data are chosen for the determination of MO2.Clearly, the automatic calculation of slopes minimizes human error and ensures that allslopes are calculated the same way, with the same data from the measurement period.This is a clear advantage of using an automated algorithm for choosing and calculatingMO2. Secondly, it demonstrates the necessity of using a linear regression with manypoints (Fig. 4). Although automation of experiments is encouraged as a means of mini-mizing human error, the experimenter must approach automation with a certain amountof caution, thus checking that the slopes are not systematically flawed (e.g. by an oxy-gen probe’s automatic temperature compensation or similar) and that the correct valuesare used in the software when calculating oxygen consumption. Automation will leadto a poor ability to understand the experimental details and data, if not approachedcorrectly.
© 2015 The Fisheries Society of the British Isles, Journal of Fish Biology 2016, 88, 26–50

H OW T O S E T U P A N AQ UAT I C R E S P I RO M E T RY S Y S T E M 33
99
(a)
(b)
98
97
96
95
10
5
0
–5
–10
2200
LR fixed LR var LR short SE SE short
2300 2400 2500
Time (s)
Air
sat
urat
ion
(%)
Dev
iatio
n fr
om tr
ue M
O2
(%)
.
2600 2700 2800
Fig. 4. This figure shows simulated respirometry data. (a) One total loop with flush (F), wait (W) and measure-ment (M) periods (F: 240 s, W: 60s and M: 300 s), cf. equation (1), at three different levels of normallydistributed random noise [ (s.d. = 0), (s.d. = 0⋅01), (s.d. = 0⋅02)]. (b) Per cent M deviationfrom true oxygen consumption (MO2) determination at the three different levels of noise, using five differ-ent methods for determining the oxygen consumption. The represent the 95% c.i., the 75%, points( ) are outliers outside the 95% c.i. and represents median values. The experiment was simulated to runfor 48 h with an MO2 of 60 mgO2 kg−1 h−1 with fish mass of 0⋅15 kg and respirometer volume of 2 l withan oxygen solubility of 10 mg l−1. LR Fixed uses the same 300 s measurement period for a linear regression[s.d. MO2 (%): 0⋅0, 0⋅28, 0⋅52; average r2: 1⋅0, 0⋅997, 0⋅992]. LR Var uses 300 s for a linear regression,but not fixed, i.e. simulating post-analysis where the linear part is chosen manually, this comes with therisk of getting points in the wait period, thus some data points will be lower [s.d. MO2 (%): 0⋅57, 0⋅65,0⋅74; average r2 (box 1, box 2, box 3): 0⋅997, 0⋅995, 0⋅988]. LR short uses 150 s for the linear regressionalso simulated to be manually chosen [s.d. MO2 (%): 2⋅29, 2⋅45, 2⋅63; average r2: 0⋅978, 0⋅970, 0⋅947].SE (start-end) represents only choosing two points to get the change in oxygen partial pressure (pO2). Thepoints are chosen in the linear part of the curve, with 300 s apart [s.d. MO2 (%): 0⋅0, 1⋅96, 3⋅74; averager2 : not applicable]. SE short simulates the same, but only 150 s between the points. [s.d. MO2 (%): 0⋅0,3⋅53, 7⋅39; average r2: not applicable].
BAC K G RO U N D R E S P I R AT I O N
Background respiration occurs when oxygen is consumed by sources other than theorganism in the chamber. In most cases, bacteria in the water or on the inner surfaces ofthe respirometer and recirculation loop tubes account for the extraneous oxygen usage.While bacteria suspended in the water column can be minimized by recirculating thewater through a UV sterilizer, and using a clean water source instead of recirculatedwater, it is impossible to prevent the buildup of bacteria on the inner surfaces of the
© 2015 The Fisheries Society of the British Isles, Journal of Fish Biology 2016, 88, 26–50

34 M . B . S . S V E N D S E N E T A L.
1·0
0·8
0·6
0·4
0·2
00 500 1000 1500 2000
Measurement time (s)
r230
35
40
0
5
10
15
–5
20
25
MO
2 ba
cter
ia (
mg
O2
h–1 k
g–1)
.
2500 3000 3500
Fig. 5. Measurement time can have an effect on both the accuracy illustrated with correlation coefficient (r2; ,) and magnitude of bacterial respiration, MO2B ( , ), measurement. When background respiration is low
( ), measurements periods in excess of an hour may be necessary to achieve an r2 ( ) above 0⋅95 ( ).With higher background metabolic rates ( ), reasonable r2 ( ) may be achieved in less time (c. 10 min).Data shown are actual measurements, the 3600 s measurements for the low bacterial load was omitted as thesetup had to be taken down to free the space for other researchers in the laboratory. The bacterial culturesare unknown; however, the water is tap water from the Elsinore Community, Denmark. Measurementswere completed at 25∘ C after teaching in a fish biology course, before the measurements of backgroundrespiration, either Rutilus rutilus or Carassius auratus had been in the respirometer (both species of fishwere held in the same holding tank). The high bacterial load was achieved by letting the bacteria grow onthe respirometer material for 3 days. The low level was completed shortly after experimentation.
chamber, pumps and tubing over time. It is, therefore, important to quantify the bac-terial contribution to the measured oxygen consumption and subtract it from the MO2measurement (Via, 1983). While this is a problem common to all experimental systems,there does not appear to be a universally accepted technique for how to measure andmathematically correct for it. It is often stated in papers, for instance, that MO2 beencorrected for background respiration, yet details of the procedure are often scant (Plam-bech et al., 2013) or entirely missing (Scarabello et al., 1992; Schurmann & Steffensen,1994; Steffensen et al., 1994; Casselman et al., 2012). Even in cases where techniquesare mentioned, they appear to vary widely. For instance, Boldsen et al. (2013) mea-sured background respiration during 1 h determination period, while Norin & Malte(2011, 2012) measured it only over the same short period (90–120 s) used for the ani-mal SMR determinations leading them to conclude that background was negligibleduring the short time interval.
When determining background respiration r2 is important to consider, as it reflects aquality control for the measurements. As illustrated in Fig. 5, extending the measure-ment time increases both r2 and the oxygen consumption in an asymptotic manner. Thisimplies that determining the background respiration using a very short measurementinterval will lead to an underestimation of the bacterial oxygen consumption. As canbe seen in Fig. 5, the longer the measurement interval, the further the CO2 drops, andbetter the signal:noise (𝛥CO2:noise) ratio becomes, thereby increasing the accuracy of
© 2015 The Fisheries Society of the British Isles, Journal of Fish Biology 2016, 88, 26–50

H OW T O S E T U P A N AQ UAT I C R E S P I RO M E T RY S Y S T E M 35
the measurement (higher r2). Clearly then, when measuring small background oxygenconsumptions, a long measurement period is needed to produce a significant declinein oxygen content and generate a precise measurement (as evaluated by r2). Generally,there is not much change in the magnitude of the background respiration measurementwhen r2 > 0⋅95, but the closer to 1⋅0 it can get, the better will be the magnitude ofthe background respiration. It is not uncommon to expect that measurement periodsexceeding hours may be necessary to accurately determine background oxygen con-sumption when it is very small. In general, it is recommended to put the time andeffort into actually quantifying the magnitude of the background metabolism over aseries of long measurement periods rather than dismissing it as negligible based onshort readings equivalent to that used for MO2 measurements on the animal.
C O R R E C T I N G F O R BAC K G RO U N D R E S P I R AT I O N
Correcting for background respiration, in general, should be done by convertingthe two sets of measured oxygen consumptions to non-mass specific measures (e.g.mg O2 h−1) which can then be subtracted without any unit bias.
RO2corr = RO2Animal − RO2Background (5)
where RO2corr is the corrected oxygen consumption rate of the animal, RO2Animal is thewhole animal oxygen consumption rate (mg O2 s−1) and RO2Background is the measuredbackground oxygen consumption(mg O2 s−1). Because quantifying background respi-ration is generally achieved by measuring the decline in oxygen content in an emptychamber, equation (2) must be slightly modified to:
RO2Background = VRT
𝛿CO2
𝛿t(6)
Note that the oxygen consumption calculation resulting from equations (5 and 6)is not mass specific (mg O2 s−1) and the volume used in the calculation is the totalrespirometer volume (VRT) as the volume of the animal is missing from equation (4).Because the background respiration as calculated in equation (6) is not mass specific(e.g. mg O2 s−1), it is difficult to subtract it from MO2 as calculated by equation (2or 4) as they are mass-specific MO2 (e.g. mg O2 kg−1 h−1). In order to obviate thisproblem, one of the following equations should be used for subtracting backgroundrespiration:
MO2corr = MO2 − MO2B VRT V−1RE (7)
where MO2B is a mass-specific background respiration (mg O2 kg−1 h−1) calculated asif the animal was in the respirometer (equations 2 and 4).
A correction for background respiration can also be made by using equation (8),which uses the measured slopes with an animal (Sa) and without (Sb) along with theeffective respirometer volume VRE and the total respirometer volume VRT.
MO2corr = 𝛽O2
(SaVRE − SbVRT
)W−1
o (8)
© 2015 The Fisheries Society of the British Isles, Journal of Fish Biology 2016, 88, 26–50
36 M . B . S . S V E N D S E N E T A L.
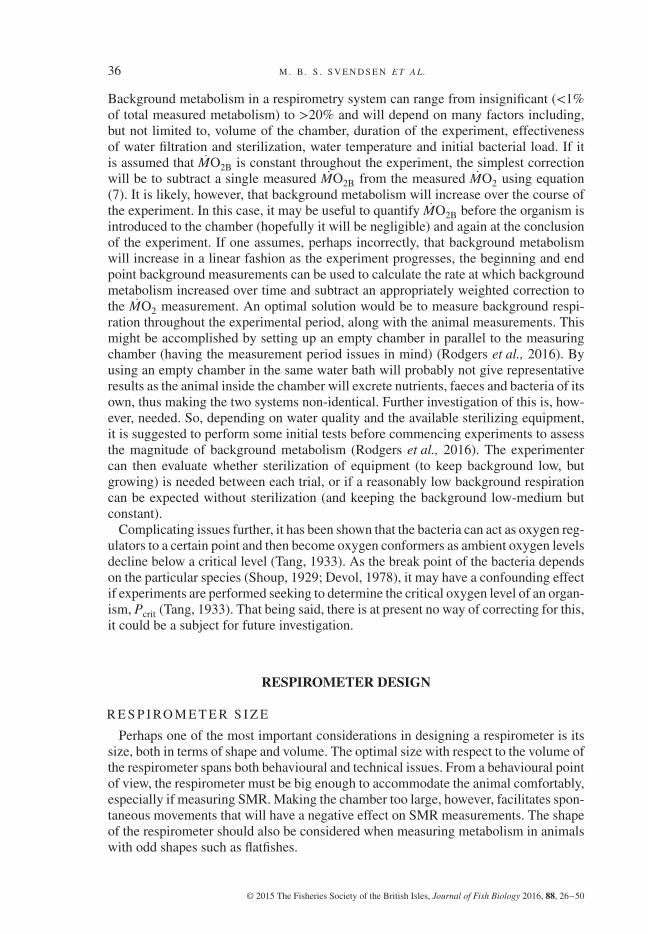
Background metabolism in a respirometry system can range from insignificant (<1%of total measured metabolism) to >20% and will depend on many factors including,but not limited to, volume of the chamber, duration of the experiment, effectivenessof water filtration and sterilization, water temperature and initial bacterial load. If itis assumed that MO2B is constant throughout the experiment, the simplest correctionwill be to subtract a single measured MO2B from the measured MO2 using equation(7). It is likely, however, that background metabolism will increase over the course ofthe experiment. In this case, it may be useful to quantify MO2B before the organism isintroduced to the chamber (hopefully it will be negligible) and again at the conclusionof the experiment. If one assumes, perhaps incorrectly, that background metabolismwill increase in a linear fashion as the experiment progresses, the beginning and endpoint background measurements can be used to calculate the rate at which backgroundmetabolism increased over time and subtract an appropriately weighted correction tothe MO2 measurement. An optimal solution would be to measure background respi-ration throughout the experimental period, along with the animal measurements. Thismight be accomplished by setting up an empty chamber in parallel to the measuringchamber (having the measurement period issues in mind) (Rodgers et al., 2016). Byusing an empty chamber in the same water bath will probably not give representativeresults as the animal inside the chamber will excrete nutrients, faeces and bacteria of itsown, thus making the two systems non-identical. Further investigation of this is, how-ever, needed. So, depending on water quality and the available sterilizing equipment,it is suggested to perform some initial tests before commencing experiments to assessthe magnitude of background metabolism (Rodgers et al., 2016). The experimentercan then evaluate whether sterilization of equipment (to keep background low, butgrowing) is needed between each trial, or if a reasonably low background respirationcan be expected without sterilization (and keeping the background low-medium butconstant).
Complicating issues further, it has been shown that the bacteria can act as oxygen reg-ulators to a certain point and then become oxygen conformers as ambient oxygen levelsdecline below a critical level (Tang, 1933). As the break point of the bacteria dependson the particular species (Shoup, 1929; Devol, 1978), it may have a confounding effectif experiments are performed seeking to determine the critical oxygen level of an organ-ism, Pcrit (Tang, 1933). That being said, there is at present no way of correcting for this,it could be a subject for future investigation.
RESPIROMETER DESIGN
R E S P I RO M E T E R S I Z E
Perhaps one of the most important considerations in designing a respirometer is itssize, both in terms of shape and volume. The optimal size with respect to the volume ofthe respirometer spans both behavioural and technical issues. From a behavioural pointof view, the respirometer must be big enough to accommodate the animal comfortably,especially if measuring SMR. Making the chamber too large, however, facilitates spon-taneous movements that will have a negative effect on SMR measurements. The shapeof the respirometer should also be considered when measuring metabolism in animalswith odd shapes such as flatfishes.
© 2015 The Fisheries Society of the British Isles, Journal of Fish Biology 2016, 88, 26–50

H OW T O S E T U P A N AQ UAT I C R E S P I RO M E T RY S Y S T E M 37
When designing an intermittent-flow respirometry system, Forstner (1983) proposedthe following equation for determining the appropriate volume of the respirometrychamber:
VRT = 𝜔tm RO2CO−12 (9)
where 𝜔 is the anticipated drop in the oxygen content in the chamber (as a percentage)during the measurement period, tm, and RO2 is the oxygen consumption (mg O2 s−1).This assumes, of course, that the experimenter already has an approximate idea of whatthe metabolic rate of the organism will be. If the experimenter anticipates using therespirometer at different temperatures, this formula can be expanded by adding a Q10component (Reyes et al., 2008) to incorporate the temperature-driven metabolic effecton the necessary chamber volume.
VRT = 𝜔tmRO2CO−12 Q(T1−T0) 10−1
10 (10)
Given an estimated range of oxygen consumptions, planning the respirometer volumeoften comes down to trying to achieve the best compromise between having a largeenough drop in oxygen level during the measurement period to achieve a satisfactoryr2 (high 𝜔), but doing it over a relatively short amount of time (small tm). While thereare no hard and fast rules that can be applied in this regard, it has been the authors’experience that a respirometer:organism volume (rRO) between 20 and 50 appears tobe comfortable for most organisms but is small enough to result in a 10% drop in oxy-gen content or pO2 (Forstner, 1983) within a reasonable amount of time (3–6 min),depending on temperature. The 10% drop in oxygen should not be regarded as a stan-dard, as determinations with a high r2 (>0⋅95–0⋅98) with a smaller decline in oxygenlevels would suffice. On the other hand, if there are drops of 10% or more, all havinglow r2 (<0⋅95), it should be a cause for concern.
The volume of the respirometry system is not only determined by the chamber size,but also includes the volume of the recirculating loop, if one is present. Therefore,external tubing connecting pumps to the respirometer should be as short as possible,not only to minimize volume, but additionally to limit the available surface area forbacterial films which will contribute to background respiration.
When designing a swimming respirometry system, a larger rRO has to be anticipatedas the various ancillary portions of the respirometer (turning section, propeller housing,flow straightener and return channel) add significant amounts of volume beyond theswim section. Wherever possible, therefore, the size of the non-swim sections of therespirometer should be kept as small as possible, in order to keep overall volume ofthe respirometer low. While the higher volume will be necessary when the oxygenconsumption increases at higher swimming speed, MO2 measurements in resting orslowly swimming fishes will require longer measurement times and will be less precisethan results measured in a static system. A swim tunnel with an rRO in the range of50–150 is a good compromise.
R E C I R C U L AT I O N A N D M I X I N G
Mixing or stirring the water in the unflushed chamber is an important design con-sideration when building a respirometer. In a swimming respirometer, the water is
© 2015 The Fisheries Society of the British Isles, Journal of Fish Biology 2016, 88, 26–50
38 M . B . S . S V E N D S E N E T A L.
(c) (d)
Recirculation pump(a)
(b) Recirculation pumpOverflow
Overflow
Flush pumpN
on-c
ount
erin
g pu
mps
Cou
nter
ing
pum
ps
Flush pump
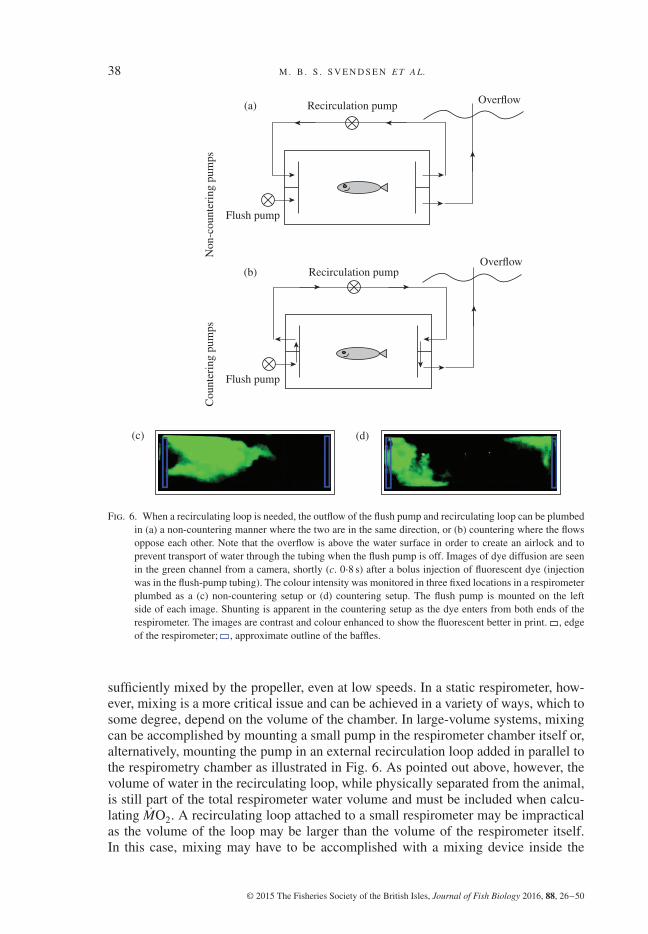
Fig. 6. When a recirculating loop is needed, the outflow of the flush pump and recirculating loop can be plumbedin (a) a non-countering manner where the two are in the same direction, or (b) countering where the flowsoppose each other. Note that the overflow is above the water surface in order to create an airlock and toprevent transport of water through the tubing when the flush pump is off. Images of dye diffusion are seenin the green channel from a camera, shortly (c. 0⋅8 s) after a bolus injection of fluorescent dye (injectionwas in the flush-pump tubing). The colour intensity was monitored in three fixed locations in a respirometerplumbed as a (c) non-countering setup or (d) countering setup. The flush pump is mounted on the leftside of each image. Shunting is apparent in the countering setup as the dye enters from both ends of therespirometer. The images are contrast and colour enhanced to show the fluorescent better in print. , edgeof the respirometer; , approximate outline of the baffles.
sufficiently mixed by the propeller, even at low speeds. In a static respirometer, how-ever, mixing is a more critical issue and can be achieved in a variety of ways, which tosome degree, depend on the volume of the chamber. In large-volume systems, mixingcan be accomplished by mounting a small pump in the respirometer chamber itself or,alternatively, mounting the pump in an external recirculation loop added in parallel tothe respirometry chamber as illustrated in Fig. 6. As pointed out above, however, thevolume of water in the recirculating loop, while physically separated from the animal,is still part of the total respirometer water volume and must be included when calcu-lating MO2. A recirculating loop attached to a small respirometer may be impracticalas the volume of the loop may be larger than the volume of the respirometer itself.In this case, mixing may have to be accomplished with a mixing device inside the
© 2015 The Fisheries Society of the British Isles, Journal of Fish Biology 2016, 88, 26–50
H OW T O S E T U P A N AQ UAT I C R E S P I RO M E T RY S Y S T E M 39
respirometer, such as a magnetic stir bar which is isolated from the animal by a meshscreen or an internal pump (Clark et al., 2013).
The recirculation pump can be kept on or turned off during the flush part of the cycle.If it is turned off, the recirculation loop becomes a functional dead space. If there issignificant background respiration, water in this space can become hypoxic and rapidlydecrease dissolved oxygen (wash-in) when the recirculation pump starts again. As longas there is not a significant change in the flow characteristics in the chamber that mightforce the animal to alter its behaviour when the flush period begins (because two pumpsare on), it is suggested to leave the recirculation pump on continually.
WA S H- I N , WA S H O U T A N D F L U S H I N G
Using intermittent-flow respirometry, flushing the chamber is used to replenish itsoxygen content and prevent accumulation of waste products such as carbon dioxideand ammonia. The rate at which oxygen levels increase (wash-in) or waste productsdecrease (washout) in the metabolic chamber during the flush period is also animportant consideration when designing the respirometer (volume and flush pumpsize) and carrying out experiments (flushing frequency and duration). The time courseof air-saturated water wash-in during the flushing cycle is described by:
Yin = 1 − e−Dt (11)
where Y in is the fraction of the normoxic level reached, t is time and D is the dilutionratio calculated using the flush-pump flow rate (FF) and respirometer volume (VRT),D=FFVRT
− 1. Similarly, the washout of chamber water containing higher levels of CO2and nitrogenous waste (Steffensen, 1989) can be characterized by:
Yout = e−Dt (12)
where Yout is the fraction left in the chamber. As can be seen, the only differencebetween equations (11 and 12) is that wash-in (equation 11) rises exponentially to 1,whereas washout (equation 12) declines exponentially to 0.
F L U S H P U M P F L OW D I R E C T I O N
In most static respirometers, the recirculation of water in the chamber is achieved withan external loop driven by a pump. As the water inlets and outlets for the recirculatingloop and the inlet for flushing are typically plumbed into the ends of the chambers, adecision has to be made whether to plumb the two water outlets in the same end of thechamber [Fig. 6(a)] to produce parallel streams (non-countering) or in opposite ends[Fig. 6(c)] where they oppose each other (countering).
In order to assess the relative merits of both schemes, a series of experimentswere performed where a fluorescent dye was injected into the respirometer and thewashout of the dye followed over time [Figs 6(b), (d) and 7]. As the volume of therespirometer and flushing times were the same in both instances, the total washoutamounts, Yout, are identical. Therefore, comparing the effective pumping volumes can
© 2015 The Fisheries Society of the British Isles, Journal of Fish Biology 2016, 88, 26–50

40 M . B . S . S V E N D S E N E T A L.
1·0
0·8
0·6
0·4
0·2
Nor
mal
ized
inte
nsity
0 20 40 60 80
Time (s)100 120
<> R
<> M
<> L
>> L
>> M >> R
Fig. 7. Fluorescent dye was used to visualize mixing and washout in a respirometer when the recirculating loopwas plumbed in the same direction (non-countering) as the flush pump flow ( ) or plumbed in opposite(countering) direction to the flush pump ( ) (cf. Fig. 6). Regardless of the flush rate, a non-counteringsystem results in much more effective flushing. L, M and R, left, middle and right part of the respirometer,respectively. The y-axis is normalized fluorescent intensity, normalized to maximum intensity in each of theregions of interest (L, M and R).
be done by solving for FF (D=FFVRT− 1) in equation (11) and finding the time (t)
to 50% washout. The difference in flushing rate between the two different setups isthen equal to 𝛥%= (t1 − t2)t1
− 1100 %, where 𝛥% is the difference in per cent and t1and t2 are the 50% washout times from the non-countering and the countering setups,respectively (Fig. 7).
The experimental trials revealed a reduction in effective flushing by 62% whenassembling the recirculating loop in a non-countering manner (1⋅56 l min−1) whencompared with countering directions (0⋅60 l min−1). The drop in effective pumping rateoccurred because flush water was being picked up by the inflow of the recirculationloop, shunted around the chamber through the recirculating loop and directed out ofthe chamber at the exit port. This can be seen visually in Fig. 6(d) where the dye canbe clearly seen at both ends of the chamber but not in the middle. In Fig. 7, the lastcurves to equilibrate are the left and middle of the respirometer of the countering setup(<>L and <>M), indicating a dead space with regards to mixing and flushing that hasbeen created. The dead space in the middle is significant, of course, as this is wherethe organism would normally be found.
As the calculated error rate between the two setup types is dependent on the physicalconstruction of the respirometer (e.g. presence or absence of internal baffles, place-ment of the inflow, outflow, recirculation loop ports and pump size), the error rate canbe better or worse than the example. To be safe, however, it is recommended to assem-ble the respirometer in the non-countering manner to avoid any reduction in effectiveflushing.
© 2015 The Fisheries Society of the British Isles, Journal of Fish Biology 2016, 88, 26–50
H OW T O S E T U P A N AQ UAT I C R E S P I RO M E T RY S Y S T E M 41
1·0
0·8
0·6
0·4
0·2
0
Frac
tiona
l was
h-in
(a) (b) (c)
0 2 4 6 8
Flush volume ratio10 12
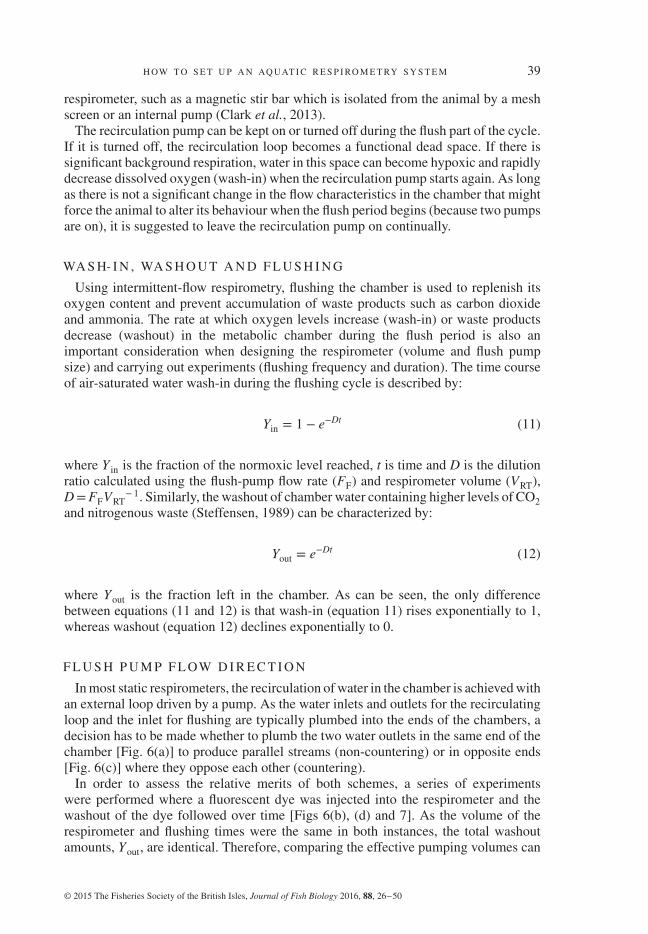
Fig. 8. During the flush period, clean flush water mixes with dirty respirometer water in an exponential manner,which depends on the ratio of flush water volume to respirometer volume (flush volume ratio). The verticallines represent examples of specific flush-volume ratios and the fractional wash-in achieved. For example,once the respirometer has been flushed with four times its volume (a), 98⋅2% of the water in the respirometerwill have been replaced (fractional wash-in). Extending the flush volume ratio to five (b) or 10 times (c)increases the fractional washin to 99⋅3 and 99⋅9%, respectively.
D U T Y C YC L E O F P U M P S
As stated earlier, a complete measurement cycle consists of three periods: flush time,wait time and measurement time (Steffensen et al., 1984). As each period serves adifferent purpose, some discussion of their relevance is merited.
Flush timeThe length of the flush interval depends on how much waste-product washout
and oxygen replenishment the experimenter seeks to achieve. Although a 100%washout of waste products is ideal, it is often impractical as it will take too long.An appropriate flush time can be calculated by tf = ln(𝛼− 1)VREFF
− 1 [rewritten fromSteffensen (1989)], where 𝛼 is the planned residual water volume in the respirometerchamber expressed as a decimal percentage (i.e. for an exchange of 96% of thewater, 𝛼 = 0⋅04). As can be seen in Fig. 8, the respirometer needs to be flushed withc. five times its volume in order to achieve a washout above 99%.
Wait timeOnce the flush pump is turned off and the chamber is effectively sealed, a wait period
should be inserted in the cycle to allow thorough mixing of the all the water in thechamber before data are collected for the actual oxygen consumption measurement(Steffensen et al., 1984). The wait period should be long enough to ensure that a lineardecline in oxygen content (or pO2) has begun before collecting data points to be used inthe MO2 calculation. While the exact wait time will be dependent on the experimentalsetup, an initial starting value of 10% of the measurement time has been suggested
© 2015 The Fisheries Society of the British Isles, Journal of Fish Biology 2016, 88, 26–50

42 M . B . S . S V E N D S E N E T A L.
50
40
10
0·1
0·01
130
20
10
0100
Respirometer:fish ratio1000
60
0° C 10° C 20° C 30° C 40° C
40° C
30° C
20° C
10° C
0° C
Tim
e (m
in)
to 5
% d
rop
(___
)
Dro
p in
pO
2 af
ter
5 m
in (
%, -
- -
)
Fig. 9. The approximate time needed to achieve a 5% drop in oxygen content in the respirometer for metabolicrate determinations depends on the size of the animal relative to respirometer (respirometer:organism ratio)and its metabolic rate. This family of curves was constructed based on a metabolic rate approximationadapted from Gillooly et al. (2001) in a 300 g fish at five different temperatures. The smaller the respirometerto organism ratio and the higher its metabolic rate (due to, for example, temperature) the less time the flushpump needs to be off to achieve a reasonable decline in oxygen content in the respirometer. On the x-axis(logarithmic), data start at a respirometer to fish ratio of 20.
(Forstner, 1983). As the exact time for the wait period is independent of the mea-surement time, the experimenter should determine this on an individual basis for eachspecific setup (i.e. see how long it takes for the oxygen trace to become linear).
Measurement timeBecause the rate at which oxygen declines in the sealed chamber will depend on the
organism’s activity state and volume of the respirometer, it is also difficult to define anoptimal measurement time (tm). On the one hand, the longer tm the better the r2, but themore waste products will build up. Shorter measurement times reduce waste accumu-lation but can also increase variability in the measurement and reduce r2. Shorter mea-surement times, however, also decrease the total measurement cycle thereby increasingthe number of MO2 determinations that can be made in a given time period. Lastly,shorter measurement periods also decrease the probability that the animal will exhibitdifferent activity levels during the measurement. By using an estimate of expectedMO2, equation (9) can be rewritten to calculate an appropriate measurement time
tm = 𝜔CO2VRERO−12 (13)
where 𝜔 is the minimum % drop of oxygen content (or pO2).Information from equations (2, 4,9, 10 and 13) has been summed up in Figs 9 and 10.
The two figures can be used to assess the effect of respirometer:organism ratios, at
© 2015 The Fisheries Society of the British Isles, Journal of Fish Biology 2016, 88, 26–50

H OW T O S E T U P A N AQ UAT I C R E S P I RO M E T RY S Y S T E M 43
200
100
100
50
50
20
20
500
500
150
100
50
0
Tim
e (m
in)
to 5
% d
rop
(___
)
10
0·1
0·01
1
Dro
p in
pO
2 af
ter
5 m
in (
- -
-)
0 15105 20 25 30
Temperature (° C)35 40
Fig. 10. Because temperature has a profound effect on metabolism, the oxygen will be consumed much morequickly (time to 5% drop) in a closed respirometer at a high temperature than at a lower temperature. Thiscan dramatically increase measurement times when experiments are carried out in large respirometers atlow temperatures. Metabolic rate and Q10 assumptions as in Fig. 9. Note that the right-hand side of y-axisis logarithmic. Numbers in the plot represent the isolines of respirometer:organism ratio.
different temperatures, on the drop in pO2. They are useful to get an idea about ini-tial measurement times needed for given temperatures or respirometer:fish (organism)ratios (rRO), temperature or rRO can be read at the x-axis, respectively, on the twofigures, and time to 5% drop or drop in pO2 after 5 min can be read from the two y-axison the figures. If a larger drop in pO2 is wanted (e.g. 10%), then simply multiply theratio (e.g. 10× 5−1 = 2) to obtain the time to reach that level. Lastly, post-experimentaldata analysis will become more trivial, if the duration of total cycle equals a productof 5 min, e.g. 10 or 15 min, as it will be more intuitive to read graphed data.
EXPERIMENTAL CONTROL
E X P E R I M E N TA L A S S U M P T I O N S
The topics described in the calculation assumptions above apply to the water insidethe respirometer when the chamber is closed. Other assumptions are more general, andemerge from the reasons for doing intermittent-flow respirometry instead of closedor flow-through respirometry. (1) The flush or replacement water is free of metabolites(e.g. carbon dioxide and nitrogenous waste). It is important that when fresh, clean wateris not available for flushing, the water reservoir used as a source of flush water is vig-orously aerated, filtered and recirculated through a UV sterilizer to eliminate bacterialgrowth that will contribute to background respiration. This is particularly important ifthere is little water replacement in the whole system and the experiment will be run forlonger than 12–18 h (depending on oxygen solubility, water temperature and animal
© 2015 The Fisheries Society of the British Isles, Journal of Fish Biology 2016, 88, 26–50

44 M . B . S . S V E N D S E N E T A L.
metabolism). (2) The flush or replacement water is in equilibrium with atmosphericgases, particularly oxygen and carbon dioxide; vigorous aeration will eliminate thisproblem. (3) The respirometry chamber and recirculating loop are gas tight. Some typesof polymers used in tubing and respirometer construction can be quite permeable tooxygen and are therefore potential sources of oxygen washin during MO2 experiments,particularly at low ambient oxygen levels. The oxygen buffering effect, i.e. the abilityof these polymers to take up, store and excrete oxygen, can have a significant effect onoxygen levels in the chamber during flush and measurement periods. Generally nylon,acetyl or PVC are preferred building materials for oxygen measurement systems; thecommonly available acrylic plastic is average, and polycarbonate and Teflon should beavoided (Stevens, 1992). The ideal gas-tight material for a respirometer would be glass,which may be practical for very small respirometers for larval fishes or zooplankton,for instance. Glass is also transparent and quite thermally conductive. The respirome-ter’s oxygen permeability can be tested by degassing the water in the respirometer andmeasuring the oxygen level for 3–4 h to ensure that no (or very little) oxygen is leakingin from the outside (Stevens, 1992).
M A N UA L , T I M I N G O R AU T O M AT E D R E S P I RO M E T E RO P E R AT I O N
The fundamental idea behind intermittent-flow respirometry is that the water in therespirometer is exchanged at regular intervals by turning a flush pump on and off.Controlling the power output to the pump, and thus the flushing interval, can be donemanually, with a timer, or by a PC or microcontroller. Manual flush-pump control pro-vides the most flexibility over flushing and measurement times, and ensures that theexperimenter is continuously watching and controlling the experiment so if any unfore-seen events occur, immediate action can be taken. This is obviously time consumingand the constant presence of the experimenter may stress the organism and prevent itfrom settling down during SMR experiments. In swim-tunnel experiments, however,manually altering flushing times may be required to accommodate changes in oxygenconsumption as swimming speeds are increased.
While commercially available programmable timers are an inexpensive way toquasi-automate the experimental procedure, the ability to control the exact flushperiod may be limited by the characteristics of the timer as many of the less expensivetimers are only programmable to within 10–15 min periods. This can be problematicin cases where the organism has a very high oxygen consumption requiring measure-ment periods smaller than the minimum programmable time increment of the timer.Adjusting the size of the respirometer can mitigate this problem.
Using a microcontroller or a PC to automate the pump control and data collectionwill enable the user to precisely control the flush, wait and measurement periods downto seconds. With a PC-controlled setup, real-time calculations of oxygen consumptionfor each measurement period is possible, giving immediate information on whetherthe animal has reached a resting or steady state. In addition to experimental control,a PC-based control system allows external environmental variables (e.g. temperature,oxygen, carbon dioxide and salinity) to be monitored and even controlled to pre-setvalues. PC-controlled systems typically consist of a PC, an analogue to digital (A–D)interface to collect data from the oxygen measuring device and a digital output to con-trol a relay for the flush pump. As the cost of A–D systems has declined dramatically,
© 2015 The Fisheries Society of the British Isles, Journal of Fish Biology 2016, 88, 26–50

H OW T O S E T U P A N AQ UAT I C R E S P I RO M E T RY S Y S T E M 45
experimenters with minor electronics experience can assemble a system fairly inexpen-sively. In addition to hardware, software for collecting data and controlling pumps isalso necessary. Free open-source software is available for automated intermittent-flowrespirometry, AquaResp (www.Aquaresp.com) a freeware programme. If theexperimenter has programming experience, interface-based programmes such asDasyLab (www.dasylab.com), LabTech Notebook (www.omega.com), LabView(www.ni.com/labview) and MatLab (www.mathworks.com/products/matlab) can beused to automate the process as well.
When using a PC-controlled setup over long periods of time, it is important to disableautomated, time-sensitive, processes such as hibernation and sleep mode, screen lock,automatic updates and any other software that interferes with data logging and mayresult in an unanticipated shut down and restart of the PC. If the PC is also connectedto a network, the experimenter should also be aware of any nightly updates that arepushed out by IT service departments. In many cases, it is more expedient to keep thedata collection machine off the network entirely.
C O N T RO L L I N G E X P E R I M E N TA L VA R I A B L E S
There are a variety of variables that can affect oxygen consumption. Some of themare physical in nature (e.g. temperature, salinity and oxygen) while others are morebiological (e.g. swimming speed, toxins, algae and conspecifics). The ability to mea-sure and control these types of variables are important in order to manipulate, quantify(e.g. effect of hypoxia or temperature on metabolism) or control them to eliminate orlimit their effect on metabolism (e.g. diel changes in light or temperature).
Controlling the more common variables such as temperature, salinity, oxygen andlight can generally be done in two ways: using a stand-alone digital controller or a PC.For example, commercially available digital temperature controllers (PR ElectronicsPR5714, PR Electronics; www.prelectronics.com) can activate heaters in a reservoir tomaintain temperature or can be set up to activate a pump from a thermostatically con-trolled reservoir to drive water through a heat exchanger in the bath which can reducetemperature variations to ±0⋅1∘ C. They can also be used to control oxygen levels byturning on or off solenoid valves that allow oxygen, air or nitrogen to flow into a waterreservoir when a set point is passed. Controlling the variables via a PC allows for thesame control as described above with the added benefit of allowing the experimenter tosimulate daily variations in environmental factors such as temperature, oxygen, salinityand light. In general, however, it is recommended to control temperature by stand-aloneregulators because temperature control may be halted when the respirometry softwareprogramme is stopped.
C O M M O N P RO B L E M S I N R E S P I RO M E T RY
LeaksWhen a respirometer is submerged in water detecting a water leak can be difficult,
if not impossible, with the naked eye. Detection may be possible by injecting a bolusof coloured dye in the respirometer and looking for the presence of dye in the sur-rounding water bath. Sometimes, however, examination of the oxygen trace during arespirometry experiment can offer clues to the presence of leaks. The non-linear decline
© 2015 The Fisheries Society of the British Isles, Journal of Fish Biology 2016, 88, 26–50

46 M . B . S . S V E N D S E N E T A L.
in oxygen consumption in Fig. 3, for instance, could have been generated by a smallleak of water, with higher oxygen, from the surrounding water bath.
Gas bubblesGas bubbles in the respirometer are to be avoided at all costs as they function as an
oxygen buffer in the system and dampen measured oxygen content changes during theclosed period. This results from the fact that gas bubbles can either take up oxygenfrom, or leak oxygen to the surrounding water quite rapidly, depending on the rela-tive pO2 in the gas and water, respectively (Fick, 1855). Allowing bubbles to collectin the vicinity of the oxygen sensor can be even more detrimental as they can dramati-cally alter the microenvironment around it. Gas bubbles are often introduced when theorganism is first placed in the chamber, allowing air to get trapped in the respirometeror associated tubing. Care should therefore be taken to reduce the introduction of gasbubbles into the respirometer and removing them prior to experimentation. A secondsource of bubble formation in the respirometer is a reduction of water oxygen solubil-ity over time. This most commonly occurs if the atmospheric pressure drops (relevantfor long measurement periods), or if the water temperature increases reducing its gassolubility. The very small bubbles produced by these events are very difficult to removefrom the respirometer without disturbing the animal and can have a dramatic effect onthe measured oxygen consumption. Designing the respirometer properly can reducethe problem of gas bubble accumulation. Firstly, mount the oxygen sensor in a posi-tion that will minimize the chance that gas bubbles will collect in its vicinity. Secondly,when possible mount the flush water exit at the highest point in the chamber so thatair bubbles that occur in the chamber will collect there and be flushed out. Care shouldalso be taken to make sure that there are no other local high cavities that may collectbubbles.
OX Y G E N M E T E R S
It is imperative that the experimenter understands the oxygen measuring principlesand behaviour of their oxygen meters in detail when designing the respirometry system.Generally speaking, there are three things to be aware of: noise, oxygen consumptionof sensors and automatic correction by sensor software. Noise caused by flow regime,certain types of oxygen sensors (e.g. polarographic and galvanic electrodes) consumeoxygen during the measurement process and therefore require a flow of water pastthem to eliminate buildup of an oxygen-poor microenvironment around the electrodetip. Some fibre-optic sensors require the flow to eliminate a diffusive boundary layer onthe sensor. In the absence of a minimal flow, however, the response time of sensors canbe severely affected and the output noisy. Typically, if the respirometer itself is mixedproperly, the mixing will generate a sufficient water flow to obviate this issue. Sensordrift, as all oxygen sensors have some degree of drift, this type of measurement errorrequires probe recalibration as the drift cannot be mitigated by using linear regres-sion when calculating the oxygen consumption. Oxygen consumption of the sensor,as mentioned above, polarographic and galvanic electrodes consume oxygen them-selves. While typically trivial in comparison to the organism’s oxygen consumptionit can become important with small organisms in a small water volume. Automaticcorrections, present day modern sensors such as optodes often come with specializedsoftware that includes automatic temperature correction. This can be a troublesome
© 2015 The Fisheries Society of the British Isles, Journal of Fish Biology 2016, 88, 26–50
H OW T O S E T U P A N AQ UAT I C R E S P I RO M E T RY S Y S T E M 47
feature as there is a tendency to get noisier data with temperature compensation onthan off, because the measurement error of the temperature probe is added to that ofthe oxygen sensor. From time to time, for example, the compensation algorithm willcreate jumps in the oxygen trace because of noise in the temperature sensor. The sig-nal noise introduced by the compensation algorithm can be particularly troubling if itoccurs during the measurement period. This phenomenon has been observed in bothPresens (www.presens.de) and Pyroscience (www.pyro-science.com) oxygen meters,so it is recommended that the temperature compensation be disabled if feasible and theexperimenter, instead, put their efforts into keeping the temperature of the respirometrysystem constant.
CONCLUSIONS
Intermittent-flow respirometry is a very useful tool to deploy when quantifying theoxygen consumption of aquatic organisms under a variety of conditions. In order to getthe most accurate results, the experimenter should be mindful of a number of pointswhen designing the system and carrying out experiments. The respirometer:organismvolume ratio needs to be as small as possible to ensure accurate measurements, butshould leave a sufficient volume to comfortably accommodate the animal. A ratio of20–50 for static respirometers and 50–150 for swimming respirometers is suggested.(1) Sufficient flushing and mixing times are critical for accurate measurements onunstressed animals. Flush times that exchange 95–99% of the water in the respirometerbetween measurement periods should be used. Designing and assembling the recircula-tion loop and input and output ports to avoid shunting of flush water and providing goodmixing will ensure that basic assumptions are met and possibly increase the accuracyof the oxygen consumption measurements. (2) Keep experimental variables constant,especially temperature, as it affects virtually all other variables. If feasible, log variablesfor quality assurance and post-experiment correction purposes. (3) Reduce or eliminategas bubbles at all costs. Try to avoid introducing them with the animal, remove thembefore the experiment starts and position the chamber outflow at a high point in therespirometer so bubbles that collect over time will be flushed out. Be very cognizant ofbubbles collecting in the vicinity of the oxygen probe as this can dramatically skew theresults. (4) When determining background respiration, make sure that the measurementperiod is long enough to accurately measure it, as reflected in a high r2.
This paper was an invited review based upon a decision made within the EU COST ActionFA1004, Conservation Physiology of Marine Fishes. We would like to thank D. Chabot and thetwo anonymous referees for thorough feedback and additions to this review.
References
Beamish, F. W. H. (1964). Respiration of fishes with special emphasis on standard oxygenconsumption: I. Influence of weight and temperature on respiration of several species.Canadian Journal of Zoology 42, 177–188. doi: 10.1139/z64-016
Beamish, F. W. H. & Mookherjii, P. S. (1964). Respiration of fishes with special emphasis onstandard oxygen consumption: I. Influence of weight and temperature on respiration ofgoldfish, Carassius auratus L. Canadian Journal of Zoology 42, 161–175. doi: 10.1139/z64-015
© 2015 The Fisheries Society of the British Isles, Journal of Fish Biology 2016, 88, 26–50

48 M . B . S . S V E N D S E N E T A L.
Benson, B. B. & Krause, D. Jr. (1984). The concentration and isotopic fractionation of oxy-gen dissolved in freshwater and seawater in equilibrium with the atmosphere. Deep SeaResearch B 31, 859. doi: 10.1016/0198-0254(84)93289-8
Boldsen, M. M., Norin, T. & Malte, H. (2013). Temporal repeatability of metabolic rate andthe effect of organ mass and enzyme activity on metabolism in European eel (Anguillaanguilla). Comparative Biochemistry and Physiology A 165, 22–29. doi: 10.1016/j.cbpa.2013.01.027
Casselman, M. T., Anttila, K. & Farrell, A. P. (2012). Using maximum heart rate as arapid screening tool to determine optimum temperature for aerobic scope in Pacificsalmon Oncorhynchus spp. Journal of Fish Biology 80, 358–377. doi: 10.1111/j.1095-8649.2011.03182.x
Chabot, D., Farrell, A. P. & Steffensen, J. F. (2016). The determination of standard metabolicrate in fishes. Journal of Fish Biology (in press, this issue).
Clark, T. D., Sandblom, E. & Jutfelt, F. (2013). Aerobic scope measurements of fishes in an era ofclimate change: respirometry, relevance and recommendations. Journal of ExperimentalBiology 216, 2771–2782. doi: 10.1242/jeb.084251
Devol, A. H. (1978). Bacterial oxygen uptake kinetics as related to biological processes inoxygen deficient zones of the oceans. Deep Sea Research 25, 137–146. doi: 10.1016/0146-6291(78)90001-2
Ege, R. & Krogh, A. (1914). On the relation between the temperature and the respiratoryexchange in fishes. Internationale Revue der Gesamten Hydrobiologie 7, 48–55.
Eriksen, N. T. (2002). Accuracy and precision of aquatic respirometers with emphasis onmonophase oxystats. Fish Physiology and Biochemistry 26, 139–147. doi: 10.1023/A:1025461900063
Fick, A. (1855). V. On liquid diffusion. Philosophical Magazine 410, 30–39. doi: 10.1080/14786445508641925
Fofonoff, N. P. (1985). Physical properties of seawater: a new salinity scale and equationof state for seawater. Journal of Geophysical Research, Oceans 90, 3332–3342. doi:10.1029/JC090iC02p03332
Forstner, H. (1983). An automated multiple-chamber intermittent-flow respirometer. In Polaro-graphic Oxygen Sensors (Gnaiger, D. E. & Forstner, D. H., eds), pp. 111–126. Berlin:Springer.
Garcia, H. E. & Gordon, L. I. (1992). Oxygen solubility in seawater: better fitting equations.Limnology and Oceanography 37, 1307–1312.
Gillooly, J. F., Brown, J. H., West, G. B., Savage, V. M. & Charnov, E. L. (2001). Effectsof size and temperature on metabolic rate. Science 293, 2248–2251. doi: 10.1126/science.1061967
Gnaiger, E. (1983). The twin-flow microrespirometer and simultaneous calorimetry. In Polaro-graphic Oxygen Sensors (Gnaiger, D. E. & Forstner, D. H., eds), pp. 134–166. Berlin:Springer.
Green, E. J. & Carritt, D. E. (1967). New tables for oxygen saturation of sea water. Journal ofMarine Research 25, 140–147.
Hastala, M. P. & Berger, A. J. (1996). Physiology of Respiration. New York, NY: Oxford Uni-versity Press.
Keys, A. B. (1930). The measurement of the respiratory exchange of aquatic animals. BiologicalBulletin 59, 187. doi: 10.2307/1536988
Niimi, A. J. (1978). Lag adjustment between estimated and actual physiological responses con-ducted in flow-through systems. Journal of the Fisheries Research Board of Canada 35,1265–1269. doi: 10.1139/f78-197
Nilsson, G. E. & Östlund-Nilsson, S. (2004). Hypoxia in paradise: widespread hypoxia toler-ance in coral reef fishes. Proceedings of the Royal Society B 271(Suppl. 3), S30–S33. doi:10.1098/rsbl.2003.0087
Norin, T. & Malte, H. (2011). Repeatability of standard metabolic rate, active metabolic rateand aerobic scope in young brown trout during a period of moderate food availability.Journal of Experimental Biology 214, 1668–1675. doi: 10.1242/jeb.054205
© 2015 The Fisheries Society of the British Isles, Journal of Fish Biology 2016, 88, 26–50

H OW T O S E T U P A N AQ UAT I C R E S P I RO M E T RY S Y S T E M 49
Norin, T. & Malte, H. (2012). Intraspecific variation in aerobic metabolic rate of fish: rela-tions with organ size and enzyme activity in brown trout. Physiological and BiochemicalZoology 85, 645–656. doi: 10.1086/665982
Plambech, M., Van Deurs, M., Steffensen, J. F., Tirsgaard, B. & Behrens, J. W. (2013). Excesspost-hypoxic oxygen consumption in Atlantic cod Gadus morhua. Journal of Fish Biol-ogy 83, 396–403. doi: 10.1111/jfb.12171
Reyes, B. A., Pendergast, J. S. & Yamazaki, S. (2008). Mammalian peripheral circadian oscil-lators are temperature compensated. Journal of Biological Rhythms 23, 95.
Rodgers, G. G., Tenzing, P. & Clark, T. D. (2016). Experimental methods in aquatic respirome-try: the importance of mixing devices and accounting for background respiration. Journalof Fish Biology (in press, this issue).
Routley, M. H., Nilsson, G. E. & Renshaw, G. M. (2002). Exposure to hypoxia primes therespiratory and metabolic responses of the epaulette shark to progressive hypoxia. Com-parative Biochemistry and Physiology A 131, 313–321. doi: 10.1016/S1095-6433(01)00484-6
Scarabello, M., Heigenhauser, G. J. & Wood, C. M. (1992). Gas exchange, metabolite status andexcess post-exercise oxygen consumption after repetitive bouts of exhaustive exercise injuvenile rainbow trout. Journal of Experimental Biology 167, 155–169.
Schurmann, H. & Steffensen, J. (1994). Spontaneous swimming activity of Atlantic cod Gadusmorhua exposed to graded hypoxia at three temperatures. Journal of Experimental Biol-ogy 197, 129–142.
Shoup, C. S. (1929). The respiration of luminous bacteria and the effect of oxygen tension uponoxygen consumption. Journal of General Physiology 13, 27–45.
Steffensen, J. F. (1989). Some errors in respirometry of aquatic breathers: how to avoid andcorrect for them. Fish Physiology and Biochemistry 6, 49–59. doi: 10.1007/BF02995809
Steffensen, J. F., Johansen, K. & Bushnell, P. G. (1984). An automated swimmingrespirometer. Comparative Biochemistry and Physiology A 79, 437–440. doi:10.1016/0300-9629(84)90541-3
Steffensen, J. F., Bushnell, P. G. & Schurmann, H. (1994). Oxygen consumption in four speciesof teleosts from Greenland: no evidence of metabolic cold adaptation. Polar Biology 14,49–54. doi: 10.1007/BF00240272
Stevens, E. D. (1992). Use of plastic materials in oxygen-measuring systems. Journal of AppliedPhysiology 72, 801–804.
Stocker, T. F., Qin, D., Plattner, G.-K., Tignor, M., Allen, S. K., Boschung, J., Nauels, A., Xia,Y., Bex, V. & Midgley, P. M. (Eds) (2013). IPCC, 2013: Climate Change 2013: ThePhysical Science Basis. Contribution of Working Group I to the Fifth Assessment Reportof the Intergovernmental Panel on Climate Change. Cambridge: Cambridge UniversityPress. doi: 10.1017/CBO9781107415324
Svendsen, J. C., Steffensen, J. F., Aarestrup, K., Frisk, M., Etzerodt, A. & Jyde, M. (2011).Excess posthypoxic oxygen consumption in rainbow trout (Oncorhynchus mykiss):recovery in normoxia and hypoxia. Canadian Journal of Zoology 90, 1–11. doi: 10.1139/z11-095
Tang, P. S. (1933). On the rate of oxygen consumption by tissues and lower organisms as afunction of oxygen tension. Quarterly Review of Biology 8, 260–274.
Ultsch, G. R. & Duke, J. T. (1990). Gas exchange and habitat selection in the aquatic salamandersNecturus maculosus and Cryptobranchus alleganiensis. Oecologia 83, 250–258. doi:10.1007/BF00317760
Ultsch, G. R., Jackson, D. C. & Moalli, R. (1981). Metabolic oxygen conformity among lowervertebrates: the toadfish revisited. Journal of Comparative Physiology 142, 439–443.doi: 10.1007/BF00688973
Via, G. J. D. (1983). Bacterial growth and antibiotics in animal respirometry. In PolarographicOxygen Sensors (Gnaiger, D. E. & Forstner, D. H., eds), pp. 202–218. Berlin: Springer.
Electronic Reference
Van Rossum, G. & Drake, F. L. (2003). Python Language Reference Manual. Available athttp://www.network-theory.co.uk/
© 2015 The Fisheries Society of the British Isles, Journal of Fish Biology 2016, 88, 26–50

50 M . B . S . S V E N D S E N E T A L.
APPENDIX
List of variables, the first column is the variable used, second column holds the descriptions ofwhat the variable signifies and the last column has the SI units of the variable. One special caseis when the unit is given as O2 (except mg O2), this signifies the oxygen unit used in the given
experiment
Variable Description Unit
tperiod Total duration stf Flush period duration stw Wait period duration stm Measurement period duration sVRE Effective respirometer volume lCO2 Total respirometer oxygen content mg O2t Time variable sWo Mass of organism kgVRT Total respirometer volume l𝜌o Organism density kg l−1
𝛽O2 Oxygen solubility of oxygen in water mg O2 l−1
b Intersect in straight line equationRO2 Rate of oxygen consumption mg O2 s−1
MO2 Mass-specific oxygen consumption mg O2 kg−1 s−1
pO2 Partial pressure of oxygen e.g. kPa or mmHgSa Slope of oxygen trace, animal O2 s−1
Sb Slope of oxygen trace, background O2 s−1
𝜔 Fraction used in selecting respirometer designQ10 Temperature coefficient, used for correcting
temperature effectsT1 Temperature endpoint used for correcting
temperature effects
∘ C
T0 Temperature start point used for correctingtemperature effects
∘ C
D Dilution ratio s−1
FF Flushing rate l s−1
t1 Time start st2 Time end s𝛼 Residual water fraction
© 2015 The Fisheries Society of the British Isles, Journal of Fish Biology 2016, 88, 26–50