Embed Size (px)
Citation preview

Source Controls in Basins Tributary to th E l d P t ti A
Source Controls in Basins Tributary to th E l d P t ti A
Carmela Bedregal and Carlos AdorisioCarmela Bedregal and Carlos Adorisio
the Everglades Protection Areathe Everglades Protection Area
Carmela Bedregal and Carlos AdorisioEverglades Regulation Division
7th Annual Public Meeting on the Long-Term Plan for Achieving Water Quality
Carmela Bedregal and Carlos AdorisioEverglades Regulation Division
7th Annual Public Meeting on the Long-Term Plan for Achieving Water Quality7th Annual Public Meeting on the Long-Term Plan for Achieving Water Quality Goals for the Everglades Protection Area Tributary Basins
February 25, 2010
7th Annual Public Meeting on the Long-Term Plan for Achieving Water Quality Goals for the Everglades Protection Area Tributary Basins
February 25, 2010

EPA Tributary BasinsEPA Tributary Basins
EAAC-139C-139 AnnexC 51 WestC-51 WestNorth Springs Improvement District (NSID)C-11 WestNorth New River Canal (NNRC)Feeder Canal
L-28
C-111
22
Boynton Farms

BASINS TRIBUTARY TO THE EVERGLADES
33

Long Term Plan Project ObjectivesLong Term Plan Project Objectives
The Process Development and Engineering (PDE) t f th L T Pl d
p g g ( )component of the Long-Term Plan recommends activities designed to:
“Maintain and improve upon the contribution of sourceMaintain and improve upon the contribution of source controls to overall water quality improvement goals.”
Specifically:p yIdentify discharges that are candidates for implementation of cost effective source controlsCharacterize management practices on lands or g pprocesses tributary to those discharges
Implement these source controls in concert with landowners or municipalities
44

EAA Source Control ProjectsEAA Source Control Projects
1. BMP Program Implementation
2. BMP Research under the EAA-EPD Research Permit
3. East Beach WCD Synoptic Water Quality Data Collection
4. Performance Measure Development for LOK Diversion Areas
55
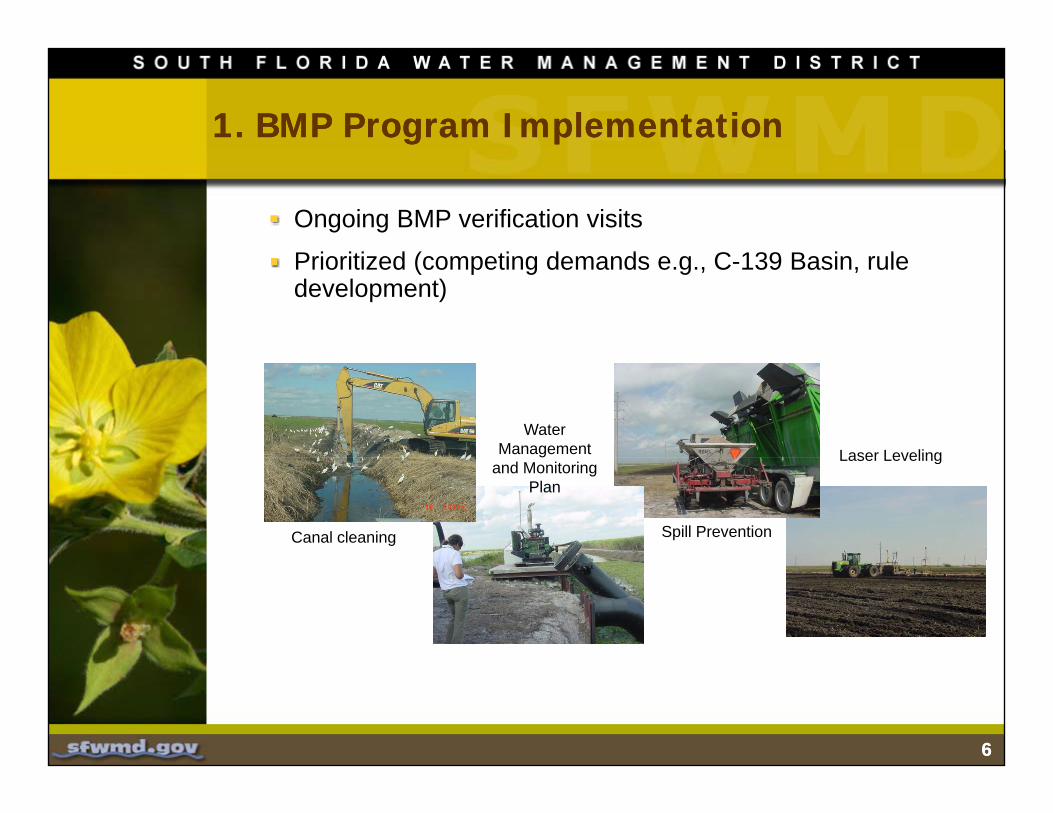
1. BMP Program Implementation1. BMP Program Implementation
Ongoing BMP verification visits
P i iti d ( ti d d C 139 B i lPrioritized (competing demands e.g., C-139 Basin, rule development)
Water Management Laser Leveling
Canal cleaning
and Monitoring Plan
Spill Prevention
Laser Leveling
66

2. BMP Research Under EAA-EPD Permit2. BMP Research Under EAA-EPD Permit
The BMP research permit modification was d J 11th 2010approved on January 11th, 2010.
The Master Research Permit is valid for 5 years.
The updated Scope of Work (SOW) proposes to:p p ( ) p p
- Research the impact of alternate management practices for the control of floating aquatic vegetation (FAV) in EAA farm canals
- Develop improved techniques for FAV management, and
- BMP education and extension services (UF/IFAS)BMP education and extension services (UF/IFAS)
77

3. East Beach Synoptic Water Quality Data Collection3. East Beach Synoptic Water Quality Data CollectionData CollectionData Collection
Urban and agricultural area
Understand potentialUnderstand potential phosphorus sources for an effective strategy
Initial synoptic effort 01/08 toInitial synoptic effort 01/08 to 09/08
Constraints:Data reflected dry conditionsData reflected dry conditions
All data from no flow days
Current Second year of data (water quality and quantity)(water quality and quantity) collection (01/09 to 09/09)
Data are under evaluation
88

4. Performance Measure Development 298 Diversion Districts and Closter Farms4. Performance Measure Development 298 Diversion Districts and Closter Farms298 Diversion Districts and Closter Farms298 Diversion Districts and Closter Farms
EFA mandates: “Conduct modifications described in the Everglades Construction Project”Everglades Construction Project
Objective: reduce TP historic loads by 25% based on BMPs, and reduce TP historic loads discharged to the Lake Okeechobee by 80% based on diversionOkeechobee by 80% based on diversion
Status:1. Developed preliminary
performance methodology
C10
EBPS3
performance methodology based on 3-yr target, annual limits; and for Lake discharges a two-tiered cumulative and
EPD-07
S236
SFCD5ESSDDMC
C4A
C10
C12A
C12
ESPS2
individual analysis2. Incorporating comments from
FDEP and refinements to methodology
99
C Amethodology

C-139 Source Control ProjectsC-139 Source Control Projects
1. BMP Program Implementation
2. Rule Developmentp3. District-funded BMP
Demonstration4 Supplementary Water4. Supplementary Water
Quality Collection and Analysis
5. Regional Feasibility g yAnalysis
1010

1. Program Implementation1. Program Implementation
Annual BMP inspectionsBMP implementation contin es to impro eBMP implementation continues to improve:
Documentation on P nutrients applied and application rates
C l ti f b d f tCompletion of above ground surface water impoundments
Methods for implementation of nutrient application control, spill prevention, and sediment controls, p p ,
ImpoundmentsPlastic Mulch
Controlled
1111
Canal CleaningApplication Methods

2. Basin Rule Development - Background2. Basin Rule Development - Background
Rule development was initiated in May 2007The C-139 Basin had been out of compliance with the water quality requirements of Rule 40E-63, F.A.C., for four times.S P bli R l D l t W k h dSeven Public Rule Development Workshops and seven Technical Working Group MeetingsA first draft for internal review was distributed on November 20 2009November 20, 2009Two follow-up workshops to discuss amendmentsOne-on-one meetings with stakeholders on request
1212

2. Basin Rule Development - Summary2. Basin Rule Development - Summary
Water quality performance measuresq y pBetter fit rainfall to runoff relationship
Comprehensive BMP PlansI l t ti f t t t i t tImplementation of water management, nutrient management and particulate mater and sediment control BMPs
Out-of complianceI t A ti iti ill b b d th ti lImprovement Activities will be based on the proportional share of the load
District sub-basin monitoring or permittee monitoring
1313

2. Basin Rule Development - Current2. Basin Rule Development - Current
A second draft was distributed on 02/11/10Clarification and some revisions in response to stakeholders questions and commentsA follow-up workshop is scheduled for Wednesday, 02/17/10 t th Di t i t Cl i t Fi ld St ti02/17/10 at the District Clewiston Field Station Draft Rule and workshop agenda are posted at: www.sfwmd.gov/rulesC d d l h h k h dComments are needed no later than the workshop date to meet the objective of having the Rule adopted by August 2010
1414

3. 1 BMP Demonstration: Vegetable Production - Background3. 1 BMP Demonstration: Vegetable Production - Backgroundegetab e oduct o ac g ou degetab e oduct o ac g ou d
Optimize phosphorus nutrient application for vegetablesg
Seven year demonstration project (2005 - 2011)Implemented by UF-IFAS, Southwest Florida Research and Education Center (SWFREC)and Education Center (SWFREC)
Partnership agreement with FDACS
Five vegetable producersEffort and risk to crops
Crops: Tomatoes, green beans, peppers, hot peppers
1515

3.1 Vegetable Demonstration - Update3.1 Vegetable Demonstration - Update
Weather Impacts on the results2008 2010 results affected by freezes2008 – 2010 results affected by freezes
2009 – 2010 some of the demonstration sites were lost
Data are being collected and status reports producedR t lt ll if l fi diRecent results generally verify early findings
Reports available on requestSeparate presentation once 2009-2010 data are analyzed.
1616

3.2 BMP Demonstration Grant3.2 BMP Demonstration Grant
Cooperative agreement SFWMD - HSWCDObjective: to cost share projects focused on innovationObjective: to cost-share projects focused on innovation and/or optimization of traditional BMPs for phosphorus removalOpen competition processTwo projects were selected for funding:
1. Surface water impoundment (AGI) optimization2. Chemical precipitation after AGIActivities started in December 2008Total Cost: $265,035
1717

3.2 BMP Demonstration Grant (continues)3.2 BMP Demonstration Grant (continues)(continues)(continues)
1. AGI OptimizationRelocation of outfall structure away from inflow structuresSmall internal berms were
t d t t dcreated to ensure storage and detention time are achieved (circuitous route) Water quality and quantityWater quality and quantity data are collected during discharge events (one year).
1818

3.2 BMP Demonstration Grant (continues)3.2 BMP Demonstration Grant (continues)(continues)(continues)
Cell 6C
Cell 6DRelocation of
outfall structure
Cell 6A
Cell 6E
Cell 6F
Old outfall structureCell 6B
1919
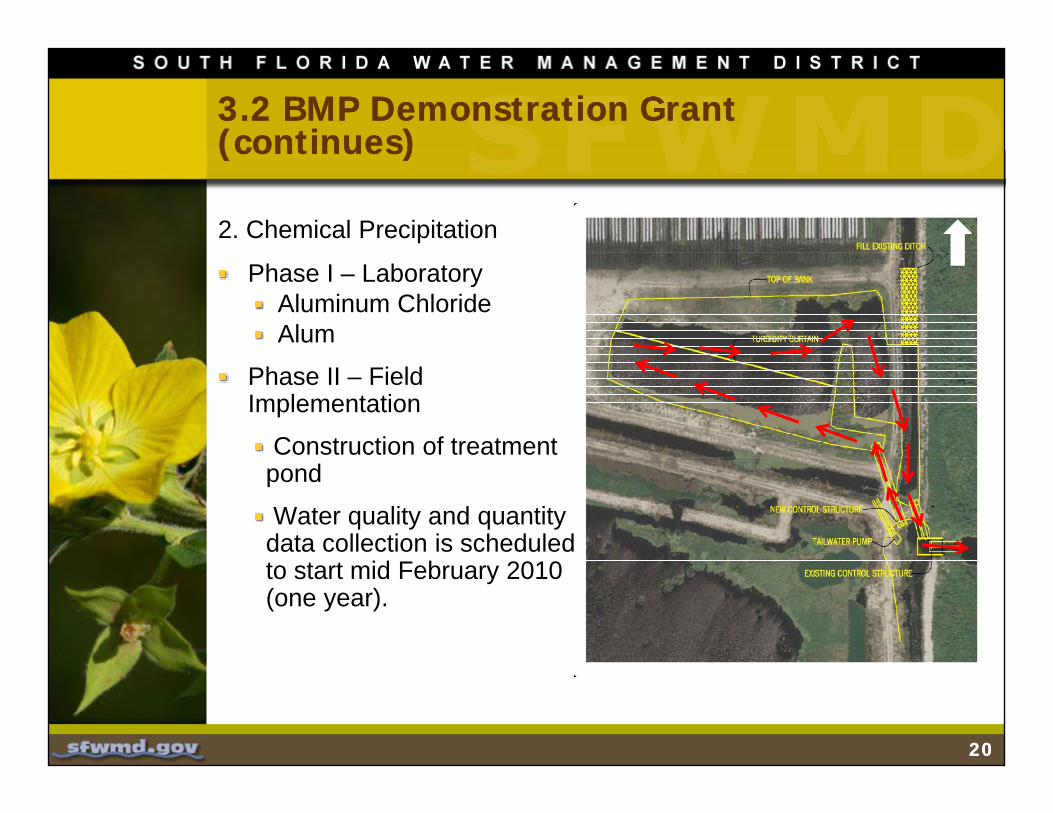
3.2 BMP Demonstration Grant (continues)3.2 BMP Demonstration Grant (continues)(continues)(continues)
2. Chemical Precipitation
Phase I – Laboratory Aluminum ChlorideAlum
Phase II – Field Implementation
Construction of treatment pond
Water quality and quantity data collection is scheduled to start mid February 2010 (one year).
2020

3.2 BMP Demonstration Grant (continues)3.2 BMP Demonstration Grant (continues)(continues)(continues)
2121

3.3 UF-IFAS Southwest Florida Research and Education Center, AGI Performance E l ti
3.3 UF-IFAS Southwest Florida Research and Education Center, AGI Performance E l tiEvaluationEvaluation
Project Manager: Ximena Pernett
Obj ti Q tif thObjective: Quantify the phosphorus nutrient treatment efficiency of an AGI in a vegetable farm.
Project started in June 2009
Monitoring system components installed and operational on July 20, 2009July 20, 2009
To date, soil samples and topographic data have been collected.
Plant sampling and tracer study will be completed by October, 2010.
Quarterly Report 2 end of
2222
Quarterly Report 2 – end of February

4.3 UF-IFAS SWFREC, AGI Performance Evaluation (continues)4.3 UF-IFAS SWFREC, AGI Performance Evaluation (continues)Evaluation (continues)Evaluation (continues)
Outflow StructureOutflow Structure
Inflow Structures
2323

4. Supplemental WQ Collection and Analyses4. Supplemental WQ Collection and AnalysesAnalysesAnalyses
The supplementary monitoring network started in 2006 (primarily grab)in 2006 (primarily grab) Evolved into a permanent stations (autosampler and flow)
9 permanent monitoring locations representing 8 sub-basinsTP autosamplers and daily flowdaily flow Weekly grab samples or TP, TDP, and SRP (when autosample weekly composites are collected)
2010 Analysis report under development
2424
5. C-139 Regional Feasibility Study5. C-139 Regional Feasibility Study
Study includes C-139 L-28 and FeederStudy includes C-139, L-28 and Feeder Canal BasinsPurpose is to determine the feasibility of Regional and/or Sub-Regional projects for improvements of Water Quality leaving the basinsCalibrated and verified Mike-She/Mike 11 model of region delivered 2/1/10Next steps are to define alternatives and analyze with model beginning May 2010
2525

C-139 Annex Source Control ProjectsC-139 Annex Source Control Projects
1. Diversion of Flows to STA-6
Diversion work (new discharge structure) is completed
Negotiation of Environmental Resource Permit (ERP) for operation ( ) pof new structure ongoing
ERP to include BMP implementation, waterimplementation, water quality monitoring and TP discharge limit requirements
2626
2. Regional Feasibility Study

C-51 West Source Control ProjectsC-51 West Source Control Projects
1 ERP Program1. ERP Program2. Cooperative Agreements
2727
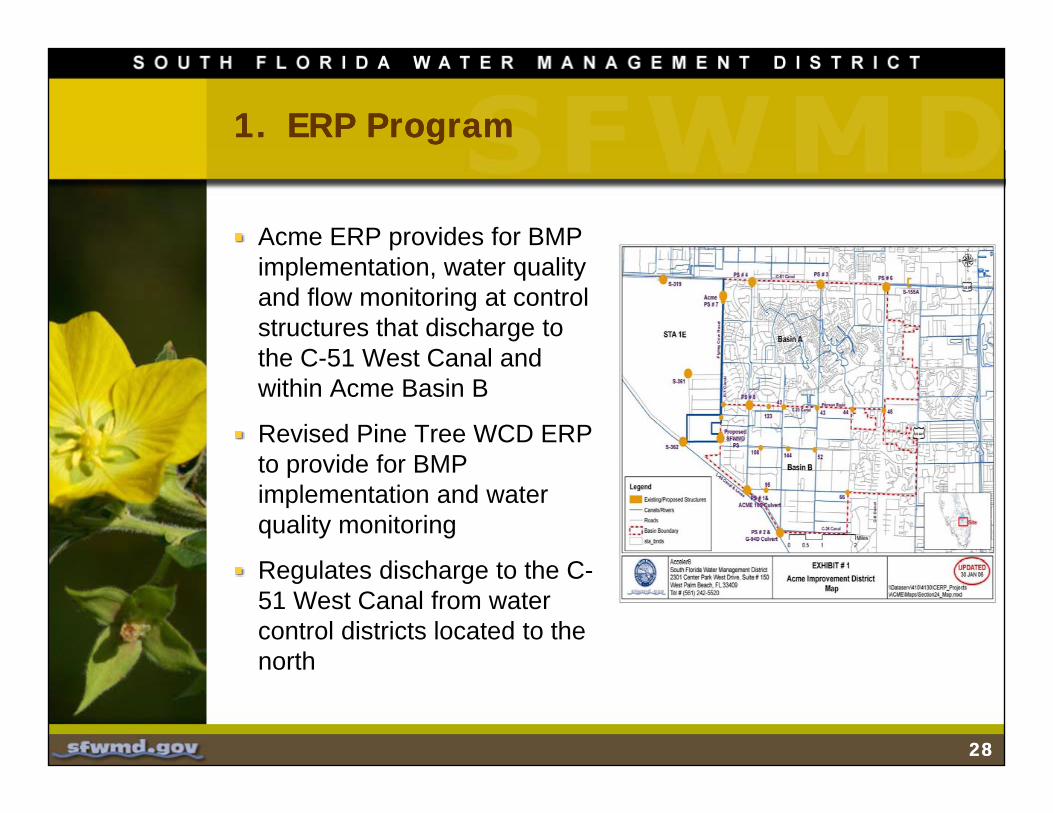
1. ERP Program1. ERP Program
Acme ERP provides for BMP implementation, water quality and flow monitoring at control structures that discharge to the C 51 West Canal andthe C-51 West Canal and within Acme Basin B
Revised Pine Tree WCD ERP t id f BMPto provide for BMP implementation and water quality monitoring
CRegulates discharge to the C-51 West Canal from water control districts located to the northnorth
2828

1. Cooperative Agreements 1. Cooperative Agreements
Recently completed agreements assisted the Village of Wellington in the development and implementation of a BMP Planimplementation of a BMP Plan
•
2929

VOW Basin to WCA-1-Water Quality ResultsVOW Basin to WCA-1-Water Quality Results
7 0
8.0
175
200
5 0
6.0
7.0
125
150
175
&
3.0
4.0
5.0
Ann
ual
TP lo
ad
(mt)
75
100
125
P FW
MC
(ppb
) R
ainf
all (
in)
1.0
2.0
3 0
25
50
5 T
0.0 0
TP Load (mt) 5.469 7.278 6.947 1.612 5.006 2.254 2.184 4.969 3.235 4.185 TP FWMC (ppb) 94 161 144 94 122 100 89 171 97 129
WY 98 WY 99 WY 00 WY 01 WY 02 WY 03 WY 04 WY 05 WY 06 WY 07
TP FWMC (ppb) 94 161 144 94 122 100 89 171 97 129Rainfall (in) 65.6 48.3 69.7 41.6 63.7 55.6 47.1 45.9 50.8 43.9Flow Vol. (kac-ft) 47.292 36.734 39.010 13.948 33.194 18.282 19.889 23.563 26.928 26.322

VOW Basin to C-51W Canal-Water Quality ResultsVOW Basin to C-51W Canal-Water Quality Results
175
200
7.0
8.0
125
150
5.0
6.0
&
75
100
3.0
4.0
TP F
WM
C (p
pb)
Rai
nfal
l (in
)
Annu
al
TP lo
ad
(mt)
25
50
75
1 0
2.0
3.0 T
WY 07 WY 08 WY 09 WY 10*TP Load (mt) 0.428 5.613 6.544 0.201 Flow Vol (kac ft) 4 800 63 782 80 595 2 552
0
25
0.0
1.0
3131
Flow Vol. (kac-ft) 4.800 63.782 80.595 2.552 TP FWMC (ppb) 72 71 66 64Rainfall (in) 43.9 57.0 47.3 48.3

NSID Source Control ProjectsNSID Source Control Projects
1 ERP Program1. ERP Program2. Public Education and
Outreach Agreement with Broward CountyBroward County
3232

1. ERP Program1. ERP Program
Revised NSID ERP to provide for:water quality and flow monitoring at NSID discharge to the EPAwater quality monitoring at q y gupstream locations throughout the basinMinimize discharges to the EPA through operational controls and Memorandum of Understandinglimits allowable TP loading to the EPABMP Plan for public education and capital improvement projects
3333

2. Agreement with Broward County2. Agreement with Broward County
Assists local communities by providing public education and outreach for BMP implementation; includes ‘Know the Flow’ courses provided to hundreds of homeownerhundreds of homeowner association property managers
Thi d f thThird year of three year contract with intent to renew
3434•

NSID Basin – Water Quality ResultsNSID Basin – Water Quality Results
800.40
50
60
70
0 25
0.30
0.35
) &
30
40
50
0 15
0.20
0.25
TP F
WM
C (
ppb)
Rai
nfal
l (in
)
Ann
ual
TP lo
ad(m
t)
10
20
30
0 05
0.10
0.15
WY 98 WY 99 WY 00 WY 01 WY 02 WY 03 WY 04 WY 05 WY 06 WY 07 WY 08 WY 09 WY 10*TP Load (mt) 0.300 0.150 0.329 0.048 0.049 0.025 0 0.009 0 0 0 0 0Flow Vol (kac-f t) 7 364 6 762 9 881 2 412 2 494 0 688 0 0 354 0 0 0 0 0
0
10
0.00
0.05
**Flow Vol. (kac f t) 7.364 6.762 9.881 2.412 2.494 0.688 0 0.354 0 0 0 0 0TP FWMC (ppb) 33 18 27 16 16 20Rainfall (in) 58.8 49.8 67.1 39.6 54.9 45.0 49.2 38.7 53.0 47.4 56.7 45.6 56.5
NDF NF NF NF NF NF NF

C-11 West Source Control ProjectsC-11 West Source Control Projects
1. ERP Program2. Participation in Broward
Everglades Working GroupEverglades Working Group3. Public Education and
Outreach Agreement with Broward CountyBroward County
3636

1. ERP Program1. ERP Program
ERPs for South Broward Drainage District (SBDD), Central Broward Water Control District (CBWCD) and Indian Trace Drainage District (ITDD) provide for:
operational controls to limit di h t th C 11 W tdischarge to the C-11 West Canal
water quality monitoring at discharges to the C-11 Westdischarges to the C-11 West Canal
Include BMP requirements in new developments asnew developments, as necessary
3737

2. Broward Everglades Working Group2. Broward Everglades Working Group
Broward County driven group y g pcomprised of public and private sector individuals and organizations to develop, evaluate and implement source controls to improve water quality in discharges to the C-11 West CanalCanal
Provides annual review of water quality monitoring results within the C 11 West basin and tracksthe C-11 West basin and tracks the progress of phosphorus reduction programs
3838

C-11 W Basin - Water Quality ResultsC-11 W Basin - Water Quality Results
9012
60
75
8
10
b) &
)
30
45
4
6
TP F
WM
C (
ppb
Rai
nfal
l (in
)
Ann
ual
TP lo
ad
(mt)
15
30
2
4
WY 98
WY 99
WY 00
WY 01
WY 02
WY 03
WY 04
WY 05
WY 06
WY 07
WY 08
WY 09
WY 10*
TP Load (mt) 5.250 5.193 10.125 4.881 6.716 5.580 5.122 2.972 4.262 2.306 2.805 2.562 3.484Flow Vol. (kac-f t) 250.35 221.58 273.61 172.04 283.61 264.30 257.31 149.98 189.81 123.81 140.43 143.17 184.07
00
TP FWMC (ppb) 17 19 30 23 19 17 16 16 18 15 16 15 15Rainfall (in) 59.5 51.6 56.6 39.9 30.7 50.0 45.0 40.9 45.8 33.3 35.8 38.6 55.2

NNRC Source Control ProjectsNNRC Source Control Projects
1. ERP Program2. Public Education and
Outreach Agreement with Broward County
3. No discharge to the EPA i WY 04EPA since WY 04
4040

NNRC Basin - Water Quality ResultsNNRC Basin - Water Quality Results
901.2
60
75
0.8
1.0
) &
450.6
TP F
WM
C (
ppb)
Rai
nfal
l (in
)
Ann
ual
TP lo
ad
(mt)
15
30
0.2
0.4
WY 01 WY 02 WY 03 WY 04 WY 05 WY 06 WY 07 WY 08 WY 09 WY 10*TP Load (mt) 0.615 1.057 0 0.046 0 0 0 0 0 0Flow Vol. (kac-f t) 38.379 52.047 0 2.299 0 0 0 0 0 0
00.0
TP FWMC (ppb) 13 16 16Rainfall (in) 44.1 59.1 48.5 52.8 38.2 55.3 38.8 48.4 42.8 54.5
NF NF NF NF NF NF NF

Feeder Canal Source Control ProjectsFeeder Canal Source Control Projects
1. BMP Implementation at McDaniel Ranch
2. Integrated Permit Compliance g pInitiative
3. Preliminary activities in support of future regulatory pp g ysource control program
4. Supplementary Water Quality Collection and Analysis
5. Regional Feasibility Study
4242

Feeder Canal Basin - Water Quality ResultsFeeder Canal Basin - Water Quality Results
24030
160
200
20
25
12015
P F
WM
C (
ppb)
&
Rai
nfal
l (in
)
Ann
ual
TP lo
ad
(mt)
40
80
5
10
TP
WY 98
WY 99
WY 00
WY 01
WY 02
WY 03
WY 04
WY 05
WY 06
WY 07
WY 08
WY 09
WY 10*
TP Load (mt) 7.026 4.453 13.241 8.141 9.329 9.358 14.410 11.288 28.717 18.782 3.151 14.863 7.436
00
( )Flow Vol. (kac-f t) 70.317 47.504 97.586 37.286 84.982 88.026 117.69 94.581 150.35 70.727 25.310 87.754 72.570TP FWMC (ppb) 81 76 110 177 89 86 99 97 155 215 101 137 83Rainfall (in) 54.4 40.8 58.9 45.4 51.4 55.0 55.7 51.3 61.8 56.5 50.7 42.6 58.1

L-28 Source Control ProjectsL-28 Source Control Projects
1. Diversion of C-139 Annex Flows to STA-6 (see C-139 Annex slide)
2. Regional Feasibility Study
4444

L-28 Basin - Water Quality ResultsL-28 Basin - Water Quality Results
140
160
14
16
100
120
140
10
12
14
60
80
100
6
8
10
TP F
WM
C (
ppb)
&
Rai
nfal
l (in
)
Ann
ual
TP lo
ad
(mt)
20
40
60
2
4
6
WY 98 WY 99 WY 00 WY 01 WY 02 WY 03 WY 04 WY 05 WY 06 WY 07 WY 08 WY 09 WY 10*TP Load (mt) 6.920 6.414 15.543 11.185 6.460 10.444 7.018 7.215 12.507 5.117 4.046 6.648 7.034Flow Vol. (kac-f t) 155.84 94.543 180.01 62.972 109.99 136.42 136.15 137.97 203.57 88.518 90.340 136.305 106.287
0
20
0
2
Flow Vol. (kac f t) 155.84 94.543 180.01 62.972 109.99 136.42 136.15 137.97 203.57 88.518 90.340 136.305 106.287TP FWMC (ppb) 36 55 70 144 48 62 42 42 50 47 36 40 54Rainfall (in) 55.7 46.8 58.0 35.0 48.2 39.0 41.3 39.2 49.0 34.5 48.5 47.8 42.2

Boynton Farms Source Control ProjectsBoynton Farms Source Control Projects
1 ERP Program1. ERP Program
Require ERP modification to meet water quality standards in discharges to EPA
3 out of 4 original farms have diverted flows away from EPA (remaining farm:(remaining farm: Palm Beach County’s Amestoy Property)
N di h t EPA
4646
No discharges to EPA since WY08

C-111 BasinC-111 Basin
C-111 Basin discharges to EPA meet phosphorus criterion requirements of qSettlement Agreement
4747
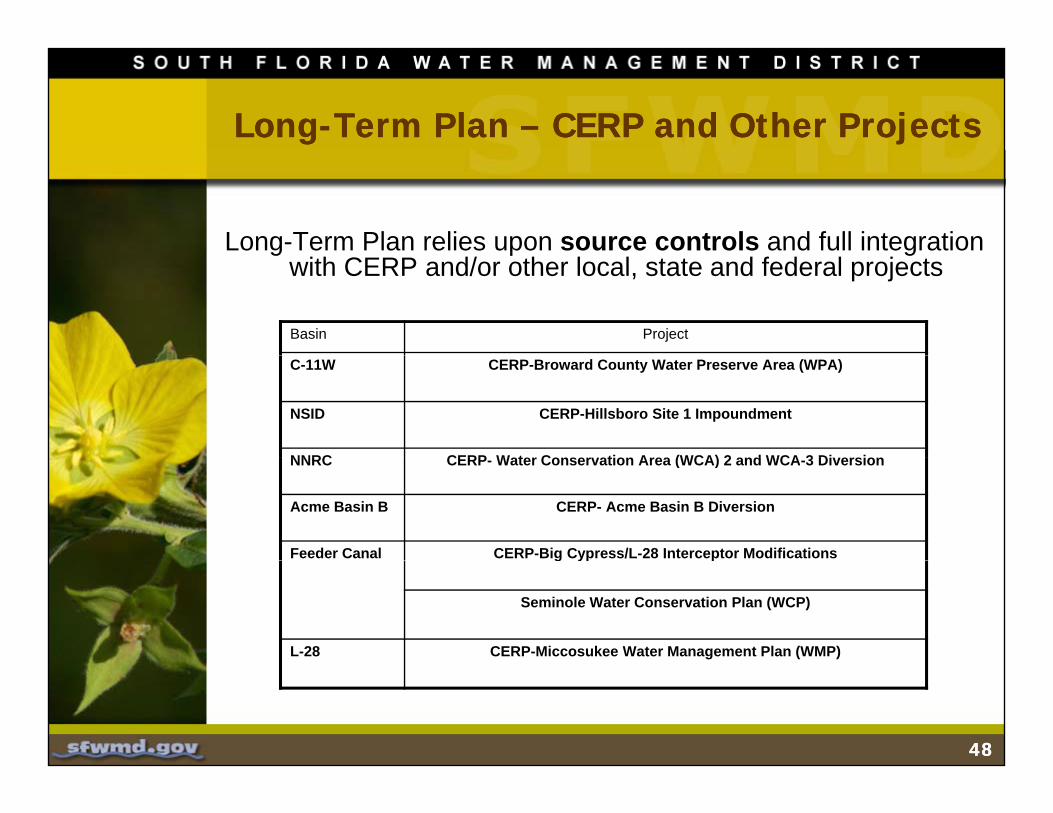
Long-Term Plan – CERP and Other ProjectsLong-Term Plan – CERP and Other Projects
Long-Term Plan relies upon source controls and full integration g p gwith CERP and/or other local, state and federal projects
Basin Project
C-11W CERP-Broward County Water Preserve Area (WPA)
NSID CERP-Hillsboro Site 1 Impoundment
NNRC CERP Water Conservation Area (WCA) 2 and WCA 3 DiversionNNRC CERP- Water Conservation Area (WCA) 2 and WCA-3 Diversion
Acme Basin B CERP- Acme Basin B Diversion
Feeder Canal CERP-Big Cypress/L-28 Interceptor Modificationsg yp p
Seminole Water Conservation Plan (WCP)
L-28 CERP-Miccosukee Water Management Plan (WMP)
4848

SummarySummary
1. On-going mandatory BMP Program implementation (EAA and C 139 Basin)(EAA and C-139 Basin)
2. Adaptive management based on:
BMP d t ti d h• BMP demonstration and research
• Supplementary monitoring initiatives
3. Rule-development as needed to incorporate findings
4. Environmental Resource Permit (ERP) program is being used, when necessary or applicable, to require BMP , y pp , qimplementation (including capital improvement projects, operational changes, public outreach, etc.) and water quality monitoring
4949

Summary (Cont’d)Summary (Cont’d)
5. Developing preliminary evaluation of performance measures in support of future regulatory source control program for in support of future regulatory source control program for Feeder Canal Basin
6. Working cooperatively with landowners, local governments, drainage districts, tribal representatives, stakeholders, and t t d f d l i i k f fstate and federal agencies is key for success of source
control projects7. Many EPA Tributary Basins rely also in full integration with
CERP and/or other local state and federal projects toCERP and/or other local, state and federal projects to achieve water quality goals
8. Continue water quality monitoring is necessary to track the success of the source control projects in the EPA Tributary p j yBasins
District staff are available to discuss these projects in more detail.
5050
Thank you for your attention

DRAFT 2010 SOUTH FLORIDA ENVIRONMENTAL REPORTDRAFT 2010 SOUTH FLORIDA ENVIRONMENTAL REPORTENVIRONMENTAL REPORTENVIRONMENTAL REPORT
Chapter 4: Phosphorus Source Controls for the South Florida p pEnvironment http://www.sfwmd.gov/sfer/
5151