Embed Size (px)
Citation preview

Bloomberg: VNDS
DDAAIILLYY MMAARRKKEETT RREECCAAPP 0077 FFeebbrruuaarryy,, 22001188
IN ALLIANCE WITH
Market commentary: The VN-INDEX reversed strongly and successfully passed the 1,040-pt level due to the impressive recovery of blue-chips.
Vietnam’s stock market showed renewed vigor, as large cap stocks advanced today. Following the recovery of stock markets globally,
Vietnam’s stock market kicked off positively with the two main bourses starting off in the green. The index later accelerated its advance due to the strong support of heavy-weighted stocks, such as BID, GAS and VJC. The increase mainly resulted from the gains of the Oil and Gas, Financial and Industrial sectors. Banking stocks regained all losses from yesterday’s plummet, led by BID, which hit the ceiling price with a huge demand surplus, followed by VCB, VPB and HDB. Oil and Gas stocks saw an impressive jump, and GAS was the index’s largest supporter, surging by 5.0% thanks to the huge net-buying value from foreign investors. This stock alone contributed 3.6pts to the index’s overall gain. Other Oil & Gas tickers also had positive performance, including PLX and PVS, while only PVD declined. The uptrend was further consolidated when many mid-cap stocks and small-cap stocks rallied, such as AAA, NLG and VND. On the other hand, only a few blue-chips underperformed today, led by MSN, NVL and VIC. However, these laggards were far surpassed by their other large counterparts. As a result, the VN-INDEX gained 29.0pts (+2.9%) to close above the 1,040-pt level with 242 gainers, 58 losers and 51 unchanged. The HNX-INDEX also had an optimistic trading day and finally landed at 119.6pts (+3.5%) with 160 advancers, 45 decliners and 179 unchanged.
All sectors rose today, led by the IT (+5.1%), Industrial (+4.9%) and Financial (+4.5%) sectors. Top index movers consisted of GAS (+5.0%),
BID (+6.9%), VRE (+6.8%), VJC (+7.0%) and VCB (+2.4%). Top index laggards included MSN (-3.5%), NVL (-1.3%), SBT (-5.0%), PVD (-4.1%) and VIC (-0.1%). The top 3 major block trades were VJC with 2.2mn shares (VND355.7bn), GEX with 5.3mn shares (VND150.8bn) and NVL with 1.4mn shares (VND117.4bn).
Foreigners net sold on HOSE worth VND224.5bn and net bought on HNX worth VND3.4bn. They mainly bought HDB (VND87.2bn), HPG
(VND83.1bn) and VRE (VND60.9bn) and sold HPG (VND197.5bn), VNM (VND117.3bn) and VRE (VND71.7bn).
Snapshot HOSE HNX
Close (pts) 1,040.6 119.6
1 Day change (%) 2.86 3.45
Volume (mn shs) 241.2 58.1
Value (US$mn) 291.3 37.6
Gainers 242 160
Losers 58 45
Unchanged 51 179
Commodities & Currencies Close %chg
Gold(USD/Oz) 1,328 0.13
WTI Oil ($/B) 1Mth 63.09 -0.47
Brent Oil ($/B) 1Mth 66.68 -0.27
USDVND 22,700 0.02
EURVND 28,057 0.27
Source: Bloomberg
1,011.6
1,019.6
1,027.6
1,035.6
1,043.6
VN-INDEX
115.0
116.2
117.4
118.6
119.8
HNX-INDEX
Sectors Price Index P/E P/B Country Close 1D chg P/E P/B Market cap
(VNIndex) 1D chg Wgt x x Peering Points % x x US$bn
Consumer Discretionary 2.32% 0.74 17.03 4.85 China 4,050.5 0.49% 16.62 2.06 5,002
Consumer Staples 0.24% 6.46 31.25 9.55 India 10,476.7 -0.51% 22.43 3.16 1,166
Energy 4.10% 3.16 61.95 4.04 Indonesia 6,534.9 2.82% 24.88 2.66 533
Financials 4.45% 4.05 21.39 2.94 Laos 966.2 -3.23% 14.04 0.85 1
Health Care 5.12% 0.24 20.6 3.61 Malaysia 1,836.7 2.22% 16.66 1.71 282
Industrials 4.87% 1.56 37.75 9.3 Philippines 8,667.6 1.28% 23.37 2.54 203
IT 3.88% 0.94 11 2.49 Taiwan 10,551.5 -0.86% 15.39 1.73 1,062
Materials 2.57% 1.8 10.71 2.35 Thailand 1,785.4 1.81% 18.53 2.12 567
Real Estate 1.78% 4.64 32.63 4.76
Utilities 4.40% 6.16 20.52 4.5 Vietnam 1,040.6 5.72% 19.20 2.93 121
7-FebSource: Bloomberg Source: Bloomberg

Bloomberg: VNDS
DDAAIILLYY MMAARRKKEETT RREECCAAPP 0077 FFeebbrruuaarryy,, 22001188
IN ALLIANCE WITH
Market News
Oil rallies as stockpile surprise brings relief from global rout. A day after oil was swept up in a
global market rout, crude is rebounding as investor focus snaps back to U.S. supplies. Futures in
New York rose as much as 1.3%, following a 1.2% drop in the previous session as a flight from risk
shook assets around the world. While equity markets are clawing back on calls to ‘buy the dip,’
crude’s advance is being driven by industry data that showed an unexpected decrease in U.S.
stockpiles. Investors are watching if government data also surprises with a decline when it’s
released on Wednesday. As calm returns to markets, Goldman Sachs Group Inc. stuck to its bullish
call on commodities, saying the recent global selloff only bolsters its view that raw materials are set
to perform well in months ahead. Still, crude is struggling to extend last month’s gains that were
largely driven by a weaker dollar, on speculation that U.S. output will impede efforts by OPEC and
its allies to curb a glut. “What’s happening in the U.S. has become critical to the oil market,
whether it’s inventories and production figures or the movement in the greenback,” Will Yun, a
commodities analyst at Hyundai Futures Corp., said by phone from Seoul. “While oil prices are
likely to be supported at this level after its correction, the upcoming U.S. data will be the deciding
factor” for future prices. (Bloomberg)
Profitable FDI businesses pay low taxes. The foreign direct investment (FDI) sector contribute a
modest amount to the State budget although they enjoy many incentives and receive high profits.
According to GSO (General Statistics Office of Vietnam)’s Feb 06 report on the development of
businesses in centrally run cities in 2017 and the 2010-2016 period, FDI businesses have achieved
the highest turnover growth among economic sectors. They recorded a turnover of around
US$216bn in 2016 and an average growth of 23% in the 2010-2016 period. They earned
VND327,400bn in profit, accounting for 45.9% of the profits earned by businesses from all sectors.
However, they made the smallest contribution to the State budget with just VND250,900bn,
according to GSO’s Director of Industry Statistics Department Pham Dinh Thuy. The reason is that
FDI businesses involved in hi-tech production are exempted from different types of taxes, including
corporate income taxes. In addition, many localities have implemented their own tax exemption
policies to attract more FDI businesses. Besides, some FDI businesses have made corrupt use of
policies and transfer pricing that State agencies have not detected or even imposed no sanctions.
The GSO suggests that the Government and relevant ministries should double check the incentives
offered by localities to ensure equality for all economic sectors, said Mr Thuy. (En.vietnamnet.vn)
Laos top recipient of Vietnamese investment. Vietnam's Foreign Investment Agency (FIA) was
quoted in VietNamNet on Monday as saying that by the end of September 2016, Vietnam had 266
licensed projects in Laos with total registered capital of US$5.1bn. However, Prime Minister
Thongloun Sisoulith told a press conference held on the sidelines of the 40th meeting of the Laos-
Vietnam Cooperation Committee in Vientiane on Monday that Vietnamese enterprises have so far
invested US$3.7bn into projects in Laos. An official at the Lao Ministry of Planning and Investment
said he assumed the balance was probably also destined for investment in Laos. Prime Minister
Thongloun pledged that the Lao government would continue to assist Vietnamese companies to
ensure their projects proceeded as planned. Vietnamese business interest in Laos are mostly in the
industrial, agriculture,telecommunications, finance, banking and hydropower development fields
and other services. Economists say the close proximity of Laos is one of the main reasons
Vietnamese companies want to do business here, which has contributed to economic growth and
generated job opportunities in Laos over the past decades. (Asianews)

Bloomberg: VNDS
DDAAIILLYY MMAARRKKEETT RREECCAAPP 0077 FFeebbrruuaarryy,, 22001188
IN ALLIANCE WITH
IPO Note
Vietnam Rubber Group (VNRG – unlisted) – IPO note - NON-RATED
VNRG, the largest rubber plantation operator in Vietnam, held its IPO auction on February
2nd, 2018. The company’s solid core operations will support earnings growth in the future.
The IPO valuation was not cheap enough to draw the attention of a local strategic investor
or the public, and there will not be any foreign investors in the post-IPO divestment.
However, we are looking for a more detailed development plan on around 10k ha of
“repurposed” land in highly valuable locations, which could improve VNRG’s current poor
asset turnover relative to its peer group; this could be a positive price catalyst when
announced.
VNRG has a huge land bank, but lacks an execution plan. VNRG is now in possession (through
long-term leases) of nearly 520k ha of land, including a 68k ha parcel located in the most active
industrial area of the country (Binh Duong, Dong Nai) of which 6,000 ha is already developed as
industrial park area in Dong Nai and Binh Duong province; 4,000 ha of this is already under
operation with around 70% blended occupancy rates; the remaining undeveloped land bank could
be highly valuable for future project development.
The company’s young plantation ensures that it will have strong volume growth in the
future despite no acreage expansion. Half of VNRG’s rubber plantation profile consists of pre-
mature fields (40% of total plantations). Most of these plantations will be ready for tapping during
2018-2020, which should drive a 15% CAGR in volume over this period. The total plantation could
be capped by the government’s nationwide plantation zoning system. Therefore, VNRG will not be
able to achieve further volume growth by expanding its acreage.
The company is targeting a 31% CAGR in earnings between 2018-2020, which we believe is
achievable. Despite the expectation for moderate growth in rubber prices over the period (5-
10%/annum), VNRG can still deliver its targeted 23% CAGR in revenue thanks to strong volume
growth. Furthermore, disposable income from its aged rubber fields will contribute to its bottom line,
which will be supported by continued favorable rubber wood prices.
The specter of hidden liabilities from past investment failures has been lifted. VNRG has
declared its divestment plan for non-core assets, although the amount of financial income that it will
generate through these sales is still unclear. It has also now fully explained the core-businesses
capital injection and intercompany transactions worth a total of over VND5trl and therefore there
are no major obligations to the state in the future. This should alleviate concerns over potential
irregularities in past capital allocation decisions, which could have invited regulatory scrutiny and
consequent penalties, and consequently tarnished management’s image.
Poor IPO performance may hamper efforts to bring in strategic investors. The starting auction
price does not appear attractive, equating to a FY18 forward P/E of 9.0x, versus the sector average
of 8.6x. The IPO auction closed with registered bids equal to only 21% of the total offer size. The
average successful bid price was VND13,011/share with 100.8mn shares matched. The remaining
374.3mn shares will be dumped into a strategic package. It is doubtful that this strategic package
will receive interest from the market, as foreign investors will not be allowed to join this round.
Read the full report: HERE
Bloomberg: VNDS
DDAAIILLYY MMAARRKKEETT RREECCAAPP 0077 FFeebbrruuaarryy,, 22001188
IN ALLIANCE WITH
Coverage Universe Update
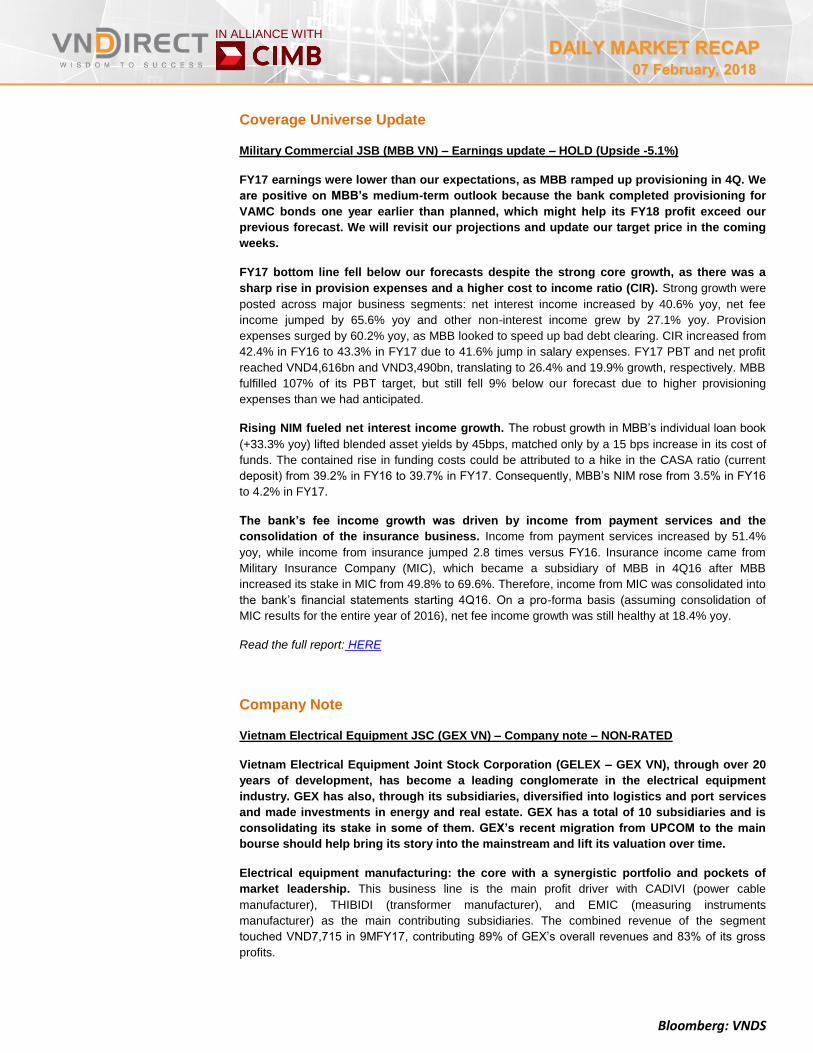
Military Commercial JSB (MBB VN) – Earnings update – HOLD (Upside -5.1%)
FY17 earnings were lower than our expectations, as MBB ramped up provisioning in 4Q. We
are positive on MBB’s medium-term outlook because the bank completed provisioning for
VAMC bonds one year earlier than planned, which might help its FY18 profit exceed our
previous forecast. We will revisit our projections and update our target price in the coming
weeks.
FY17 bottom line fell below our forecasts despite the strong core growth, as there was a
sharp rise in provision expenses and a higher cost to income ratio (CIR). Strong growth were
posted across major business segments: net interest income increased by 40.6% yoy, net fee
income jumped by 65.6% yoy and other non-interest income grew by 27.1% yoy. Provision
expenses surged by 60.2% yoy, as MBB looked to speed up bad debt clearing. CIR increased from
42.4% in FY16 to 43.3% in FY17 due to 41.6% jump in salary expenses. FY17 PBT and net profit
reached VND4,616bn and VND3,490bn, translating to 26.4% and 19.9% growth, respectively. MBB
fulfilled 107% of its PBT target, but still fell 9% below our forecast due to higher provisioning
expenses than we had anticipated.
Rising NIM fueled net interest income growth. The robust growth in MBB’s individual loan book
(+33.3% yoy) lifted blended asset yields by 45bps, matched only by a 15 bps increase in its cost of
funds. The contained rise in funding costs could be attributed to a hike in the CASA ratio (current
deposit) from 39.2% in FY16 to 39.7% in FY17. Consequently, MBB’s NIM rose from 3.5% in FY16
to 4.2% in FY17.
The bank’s fee income growth was driven by income from payment services and the
consolidation of the insurance business. Income from payment services increased by 51.4%
yoy, while income from insurance jumped 2.8 times versus FY16. Insurance income came from
Military Insurance Company (MIC), which became a subsidiary of MBB in 4Q16 after MBB
increased its stake in MIC from 49.8% to 69.6%. Therefore, income from MIC was consolidated into
the bank’s financial statements starting 4Q16. On a pro-forma basis (assuming consolidation of
MIC results for the entire year of 2016), net fee income growth was still healthy at 18.4% yoy.
Read the full report: HERE
Company Note
Vietnam Electrical Equipment JSC (GEX VN) – Company note – NON-RATED
Vietnam Electrical Equipment Joint Stock Corporation (GELEX – GEX VN), through over 20
years of development, has become a leading conglomerate in the electrical equipment
industry. GEX has also, through its subsidiaries, diversified into logistics and port services
and made investments in energy and real estate. GEX has a total of 10 subsidiaries and is
consolidating its stake in some of them. GEX’s recent migration from UPCOM to the main
bourse should help bring its story into the mainstream and lift its valuation over time.
Electrical equipment manufacturing: the core with a synergistic portfolio and pockets of
market leadership. This business line is the main profit driver with CADIVI (power cable
manufacturer), THIBIDI (transformer manufacturer), and EMIC (measuring instruments
manufacturer) as the main contributing subsidiaries. The combined revenue of the segment
touched VND7,715 in 9MFY17, contributing 89% of GEX’s overall revenues and 83% of its gross
profits.

Bloomberg: VNDS
DDAAIILLYY MMAARRKKEETT RREECCAAPP 0077 FFeebbrruuaarryy,, 22001188
IN ALLIANCE WITH
Logistics and port services: rapid expansion in a promising market. GEX has been growing
its presence in the international freight forwarding, import-export forwarding, warehousing services
and port operations segments in Vietnam by gaining control over SOTRANS (STG VN) with a
current shareholding of 54.78% in the subsidiary.
Infrastructure Investment: catching the “power” infrastructure wave. Since December 2016,
GEX has strengthened its presence in the power infrastructure development sector by establishing
a new wholly-owned subsidiary named Gelex Energy One Member Co., Ltd (Gelex Energy with a
total charter capital of VND1,400bn) to invest in the development and operation of power plants
and water treatment and supply.
Real-estate Investment: benefitting from a valuable land bank. Taking advantage of the
existing land bank owned by entities across the group, GEX has undertaken commercial real-estate
development projects at few “golden” sites within the central business district (CBD) of Hanoi.
Although the segment does not make a significant contribution to GEX’s consolidated profit (only
accounts for 3% of the group’s gross profit), the current market value of the real estate on hand is
expected to far surpass the book value of the initial investment due to robust property price
appreciation in the CBD.
Valuation looks attractive: growth still not fully priced in. At the current price of
VND28,350/share, GEX is trading at a TTM P/E of 11.5x, a 23.3% discount to the regional peer
average. We believe that GEX deserves a higher valuation due to its dominant market share in key
segments of the Vietnamese electrical equipment manufacturing industry and synergistic portfolio
of businesses.
GEX switched its listing from the UPCOM to the Ho Chi Minh Stock Exchange (HOSE)
starting from Jan 18, 2018. GEX shares reached ceiling on the first two trading days on the new
bourse, touching VND 32,200/share versus the initial reference price of VND25,100/share, with
over 2 million shares overbought at close on the first trading day. The significantly enhanced
access to equity capital after listing on HOSE might enable GEX to continue to pursue its
aggressive, investment and M&A-driven growth strategy. A listing on the main bourse will also
ensure better disclosure going forward which should help to bring GEX’s story further into the
mainstream.
Read the full report: HERE
Notable Corporate Events
Vietnam Southern Food Corporation – (Vinafood II - unlisted) - IPO: Vinafood II sets Feb 27 as
the deadline of key shareholder registration for 125mn shares (25% of the company’s charter
capital). No details were provided on pricing, the number of selected investors or the selection
process. (Bloomberg)
Vinh Hoan Corporation (VHC VN) - 2018 business plan: For FY2018, VHC targets revenue of
VND9,300bn (+14% YoY) and a net profit of VND650bn (+10% YoY). Specifically, the company set
goals to record revenue worth US$20mn and US$10mn from value-added products and collagen,
and gelatin products, respectively. Besides, VHC estimated that its total export value was
US$350mn (+17% YoY). (Vinhhoan.com)
<to be continued>
Bloomberg: VNDS
DDAAIILLYY MMAARRKKEETT RREECCAAPP 0077 FFeebbrruuaarryy,, 22001188
IN ALLIANCE WITH
COVERAGE SUMMARY Ticker Adjusted
price Adjusted target price
Upside Recom-endation
Investment thesis summary/Update Latest report
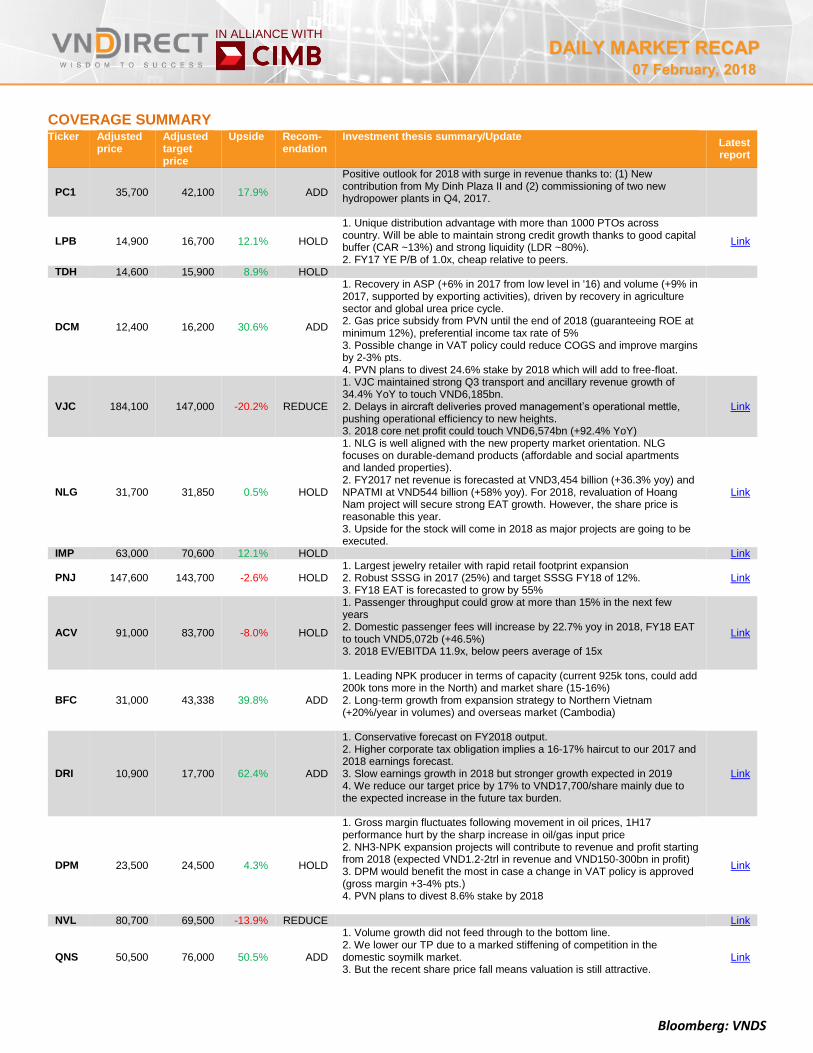
PC1 35,700 42,100 17.9% ADD
Positive outlook for 2018 with surge in revenue thanks to: (1) New contribution from My Dinh Plaza II and (2) commissioning of two new hydropower plants in Q4, 2017.
LPB 14,900 16,700 12.1% HOLD
1. Unique distribution advantage with more than 1000 PTOs across country. Will be able to maintain strong credit growth thanks to good capital buffer (CAR ~13%) and strong liquidity (LDR ~80%). 2. FY17 YE P/B of 1.0x, cheap relative to peers.
Link
TDH 14,600 15,900 8.9% HOLD
DCM 12,400 16,200 30.6% ADD
1. Recovery in ASP (+6% in 2017 from low level in '16) and volume (+9% in 2017, supported by exporting activities), driven by recovery in agriculture sector and global urea price cycle. 2. Gas price subsidy from PVN until the end of 2018 (guaranteeing ROE at minimum 12%), preferential income tax rate of 5% 3. Possible change in VAT policy could reduce COGS and improve margins by 2-3% pts. 4. PVN plans to divest 24.6% stake by 2018 which will add to free-float.
VJC 184,100 147,000 -20.2% REDUCE
1. VJC maintained strong Q3 transport and ancillary revenue growth of 34.4% YoY to touch VND6,185bn. 2. Delays in aircraft deliveries proved management’s operational mettle, pushing operational efficiency to new heights. 3. 2018 core net profit could touch VND6,574bn (+92.4% YoY)
Link
NLG 31,700 31,850 0.5% HOLD
1. NLG is well aligned with the new property market orientation. NLG focuses on durable-demand products (affordable and social apartments and landed properties). 2. FY2017 net revenue is forecasted at VND3,454 billion (+36.3% yoy) and NPATMI at VND544 billion (+58% yoy). For 2018, revaluation of Hoang Nam project will secure strong EAT growth. However, the share price is reasonable this year. 3. Upside for the stock will come in 2018 as major projects are going to be executed.
Link
IMP 63,000 70,600 12.1% HOLD
Link
PNJ 147,600 143,700 -2.6% HOLD 1. Largest jewelry retailer with rapid retail footprint expansion 2. Robust SSSG in 2017 (25%) and target SSSG FY18 of 12%. 3. FY18 EAT is forecasted to grow by 55%
Link
ACV 91,000 83,700 -8.0% HOLD
1. Passenger throughput could grow at more than 15% in the next few years 2. Domestic passenger fees will increase by 22.7% yoy in 2018, FY18 EAT to touch VND5,072b (+46.5%) 3. 2018 EV/EBITDA 11.9x, below peers average of 15x
Link
BFC 31,000 43,338 39.8% ADD
1. Leading NPK producer in terms of capacity (current 925k tons, could add 200k tons more in the North) and market share (15-16%) 2. Long-term growth from expansion strategy to Northern Vietnam (+20%/year in volumes) and overseas market (Cambodia)
DRI 10,900 17,700 62.4% ADD
1. Conservative forecast on FY2018 output. 2. Higher corporate tax obligation implies a 16-17% haircut to our 2017 and 2018 earnings forecast. 3. Slow earnings growth in 2018 but stronger growth expected in 2019 4. We reduce our target price by 17% to VND17,700/share mainly due to the expected increase in the future tax burden.
Link
DPM 23,500 24,500 4.3% HOLD
1. Gross margin fluctuates following movement in oil prices, 1H17 performance hurt by the sharp increase in oil/gas input price 2. NH3-NPK expansion projects will contribute to revenue and profit starting from 2018 (expected VND1.2-2trl in revenue and VND150-300bn in profit) 3. DPM would benefit the most in case a change in VAT policy is approved (gross margin +3-4% pts.) 4. PVN plans to divest 8.6% stake by 2018
Link
NVL 80,700 69,500 -13.9% REDUCE
Link
QNS 50,500 76,000 50.5% ADD
1. Volume growth did not feed through to the bottom line. 2. We lower our TP due to a marked stiffening of competition in the domestic soymilk market. 3. But the recent share price fall means valuation is still attractive.
Link

Bloomberg: VNDS
DDAAIILLYY MMAARRKKEETT RREECCAAPP 0077 FFeebbrruuaarryy,, 22001188
IN ALLIANCE WITH
Ticker Adjusted price
Adjusted target price
Upside Recom-endation
Investment thesis summary/Update Latest report
SBV 32,500 44,100 35.7% ADD 1. The new factory launch will be behind schedule. 2. We revise up our DCF-based target price by 5% to VND44,100
Link
CTG 25,750 20,700 -19.6% REDUCE
ACB 40,700 29,800 -26.8% REDUCE
DPR 39,000 51,900 33.1% ADD
1. ASP will stay at high levels in 4Q 2017 and FY2018. 2. Surge in 2018 disposal earnings given spike in 9M 2017 rubber wood price. 3. Tapping volume rise and disposals to drive FY2018 EAT growth
Link
LTG 39,300 66,270 68.6% ADD
1. All segments apart from CPC grew in 3Q 2. CPC segment’s 22% YoY drop in sales 3Q was an aberration. 3. Booming rice exports to China and Philippines should boost Agrifood sales. 4. For 2017, we raise our net sales forecast by 7.6% but lower our net profit forecast by 8.7% as a result of a 0.8bps decrease in our forecasted gross margin. 5. For 2018, we expect a 7.1% growth in top line to touch VND8,781bn and a 18.4% growth in bottom line to touch VND517bn.
Link
VCB 63,500 43,100 -32.1% REDUCE
MBB 29,200 27,700 -5.1% HOLD
1. Continued push into retail lending paid off with a large expansion in net interest margin (NIM). 2. Sound performance in 9M2017 accelerated bad debt provisioning. 3. High profit growth forecasted for 2018 and 2019 as MBB reaches the end of the current provisioning cycle. 4. Healthy capital and loan-to-deposit position ensure high loan growth in the coming years.
Link
VSC 34,800 62,300 79.0% ADD
1. 9M2017 revenue reached VND959bn (+21.9% YoY) and net profit touched VND190bn (+0.4% YoY). 2. VSC will boost VGP capacity by a third to 800,000 TEU by 2019 through the additional of a new quay crane and a back-end logistics center which is 75% complete at the moment. 3. 2018 net profit expected to soar to VND360bn (+34.8% YoY). 4. Valuation is attractive due to the foreign investors’ sell off over the last few weeks. VSC is currently trading at 12M EV/EBITDA 5.6x, well below the peer average of 6.7x.
Link
VPB 52,400 53,400 1.9% HOLD
1. VPB delivered ROA of 1.9% and ROE of 24.8% in FY16, the highest returns-on-capital among local peers and impressive even in a regional context. 2. FY16 NIM of 7.7% was driven by a shift in loan mix towards higher yielding segments, such as consumer finance, retail, household and micro-SME loans. 3. Strong topline growth in FY14-16, complemented by an improvement in operational efficiency on continued investments into technology. 4. We expect strong earnings growth in FY17-20F with forecasted net profit CAGR of 25.6% and sustained high average ROE of 22.7%.
Link
TCM 24,000 29,300 22.1% ADD
1. FY17 earnings to surge by 87% on core business recovery, declining revenue contribution from low margin yarn segment and land sales. 2. We expect healthy sales growth to be sustained into 2018 on continued strength in garment sales and fabric capacity expansion 3. Reported earnings to fall, however, due to lack of one-time gains. 4. TCM is trading at a FY18F forward PE of 7.7x which is roughly in line with the sector average.
Link
GMD 39,950 37,500 -6.1% HOLD
1. Capacity constraints and tariff pressure due to continued financial pressures in the global shipping industry have led to subdued topline growth so far this year. 2. NDP will be the main growth engine for 2018 and beyond as designed capacity skyrockets from 600,000 TEU pa in 2018 to 1.9mn TEU pa by 2022. 3. GMD is resuming the Gemalink deep water port project. 4. Valuation is more than fair as the stock trades at a TTM EV/EBITDA of 16.1x, a huge premium to the peer average of 6.7x.
Link

Bloomberg: VNDS
DDAAIILLYY MMAARRKKEETT RREECCAAPP 0077 FFeebbrruuaarryy,, 22001188
IN ALLIANCE WITH
MARKET MOVEMENTS
HOSE
Top gainers VND Top gainers VND
Ticker Last
Price
Chg %chg Vol. Index
impact
Ticker Last
Price
Chg %chg Vol. Index
impact
AAA 26,750 1,750 7.0 915,370 0.054 DHT 62,700 5,700 10.0 39,586 0.000
VNE 6,420 420 7.0 319,660 0.014 HLC 7,700 700 10.0 200 0.000
ROS 162,100 10,600 7.0 1.07MLN 1.834 PCN 3,300 300 10.0 100 0.000
VPG 19,900 1,300 7.0 166,790 0.010 PVX 2,200 200 10.0 3.89MLN 0.000
HCM 78,100 5,100 7.0 515,890 0.242 DGL 36,400 3,300 10.0 100 0.000
Top losers VND Top losers VND
Ticker Last
Price
Chg %chg Vol. Index
impact
Ticker Last
Price
Chg %chg Vol. Index
impact
RIC 7,240 -540 -6.9 480 -0.006 VCM 19,000 -2,100 -10.0 1,012 0.000
UIC 29,600 -2,200 -6.9 47,040 -0.006 AME 11,800 -1,300 -9.9 3,200 0.000
VPS 17,500 -1,300 -6.9 500 -0.012 CTT 10,300 -1,100 -9.7 100 0.000
TIE 8,350 -610 -6.8 10 -0.002 ATS 35,600 -3,600 -9.2 15,200 0.000
TNC 13,050 -950 -6.8 20 -0.007 AMC 20,000 -2,000 -9.1 1,900 0.000
Top index movers VND Top index movers VND
Ticker Last
Price
Chg %chg Vol. Index
impact
Ticker Last
Price
Chg %chg Vol. Index
impact
GAS 110,000 5,200 5.0 708,130 3.640 ACB 40,700 1,800 4.6 2.75MLN 1.508
BID 31,200 2,000 6.9 2.06MLN 2.501 SHB 12,500 900 7.8 23.88MLN 1.001
VRE 51,000 3,250 6.8 3.21MLN 2.260 VCS 199,800 8,800 4.6 55,806 0.191
VJC 184,100 12,000 7.0 1.15MLN 1.981 PVS 22,300 500 2.3 7.92MLN 0.121
VCB 63,500 1,500 2.4 1.64MLN 1.974 NTP 63,000 3,000 5.0 66,821 0.102
Top index laggers VND Top index laggers VND
Ticker Last
Price
Chg %chg Vol. Index
impact
Ticker Last
Price
Chg %chg Vol. Index
impact
MSN 83,000 -3,000 -3.5 566,450 -1.270 NVB 8,300 -200 -2.4 260,630 -0.062
NVL 80,700 -1,100 -1.3 2.92MLN -0.259 DL1 42,000 -1,000 -2.3 1,000 -0.055
SBT 17,100 -900 -5.0 5.23MLN -0.183 PGS 34,200 -600 -1.7 85,197 -0.021
PVD 22,000 -950 -4.1 5.89MLN -0.133 SHN 10,100 -100 -1.0 1.36MLN -0.012
VIC 81,000 -100 -0.1 1.57MLN -0.096 NHA 10,300 -700 -6.4 7,000 -0.007
Top active volume VND Top active volume VND
Ticker Last
Price
Chg %chg Vol. Index
impact
Ticker Last
Price
Chg %chg Vol. Index
impact
STB 15,750 350 2.3 14.29MLN 0.241 SHB 12,500 900 7.8 23.88MLN 0.000
AMD 6,250 400 6.8 9.11MLN 0.024 PVS 22,300 500 2.3 7.92MLN 0.000
FLC 5,630 360 6.8 8.42MLN 0.084 PVX 2,200 200 10.0 3.89MLN 0.000
HQC 2,330 70 3.1 7.77MLN 0.012 ACB 40,700 1,800 4.6 2.75MLN 0.000
SCR 11,400 200 1.8 6.96MLN 0.018 SHS 21,000 1,100 5.5 2.10MLN 0.000
7-Feb
HNX
Source: Bloomberg

Bloomberg: VNDS
DDAAIILLYY MMAARRKKEETT RREECCAAPP 0077 FFeebbrruuaarryy,, 22001188
IN ALLIANCE WITH
FOREIGN ACTIVITIES
Volume (Mn'shs) HOSE d/d HNX d/d Value (VND'bn) HOSE d/d HNX d/d
BUY 13.8 -89.5% 1.7 -82.2% BUY 692.9 -89.1% 32.4 -76.0%
% of market 5.9% 2.9% % of market 10.7% 3.8%
SELL 17.8 -54.4% 1.5 -47.2% SELL 917.4 -59.1% 29.0 -24.9%
% of market 7.5% 2.5% % of market 14.1% 3.4%
NET BUY (SELL) (3.97) 0.2 NET BUY (SELL) (224.5) 3.4
Source: HSX, HNX
(1,000)
(500)
0
500
1,000
1,500
2,000
2,500
3,000
3,500
4,000
4,500
Foreign net buy/sell (30 days) in VND'bn
HOSE HNX
2018 ACCUMULATION
Volume (Mln'shs) HOSE % of 2017 HNX % of 2017 Value (VND'bn) HOSE % of 2017 HNX % of 2017
BUY 739.8 20.9% 57.2 14.3% BUY 36,729.9 21.7% 1,135.7 13.6%
% of market 9.9% 2.6% % of market 17.8% 0.7%
SELL 463.9 14.2% 62.0 15.2% SELL 25,255.6 17.5% 1,447.1 16.8%
% of market 6.2% 2.8% % of market 12.2% 0.9%
NET BUY (SELL) 275.9 (4.9) NET BUY (SELL) 11,474 (311.4)
Source: HSX, HNX

Bloomberg: VNDS
DDAAIILLYY MMAARRKKEETT RREECCAAPP 0077 FFeebbrruuaarryy,, 22001188
IN ALLIANCE WITH
FOREIGN ACTIVITIES
Top buy by foreigners (value) VND'bn Top buy by foreigners (value) VND'bn
Ticker Last
Price
Chg %chg Value Index
impact
Ticker Last
Price
Chg %chg Value Index
impact
HDB 43,850 2,850 6.95 87.2 1.023 VGC 25,000 300 -1.19 12.4 0.000
HPG 57,000 1,500 -6.71 83.1 0.832 PVS 26,800 500 5.93 9.8 0.000
VRE 51,300 3,250 -6.90 60.9 -2.643 SHB 12,600 900 1.61 5.6 0.000
VNM 203,100 2,400 -1.88 56.4 -2.071 BVS 20,600 -300 -1.44 1.0 0.000
PLX 79,900 3,900 5.13 53.2 1.846 HUT 9,200 300 3.37 0.9 0.000
Top sell by foreigners (value) VND'bn Top sell by foreigners (value) VND'bn
Ticker Last
Price
Chg %chg Value Index
impact
Ticker Last
Price
Chg %chg Value Index
impact
HPG 57,000 1,500 -6.71 197.5 0.832 VGC 25,000 300 -1.19 10.3 0.000
VNM 203,100 2,400 -1.88 117.3 -2.071 SHB 12,600 900 1.61 4.5 0.000
VRE 51,300 3,250 -6.90 71.7 -2.643 PVS 26,800 500 5.93 4.3 0.000
VHC 49,800 0 0.00 64.2 0.000 PGS 34,800 -600 -1.97 2.4 0.000
VJC 172,100 12,000 -4.88 59.5 -1.569 TNG 13,100 600 4.80 1.3 0.000
Top net buy by foreigners (value) VND'bn Top net buy by foreigners (value) VND'bn
Ticker Last
Price
Chg %chg Value Index
impact
Ticker Last
Price
Chg %chg Value Index
impact
HDB 43,850 2,850 6.95 58.5 1.023 PVS 26,800 500 5.93 5.5 0.000
PLX 79,900 3,900 5.13 35.2 1.846 VGC 25,000 300 -1.19 2.1 0.000
GAS 104,800 5,200 -6.93 27.7 -5.461 SHB 12,600 900 1.61 1.1 0.000
VND 26,400 1,800 6.82 19.9 0.102 HUT 9,200 300 3.37 0.9 0.000
VIC 81,100 -100 -7.00 16.7 0.000 NDN 10,300 200 1.98 0.3 0.000
Top net sell by foreigners (value) VND'bn Top net sell by foreigners (value) VND'bn
Ticker Last
Price
Chg %chg Value Index
impact
Ticker Last
Price
Chg %chg Value Index
impact
HPG 57,000 1,500 -6.71 -114.4 0.832 PGS 34,800 -600 -1.97 -2.13 0.000
VHC 49,800 0 0.00 -61.6 0.000 TNG 13,100 600 4.80 -1.28 0.000
VNM 203,100 2,400 -1.88 -60.9 -2.071 CSC 26,300 -300 -1.13 -0.86 0.000
VJC 172,100 12,000 -4.88 -53.0 -1.569 ACB 38,900 1,800 4.63 -0.41 0.000
NT2 33,000 0 0.00 -51.5 0.000 PLC 21,500 -300 -1.38 -0.36 0.000
Source: Bloomberg, HOSE, HNX
HOSE HNX
7-Feb-18

Bloomberg: VNDS
DDAAIILLYY MMAARRKKEETT RREECCAAPP 0077 FFeebbrruuaarryy,, 22001188
IN ALLIANCE WITH
TOP 60 MARKET CAP STOCKS SNAPSHOT ON HOSE
No. Ticker Price Mkt. Cap Outs. Vol. Float ratio Avail. FII Ave. daily vol. P/E P/B ROE ROA
VND 1M 3M 6M US$mln Mln'shs % % (30 days-shs) x x % %
1 VNM VM 200,300 -6.2 26.9 30.3 12,806 1,451 61.2 40.2 729,715 31.5 12.4 40.5 32.2
2 VCB VM 63,500 17.6 49.6 66.9 10,064 3,598 22.9 9.1 2,595,313 25.1 4.2 13.7 1.0
3 VIC VM 81,000 1.3 30.6 82.0 9,412 2,638 49.3 18.7 3,266,948 34.1 6.4 15.8 2.3
4 GAS VM 110,000 9.6 47.3 71.6 9,275 1,914 4.2 45.6 989,313 22.4 5.1 23.8 16.2
5 SAB VM 232,800 -11.9 -18.3 -6.5 6,577 641 10.4 39.3 143,398 31.7 10.9 38.6 23.5
6 BID VM 31,200 13.9 36.5 38.7 4,699 3,419 4.4 27.2 2,794,186 15.5 2.4 13.0 0.6
7 VRE VM 51,000 8.5 25.8 N/A 4,271 1,901 100.0 16.3 2,862,816 48.1 4.1 17.6 6.9
8 CTG VM 25,750 2.6 32.1 29.1 4,224 3,723 15.8 0.0 5,789,420 12.9 1.5 12.0 0.7
9 PLX VM 79,900 1.1 42.7 19.6 4,079 1,159 6.3 10.3 1,462,471 26.5 4.5 17.2 5.7
10 HPG VM 59,500 24.0 61.2 84.5 3,976 1,517 58.9 7.8 5,740,444 10.7 3.0 31.5 19.7
11 MSN VM 83,000 -2.0 38.6 94.4 3,830 1,047 36.3 20.2 684,428 29.7 5.9 20.6 4.5
12 VJC VM 184,100 23.6 62.2 106.4 3,660 451 60.9 3.3 1,154,447 29.5 17.1 68.7 14.3
13 VPB VM 52,400 18.0 32.7 N/A 3,457 1,497 89.9 0.0 3,669,376 11.5 2.6 25.4 1.9
14 ROS VM 162,100 -2.2 -19.2 72.4 3,378 473 27.0 47.2 1,443,084 90.5 15.2 9.2 5.4
15 MBB VM 29,200 11.7 25.6 29.4 2,335 1,816 49.7 0.0 7,677,497 20.8 1.9 9.4 0.9
16 NVL VM 80,700 18.3 31.9 21.0 2,285 643 31.7 43.6 1,546,784 24.3 4.1 18.7 4.7
17 BVH VM 71,300 7.7 39.0 23.6 2,137 680 29.1 23.9 714,034 31.7 3.5 10.7 1.9
18 HDB VM 43,850 10.7 N/A N/A 1,895 981 100.0 3.9 N/A 48.1 3.8 7.9 0.6
19 MWG VM 120,500 -9.7 -4.6 10.3 1,714 323 76.4 0.0 684,991 16.8 6.5 45.3 11.7
20 BHN VM 137,000 -1.8 23.3 73.2 1,399 232 0.9 31.4 25,871 42.4 5.4 13.0 7.8
21 FPT VM 56,600 -5.7 10.5 13.5 1,324 531 71.8 0.0 2,740,127 11.0 2.6 27.9 10.7
22 STB VM 15,750 15.8 40.6 25.5 1,251 1,804 94.6 13.5 24,946,890 24.2 1.2 3.0 0.2
23 EIB VM 15,150 17.4 32.9 17.4 821 1,229 75.6 0.0 1,315,423 22.6 1.3 5.9 0.6
24 SSI VM 33,000 14.2 43.5 25.2 727 500 57.5 47.0 7,597,351 13.9 1.9 14.9 7.3
25 PNJ VM 147,600 10.1 37.0 37.3 703 108 64.5 0.0 373,983 20.9 5.8 28.9 16.4
26 CTD VM 180,400 -20.7 -23.5 -14.5 619 78 89.2 3.6 239,142 8.8 1.9 23.2 11.9
27 DHG VM 93,100 -14.7 -3.1 -17.0 536 131 31.8 1.8 343,576 21.3 4.4 20.4 16.0
28 REE VM 38,300 -9.9 16.1 1.3 523 310 68.2 0.0 1,751,482 8.6 1.5 18.1 10.7
29 GMD VM 39,950 -6.2 1.1 -4.5 507 288 59.6 0.0 1,131,631 20.5 1.8 8.1 4.7
30 KDH VM 31,700 8.7 21.9 26.8 469 336 55.1 0.4 390,474 17.9 2.0 11.7 5.8
31 HCM VM 78,100 26.8 86.8 78.3 446 130 38.0 39.8 430,639 18.2 3.9 17.8 10.6
32 VCI VM 80,000 -3.8 23.3 31.1 423 120 95.7 9.3 77,231 14.5 6.9 31.9 12.1
33 SBT VM 17,100 -20.5 -16.8 -53.0 420 557 60.8 39.9 7,183,243 12.2 1.4 6.4 2.7
34 NT2 VM 33,000 -3.2 9.3 15.6 418 288 27.9 25.9 300,465 11.9 1.9 16.1 7.1
35 DPM VM 23,500 7.8 16.6 0.0 405 391 35.2 26.9 1,501,225 15.3 1.2 8.7 7.0
36 KDC VM 42,600 -3.8 14.5 -2.7 386 206 44.5 36.2 684,277 15.6 1.4 9.2 6.0
37 HSG VM 24,250 -3.8 4.1 -12.0 374 350 56.6 21.6 4,591,435 6.9 1.7 28.8 7.9
38 CII VM 34,450 -8.4 9.4 2.8 374 246 69.6 10.5 1,464,951 5.7 1.7 35.8 9.8
39 DXG VM 28,000 28.7 57.7 49.6 374 303 71.8 10.7 5,093,699 11.2 2.2 21.3 9.5
40 PVD VM 22,000 -11.8 30.2 38.4 371 383 48.1 26.2 3,748,740 477.4 0.6 0.2 0.1
41 GEX VM 29,300 N/A N/A N/A 344 267 71.6 35.0 N/A 11.9 2.0 18.0 6.7
42 PDR VM 35,000 -6.2 7.9 20.7 342 222 38.3 47.4 1,456,335 19.2 3.0 16.3 4.3
43 TCH VM 20,000 -7.0 25.4 19.0 311 353 51.2 46.9 2,197,759 15.0 1.6 10.7 10.3
44 BMP VM 82,800 -0.2 7.1 7.5 299 82 61.8 56.0 539,827 14.4 2.8 18.3 15.5
45 HAG VM 7,110 -7.7 -2.6 -22.3 290 927 61.3 36.5 8,638,749 8.2 0.5 5.1 1.4
46 DCM VM 12,400 -13.3 2.1 -14.5 289 529 24.4 45.8 2,298,675 11.5 1.1 9.6 5.0
47 PPC VM 19,200 -14.1 -11.9 -13.5 271 321 24.6 31.9 235,598 3.7 1.1 32.1 18.1
48 PAN VM 51,000 13.3 47.0 41.7 270 120 60.6 56.1 144,257 15.0 2.2 14.7 7.6
49 KBC VM 13,000 -10.3 0.0 -13.3 269 470 75.2 23.4 4,133,568 10.4 0.7 7.3 3.8
50 HT1 VM 14,700 -11.4 6.5 -19.2 247 382 20.0 41.9 536,670 11.9 1.1 10.0 4.3
51 HNG VM 7,200 -24.6 -15.3 -27.6 243 767 36.2 47.4 2,353,966 5.1 0.5 10.3 3.2
52 PME VM 83,000 -4.0 N/A N/A 238 65 99.0 0.0 19,897 18.9 3.1 19.7 16.0
53 DIG VM 22,300 -2.2 48.7 34.7 234 238 90.3 4.6 3,348,142 58.2 1.8 3.2 1.6
54 VCF VM 195,000 -36.1 -4.9 -8.5 228 27 N/A 48.5 6,100 13.9 2.2 18.3 12.9
55 PVT VM 18,200 -2.2 22.1 25.5 226 281 48.9 16.9 1,055,081 12.1 1.4 11.7 4.6
56 TLG VM 100,900 -1.6 2.1 -3.0 225 51 26.7 72.0 4,491 21.1 4.7 23.6 18.0
57 HBC VM 38,500 -14.8 -28.7 -30.1 220 130 56.2 26.9 1,957,132 5.8 2.2 44.5 6.8
58 NLG VM 31,700 2.9 12.4 -2.6 220 157 49.9 0.0 571,419 9.6 1.8 20.3 8.0
59 TRA VM 117,000 0.9 -6.4 -2.1 214 41 68.3 0.0 3,567 20.1 4.7 24.6 16.6
60 BIC VM 41,000 12.3 28.1 15.8 212 117 99.7 1.3 11,252 34.9 2.4 6.4 2.7
Price change (%)
Source: Bloomberg 7-Feb

DDAAIILLYY MMAARRKKEETT RREECCAAPP IN ALLIANCE WITH
This report has been prepared by VNDIRECT or one of its affiliates for distribution in Vietnam and overseas. The information herein is believed by VNDIRECT to be reliable and is based on public sources believed to be reliable. With exception of information about VNDIRECT, VNDIRECT makes no representation about the accuracy of such information.
Options, estimates and projection expressed in this report represent the current views of the author at the date of publication only. They do not necessarily reflect the opinions of VNDIRECT and are subject to change without notice. VNDIRECT has no obligation to update, amend or in any way modify this report or otherwise notify a reader thereof in the event that any of the subject matter or opinion, projection or estimate contained within it changes or becomes inaccurate.
The information herein was obtained from various sources and we do not guarantee its accuracy or completeness. Prices and availability of financial instruments are also subject to change without notice.
This published research may be considered by VNDIRECT when buying or selling proprietary positions or positions held by funds under its management. VNDIRECT may trade for its own account as a result of short-term trading suggestions from analysts and may also engage in securities transactions in a manner inconsistent with this report and opinions expressed therein.
Neither the information nor any opinion expressed in this report constitutes an offer, nor an invitation to make an offer, to buy or sell any securities or any option, futures or other derivative instruments in any jurisdiction. Nor should it be construed as an advertisement for any financial instruments.
Officers of VNDIRECT may have a financial interest in securities mentioned in this report or in related instruments. This research report is prepared for general circulation for general information only. It does no have regard to the specific investment objectives, financial situation or particular needs of any person who may receive or read this report.
Investors should note that the prices of securities fluctuate and may rise and fall. Past performance, if any, is no guide to the future. The financial instruments discussed in this report may not be suitable for all investors. Investors must make their own financial decisions based on their independent financial advisors as they believe necessary and based on their particular financial situation and investment objectives.
This report may not be copied, reproduced, published or redistributed by any person for any purpose without the express permission of VNDIRECT in writing. Please cite sources when quoting.
ADDRESS
Headquarter
1 Nguyen Thuong Hien Str
Hai Ba Trung Dist, Hanoi
T: +84 24 3972 4568
F: +84 24 3972 4600
HCMC Office
The 90th Pasteur Building
90 Pasteur Str, Dist 1, HCMC
T: +84 28 7300 0688
F: +84 28 3914 6924
Da Nang Office
Room 7-8-9, 3rd floor, Buu Dien Building
155 Nguyen Van Linh Str, Da Nang City
T: +84 511 382 1111
Vinh - Nghe An Office
1 Lenin Str
Vinh City, Nghe An Province
T: +84 388 688 466
F:+84 388 688 466
Can Tho Office
3rd floor STS Building, 11B Hoa Binh
Ninh Kieu, Can Tho
T: +84 710 3766 959
F: +84 710 3826 331
Quang Ninh Office
1st & 2nd floor, 29-31, 25/4 Str
Ha Long City, Quang Ninh Province
T: +84 33 3820 818
F: +84 33 3820 333
CONTACTS
Anirban Lahiri (Mr.)
Head of Research
Research Department
T: +84 28 7300 0688 (Ext: 21242)
Hang Tran (Ms.)
Director
Institutional Clients Group
T: +84 28 7300 0688 (Ext: 21168)
Trung Nguyen (Mr.)
Associate Director - Business Development
Institutional Clients Group
T: +84 28 7300 0688 (Ext: 21068)
Giang Nguyen (Ms.)
Associate Director – Trading
Institutional Clients Group
T: +84 28 7300 0688 (Ext: 21099)
DISCLAIMER