Embed Size (px)
Citation preview

Small and Midcap Research
www.vndirect.com.vn 1
IN ALLIANCE WITH
QUANG NGAI SUGAR JSC (QNS) – UPDATE
Market Price Target Price Dividend Yield Rating Sector
VND41,700 VND50,000 3.0% ADD CONSUMER GOODS
Outlook – Short term Outlook – Long term Valuation
Negative Neutral Positive Negative Neutral Positive Negative Neutral Positive
QNS released its 3Q18 financial report with results tracking slightly above
our previous projection. We lift our forecast for both topline and earnings
and also raise our target price to reflect the brighter outlook of the sugar
and, to a lesser extent, the soymilk segment in 2019. Upgrade to ADD.
Positive growth recorded in both sugar and soymilk sales. In 3Q18, sugar
sales rose 23.6% yoy thanks to a 57.8% surge in sales volume on the back of increased capacity while soymilk sales grew by 6.5% yoy, fuelled by new product launches. Net profit grew faster than total revenue (19.1% versus 7.9%) due to blended GPM expansion on lower input prices for the soymilk segment.
Soymilk sales growth swung into positive territory on release of the new FAMI GO product and an effective marketing campaign. We believe that
higher spending on marketing (+15.4% yoy) in 3Q18 helped QNS to grow its soymilk sales, defying a sharp slowdown in the FMCG sector in Vietnam (Vinamilk reported only 3% sales growth in the quarter). While we do not have volume figures, we believe sales were helped by higher prices of new product Fami Go (+71.4% compared with the original Fami product).
Positive 3Q18 results led to better-than-expected 9M18 figures. Total 9M18
revenue and net profit grew 3.5% and 16.0% yoy, respectively, with blended GPM increasing 340bp and net margin expanding by 139bp. Better-than- forecasted sales in the latest quarter facilitated a soymilk sales growth recovery to -0.7% in 9M18 from -4.8% in 1H18.
We lift our FY18 total revenue/net profit projection by 4.7%/1.2% respectively as we expect multiple tailwinds for QNS in 4Q18, including (1)
increase of domestic sugar prices, on the back of a strong rebound in global sugar prices, (2) a continued slide in soybean prices because of the US-China trade war (3) the ongoing marketing campaign which we believe will continue to support soymilk sales. However, we expect net margin to contract in 4Q18 because of high advertising spend. We also raise our 2019 outlook mainly due to better prospects for the sugar segment on the back of a recovery in global sugar prices driven by major exporter Brazil’s pledge to cut output.
We raise our target price to VND50,000 and upgrade to ADD. We use a
sum-of-parts valuation method, with each part being valued using a target P/E multiple applied to our 2019 forward EPS. Our target P/E multiple for the soymilk, sugar and others segments are 10.1x, 6.9x and 14.5x respectively, in-line with the peer average for each. The new target price is 12.1% higher than our previous target price and equivalent to an upside of 17.1%. Our TP translates into an implied 2018 P/E of 11.1x and a 2019 P/E of 10.2x.
20 November 2018
Nguyen Tien Duc
Key changes in the report
Raise FY18 NPAT forecast by 1.2%
Increase target price by 12.1%
Price performance
Source: VNDIRECT
Key statistics
52w high (VND) 54,213
52w low (VND) 35,500
3m Avg daily volume (shares) 617,648
3m Avg daily value (VND m) 13,849
Market cap (VNDbn) 12,039
Outstanding shares (m) 294
Free float (%) 80
TTM P/E (x) 11.1
Current TTM P/B (x) 2.5
Ownership
Thanh Phat Trading Ltd. 15.8%
Foremost Worldwide Limited 5.2%
Võ Thanh Đàng 5.0%
Others 74.0%
Source: VNDIRECT
Source: VNDIRECT
Financial summary (VND) 12-16A 12-17A 12-18E 12-19E
Net revenue (bn) 6,972 7,633 8,195 8,855
Revenue growth (10.4%) 9.5% 7.4% 8.1%
Gross margin 32.6% 26.2% 28.6% 28.7%
EBITDA margin 27.8% 21.3% 23.3% 22.3%
Net profit (bn) 1,410 1,027 1,144 1,239
Net profit growth 14.6% (27.2%) 11.4% 8.4%
FD EPS 5,942 4,320 4,818 5,169
FD Adjusted EPS 5,689 4,062 4,503 4,854
BVPS 25,120 21,836 22,774 25,349
ROAE 43.3% 24.5% 22.3% 20.3%
40.0
54.0
68.0
82.0
96.0
110.0
33,000
38,000
43,000
48,000
53,000
58,000
Price Close Relative To VNIndex (RHS)
1
1
2
11-17 01-18 03-18 05-18 07-18 09-18
Vol m

Small and Midcap Research
www.vndirect.com.vn 2
IN ALLIANCE WITH
BETTER 3Q18 LEADING TO BETTER-THAN-EXPECTED 9M18
BASED ON A STRONG UPTICK IN SUGAR AND SOYMILK SALES.
Figure 1: Comparison of Financial Results
Source: VNDIRECT
Sugar sales in 3Q18 rose sharply as volume soared, outpacing price reduction, but still slightly below our expectations. QNS sugar segment sales increased by 23.6% yoy, despite the fact that Refined Sugar (RS) spot price at the end of Sep 18 was down by 21.9% yoy and down 7.7% versus end of Jun 18, due to a global downtrend. ASP of sugar segment decreased 23.8% yoy. We estimate the company sold 55,000 tons of Refined Sugar (RS) in 3Q18, up 58% yoy thanks to the upgraded An Khe plant which increased RS annual production capacity by 51% to 205,000 tons. We estimate QNS had 48,700 tons RS sugar in inventory by the end of 3Q18. Actual sales volume of 3Q18 is a bit below our forecast of 62,000 tons. This may create extra pressure to boost 4Q18 sales to clear inventory.
Figure 2: QNS quarterly sales value increased despite continued fall in sugar prices
Figure 3: QNS sugar production and sales volume in 2018 have increased sharply
Source: QNS, Agromonitor Note: 9M sales volume data prior to 2017 is not available
Source: VNDIRECT
FYE (VNDbn) 3Q18 yoy 9M18 yoy
vs. old
forecast
vs. revised
forecast Comments
chg chg
Net revenue 2,170 7.9% 6,143 3.5% 78.5% 75.0%
Sugar 582 23.6% 1,755 12.4% 80.9% 74.4% Sales volume increase outpaced ASP reduction
Soymilk 1,142 6.5% 2,896 -0.7% 77.2% 73.7% Additonal sales from new product launch in September.
Others 446 -4.6% 1,492 2.4% 78.0% 78.2%
Biomass plant temporarily stopped operations.
Confectionary and beverage sales decreased as FMCG
sector slowdown.
Gross profit 618 29.0% 1,681 18.4% 79.9% 71.8%
Gross profit margin 28.5% +47 pts 27.4% +34 ptsGross margin improved with lower sugar & soybean
prices.
Selling expenses (289) 35.8% (638) 17.4% 89.2% 75.2%Increased advertising to support sales and promote new
products amid FMCG sector slowdown.
G&A expenses (63) 66.6% (158) 48.3% 105.7% 72.6%Higher labour expenses as Binh Duong soymilk factory
started operations
Operating profit 302 39.3% 885 20.8% 71.4% 69.4%
Pre-tax profit 265 21.4% 895 18.1% 71.9% 69.3%
Net profit 231 19.1% 793 16.0% 70.2% 69.3%
Title:
Source:
Please fill in the values above to have them entered in your report
-
2
4
6
8
10
12
14
16
18
-60.0%
-40.0%
-20.0%
0.0%
20.0%
40.0%
60.0%
80.0%
1Q17 2Q17 3Q17 4Q17 1Q18 2Q18 3Q18
VN
D '
00
0/k
g
QNS sugar sales growth by value (LHS)
Sugar price at factory (RHS)
Title:
Source:
Please fill in the values above to have them entered in your report123 124
157
134 140
205
105
156
80
100
120
140
160
180
200
220
2013 2014 2015 2016 2017 2018E
Tho
usa
nd
ton
s
Annual sugar production by volume
9M sales by volume

Small and Midcap Research
www.vndirect.com.vn 3
IN ALLIANCE WITH
Sugar segment margins were higher than last year, but have contracted sharply (qoq) due to continued sugar price declines. This development is aligned with our forecast. Sugar prices fell sharply since the middle of the 2016-17 crop season leading to a negative profit margin in 2H17. QNS subsequently reduced its sugar cane purchasing price in order to adapt to the lower output price level. This led to a sharp gross margin recovery in 1Q18. However, as output prices kept falling, the sugar gross margin slid to 8.5% in 3Q18, the lowest level, year-to-date.
Figure 4: Sugar GPM in 3Q18 lower than in previous quarter due to lower sugar price.
Note: Sugar segment GPM data for period prior to 4Q16 is not available
Source: Vndirect
Soymilk sales grew yoy after two consecutive negative quarters thanks to the launch of the new FAMI GO product. The launch of a new product in mid-September 2018 boosted soymilk sales revenue by 6.5% yoy in 3Q18, despite a broad FMCG sales slowdown in Vietnam since 4Q17. The soymilk sales figure was better than we had forecasted as sales from this new product was not factored in our previous projections because the company kept delaying its product launch after announcing the planned launch in late-2017.
Figure 5: Soymilk sales increases again after two negative quarters
Figure 6: Since 4Q17, milk-based product sales in Vietnam have dipped faster than the broad slowdown in FMCG sales
Source:QNS Source: Euromonitor
Fami GO offers a quick, drinkable breakfast substitute with ample nutrients in one compact 200ml box. The new product contains 50% more protein as compared with normal soymilk and is cholesterol-free. Now people can drink breakfast instead of eating breakfast. The
Title:
Source:
Please fill in the values above to have them entered in your report6.7%
10.8%
14.9%13.7%
4.1%
-5.5% -5.0%
15.7%
11.2%8.5%
(10)
(5)
-
5
10
15
20
-15%
-10%
-5%
0%
5%
10%
15%
20%
25%
30%
1Q16 2Q16 3Q16 4Q16 1Q17 2Q17 3Q17 4Q17 1Q18 2Q18 3Q18
Thousand V
ND
/Kg
Sugar price at factory (RHS) Sugar gross margin Quarterly (LHS)
Title:
Source:
Please fill in the values above to have them entered in your report
-15.0%
-10.0%
-5.0%
0.0%
5.0%
10.0%
15.0%
(1,400)
(1,000)
(600)
(200)
200
600
1,000
1,400
1Q17 2Q17 3Q17 4Q17 1Q18 2Q18 3Q18
VN
Db
n
Soymilk sale value by quarter (LHS) yoy growth rate (RHS)

Small and Midcap Research
www.vndirect.com.vn 4
IN ALLIANCE WITH
product targets young customers with not enough time for a proper meal in the morning. It now competes with Milo from Nestle and Ovaltine from Friesland Campina. TVcommercial link
Figure 7a: FAMI GO is priced at a premium to QNS' soymilk product portfolio
Figure 7b: FAMI GO’s promotion image
Source: VnDirect Source: www.vinasoy.com.vn
Soymilk gross margin in 3Q18 improved by 512 bp yoy due to lower input price. We estimate that lower sugar prices contributed around 270bp yoy of GPM expansion while lower soybean prices contributed another 200bp yoy and the remaining 32bp was contributed by other factors. At end-Sep 18, global soybean prices had decreased 4% yoy and 8% from Jun 18. The soybean price downtrend is caused by oversupply outside China because US soybean manufacturers have found it hard to supply into China (the world’s biggest consumer of soybean) after US import tariffs on soybeans were raised 25% following trade war tensions. Consequently, soybean prices have slid down to USD383 per ton and the price is expected to continue to fall further.
Figure 8: Soymilk gross profit increased significantly with better sales and improved gross margin
Figure 9: Sugar & Soybean prices decreased in 3Q18
Source: QNS Source: Worldbank, Agromornitor
Other segment decreased with FMCG slowdown and no contribution from bioenergy. QNS’ biomass plant was shut down since the 2017-18 sugar cane crop season ended in 2Q18 and was not operational in 3Q18, thus not generating sales in the period. Confectionary and beverage sales fell slightly in line with the broad weakness in FMCG sales alluded to earlier. The result is in line with our previous forecast.
Title:
Source:
Please fill in the values above to have them entered in your report
-40%
-30%
-20%
-10%
0%
10%
20%
30%
40%
50%
60%
2Q17 3Q17 4Q17 1Q18 2Q18 3Q18
Soymilk gross profit growth yoy
Soymilk gross margin
Soymilk sales growth yoy
Title:
Source:
Please fill in the values above to have them entered in your report
8,000
9,000
10,000
11,000
12,000
13,000
14,000
15,000
16,000
300
320
340
360
380
400
420
440
460
Apr-
17
May-
17
Jun-1
7
Jul-17
Aug-1
7
Sep-1
7
Oct-17
Nov-
17
Dec-
17
Jan-1
8
Feb
-18
Mar-
18
Apr-
18
May-
18
Jun-1
8
Jul-18
Aug-1
8
Sep-1
8
VN
D/K
g
US$
/Mt
Soybean global price monthly (LHS)
RS Sugar price (At factory - domestics) (RHS)
Small and Midcap Research
www.vndirect.com.vn 5
IN ALLIANCE WITH
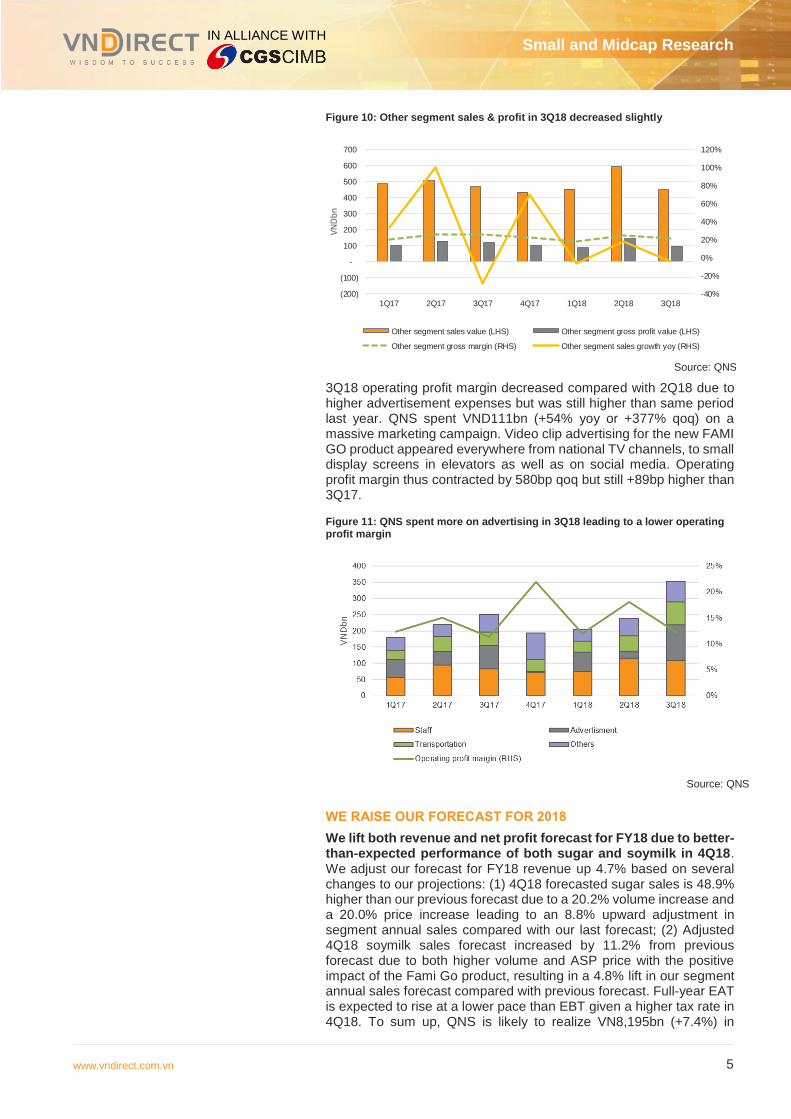
Figure 10: Other segment sales & profit in 3Q18 decreased slightly
Source: QNS
3Q18 operating profit margin decreased compared with 2Q18 due to higher advertisement expenses but was still higher than same period last year. QNS spent VND111bn (+54% yoy or +377% qoq) on a massive marketing campaign. Video clip advertising for the new FAMI GO product appeared everywhere from national TV channels, to small display screens in elevators as well as on social media. Operating profit margin thus contracted by 580bp qoq but still +89bp higher than 3Q17.
Figure 11: QNS spent more on advertising in 3Q18 leading to a lower operating profit margin
Source: QNS
WE RAISE OUR FORECAST FOR 2018
We lift both revenue and net profit forecast for FY18 due to better-than-expected performance of both sugar and soymilk in 4Q18. We adjust our forecast for FY18 revenue up 4.7% based on several changes to our projections: (1) 4Q18 forecasted sugar sales is 48.9% higher than our previous forecast due to a 20.2% volume increase and a 20.0% price increase leading to an 8.8% upward adjustment in segment annual sales compared with our last forecast; (2) Adjusted 4Q18 soymilk sales forecast increased by 11.2% from previous forecast due to both higher volume and ASP price with the positive impact of the Fami Go product, resulting in a 4.8% lift in our segment annual sales forecast compared with previous forecast. Full-year EAT is expected to rise at a lower pace than EBT given a higher tax rate in 4Q18. To sum up, QNS is likely to realize VN8,195bn (+7.4%) in
Title:
Source:
Please fill in the values above to have them entered in your report
-40%
-20%
0%
20%
40%
60%
80%
100%
120%
(200)
(100)
-
100
200
300
400
500
600
700
1Q17 2Q17 3Q17 4Q17 1Q18 2Q18 3Q18
VN
Db
nOther segment sales value (LHS) Other segment gross profit value (LHS)
Other segment gross margin (RHS) Other segment sales growth yoy (RHS)

Small and Midcap Research
www.vndirect.com.vn 6
IN ALLIANCE WITH
revenue and VND1,144bn in net profit (+1.2%) in FY18. Our new 2018 EPS forecast is VND4,503.
Figure 12: Earnings revision - - A lift in 4Q18 forecasts leads to a higher 2018 forecast
Source: VNDIRECT
2019 OUTLOOK POSITIVE, SUPPORTED BY BOTH SOYMILK
AND SUGAR SEGMENT IMPROVEMENT
RS sugar production may increase slightly in 2019 - Refined extra sugar (RE) plant is yet to contribute. Existing QNS sugar factories have been running at full capacity in 2018. However, we believe QNS is capable of increasing production by at least 5% in 2019 by extending its days of operation if the sugar price is favourable. The new RE plant is under construction, but total disbursement on construction was very low in 9M18. We expect the plant to be completed in 4Q19 and start operating from 1Q20 after a test run. The plant will thus not contribute to next year’s production.
Sugar price is expected to recover slowly as Brazil prioritises ethanol over sugar production. Global sugar prices have fallen so far due to oversupply conditions. These conditions are also forecast to be prolonged. The Brazilian President-elect has announced Brazil’s intention to regain global leadership in ethanol production, leading to reduced sugar supply as mills switch to biofuel production. We expect average global sugar prices to increase by 5% yoy in 2019 and QNS revenue to increase by the same pace based on unchanged volume expectations.
Soymilk sales are forecast to grow slightly with strong competition among traditional beverage products. The FAMI GO new product is not likely to boost long-term sales. Traditional soymilk product sales is facing headwinds because there is strong competition from both domestic and foreign players such as Vinamilk, Nutifood, Dutch Mills and Vitasoy, coupled with an overall slowdown of milk-based product sales in Vietnam as discussed earlier. FAMI GOhas three key weaknesses: (1) we have tasted the product and think that it contains too much sugar to attract adult customers or modern parents who believe that too much sugar is unhealthy, (2) it is too expensive compared with a similar-sized original FAMI soymilk product (price is 70% higher) to attract young customers or customers

Small and Midcap Research
www.vndirect.com.vn 7
IN ALLIANCE WITH
in rural areas and, (3) it is very different to the Vietnamese concept of a healthy breakfast. However, we believe QNS will be able to keep its soymilk sales growth rate at 5% yoy in 2019 based on our expectation for continued heavy investment in marketing.
Our 2019 forecasted revenue and net profit growth are 8.1% and 8.4%, respectively, mainly based on improved contribution from sugar sales. We maintain our SG&A expense projection as we expect that QNS will continue to spend aggressively on promotions in order to support soymilk sales amid a challenging FMCG environment in Vietnam. The tax rate will remain at the same level as 2018 as QNS relies on imported soybeans and will probably continue doing so as global soybean prices are still low due to continuing trade tensions between the US and China. Our 2019 EPS forecast is VND4,879 per share.
VALUATION – WE UPGRADE TO ADD RECOMMENDATION
Our new target price for QNS share is VND50,000. The new target price is 12.3% higher than our previous target and equivalent to an upside of 17.1% from latest close price. We use a sum-of-parts valuation method, with each part being valued using a target P/E multiple applied to our 2019 forward EPS. Our target P/E multiple for the soymilk, sugar and others segments are 10.1x, 6.9x and 14.5x respectively, in-line with the peer average for each. Our TP translates into an implied 2018 P/E of 11.1x and a 2019 P/E of 10.2x.
Figure 13: SOTP valuation
Source: VNDIRECT
Figure 14: Peer comparison (Data as 16 November 2018)
Source: VNDIRECT, FiinPro
%EBT
FY19
EBT
FY19
Tax
rate
NPAT
FY19
EPS
FY19
Target
P/E(x)
Target Price
(VND)
Soymilk 66% 926 15% 785 3,091 10.1 31,133
Sugar 18% 246 3% 239 941 6.9 6,533
Others 16% 226 5% 215 847 14.5 12,316
49,982 Target price
Peers Market
Market cap
(US$ m)
TTM NPAT
growth (%)
TTM EPS
growth (%)
TTM
ROA (%)
TTM
ROE (%) D/E (x)
TTM
P/E (x)
TTM
P/B (x)
Dairy - Soymilk and Nutrient drinks
VNM Vietnam 8,602.0 -1.4% -1.4% 27.6% 37.7% 0.3x 20.7x 7.9x
VCF Vietnam 175.3 1.3% 1.3% 28.3% 65.5% 0.7x 6.3x 3.4x
SKH Vietnam 29.9 35.4% 35.4% 17.9% 26.6% 0.5x 7.2x 1.8x
SKV Vietnam 19.9 -0.1% -0.1% 15.5% 28.1% 1.2x 6.0x 1.6x
Average 10.1x 3.7x
Sugar
SLS Vietnam 26.1 -7.7% -7.7% 8.6% 23.0% 1.4x 5.7x 1.2x
KTS Vietnam 3.2 1.3% 1.3% 2.1% 6.0% 1.9x 8.2x 0.5x
Average 6.9x 0.9x
Others
Beer
BSP Vietnam 11.7 -6.6% -6.6% 11.2% 17.8% 0.6x 6.4x 1.1x
THB Vietnam 5.9 -63.9% -63.9% 0.9% 1.7% 1.3x 46.2x 0.8x
HAT Vietnam 5.1 -10.3% -12.6% 18.8% 52.3% 1.8x 3.9x 1.8x
Mineral water
QHW Vietnam 20.7 19.5% 19.5% 10.7% 15.6% 0.4x 10.6x 1.6x
Electricity
HJS Vietnam 22.1 5.4% 5.4% 10.1% 15.8% 0.5x 11.1x 1.8x
QPH Vietnam 20.7 19.5% 19.5% 10.7% 15.6% 0.4x 10.6x 1.6x
Confectionary
BBC Vietnam 49.4 -5.9% -8.0% 8.4% 10.9% 0.3x 12.8x 1.3x
Average 14.5x 1.4x
QNS 531.9 3.4% 3.4% 14.6% 23.5% 0.6x 11.1x 2.5x
Small and Midcap Research
www.vndirect.com.vn 8
IN ALLIANCE WITH
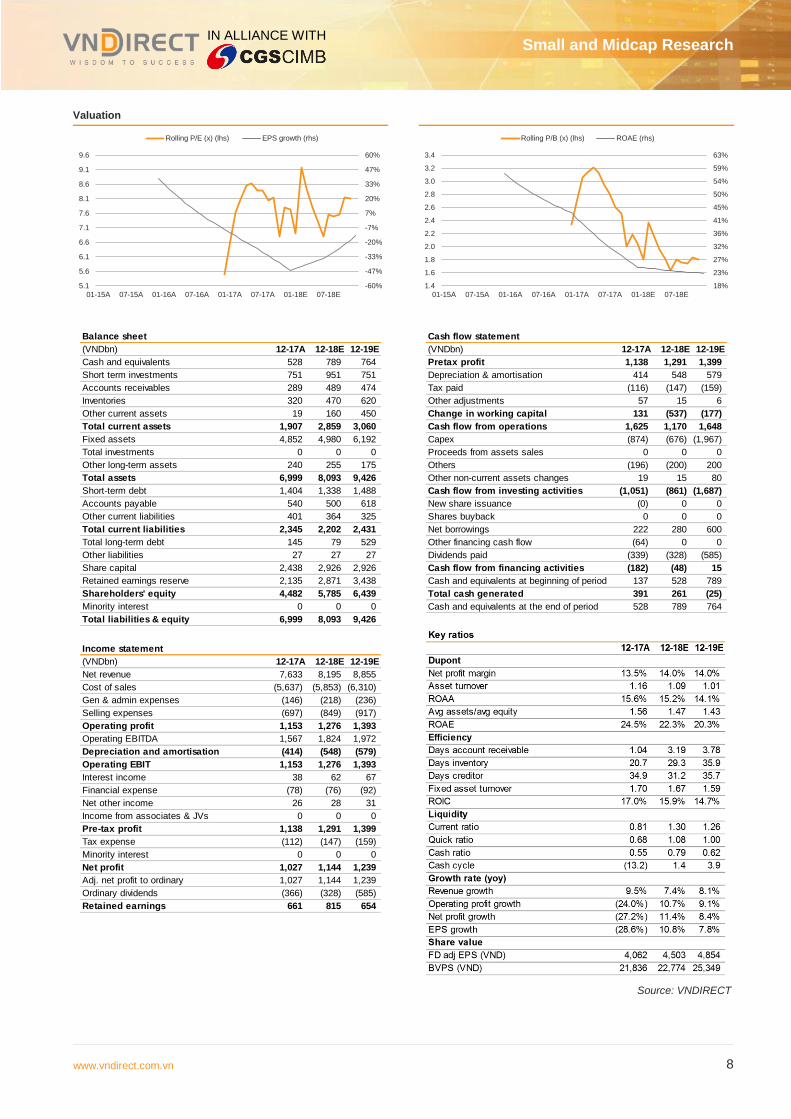
Valuation
Source: VNDIRECT
-60%
-47%
-33%
-20%
-7%
7%
20%
33%
47%
60%
5.1
5.6
6.1
6.6
7.1
7.6
8.1
8.6
9.1
9.6
01-15A 07-15A 01-16A 07-16A 01-17A 07-17A 01-18E 07-18E
Rolling P/E (x) (lhs) EPS growth (rhs)
18%
23%
27%
32%
36%
41%
45%
50%
54%
59%
63%
1.4
1.6
1.8
2.0
2.2
2.4
2.6
2.8
3.0
3.2
3.4
01-15A 07-15A 01-16A 07-16A 01-17A 07-17A 01-18E 07-18E
Rolling P/B (x) (lhs) ROAE (rhs)
Balance sheet
(VNDbn) 12-17A 12-18E 12-19E
Cash and equivalents 528 789 764
Short term investments 751 951 751
Accounts receivables 289 489 474
Inventories 320 470 620
Other current assets 19 160 450
Total current assets 1,907 2,859 3,060
Fixed assets 4,852 4,980 6,192
Total investments 0 0 0
Other long-term assets 240 255 175
Total assets 6,999 8,093 9,426
Short-term debt 1,404 1,338 1,488
Accounts payable 540 500 618
Other current liabilities 401 364 325
Total current liabilities 2,345 2,202 2,431
Total long-term debt 145 79 529
Other liabilities 27 27 27
Share capital 2,438 2,926 2,926
Retained earnings reserve 2,135 2,871 3,438
Shareholders' equity 4,482 5,785 6,439
Minority interest 0 0 0
Total liabilities & equity 6,999 8,093 9,426
Income statement
(VNDbn) 12-17A 12-18E 12-19E
Net revenue 7,633 8,195 8,855
Cost of sales (5,637) (5,853) (6,310)
Gen & admin expenses (146) (218) (236)
Selling expenses (697) (849) (917)
Operating profit 1,153 1,276 1,393
Operating EBITDA 1,567 1,824 1,972
Depreciation and amortisation (414) (548) (579)
Operating EBIT 1,153 1,276 1,393
Interest income 38 62 67
Financial expense (78) (76) (92)
Net other income 26 28 31
Income from associates & JVs 0 0 0
Pre-tax profit 1,138 1,291 1,399
Tax expense (112) (147) (159)
Minority interest 0 0 0
Net profit 1,027 1,144 1,239
Adj. net profit to ordinary 1,027 1,144 1,239
Ordinary dividends (366) (328) (585)
Retained earnings 661 815 654
Cash flow statement
(VNDbn) 12-17A 12-18E 12-19E
Pretax profit 1,138 1,291 1,399
Depreciation & amortisation 414 548 579
Tax paid (116) (147) (159)
Other adjustments 57 15 6
Change in working capital 131 (537) (177)
Cash flow from operations 1,625 1,170 1,648
Capex (874) (676) (1,967)
Proceeds from assets sales 0 0 0
Others (196) (200) 200
Other non-current assets changes 19 15 80
Cash flow from investing activities (1,051) (861) (1,687)
New share issuance (0) 0 0
Shares buyback 0 0 0
Net borrowings 222 280 600
Other financing cash flow (64) 0 0
Dividends paid (339) (328) (585)
Cash flow from financing activities (182) (48) 15
Cash and equivalents at beginning of period 137 528 789
Total cash generated 391 261 (25)
Cash and equivalents at the end of period 528 789 764

Small and Midcap Research
www.vndirect.com.vn 9
IN ALLIANCE WITH
DISCLAIMER
The content of this report (including the views and opinions expressed therein, and the information comprised therein) has been prepared by and belongs to VNDIRECT Securities Corporation, and is distributed by CGS-CIMB or CIMB Investment Bank Berhad (“CIMB”), as the case may be, pursuant to an arrangement between VNDIRECT Securities Corporation and CGS-CIMB. VNDIRECT Securities Corporation is not an affiliate of CGS-CIMB or CIMB.
This report is not directed to, or intended for distribution to or use by, any person or entity who is a citizen or resident of or located in any locality, state, country or other jurisdiction where such distribution, publication, availability or use would be contrary to law or regulation.
By accepting this report, the recipient hereof represents and warrants that he is entitled to receive such report in accordance with the restrictions set forth below and agrees to be bound by the limitations contained herein (including the “Restrictions on Distributions” set out below). Any failure to comply with these limitations may constitute a violation of law. This publication is being supplied to you strictly on the basis that it will remain confidential. No part of this report may be (i) copied, photocopied, duplicated, stored or reproduced in any form by any means or (ii) redistributed or passed on, directly or indirectly, to any other person in whole or in part, for any purpose without the prior written consent of CGS-CIMB or CIMB, as the case may be.
The information contained in this research report is prepared from data believed to be correct and reliable at the time of issue of this report.
VNDIRECT Securities Corporation may or may not issue regular reports on the subject matter of this report at any frequency and may cease to do so or change the periodicity of reports at any time. None of VNDIRECT Securities Corporation, CGS-CIMB or CIMB is under any obligation to update this report in the event of a material change to the information contained in this report. None of VNDIRECT Securities Corporation, CGS-CIMB or CIMB has any and will accept any, obligation to (i) check or ensure that the contents of this report remain current, reliable or relevant, (ii) ensure that the content of this report constitutes all the information a prospective investor may require, (iii) ensure the adequacy, accuracy, completeness, reliability or fairness of any views, opinions and information, and accordingly, VNDIRECT Securities Corporation, CGS-CIMB and CIMB and their respective affiliates and related persons including China Galaxy International Financial Holdings Limited (“CGIFHL”) and CIMB Group Sdn. Bhd. (“CIMBG”) and their respective related corporations (and their respective directors, associates, connected persons and/or employees) shall not be liable in any manner whatsoever for any consequences (including but not limited to any direct, indirect or consequential losses, loss of profits and damages) of any reliance thereon or usage thereof. In particular, VNDIRECT Securities Corporation, CGS-CIMB and CIMB disclaim all responsibility and liability for the views and opinions set out in this report.
Unless otherwise specified, this report is based upon reasonable sources. Such sources will, unless otherwise specified, for market data, be market data and prices available from the main stock exchange or market where the relevant security is listed, or, where appropriate, any other market. Information on the accounts and business of company(ies) will generally be based on published statements of the company(ies), information disseminated by regulatory information services, other publicly available information and information resulting from our research. Whilst every effort is made to ensure that statements of facts made in this report are accurate, all estimates, projections, forecasts, expressions of opinion and other subjective judgments contained in this report are based on assumptions considered to be reasonable as of the date of the document in which they are contained and must not be construed as a representation that the matters referred to therein will occur. Past performance is not a reliable indicator of future performance. The value of investments may go down as well as up and those investing may, depending on the investments in question, lose more than the initial investment. No report shall constitute an offer or an invitation by or on behalf of CGS-CIMB, CIMB, or VNDIRECT Securities Corporation, or their respective affiliates (including CGIFHL, CIMBG and their respective related corporations) to any person to buy or sell any investments.
CGS-CIMB, CIMB and/or VNDIRECT Securities Corporation and/or their respective affiliates and related corporations (including CGIFHL, CIMBG and their respective related corporations), their respective directors, associates, connected parties and/or employees may own or have positions in securities of the company(ies) covered in this research report or any securities related thereto and may from time to time add to or dispose of, or may be materially interested in, any such securities. Further, CGS-CIMB, CIMB and/or VNDIRECT Securities Corporation, and/or their respective affiliates and their respective related corporations (including CGIFHL, CIMBG and their respective related corporations) do and seek to do business with the company(ies) covered in this research report and may from time to time act as market maker or have assumed an underwriting commitment in securities of such company(ies), may sell them to or buy them from customers on a principal basis and may also perform or seek to perform significant investment banking, advisory, underwriting or placement services for or relating to such company(ies) as well as solicit such investment, advisory or other services from any entity mentioned in this report.
CGS-CIMB, CIMB and/or VNDIRECT Securities Corporation and/or their respective affiliates (including CGIFHL, CIMBG and their respective related corporations) may enter into an agreement with the company(ies) covered in this report relating to the production of research reports. CGS-CIMB, CIMB and/or VNDIRECT Securities Corporation may disclose the contents of this report to the company(ies) covered by it and may have amended the contents of this report following such disclosure.
The analyst responsible for the production of this report hereby certifies that the views expressed herein accurately and exclusively reflect his or her personal views and opinions about any and all of the issuers or securities analysed in this report and were prepared independently and autonomously. No part of the compensation of the analyst(s) was, is, or will be directly or indirectly related to the inclusion of specific recommendations(s) or view(s) in this report. The analyst(s) who prepared this research report is prohibited from receiving any compensation, incentive or bonus based on specific investment banking transactions or for providing a specific recommendation for, or view of, a particular company. Information barriers and other arrangements may be established where necessary to prevent conflicts of interests arising. However, the analyst(s) may receive compensation that is based on his/their coverage of company(ies) in the performance of his/their duties or the performance of his/their recommendations and the research personnel involved in the preparation of this report may also participate in the solicitation of the businesses as described above. In reviewing this research report, an investor should be aware that any or all of the foregoing, among other things, may give rise to real or potential conflicts of interest. Additional information is, subject to the duties of confidentiality,

Small and Midcap Research
www.vndirect.com.vn 10
IN ALLIANCE WITH
available on request.
The term “VNDIRECT Securities Corporation” shall, unless the context otherwise requires, mean VNDIRECT Securities Corporation and its affiliates, subsidiaries and related companies. The term “CGS-CIMB” shall denote, where appropriate, the relevant entity distributing or disseminating the report in the particular jurisdiction referenced below, or, in every other case except as otherwise stated herein, CIMB Securities International Pte. Ltd. and its affiliates, subsidiaries and related corporations.
CGS-CIMB
Country CGS-CIMB Entity Regulated by
Hong Kong CGS-CIMB Securities Limited Securities and Futures Commission Hong Kong
India CGS-CIMB Securities (India) Private Limited Securities and Exchange Board of India (SEBI)
Indonesia PT CGS-CIMB Sekuritas Indonesia Financial Services Authority of Indonesia
Singapore CGS-CIMB Research Pte. Ltd. Monetary Authority of Singapore
South Korea CGS-CIMB Securities Limited, Korea Branch Financial Services Commission and Financial Supervisory Service
Thailand CGS-CIMB Securities (Thailand) Co. Ltd. Securities and Exchange Commission Thailand
CIMB
Country CIMB Entity Regulated by
Malaysia CIMB Investment Bank Berhad Securities Commission Malaysia
(i) As of 20 November 2018 VNDIRECT Securities Corporation has a proprietary position in the securities (which may include but not limited to shares, warrants, call warrants and/or any other derivatives) in the following company or companies covered or recommended in this report:
(a) -
(ii) As of 20 November 2018, the analyst(s) who prepared this report, and the associate(s), has / have an interest in the securities (which may include but not limited to shares, warrants, call warrants and/or any other derivatives) in the following company or companies covered or recommended in this report:
(a) -
This report does not purport to contain all the information that a prospective investor may require. CGS-CIMB, and VNDIRECT Securities Corporation and their respective affiliates (including CGIFHL, CIMBG and their related corporations) do not make any guarantee, representation or warranty, express or implied, as to the adequacy, accuracy, completeness, reliability or fairness of any such information and opinion contained in this report. None of CGS-CIMB, CIMB and VNDIRECT Securities Corporation and their respective affiliates nor their related persons (including CGIFHL, CIMBG and their related corporations) shall be liable in any manner whatsoever for any consequences (including but not limited to any direct, indirect or consequential losses, loss of profits and damages) of any reliance thereon or usage thereof.
This report is general in nature and has been prepared for information purposes only. It is intended for circulation amongst CGS-CIMB’s, CIMB’s and their respective affiliates’ (including CGIFHL’s, CIMBG’s and their respective related corporations’) clients generally and does not have regard to the specific investment objectives, financial situation and the particular needs of any specific person who may receive this report. The information and opinions in this report are not and should not be construed or considered as an offer, recommendation or solicitation to buy or sell the subject securities, related investments or other financial instruments or any derivative instrument, or any rights pertaining thereto.
Investors are advised to make their own independent evaluation of the information contained in this research report, consider their own individual investment objectives, financial situation and particular needs and consult their own professional and financial advisers as to the legal, business, financial, tax and other aspects before participating in any transaction in respect of the securities of company(ies) covered in this research report. The securities of such company(ies) may not be eligible for sale in all jurisdictions or to all categories of investors.
Australia: Despite anything in this report to the contrary, this research is provided in Australia by CIMB Securities (Singapore) Pte. Ltd. and CIMB Securities Limited. This research is only available in Australia to persons who are “wholesale clients” (within the meaning of the Corporations Act 2001 (Cth) and is supplied solely for the use of such wholesale clients and shall not be distributed or passed on to any other person. You represent and warrant that if you are in Australia, you are a “wholesale client”. This research is of a general nature only and has been prepared without taking into account the objectives, financial situation or needs of the individual recipient. CIMB Securities (Singapore) Pte. Ltd. and CIMB Securities Limited do not hold, and are not required to hold an Australian financial services license. CIMB Securities (Singapore) Pte. Ltd. and CIMB Securities Limited rely on “passporting” exemptions for entities appropriate ly licensed by the Monetary Authority of Singapore (under ASIC Class Order 03/1102) and the Securities and Futures Commission in Hong Kong (under ASIC Class Order 03/1103).
Canada: This research report has not been prepared in accordance with the disclosure requirements of Dealer Member Rule 3400 – Research Restrictions and Disclosure Requirements of the Investment Industry Regulatory Organization of Canada. For any research report distributed by CIBC, further disclosures related to CIBC conflicts of interest can be found at https://researchcentral.cibcwm.com.
China: For the purpose of this report, the People’s Republic of China (“PRC”) does not include the Hong Kong Special Administrative Region, the Macau Special Administrative Region or Taiwan. The distributor of this report has not been approved or licensed by the China Securities Regulatory Commission or any other relevant regulatory authority or governmental agency in the PRC. This report contains only marketing

Small and Midcap Research
www.vndirect.com.vn 11
IN ALLIANCE WITH
information. The distribution of this report is not an offer to buy or sell to any person within or outside PRC or a solicitation to any person within or outside of PRC to buy or sell any instruments described herein. This report is being issued outside the PRC to a limited number of institutional investors and may not be provided to any person other than the original recipient and may not be reproduced or used for any other purpose.
France: Only qualified investors within the meaning of French law shall have access to this report. This report shall not be considered as an offer to subscribe to, or used in connection with, any offer for subscription or sale or marketing or direct or indirect distribution of financial instruments and it is not intended as a solicitation for the purchase of any financial instrument.
Germany: This report is only directed at persons who are professional investors as defined in sec 31a(2) of the German Securities Trading Act (WpHG). This publication constitutes research of a non-binding nature on the market situation and the investment instruments cited here at the time of the publication of the information.
The current prices/yields in this issue are based upon closing prices from Bloomberg as of the day preceding publication. Please note that neither the German Federal Financial Supervisory Agency (BaFin), nor any other supervisory authority exercises any control over the content of this report.
Hong Kong: This report is issued and distributed in Hong Kong by CIMB Securities Limited (“CHK”) which is licensed in Hong Kong by the Securities and Futures Commission for Type 1 (dealing in securities), Type 4 (advising on securities) and Type 6 (advising on corporate finance) activities. Any investors wishing to purchase or otherwise deal in the securities covered in this report should contact the Head of Sales at CIMB Securities Limited. The views and opinions in this research report are of VNDIRECT Securities Corporation as of the date hereof and are subject to change. If the Financial Services and Markets Act of the United Kingdom or the rules of the Financial Conduct Authority apply to a recipient, our obligations owed to such recipient therein are unaffected. CHK has no obligation to update its opinion or the information in this research report.
This publication is strictly confidential and is for private circulation only to clients of CHK.
CHK does not make a market on other securities mentioned in the report.
India: This report is issued and distributed in India by CIMB Securities (India) Private Limited (“CIMB India”) which is registered with the National Stock Exchange of India Limited and BSE Limited as a trading and clearing member under the Securities and Exchange Board of India (Stock Brokers and Sub-Brokers) Regulations, 1992. In accordance with the provisions of Regulation 4(g) of the Securities and Exchange Board of India (Investment Advisers) Regulations, 2013, CIMB India is not required to seek registration with the Securities and Exchange Board of India (“SEBI”) as an Investment Adviser. CIMB India is registered with SEBI as a Research Analyst pursuant to the SEBI (Research Analysts) Regulations, 2014 ("Regulations").
This report does not take into account the particular investment objectives, financial situations, or needs of the recipients. It is not intended for and does not deal with prohibitions on investment due to law/jurisdiction issues etc. which may exist for certain persons/entities. Recipients should rely on their own investigations and take their own professional advice before investment.
The report is not a “prospectus” as defined under Indian Law, including the Companies Act, 2013, and is not, and shall not be, approved by, or filed or registered with, any Indian regulator, including any Registrar of Companies in India, SEBI, any Indian stock exchange, or the Reserve Bank of India. No offer, or invitation to offer, or solicitation of subscription with respect to any such securities listed or proposed to be listed in India is being made, or intended to be made, to the public, or to any member or section of the public in India, through or pursuant to this report.
The research analysts, strategists or economists principally responsible for the preparation of this research report are segregated from the other activities of CIMB India and they have received compensation based upon various factors, including quality, accuracy and value of research, firm profitability or revenues, client feedback and competitive factors. Research analysts', strategists' or economists' compensation is not linked to investment banking or capital markets transactions performed or proposed to be performed by CIMB India or its affiliates.
CIMB India has not received any investment banking related compensation from the companies mentioned in the report in the past 12 months.
CIMB India has not received any compensation from the companies mentioned in the report in the past 12 months.
Indonesia: This report is issued and distributed by PT CIMB Sekuritas Indonesia (“CIMBI”). The views and opinions in this research report are our own as of the date hereof and are subject to change. CIMBI has no obligation to update its opinion or the information in this research report. Neither this report nor any copy hereof may be distributed in Indonesia or to any Indonesian citizens wherever they are domiciled or to Indonesian residents except in compliance with applicable Indonesian capital market laws and regulations.
This research report is not an offer of securities in Indonesia. The securities referred to in this research report have not been registered with the Financial Services Authority (Otoritas Jasa Keuangan) pursuant to relevant capital market laws and regulations, and may not be offered or sold within the territory of the Republic of Indonesia or to Indonesian citizens through a public offering or in circumstances which constitute an offer within the meaning of the Indonesian capital market law and regulations.
Ireland: CGS-CIMB is not an investment firm authorised in the Republic of Ireland and no part of this document should be construed as CGS-CIMB acting as, or otherwise claiming or representing to be, an investment firm authorised in the Republic of Ireland.
Malaysia: This report is distributed by CIMB solely for the benefit of and for the exclusive use of our clients. CIMB has no obligation to update, revise or reaffirm its opinion or the information in this research reports after the date of this report.
New Zealand: In New Zealand, this report is for distribution only to persons who are wholesale clients pursuant to section 5C of the Financial Advisers Act 2008.
Singapore: This report is issued and distributed by CIMB Research Pte Ltd (“CIMBR”). CIMBR is a financial adviser licensed under the Financial Advisers Act, Cap 110 (“FAA”) for advising on investment products, by issuing or promulgating research analyses or research reports, whether in electronic, print or other form. Accordingly CIMBR is a subject to the applicable rules under the FAA unless it is able to avail itself to any prescribed exemptions.
Recipients of this report are to contact CIMB Research Pte Ltd, 50 Raffles Place, #16-02 Singapore Land Tower, Singapore in respect of any

Small and Midcap Research
www.vndirect.com.vn 12
IN ALLIANCE WITH
matters arising from, or in connection with this report. CIMBR has no obligation to update its opinion or the information in this research report. This publication is strictly confidential and is for private circulation only. If you have not been sent this report by CIMBR directly, you may not rely, use or disclose to anyone else this report or its contents.
If the recipient of this research report is not an accredited investor, expert investor or institutional investor, CIMBR accepts legal responsibility for the contents of the report without any disclaimer limiting or otherwise curtailing such legal responsibility. If the recipient is an accredited investor, expert investor or institutional investor, the recipient is deemed to acknowledge that CIMBR is exempt from certain requirements under the FAA and its attendant regulations, and as such, is exempt from complying with the following :
(a) Section 25 of the FAA (obligation to disclose product information);
(b) Section 27 (duty not to make recommendation with respect to any investment product without having a reasonable basis where you may be reasonably expected to rely on the recommendation) of the FAA;
(c) MAS Notice on Information to Clients and Product Information Disclosure [Notice No. FAA-N03];
(d) MAS Notice on Recommendation on Investment Products [Notice No. FAA-N16];
(e) Section 36 (obligation on disclosure of interest in securities), and
(f) any other laws, regulations, notices, directive, guidelines, circulars and practice notes which are relates to the above, to the extent permitted by applicable laws, as may be amended from time to time, and any other laws, regulations, notices, directive, guidelines, circulars, and practice notes as we may notify you from time to time. In addition, the recipient who is an accredited investor, expert investor or institutional investor acknowledges that a CIMBR is exempt from Section 27 of the FAA, the recipient will also not be able to file a civil claim against CIMBR for any loss or damage arising from the recipient’s reliance on any recommendation made by CIMBR which would otherwise be a right that is available to the recipient under Section 27 of the FAA, the recipient will also not be able to file a civil claim against CIMBR for any loss or damage arising from the recipient’s reliance on any recommendation made by CIMBR which would otherwise be a right that is available to the recipient under Section 27 of the FAA.
CIMBR, its affiliates and related corporations, their directors, associates, connected parties and/or employees may own or have positions in securities of the company(ies) covered in this research report or any securities related thereto and may from time to time add to or dispose of, or may be materially interested in, any such securities. Further, CIMBR, its affiliates and its related corporations do and seek to do business with the company(ies) covered in this research report and may from time to time act as market maker or have assumed an underwriting commitment in securities of such company(ies), may sell them to or buy them from customers on a principal basis and may also perform or seek to perform significant investment banking, advisory, underwriting or placement services for or relating to such company(ies) as well as solicit such investment, advisory or other services from any entity mentioned in this report.
As of 20 November 2018,, CIMBR does not have a proprietary position in the recommended securities in this report.
CIMBR does not make a market on the securities mentioned in the report.
South Korea: This report is issued and distributed in South Korea by CIMB Securities Limited, Korea Branch (“CIMB Korea”) which is licensed as a cash equity broker, and regulated by the Financial Services Commission and Financial Supervisory Service of Korea. In South Korea, this report is for distribution only to professional investors under Article 9(5) of the Financial Investment Services and Capital Market Act of Korea (“FSCMA”).
Spain: This document is a research report and it is addressed to institutional investors only. The research report is of a general nature and not personalised and does not constitute investment advice so, as the case may be, the recipient must seek proper advice before adopting any investment decision. This document does not constitute a public offering of securities.
CGS-CIMB is not registered with the Spanish Comision Nacional del Mercado de Valores to provide investment services.
Sweden: This report contains only marketing information and has not been approved by the Swedish Financial Supervisory Authority. The distribution of this report is not an offer to sell to any person in Sweden or a solicitation to any person in Sweden to buy any instruments described herein and may not be forwarded to the public in Sweden.
Switzerland: This report has not been prepared in accordance with the recognized self-regulatory minimal standards for research reports of banks issued by the Swiss Bankers’ Association (Directives on the Independence of Financial Research).
Thailand: This report is issued and distributed by CIMB Securities (Thailand) Co. Ltd. (“CIMBT”) based upon sources believed to be reliable (but their accuracy, completeness or correctness is not guaranteed). The statements or expressions of opinion herein were arrived at after due and careful consideration for use as information for investment. Such opinions are subject to change without notice and CIMBT has no obligation to update its opinion or the information in this research report.
CIMBT may act or acts as Market Maker, and issuer and offerer of Derivative Warrants and Structured Note which may have the following securities as its underlying securities. Investors should carefully read and study the details of the derivative warrants in the prospectus before making investment decisions.
AAV, ADVANC, AMATA, ANAN, AOT, AP, BA, BANPU, BBL, BCH, BCP, BCPG, BDMS, BEAUTY, BEC, BEM, BJC, BH, BIG, BLA, BLAND, BPP, BTS, CBG, CENTEL, CHG, CK, CKP, COM7, CPALL, CPF, CPN, DELTA, DTAC, EA, EGCO, EPG, GFPT, GLOBAL, GLOW, GPSC, GUNKUL, HMPRO, INTUCH, IRPC, ITD, IVL, KBANK, KCE, KKP, KTB, KTC, LH, LHBANK, LPN, MAJOR, MALEE, MEGA, MINT, MONO, MTLS, PLANB, PSH, PTL, PTG, PTT, PTTEP, PTTGC, QH, RATCH, ROBINS, S, SAWAD, SCB, SCC, SCCC, SIRI, SPALI, SPRC, STEC, STPI, SUPER, TASCO, TCAP, THAI, THANI, THCOM, TISCO, TKN, TMB, TOP, TPIPL, TRUE, TTA, TU, TVO, UNIQ, VGI, WHA, WORK.
Corporate Governance Report:
The disclosure of the survey result of the Thai Institute of Directors Association (“IOD”) regarding corporate governance is made pursuant to the policy of the Office of the Securities and Exchange Commission. The survey of the IOD is based on the information of a company listed on the Stock Exchange of Thailand and the Market for Alternative Investment disclosed to the public and able to be accessed by a general
Small and Midcap Research
www.vndirect.com.vn 13
IN ALLIANCE WITH
public investor. The result, therefore, is from the perspective of a third party. It is not an evaluation of operation and is not based on inside information.
The survey result is as of the date appearing in the Corporate Governance Report of Thai Listed Companies. As a result, the survey result may be changed after that date. CIMBT does not confirm nor certify the accuracy of such survey result.
Score Range: 90 - 100 80 – 89 70 - 79 Below 70 or No Survey Result
Description: Excellent Very Good Good N/A
United Arab Emirates: The distributor of this report has not been approved or licensed by the UAE Central Bank or any other relevant licensing authorities or governmental agencies in the United Arab Emirates. This report is strictly private and confidential and has not been reviewed by, deposited or registered with UAE Central Bank or any other licensing authority or governmental agencies in the United Arab Emirates. This report is being issued outside the United Arab Emirates to a limited number of institutional investors and must not be provided to any person other than the original recipient and may not be reproduced or used for any other purpose. Further, the information contained in this report is not intended to lead to the sale of investments under any subscription agreement or the conclusion of any other contract of whatsoever nature within the territory of the United Arab Emirates.
United Kingdom and European Economic Area (EEA): In the United Kingdom and European Economic Area, this material is also being distributed by CIMB Securities (UK) Limited (“CIMB UK”). CIMB UK is authorized and regulated by the Financial Conduct Authority and its registered office is at 27 Knightsbridge, London, SW1X7YB. The material distributed by CIMB UK has been prepared in accordance with CGS-CIMB’s policies for managing conflicts of interest arising as a result of publication and distribution of this material. This material is for distribution only to, and is solely directed at, selected persons on the basis that those persons: (a) are eligible counterparties and professional clients of CIMB UK; (b) have professional experience in matters relating to investments falling within Article 19(5) of the Financial Services and Markets Act 2000 (Financial Promotion) Order 2005 (as amended, the “Order”), (c) fall within Article 49(2)(a) to (d) (“high net worth companies, unincorporated associations etc”) of the Order; (d) are outside the United Kingdom subject to relevant regulation in each jurisdiction, material(all such persons together being referred to as “relevant persons”). This material is directed only at relevant persons and must not be acted on or relied on by persons who are not relevant persons. Any investment or investment activity to which this material relates is available only to relevant persons and will be engaged in only with relevant persons.
Where this material is labelled as non-independent, it does not provide an impartial or objective assessment of the subject matter and does not constitute independent “research” (cannot remove research from here under the applicable rules of the Financial Conduct Authority in the UK. Consequently, any such non-independent material will not have been prepared in accordance with legal requirements designed to promote the independence of research (cannot remove research from here) and will not subject to any prohibition on dealing ahead of the dissemination of research. Any such non-independent material must be considered as a marketing communication.
United States: This research report is distributed in the United States of America by CIMB Securities (USA) Inc, a U.S. registered broker-dealer and a related company of CIMB Research Pte Ltd, PT CIMB Sekuritas Indonesia, CIMB Securities (Thailand) Co. Ltd, CIMB Securities Limited, CIMB Securities (India) Private Limited, and is distributed solely to persons who qualify as “U.S. Institutional Investors” as defined in Rule 15a-6 under the Securities and Exchange Act of 1934. This communication is only for Institutional Investors whose ordinary business activities involve investing in shares, bonds, and associated securities and/or derivative securities and who have professional experience in such investments. Any person who is not a U.S. Institutional Investor or Major Institutional Investor must not rely on this communication. The delivery of this research report to any person in the United States of America is not a recommendation to effect any transactions in the securities discussed herein, or an endorsement of any opinion expressed herein. CIMB Securities (USA) Inc, is a FINRA/SIPC member and takes responsibility for the content of this report. For further information or to place an order in any of the above-mentioned securities please contact a registered representative of CIMB Securities (USA) Inc.
CIMB Securities (USA) Inc. does not make a market on other securities mentioned in the report.
CIMB Securities (USA) Inc. has not managed or co-managed a public offering of any of the securities mentioned in the past 12 months.
CIMB Securities (USA) Inc. has not received compensation for investment banking services from any of the company mentioned in the past 12 months.
CIMB Securities (USA) Inc. neither expects to receive nor intends to seek compensation for investment banking services from any of the company mentioned within the next 3 months.
Other jurisdictions: In any other jurisdictions, except if otherwise restricted by laws or regulations, this report is only for distribution to professional, institutional or sophisticated investors as defined in the laws and regulations of such jurisdictions.

Small and Midcap Research
www.vndirect.com.vn 14
IN ALLIANCE WITH
RECOMMENDATION FRAMEWORK
Stock Ratings Definition:
Add The stock’s total return is expected to reach 15% or higher over the next 12 months.
Hold The stock’s total return is expected to be between negative 10% and positive 15% over the next 12 months.
Reduce The stock’s total return is expected to fall below negative 10% over the next 12 months.
The total expected return of a stock is defined as the sum of the:(i) percentage difference between the target price and the current price
and (ii) the forward net dividend yields of the stock. Stock price targets have an investment horizon of 12 months.
Sector Ratings Definition:
Overweight An Overweight rating means stocks in the sector have, on a market cap-weighted basis, a positive absolute
recommendation.
Neutral A Neutral rating means stocks in the sector have, on a market cap-weighted basis, a neutral absolute
recommendation.
Underweight An Underweight rating means stocks in the sector have, on a market cap-weighted basis, a negative absolute
recommendation.
Country Ratings Definition:
Overweight An Overweight rating means investors should be positioned with an above-market weight in this country relative
to benchmark.
Neutral A Neutral rating means investors should be positioned with a neutral weight in this country relative to benchmark.
Underweight An Underweight rating means investors should be positioned with a below-market weight in this country relative
to benchmark.
Anirban Lahiri – Head of Research
Email: [email protected]
Nguyen Tien Duc –
Email: [email protected]
–
Email:
–
Email:
–
Email:
–
Email:
VNDIRECT Securities Corporation
1 Nguyen Thuong Hien Str – Hai Ba Trung Dist – Ha Noi
Tel: +84 2439724568
Email: [email protected]
Website: https://vndirect.com.vn