Embed Size (px)
Citation preview

DOT/FAA/AM-95/7
Office of Aviation Medicine Washington, D.C. 20591
Some Performance Effects of Age and Low Blood Alcohol Levels on a Computerized Nenropsychological Test
David J. Schroeder
Howard C. Harris, Jr.
William E. Collins
Thomas E. Nesthus
Civil Aeromedical Institute
Federal Aviation Administration
Oklahoma City, Oklahoma 73125
19950320 122
February 1995
DTIC ELECTE MAR 211995
G Final Report
This document is available to the public
through the National Technical Information
Service, Springfield, Virginia 22161.
Ö U.S. Department mc QP&HZZ nssmmm I of Transportation
Federal Aviation Administration

NOTICE
This document is disseminated under the sponsorship of
the U.S. Department of Transportation in the interest of
information exchange. The United States Government
assumes no liability for the contents or use thereof.

Technical Report Documentation Page
1. Report No.
DOT/FAA/AM-95/7
2. Government Accession No. 3. Recipient's Catalog No.
4. Title and Subtitle
Some Performance Effects of Age and Low Blood Alcohol Levels on a Computerized Neuropsychological Test
5. Report Date
February 1995
6. Performing Organization Code
7. Author(s) 8. Performing Organization Report No.
D.J. Schroeder, H.C. Harris, Jr., W.E. Collins, and T.E. Nesthus
9. Performing Organization Name and Address
FAA Civil Aeromedical Institute P.O. Box 25082 Oklahoma City, OK 73125
Accesion For
NTIS CRA&I DTIC TAB Unannounced Justification—
D
10. Work Unit No. (TRAIS)
11. Contract or Grant No.
12. Sponsoring Agency name and Address
Office of Aviation Medicine Federal Aviation Administration 800 Independence Avenue, S.W. Washington, DC 20591
13. Type of Report and Period Covered
By Distribution/
Availability Codes
Dist Avail and/or
Special 14. Sponsoring Agency Code
15. Supplemental Notes
8± 16. Abstract
COGSCREEN is a computerized test battery developed for the Federal Aviation Administration as an airman neuropsychological screening instrument for cognitive functioning. This study explored a multifaceted application of the sensitivity of the battery to potential differences in performance capabilities, current civil aviation interest in the performance effects of low levels of blood alcohol, and the potential significance of age on cognitive performance. Nine of 11 basic COGSCREEN tests were used with 60 subjects divided into three age groups, 27-32, 42-47, and 57-62 years. Twelve subjects within each age category (N=36) comprised an alcohol group; 8 subjects within each age category (N=24) comprised a control group. Subjects were given four 30-minute sessions of training on the task battery during one afternoon and participated in experimental sessions on the next afternoon. Experimental sessions comprised a pre-drinking (baseline) and three post-drinking sessions targeted to breath alcohol (BrAC) levels of 0.04, 0.027, and 0.014% for the alcohol group; each control subject received a placebo. The results yielded statistically significant age effects on 20 of 25 measures of performance across the 9 tasks for the pre- drinking sessions favoring the younger age group, using the entire subject population (N=60). An analysis using only the control subjects found significant age effects on 18 of the 25 measures of performance on both the baseline and the post-baseline sessions; whereas, the analysis of the alcohol subjects (N=36) found significant age differences on 15 of 25 scores for the pre-drinking session and only 13, 11, and 10 of 25 on the post-drinking sessions respectively. Results of the analyses for age and alcohol session effects revealed statistically significant interactions for 3 measures: mean reaction time of visual comparisons during dual task, and the symbol -di gi t del ayed recal 1 task, as wel 1 as the number of correct symbol -di gi t pai ri ngs of the del ayed recal 1 task. These data indicate that the COGSCREEN test battery is sensitive to decremental effects on information processing time and cognitive reductions associated with aging. Generally, the results of this study do not support a typical alcohol effect. The simple effects tests yielded results that failed to show sessional patterns consistent with BrAC levels. However, the alcohol sessions may have reduced differences between the age groups.
17. Keywords
Alcohol Age Performance Memory Neuropsychological Test Computerized Test Battery
18. Distribution Statement
Document is available to the public through the National Technical Information Service, Springfield, Virginia 22161.
19. Security Classif. (of this report)
Unclassified
20. Security Classif. (of this page)
Unclassified
21. No. of Pages
38
22. Price
Form DOT F 1700.7 (8-72) Reproduction of completed page authorized

SOME PERFORMANCE EFFECTS OF AGE AND LOW BLOOD ALCOHOL LEVELS ON A COMPUTERIZED
NEUROPSYCHOLOGICAL TEST
INTRODUCTION Age
A large body of literature associates quantitative changes in information processing speed with the
cognitive reductions attributed to aging. This litera-
ture indicates that the perceived cognitive reduction is
perhaps more an issue of processing speed rather than an actual cognitive deficit (Cerella, 1985, 1990; Hale,
Myerson, &Wagstaff, 1987; Myerson, Hale Wagstaff,
Poon,&Smith, 1990;Salthouse, 1985,1991; Myerson
&C Hale, 1993). Some of the differences reported in simple reaction times from one task to another are
accounted for by the nature of the task; however, in all
psychomotor functioning tasks, age differences are
apparent to some extent. This tendency is not re- stricted to a particular sensory modality or to a specific psychomotor response. (Davies, Taylor, & Dorn,
1992). Cerella (1985) reviewed 35 studies on the decline
in cognitive functioning in older age, comparing
subjects 60 years and older with those below 60 years
of age. His meta analysis demonstrated a slowing of
sensory-motor processes, but found that it was less
severe than the slowing of higher order processes. In a
recent study, Salthouse (1991) demonstrated that, even though some differences in cognitive perfor-
mance may be due to decreases in working memory, many age differences are seen largely due to reduc-
tions in the speed to carry out simple elementary
processing operations. This contention was further
supported by Hale, Lima, and Myerson (1991) in
their study showing that older adults evidenced slower
choice reaction times than younger adults.
Additionally, Lima, Hale, and Myerson (1991)
reported that as task complexity increased so did the
reaction times of older adults. Older adults were
found to be slower than younger adults when per-
forming non-lexical tasks, and the decrement doubled
on lexical tasks.
Birren (1974) attributed mental processing time
decrements to a basic neural slowing in the central brain mechanism, which results in a slowing of certain
mental processes. Spiruduso and Clifford (1978) found
an exception to this generalization, in that physically
active older men (age 50-70) had both faster reaction
times than their age cohorts, who were sedentary, and
reaction times that were comparable to, or better than, those of sedentary college students in their
twenties. As well, physical fitness training of older
adults has produced improved psychomotor reaction times (Spiruduso & MacRae, 1990). These studies
support the contention made by Birren (1974) that
the slowing in mental processing is directly propor- tional to increases in blood pressure, regardless of age. That is, people with higher blood pressure tend to
respond slower than those with lower blood pressure.
Alcohol Although few studies in the alcohol literature have
included an age variable in their research designs,
alcohol has been demonstrated to increase the perfor-
mance decrements of older aged subjects in our labo- ratory (Collins & Mertens, 1991). Other studies have
also indicated that alcohol has a more profound effect
on older individuals (Linnoila, Erwin, Ramm, and Cleveland, 1980; Morrow, Leirer, and Yesavage, 1990).
Collins and Mertens (1991) demonstrated an
age by alcohol interactive effect in their study of
two groups of male subjects, ages 30-39 and 60-69
years old using a multi-task instrument. Subjects
attained mean peak blood alcohol concentrations
(BACs) of .088%. Older age subjects performed
more poorly under alcohol conditions than did the
younger age group on all but one task presented.
They also exhibited more performance decrements
under high work load demand than did the younger subjects.

In a study comparing men, all light to moderate
drinkers, of age 25 to 30 with those 35 to 40 years old,
at BACs of .05, .08, and .12%, Linnoila et al. (1980)
demonstrated significant age and alcohol effects but
no significant age by alcohol interaction (p< .057).
With only 10 subjects per group they believed the
study lacked sufficient power to demonstrate a signifi-
cant interaction. Since their age by alcohol interaction trend was strong (p< .057), t-tests were performed between the two groups and yielded a significant
difference in performance at placebo, .05, and .08% BACs. They concluded that "age and alcohol have a
deleterious synergistic effect on tracking performance"
(p.494). Morrow et al. (1990) tested non alcoholic social
drinking male pilots to determine if age and alcohol
would produce significant impairment differences
between older subjects (mean age 42.1) and younger
subjects (mean age 25.3) at .04 and .10% BAC,
during simulator flights. The results of that study
indicated that some aspects of performance (e.g.,
heading errors) did not appear to be significantly
impacted by alcohol; however, there was an increase in altitude errors and in a combined-variable sum-
mary score for performance errors. These differences
were more prominent for older subjects. In a later study, Morrow, Yesavage, Leirier, Dolhert, Taylor,
and Tinkenberg (1993) failed to replicate the age
related differences in performance. Of particular interest were the effects of low doses
of alcohol and their interaction with age. The eight-
hour "bottle to throttle" rule has long governed be-
havior of the general aviation pilot with respect to
alcohol consumption and flying. In 1985, Part 91 of
the Federal Air Regulations (FAR) was modified to
include a rule that no one could act or attempt to act
as an air crew member with a blood alcohol concentra-
tion of 0.04% or higher. A year later, the regulation
was modified to include an "implied consent" provi- sion, under which the crew member is required to
submit to an alcohol test when requested by a law enforcement official. One possible shortcoming of
this regulation is that it may imply to some pilots that it is safe to fly with a BAC that is not higher than 0.04%. Despite the existence of these regulations, a
recent postmortem inquiry found that 9.8% of gen-
eral aviation fatal accidents during 1993 involved
pilots with a BAC of 0.04% or higher (personal
communication with Dr. Dennis V. Canfield, Toxi-
cology and Accident Research Laboratory of the Civil
Aeromedical Institute, Oklahoma City, Oklahoma).
The National Transportation Safety Board, in their
review of the accident statistics, "...believes that the
presence of any alcohol in a pilot's blood jeopardizes safety" (p. 2, in Ross, 1988). These observations and conclusions raise a number of questions concerning the effects of low levels of alcohol on performance in
flight and the potential efficacy of the existing regula-
tion. In a review of the literature concerning the effects
of alcohol on driving-related behavior Moskowitz and
Robinson (1988), report that behavioral skills impair-
ment was observed in 158 out of the 177 studies. Of
those studies, 35 reported that impairment was de-
tected at BACs of 0.04% or less. After grouping the
studies into nine behavioral skills categories (i.e.,
reaction time, tracking, concentrated attention, di-
vided attention, information processing, visual func-
tions, perception, psychomotor skills, and driving)
the authors concluded that impairment would first be
noted on divided attention tasks and then on tracking
performance. Vigilance appeared to be least likely to
be affected by low to moderate levels of alcohol. An updated review of the literature (Holloway, 1994)
provides additional support to those conclusions.
Billings, Wick, Gerke, and Chase (1972) were the
first to determine the effects of alcohol on pilot
performance during an actual flight in a Cessna 172.
They demonstrated that when pilots flew under the
influence of a BAC of 0.04%, a significant increase in
"major" procedural errors was found. Other aspects of
pilot performance did not show any significant per-
formance decrements. At about the same time, Gilson,
Schroeder, Collins, and Guedry (1971) found that
performance on a localizer/glide slope tracking task,
administered during angular motion, resulted in a significant performance decrement at an average BAC as low as 0.027%, under the lower of two levels of instrument illumination. Ross and Mundt (1986) assessed the effects of alcohol (0.04% BAC) on the simulator performance of pilots and non-pilots dur-
ing straight and level flight and during an unusual

attitude flight segment where attention was diverted
by other tasks. Alcohol significantly impaired perfor- mance on some tasks and this impairment was most
evident in recovery from unusual attitudes.
In a recent study using four air carrier crew mem-
bers, Billings, Demosthenes, White, and Ohara (1991)
found that their classification of "serious" errors, but
not the overall number of errors, increased signifi-
cantly at a BAC of 0.025% when compared to baseline.
However, at the 0.05% BAC level, both the serious
errors and the overall number of errors were below
those obtained at the 0.025% BAC level. Most re- cently, Ross, Yeazel, and Chau (1992), using several
different simulator profiles, found that low BACs did affect some aspects of pilot performance. The effects were observed most frequently under the heaviest workload conditions. They also reported that, while subjects reported mental and physical effects of alco-
hol, they were still able to carry out a majority of the
flight tasks without significant alcohol-related im-
pairment. As mentioned earlier, Morrow et al. (1990) also assessed the effects of low BACs on pilot perfor-
mance during simulator flights and found that some
aspects of performance did not appear to be signifi-
cantly impacted, but there was an increase in altitude
errors and in the combined-variable summary scores.
It is understood from this brief review of the
alcohol literature that the tasks most often affected by alcohol ingestion require, in part, the component abilities of divided attention and multiple tasking. As
the first of a series of investigations into the effects of
low levels of alcohol, simplified cognitive tests were
selected for this study as representing some of the
basic parameters of performance in an operational
aviation environment. Several tests comprising the
recently developed COGSCREEN Battery (Horst &
Kay, 1991a; 1991b; Kane & Kay, 1992) possess these
qualities. During the development of this test battery for clinical purposes, two of several design goals were
"...comprehensiveness with respect to range of cogni-
tive functions assessed..." and the "...inclusion of
tasks assessing cognitive abilities required for aviation
safety..." (Kane and Kay, 1992, p.55). Hence, the
component measures of divided and shifting atten-
tion, and combined tracking were of particular interest.
Previous findings illustrate that, on selected tasks,
both age and alcohol can significantly impair perfor-
mance. However, the potential interaction of those
two factors is less clearly understood. This study was,
therefore, designed to determine the effects of age and
interactive effects of age and alcohol on cognitive
functioning. Further, because a study by Obitz,
Rhodes, and Creel (1977) indicated that a high level
of subject attention (and perhaps motivation) could
be maintained with monetary incentives, and that
incentives could affect task performance even under alcohol conditions, an incentive condition was also
included in this study.
METHOD
Subjects. A total of 61 men and 11 women were
selected for this study- a gender ratio approximating that present in the general aviation pilot community.
All subjects were screened with the Cahalan, Cisin,
and Crossley (1967) Quality-Frequency-Variability Index to ensure that their drinking patterns con-
formed to that of "moderate" drinkers. Subjects were
also screened to confirm that they were not taking
drugs (over-the-counter, prescribed, or illicit) before
or during the experiment. They were also instructed
not to consume any alcoholic beverages (including
beer and wine) on the day prior to participating in the
experiment or during the test days.
Forty-eight subjects were offered "bonus" money,
in addition to the sum that they were earning by
participating in the study, as an incentive to maintain-
ing a high level of performance. Each was offered a
monetary reward of $8.00 per session if his/her per-
formance on the pre-drinking session and the three
post-drinking sessions exceeded that obtained in the
last training session (held the previous day) on at least five of the measures that were being examined.
Table 1 shows the number of subjects selected for
each condition and group. Three experimental alco-
hol/incentive groups comprised 12 subjects each in 3
age categories (27-32, 42-47, and 57-62 years). The
mean age for each group was 29.8, 43.5, and 58.8
years old, respectively. Four subjects in each age cat-
egory comprised the control/incentive groups (ingesting
the placebo drink mixture). The alcohol/non-incentive

Table 1. The number of subjects assigned to each experimental condition by age group.
CONDITION
ALCOHOL/INCENTIVE CONTROL/INCENTIVE
ALCOHOL/NON-INCENTIVE CONTROL/NON-INCENTIVE
AGE GROUP YOUNGER MIDDLE OLDER
12 12 12 4 4 4
4 4
4 4
4 4
Total
Total 36 12
12 11 72
and the control/non-incentive groups were comprised
of four subjects in each age category. The control
group's mean age was 44.1. One female subject was
assigned to each conditional group, except for the
older, alcohol/non-incentive group. Cognitive Tests. The COGSCREEN test battery
was developed by the Advanced Resource Develop-
ment Corporation (ARD) and the Georgetown Uni-
versity School of Medicine in response to an FAA
request for an automated test battery to detect subtle
clinical changes in the cognitive function of pilots.
The battery runs on a standard IBM PC-AT or com-
patible, under the DOS operating system, and uses a
light pen as the primary input device for all tests
except tracking, which uses the arrow keys on the
standard keyboard (Horst & Kay, 1991a; 1991b). Nine of the tests from the COGSCREEN test battery
were selected for this study. The tests were always
presented in the same order. Brief descriptions of the
nine tests are in Appendix A. A list of the variables measured and the types of data collected for each test
are shown in Table 2. Breath Alcohol Measurements. Breath Alcohol
(BrAC) measurements provide rapid, inexpensive,
and reliable assessment of an individual's alcohol
level. BrACs are measured in terms of grams per 210
liters of air and provide readings that the legal and
scientific communities consider representative of
measures reported for blood alcohol concentration
(BAC). BrACs were measured in the laboratory using
a CMI, Inc. Intoxilyzer 5000, which measures a breath
sample and reports its corresponding BrAC within 90
seconds.
Alcohol Condition. Subjects were instructed to
pace their drinking so that they would consume one
drink every seven and one half minutes. Each subject
in the alcohol condition was given 1.62 milliliters
(ml) of 80 proof vodka per kilogram of body weight
(.505 g/kg), in two drinks mixed with orange juice
and two ounces of crushed ice. This amount was
derived by multiplying the Moskowitz, Burns, and
Williams (1985) formula by 1.15, after adjusting for using 80 proof vodka. There were a few subjects who
did not reach the desired level using this formula, in
which case they were given a "booster" drink of 0.034
ml per kg of body weight (.011 g/kg)- a modification
of the Lentz and Rundell (1976) formula, corrected
for using 80 proof instead of 95% alcohol content.
Control (Placebo) Condition. In the control con-
dition (four persons in each age category), subjects were given two drinks of orange juice and crushed ice
with 5 ml of vodka floating at the top of each drink.
As such, subjects could detect the odor and perhaps a
slight taste of the vodka without ingesting enough
alcohol to raise BrACs above the Intoxilyzer's "noise"
level
PROCEDURE
Four experimental sessions were conducted during
the afternoon on each of two consecutive days. On the
first day, subjects were given a brief explanation of the
purpose of the study, followed by a general overview
of the computer tests involved. They then read and
signed a consent form, were weighed, given a
breathalyzer test, and participated in an initial

Table 2. CogScreen test variables and performance measures— mean reaction time (MRT), number (#) correct, and average absolute error (AAE) listed by test.
TEST
BÄCKWARD DIGIT SPAN
VISUAL SEQUENCE COMPARISON
SYMBOL-DIGIT CODING
SYMBOL-DIGIT IMMEDIATE RECALL
SYMBOL-DIGIT DELAYED RECALL
MATCHING TO SAMPLE
DIVIDED ATTENTION
SHIFTING ATTENTION
DUAL TASKING coordination, visual
TEST VARIABLES
PERFORMANCE MEASURE
attention, short term memory, verbal sequential processing
# Correct
working memory, attention, sequencing ability
# Correct MRT
working memory, attention, verbal sequencing ability
# Correct MRT
short term memory recall
# Correct MRT
long term memory recall
# Correct MRT
visual short term memory, attention
# Correct MRT
divided attention, visual motor ability, working memory
attention, visual discrimination, concept formation, rules application
fine motor speed & # Previous Numbers spatial, verbal- sequential processing, working memory, divided attention
Single Task # Correct MRT Dual Task # Correct MRT # Premature Responses
# Correct MRT # Lost Rules
Tracking Error
Correct MRT
Dual Task # Correct MRT AAE

computer testing session with detailed instructions.
The initial session was a self-paced practice session
that ran from 30 to 45 minutes in length. Subjects
were allowed to ask questions during and following
the initial session, but proceeded on their own after
that session. The subsequent computerized test ses- sions, which did not include detailed instructions, were also self-paced, and took approximately 30 min- utes each to complete. Each of the four sessions
conducted on Day 1 was followed by a 15-minute
break, during which subjects could read magazines,
watch television, or just relax quietly.
All responses to the tests were made through touch-
ing the CRT screen with a signal light pen, with the
exception of the tracking task, which involved using
the right and left arrow keys on the keyboard. Audi-
tory (error) feedback occurred during the last three
tests. Data were verified after each computer session
to assess learning, check the programs, and determine
if the incentive subjects were to receive additional
"bonus" money. Following the fourth session, subjects were in-
structed to return the next day at the same time. They were to eat a moderately sized lunch approximately 30
minutes prior to their arrival. They were also re-
minded not to consume any alcoholic beverages or
medications during that evening.
On the second day, subjects took a baseline breatha-
lyzer test upon arrival to assure their 0.00 BrAC status
and then completed the first (baseline) computerized
test session. After the baseline session, subjects were
given 15 minutes to consume each of two drinks. Since blood alcohol levels are known to drop at the
rate of approximately 0.004 every 15 minutes (Dubowski, 1985), and since the computer sessions were approximately 30 minutes in length, subject BrACs going into each testing session were 0.004
higher than the experimentally targeted BrACs of
0.04, 0.027, and 0.0135% in an attempt to have the target value be the average of each session.
Fifteen minutes after the second drink, the
breathalyzer tests were resumed until the subjects had
reached their BrAC peaks, and had then dropped to
0.044% BrAC on the descending limb of their blood
alcohol curves. The first of three post-drinking test sessions was then conducted, after which a breathalyzer
measure was obtained to permit the calculation of
average BrAC of each subject during that test session.
Breathalyzer tests continued until 0.031 was reached,
and the second post-drinking session was conducted,
again followed by breathalyzer tests until 0.018 was
reached, when the subjects were given the final post- drinking session. After the final post-drinking test
session, BrACs were determined periodically until a 0.00 level was reached. Subjects were allowed to leave
the testing site shortly thereafter. Design and Analysis. Two designs were used in
this study. Control group subjects (N=24) in the three
age groups were compared on the baseline session and
all post-baseline sessions, while the Alcohol subjects
(N=36) in the three age groups were compared on the
baseline session and all alcohol condition to assess the
effects of age on performance. Then, each of the three
age groups of alcohol subjects was compared across
the (pre-drinking) baseline session and three alcohol conditions to the mixed age control group (ingesting a placebo mixture throughout), to assess the effects of
blood alcohol levels.
RESULTS
Prior to analysis, all measures were examined
through various SPSS programs for accuracy of data
entry, missing values, and fit between data distribu-
tion and the assumptions of multivariate analysis.
Missing values were replaced with cell means accord-
ing to acceptable statistical procedures (Tabachnick
& Fidell, 1989). Outliers, those scores falling three standard deviations above or below the mean, oc- curred less than 1% of the time and were also replaced
with cell means. No casewise deletion of scores was
necessary after these procedures. The incentive vs. non-incentive condition com-
parisons showed no significant differences between
groups. A decision was made to pool data. However,
during data acquisition, several computer failures
occurred with the non-incentive alcohol group.
Though these subjects were rerun at the time of the
failures, their data were excluded from the overall
analysis, obviating the pooling of data across alcohol groups; however, data from the control/non-incen-
tive group were combined with the control/incentive
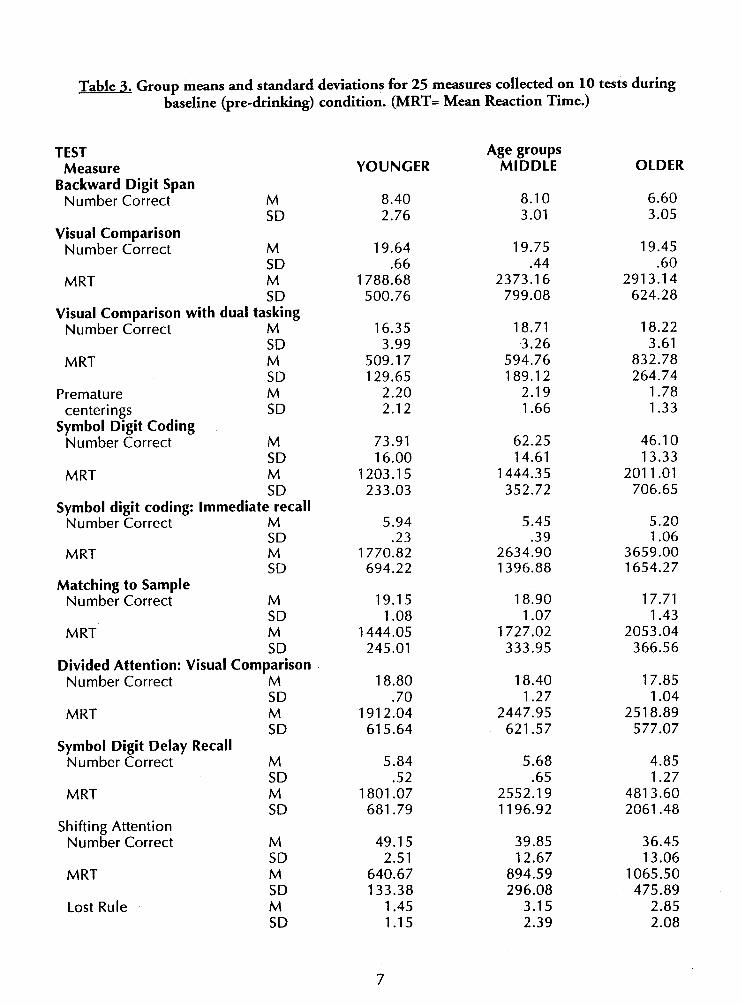
Table 3. Group means and standard deviations for 25 measures collected on 10 tests during baseline (pre -drinking) condition. (MRT= Mean Reaction Time.)
TEST Age groups Measure YOUNGER MIDDLE OLDER
Backward Digit Span Number Correct M 8.40 8.10 6.60
SD 2.76 3.01 3.05 Visual Comparison
Number Correct M 19.64 19.75 19.45 SD .66 .44 .60
MRT M 1788.68 2373.16 2913.14 SD 500.76 799.08 624.28
Visual Comparison with dual tasking Number Correct M 16.35 18.71 18.22
SD 3.99 3.26 3.61 MRT M 509.17 594.76 832.78
SD 129.65 189.12 264.74 Premature M 2.20 2.19 1.78
centerings SD 2.12 1.66 1.33 Symbol Digit Coding
Number Correct M 73.91 62.25 46.10 SD 16.00 14.61 13.33
MRT M 1203.15 1444.35 2011.01 SD 233.03 352.72 706.65
Symbol digit coding: Immediate recall Number Correct M 5.94 5.45 5.20
SD .23 .39 1.06 MRT M 1770.82 2634.90 3659.00
SD 694.22 1396.88 1654.27 Matching to Sample
Number Correct M 19.15 18.90 17.71 SD 1.08 1.07 1.43
MRT M 1444.05 1727.02 2053.04 SD 245.01 333.95 366.56
Divided Attention: Visual Comparison Number Correct M 18.80 18.40 17.85
SD .70 1.27 1.04 MRT M 1912.04 2447.95 2518.89
SD 615.64 621.57 577.07 Symbol Digit Delay Recall
Number Correct M 5.84 5.68 4.85 SD .52 .65 1.27
MRT M 1801.07 2552.19 4813.60 SD 681.79 1196.92 2061.48
Shifting Attention Number Correct M 49.15 39.85 36.45
SD 2.51 12.67 13.06 MRT M 640.67 894.59 1065.50
SD 133.38 296.08 475.89 Lost Rule M 1.45 3.15 2.85
SD 1.15 2.39 2.08
7

Table 3 (Con't). Group means and standard deviations for 25 measures collected on 10 tests during baseline (pre-drinking) condition. (MRT= Mean Reaction Time.)
TEST Age groups Measure YOUNGER MIDDLE OLDER
Single Task Tracking Alone Ave. Absolute Error M 14.81 15.09 22.80
O
SD 12.70 12.88 19.89 Previous Numbers Alone Number Correct M 39.85 33.65 29.85
SD 6.02 5.43 6.75 MRT M 384.56 583.63 629.34
SD 218.15 190.76 171.12
Dual Task: Tracking with Previous Number Recognition Tracking Ave. Absolute ErrorM 38.63 56.00 77.91
o SD 23.79 28.08 19.16
Previous Number Recogn tion Number Correct M 32.30 25.95 20.80
SD 8.27 6.37 6.49
MRT M 561.35 757.22 876.68 SD 278.04 208.88 212.58
group. As a result, a total of 60 cases was used in the
final overall analysis (36 alcohol subjects and 24
control subjects). Age Differences. Three categories of age—younger,
middle, and older with 20 subjects in each group were
compared in a multivariate analysis of variance
(MANOVA) with SPSS for the 25 measures listed in
Table 2. The results of the MANOVA yielded a significant difference on 20 of the 25 baseline mea- sures. The means and standard deviations for all 25
measures are listed in Table 3, and a summary of the MANOVA is presented in Table 4.
Posthoc tests using Tukey's Honestly Significant
Differences (HSD) were performed on the 20 signifi-
cant measures identified from the MANOVA. Results
from the HSD tests are presented in Table 5.
The HSD results show that of the 20 measures
identified as significant by the MANOVA, significant
mean differences (p. <.05) were found on all baseline measures between the younger and older age groups,
with the younger group means being lower on MRT
and higher on number correct. The mean number of
lost rules on the shifting attention task was also lower for the younger age group. The means of the younger

Table 4. MANOVA results grouped by test measures at the baseline session for all subjects. (MRT= Mean Reaction Time.)
Test Measure MS Error
Backward Digit Span Number Correct 8.66
Visual Comparison Number Correct .34 MRT 426335.23
Visual Comparison with Dual Tasking Number Correct 12.42 MRT 40886.57 Premature Centerings 3.01
Symbol Digit Coding Number Correct 215.89 MRT 226023.08
Symbol Digit Immediate Recall Number Correct .65 MRT 1723273.96
Matching to Sample Number Correct 1.46 MRT 101974.06
Divided Attention: Visual Comparison Number Correct 1.06 MRT 366126.84
Symbol Digit Delay Recall Number Correct .76 MRT 2049049.92
Shifting Attention Number Correct 112.49 MRT 110639.77 LostRule 3.79
Single Task Tracking Alone
Avg. Absolute Error 240.87 Previous Numbers Alone
Number Correct 37.12 MRT 37753.06
Dual Task: Tracking with Previous Number Recognition Tracking
Avg. Absolute Error 573.85 Previous Number Recognition
Number Correct 50.36 MRT 55376.73
(d.f.=2,57)
F
2.15
1.37 14.84
2.51 13.75
.39
18.07 15.10
4.32 10.37
8.08 18.21
4.28 6.01
7.33 24.00
7.68 8.25 4.34
1.71
13.73 .90
13.50
13.17 9.15
ß
.126
.261 <.001
.090 <.001
.678
<.001 <.001
.018 <.001
.001 <.001
.018
.004
.001 <.001
.001
.001
.018
.190
<.001 <.001
<.001
<.001 <.001

Table 5. Significant posthoc comparisons results, using Tukey's HSD, for all significant measures listed by test and age group — Younger (Y), Middle (M), and Older (O).
(MRT= Mean Reaction Time.)
Test AGE Measure Younger Middle
Visual Comparison MRT MO OY
Visual Comparison with Dual Tasking MRT O O
Symbol Digit Coding Number Correct MO OY MRT O O
Symbol Digit Immediate Recall Number Correct O Y MRT MO OY
Matching to Sample Number Correct O O MRT MO OY
Divided Attention: Visual Comparison Number Correct O Y MRT MO OY
Symbol Digit Delay Recall Number Correct O O MRT O O
Shifting Attention Number Correct MO Y MRT MO Y Lost Rule MO Y
Single Task Previous Number Recognition Alone
Number Correct MO Y MRT MO Y
Dual Task: Tracking with Previous Number Recognition Tracking Avg. Absolute Error MO OY Previous Number Recognition Number Correct MO OY MRT MO OY
Older
MY
MY
MY MY
MY
MY MY
MY
MY MY
Y Y Y
Y Y
MY
MY MY
10

age group were better on 15 of the 25 measures when
compared to the middle age group. The means for 13 measures for the middle age group were lower on
MRT and higher on number correct when compared
with the older age group. Stability of Age Differences Across Sessions A
MANOVA, using only the 36 alcohol subjects, was
performed, contrasting the baseline and all post-drink-
ing sessions across the three age groups to test for the
stability of age effects across the (alcohol) sessions. As
summarized in Table 6, the MANOVA yielded sig- nificant age effects on 15 of the 25 baseline and 13
(.040%), 11(.027%) and 10 (.014%) of the 25 on the alcohol sessions measures. Of the seven significant
MRT measures at the baseline session, three remained
significant on all of the post drinking trials. The four non significant mean reaction time measures on the
final trial were symbol digit coding immediate recall,
visual comparison, visual comparison with dual task-
ing, and symbol digit coding delayed recall. The mean reaction time for shifting attention decisions showed
significant age effects at all post-drinking sessions, but
no significant age effect at the baseline session. The reduction in the number of significant age main effects for the post-drinking sessions was attributed to
a reduction in the performance levels between the older and younger age groups in 15 of 20 cases. In
most of these cases, the older age subjects improved
performance, whereas, the younger age group demon- strated a performance decrement. The remaining five
were attributed to an elevation of the within-subject
variability. Table 13 in Appendix C displays the
performance measure, non-significant BrAC level
(Post-drinking session), and type of change in perfor-
mance. A MANOVA, using only the 24 control subjects,
was performed comparing the baseline and final non-
alcohol sessions across the three age groups to test for the stability of age effects across the (control) sessions.
These findings showed consistency across sessions. As
summarized in Table 7, the MANOVA yielded sig- nificant age effects on 18 of the 25 measures for each
of the baseline and 3 post-baseline sessions. Of the 10
significant MRT measures at the baseline session, 8 remained significant at all post-drinking sessions. The
2 non-significant mean reaction time measures were
symbol digit coding immediate recall and divided
attention visual comparison. The number of lost rules
for shifting attention decisions and symbol digit delay
recall number correct showed significant age effects at all post-baseline sessions, but no significant age effect
at the baseline session.
Following the analysis of the age-related perfor-
mance data, the subjects were re-configured for the
"age by alcohol" analysis. Three categories of age— younger, middle, and older with 12 subjects in each group— and a control group (N=24) comprised of 8
subjects from each age category, were compared across
the baseline (pre-drinking, 0.00) session and 3 levels
of intoxication— 0.04, 0.027, and 0.014% BrACs in
a doubly repeated MANOVA (Tabachnick and Fidell,
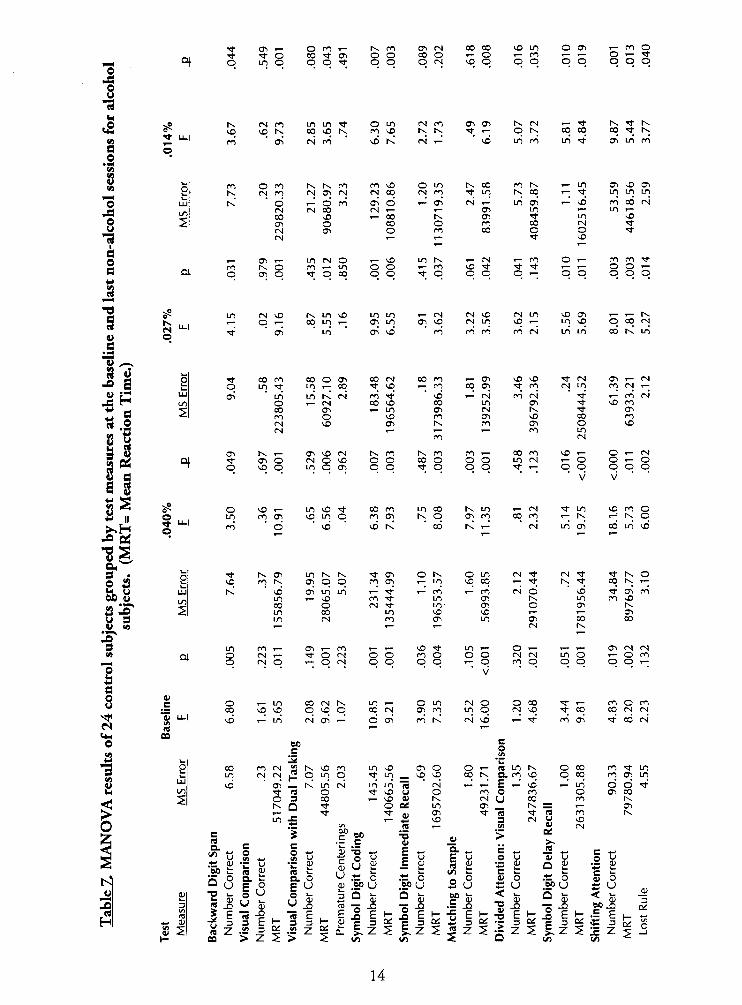
1989) with SPSS. Alcohol/Session Differences A MANOVA, using
the 36 alcohol subjects, was performed across all pre-
and post- drinking sessions to identify measures evi- dencing an alcohol/session effect. The results of the
MANOVA are summarized in Table 8.
Three of the 13 significant main effects for the alcohol/session variable posthoc analysis revealed sig-
nificant mean differences in the direction that sug- gests an alcohol pattern: dual task previous numbers
MRT, symbol digit delay recall correct, and visual
comparison MRT with dual tasking. These measures
are also those which demonstrated a significant age by
session interaction, and the posthoc analysis are dis-
cussed in more detail in the next section.
Alcohol and the Alcohol/Session interaction The
results of the MANOVA indicated that significant age
by alcohol session interactions were obtained only for
three measures; performance means and standard de-
viations for those measures are presented in Tables 9-
11. The interaction effects included the mean reaction
time (MRT) of both the dual task previous numbers
(F699=2.39, p.=.0l4), and the symbol-digit delayed
recall (Ffi99=2.04, p_=.038) task, and the number cor-
rect measure for the symbol-digit delayed recall task
(F699=2.90, p_=.003). The divided attention visual comparison MRT measure showed a borderline non-
significant effect with a trend similar to the dual task MRT measure.
11

hl
Ql tx 01 vß (N IN t PO PO 01 vß vß 00 t- vß «fr ro Ix PO co PO «fr LO ix Lo <— O O 01 IX «fr O o «fr PO 00 PO »— oi "fr LO O r- O «fr o o T- «fr r- O o «fr tN tx o o o
a .2
S3 I«
5? "* u_l
LO 00
T- LO «fr r-
LO «fr O 00 PM 01
Ix PO tx 01
O vß ix tx
«fr PO O LO
T- 00 oi tx
PM tx LO «fr
LO PM O vß O LO
PO i— PO vß vß >- (N LO 00 T- (N PO LO PM
-5
o
O u
a
LO PO T— vß o 01 LO «fr LO «fr PO o LO PO 01 vß «fr 01 PM 01 o <N PM K o Iß 01 01
00 vß LO O ,_ "fr Ix r— CN *— PO i— (N O ,— vO 00 o PO 01 LO O LO ,— 00 00 PM LO «fr «fr «fr 00 (N IX PO 01 (N PO O PO Öl " tx
o O oi «fr LO Öl o ,_ IX 01 oo 01 ,_ PM OI LO 00 «fr r— o ^ o «fr o vß PO «fr tx PO vß o 00 «fr o o o co o o o «- vß
O PO PO 00 Ix oi 00 "fr o vß «fr PM 01 tx PO oo PM vß 00 PO o vß T—
""* PO PM ,_ 01 r— o PO oi r— o o o
.g Ix u. M o
» w 8 9 «H o
1_
f s LU
«*6 2
S 51 S* ^ 5 a d u
$£ äS
b* S"-i q
w .
p u L- 0
6b 2* k-
ö 3 LO U _H 5 " 0 ^-s s S <e _y
■s"3 Ql J3 o u
13 01 c \D tr> 01 U-l
<*- « 0 Cfi
ö "3 1_
8 0
bi LU
£ to
5 o
ix 01
PO »— «fr vß
IX O PO .- oi «fr
00 OI PO T—
IX PO T- «fr
>- 01 Vß LO
00 O O "fr
IX "fr "fr PO
M lO N 00 OO LO
PM LO LO 00 LO (N PO tN M (N IX PO PS
,_ ^ß K 01 ,-. "fr r^I T— "fr PM tN PO o 00 vO IX co PM Ix LO 00 "fr "fr "fr Ix vß "t PS LO vß 00 PM o *— T— vß PM »— ,_ 00 o PO (N PM T— 01 PM LO PM IX r- vß tx *— PM
P-4 o fx "fr
rj PO
5 "f
IX PM
LO Vß o C0
Pvl "fr o 01 rx
LO 01 PNI
01
IX LO
tN tx
00 O "fr PO 01 "fr
00 PO
LO
T—
01 00 00 OI K (N "fr rs| PO ^ o 00 vß ro PO O PM r— r-j ■* rv| IX r^ r— 01 o IX 01 O n o PO ^ r— ^— O IX tx 01 O (N LO O O o O "-; O o r— Y— o o o O O
PO PO
vß 00 O OI
PO LO O PO vß vß
Vß IX LO vß
LO PO 00 IX
CO IX LO ■*
00 PM PO >—
Vß 00 01 01
vß tx PM 01
IX 00
PO r- "fr PM vß PM T- O "fr PM PM «fr "fr LO vß PM
j— O 00 IX vO vß IX "fr vß 01 PO ,— r— 00 tN PM 01 PM 00 PM LO PM t— vß r— vß LO 00 PO PM LO o vß PO LO 1— *— LO
IX ,_ Ix PO PO LO ,— PO ,— PO PM 01 ,_ PM o ,— "fr PM ,— 01 01 00 tN PM LO "fr LO 00 PO PO PM IX 00 i— LO PM 01 PM CO vß r— PO vß 00 t—
C0 vß O "fr LO 01 "fr vß "fr PM
"fr *" vß co PM
PO 01 , t— PO LO r— PO vT! PO LO PM 01 IX LO O "fr PM 00 LO PM O C0 o vß o O O PO o O LO T— T— o PM O ^~ tx vß o PM o 01 o o *-. O o o o "-; o o o "" o
00 PM
"fr CO
c (5 a.
LO
K vß "fr "fr
u £ vU 00 t ~ o
01 vß tx PO 01 PM
T- LO "fr o
IX PO
O T- PO 01
01 00 O PM
c 'S.
PM "2 ix PM ,« - PM vß IX « 1— vß = s° "fr -C
_ vß LO PO
o 00 PM
PO "fr Ix' tx PM
7- r- CO C0 _ vß PM
po m tx U LO U o ec po a
IX PM vß PO 01 IX
PO O
c o
(B tx a. oi E • o u
vß vß
00
PM tx 00 PO
PM PO vß 00
"fr «
ra
H
U
-Q
"5 £
a. o
JE« u
es
U
c S tJ
D. O E u
fc "5 E 2 .2 z
■Ji 5 U
<"> S O a; ,B0 (J
3 *Q
E - 2-
r- E
01
ä E
ä 5
r-llr-
£ t3 C/l t
O U .. ^ •«= £ to t et £ u c u &0 *" ^ v- C 0) _ 0)
I is| I « 7 5 .2 7 "5 ^- -^ X 1^
01 = i- (8 vß U "fr 4)
Ol ü
IX IX 01 tx
vß LO "fr T- "fr LO
"fr PM "fr
tX vß LO 00 LO Y—
oi Ix PO PM PO r- "fr
"fr PO
c o
o< o
<
Ä o M(J „
r- J EH.E EH«
in tn
12

I-
c #o *(«
S3 (A
a
2' 5
CN CN CTi CO O O ro O O
ro TT O CO o o
ro CN
CM <T> IX CO VO
IX LO LO IX CN
Ql
Ti- CO CO (N IX Ti- vo o co (N en
ro f vO O O vo vo CN (N tx Tf vO
CO
(N
tx ix cn Ti-
CN CTl CO ro O O tx o cs C^ O O o o o
K u_| CN O
tx o CO in
IX Ix
O •"t
■6 .3 *J H rt d 8 Ix
0
0 a a "4 U PJ
4-1 9 s >s
.a u a ^ s 0 Ul 60 Ö Ö u
1> u V .a
J5" d a
0 0
us o o u •a
"3 VO m (41 0
Ö *3 8 hi
<t- > 0
vo
.a
a
o
Ql
CO
ffi Tf O O-i t ro O CO vO ro o Ix
Ix ro Ix O IX vo in CO ro ro Tj- 01
LO vO LO O-i ro
LO IX ro O vD ro vO o o O O O O o o O
00 Cn vO
O O
LO (N ■* tx
CN ro ro O co co
Tt- •<r ,_ ro ro t—
O IX Tl- O *— CN T— LO o oo j— CO LO Tt" LO ■«I- Tf CN (N cn
o LO
LO O tx ro
ro IN IN vO O <N O i— CN o 00 oo o o O o O
o O CN IX en CN CN CO CN CN T— IX
CO <- 0)
I-
co CO o cn CO CN CN LO ■>t en c o
IX q vo CN vO O *—' en vO ro ro T— Tt- CN CN
01 c 0
Tt-
ro
K 'c DO O U
co tx Tf
o < L-. 0 L_
OJ
1_ £ 4-1 v_ ^J
LU cu u LU 0) u cu a -Q OJ a; -Q E
*^ c o <
3 o
E z
o u 3 o Ul
E 3 Z
0 U
CA DO < </) aj -* DO -Q < t/i cD re 1- cu
c 3 -D CA C 3 -Q 1* u ob >
o "> E
3 r-
re u oo >
o > E
3 r-
60 re < a z 2 "is ro < 0) Z 2 C H ct 3 r- it
5/5 Q
13
o o u
-a
a o
8 «0
"o
8 -a
i a o d
°f *t 01 ,_ o ro ,— IX ro 01 (N CO CO ~s> in Tf ■<r o CO ■* cji O O CO O r— o i- rO o in o o o ■* o O O CN *r> o o O
o en
rt u_|
O
ai
Ix CN o
i— oi O O T- Tf O O O
Ix CN ro \o rx
m in Tf CO v£> IX
O in ro ^0
CN ro tx ix
01 01 IX (N O IX CO CO
ix ■* ix 00 -fr Ix
PI 01 (N ro iß Ix <N ,- \0 in ro in ■* oi m ro
ro o ro IX Ix ro ro * o in ix CO HI Ix r- in 01 U3 01 IX (N ro (N 01 CN <N CO (N rO ■t in ix CO *— ■* in in m
IX o ,_ o ro 01 o T— 01 CN r— in 01 r~ vo ro co CN (N (N CO (N r— T— 01 m r— m r— CO ^o i— CO Ix 01 ■* m vO 01 n CO o ro CO CN ■*
(N w o <*) CO o O Ti- CN
,— Tf O
,_ 01 r^m m (N o , *£> in Ix , CN ,_ ro o ,_ m ro •f ro IX O ro (— m O O r— ro ^0 -<t ■* ■>t ^ i— o ü i—
q 01 o •* O co o O ■* O o O o o o o o O
in (N vD iv. in vß m in (N (N vO CN in vO 01 tx O CO in 01 in 01 V0 (N in vO r— m •£> o CO <N
•* 01 in 01 y3 ro ro ro ro CN in in co tx in
°f
Tt- CO ro CO o 01 CO CN CO m ,_ 01 o KD ^J- (N 01 T— CN o in ■«t m CO Tf v£> r— m CO 01 ■<*• m tN in rr, CN i—
01 in in K (N ro Tt" O ,— CN m HI t T— m CN o CN CO O CO in 01 t vD m CO 01 *— in 01 (N n. ■f 01 ro O o m 01 VO CO m CN v.0 01 K m 01 o v£> CN ,—
m * m in
CN
Ol ix ^ Ol v£> CN IX m K m m , CO m ^£) ,_ O ,_ CN Tf 01 O CN O >£> O o CO O c> o m (N T— o O r— O o * o in O 01 o o t O o o T ^ o o O o O
5 «-I o
o in m oi
m iß * vO ifl o
co m m oi
m co i\ o
K in oi rn IN! t-^
T- CN co m
■* in vO rn i—' 1^
n oo
CU
o ■* IX 01 m K K -t 01 o r-x o m CN ^r CN f Tf fx o vO rn i\ 01 q q rn 01 »-^ in q CO T-; TI- IX ■* q IX T-;
LU M! vd oi t-ri ui ,—' •*' r-^ en ,-! rö CN CS O ■* oi oi in vO ro •<r in 01 rv in m <D CO o (N t in 01 o 01 rx in CO in o O »— *— 01 in CN ro 01 in 01 CO CO ,— "" CN IX
m ro ,__ 01 , ro ,_ ,„ O ■«t in r_ O , ^_ ,-. 01 CN CN a o CN ^~ ■* o CN o O m o o o CN CN in O T— o ro ,
q CN o o CN o o o o ■
o V
m O o O o o
o in CO CN K in o m CN o o CO Ti- ro o ro CO 5 o q vq q cq CN 01 m in q CN VO •>t oö CO CN CN
u_ vO in
60 C
CN oi d oi rn K CN o
c 0 CA
•*' oi oi Tf CO CN
i_ 12 "C o CO Ol CN V] C8 1-
l\ ^c m m o 01 O o i— IS m l\ o CO ro ■* in
LU in CN CN
01
q in
in
q CN ui
in
in CS
q q CN
°°. fs a. m E -
q q CO
in
ro
O
q d
in
in T "c5 o "* o u o m o P0 o Oi CO s o 3 CO ^r> cu l-v CN u CO oi IX K D ^f o C£ in ai ix za i— 01 I»- ■* ■t cu 01 ^i- "is •* is ro fx in X vO 3 CN u iß
+■* c/l /* ,— CA CU CN C
a. *~* c o
c o
00 c 60
C cu
E 4—'
CU
a. 4^
> 4^
CS 4—' c
V V) , , « u o o E u E C8
u _o u cu u o U *^ cu *c u *£! 82 c CD U 82 82 cu "^ 4) Q OJ
i*-< CU
&Q 1_ (0 ifl i» U L_ t/3 k_ c L_ I— c L_
5 o o. k_ O. o ♦^ o *^ o O o cu o *^ o cu o u E o E u 82 'eb U '5b u U *•* u "eb u u
_eu
3 CM
0) ■a
CS ai
o U
u o U
1_
01 -Q
3 5 "S
E in
1) 5 "5 .a E
0) ^2
60
J3
< ■a -O
5 "5
E 1/5
5 60 JD
CO
0)
2 i u CS
ee
E
z >
J3
E z
CM
2
"cs 3 in
>
E z
r- E <u 0.
E 3 Z 2
E 3 z
CM
2
IE u
CS
E 3 Z
1-
2
cu ■o
■>
5 E 3 z
r- CM
2 E 3 Z
CM
IE t/5
E 3 Z
l-
2
4^
o
14

°f
ro IN.
o o o o o
o o
(N i- o o o o
IN i— m •* vO 00 Cn \o i- 01 <N r-
CN vo CO ■* CN ■* •* Ln *— in •* o cn 1- IN. LT) CN IN IT) (N |N. CO IT) (N ■* vD
ro ro
■* en co ro
IN. (N 00 o-i O CO o O (N o T— r- o o O o o
Ql
CN O
o (N
i- O CO CN
IN CN cn K K
°\
CN o ro (N t CN •* (N LTl ro Tf cn IN. m rx IN. cn t ro ro CN CN CN cn CN LT) \0
IN. ro
IN.
o ro t o O O O o T— o o O O o
V V
o CO T- *£> ro cn
oo in ro O
-~ cn IN. ro Tf i- CN
Ql
re ea
IN.
CN
O
CN IT)
CO T- O VO
in m in IN. i— ro ro *t
CN cn r- ■* o o
CN t- LT1 LT)
c 60 O u 01 et Im a> .a
3 Z
ro O o IN. in ro
CO CN 00 o •* vO 1— <o CN t—
■"3- t
CN ro CN O o O o o
ro oo
C 0 U
3
CO LO ~£> O o ro T t LO VO ■*
o "i o
O IN. IN. O vO IN. ^0 <t ro Im vo ~ m CN
L. t— i— a. ro cn
CO r CN LT) .c c
00 o
CO ro
5 0 S
t/> CO
v CD
I-
V)
UJ 53 d) U -Q
§ J | oo ^3 ui C < 3
BO C
CD
ü u > > w 2 < £
.S t- a.
u j* LU CIJ u u HI -O ml
L- O u
re u H
3 o
h 3 V
o u rjj J£ on -Q < l/l a) -ft r -J .o E h- (- 'SZ o E 3 u > 3 z :> re
3 G
CO
h- < 01
0. z
k/ CN
sJl-
15

Table 8. MANOVA results of 36 alcohol subjects grouped by test measures across all pre- and post- drinking sessions for the alcohol/session main effect. (MRT= Mean Reaction Time.)
Test Measure MS Error
Backward Digit Span Number Correct 4.76
Visual Comparison Number Correct -46 MRT # 83097.44
Visual Comparison with Dual Tasking .70
24368.86 2.03
52.68 48517.28
.53 1416892.95
1.09 53823.69
Number Correct MRT Premature Centerings
Symbol Digit Coding Number Correct MRT
Symbol Digit Immediate Recall Number Correct MRT
Matching to Sample Number Correct MRT
Divided Attention: Visual Comparison Number Correct 1 -56 MRT 66019.26
Symbol Digit Delay Recall Number Correct -70 MRT 1287347.16
Shifting Attention Number Correct
MRT Lost Rule
Single Task Tracking Alone
Avg. Absolute Error Previous Numbers Alone
Number Correct MRT
36.44 17402.98
1.75
156.83
14.92 14920.26
Dual Task: Tracking with Previous Number Recognition
Tracking Avg. Absolute Error 104.25
Previous Number Recognition Number Correct 13.72 MRT 17269.84
(d.f.=2,33)
.62
2.11 2.88
3.81 9.50 1.1,7
3.35 3.49
3.95 3.26
6.35 9.23
1.16 2.46
3.00 1.07
.26
.23 5.53
.17
2.52 6.11
.89
4.25 7.02
E
.605
.104
.040
.012 <.001
.323
.021
.019
.010
.026
.001 <.001
.326
.067
.038
.362
.856
.870
.001
.915
.063
.001
.448
.007 <.001
16

Table 9. Dual task previous numbers mean reaction time, means and standard deviations (msec.) for three age categories at baseline (.00) and three levels of alcohol intoxication
Age Category .00
Alcohol intoxication level .04 .027 .0135
Younger
Middle
Older
Control
MEAN 498.10 639.60 - 588.69 602.27 SD 146.59 239.54 131.30 180.77
MEAN 524.2 714.14 739.31 706.19 SD 169.88 250.44 264.48 165.97
MEAN 730.78 949.79 882.37 786.45 SD 183.57 291.60 245.04 185.62
MEAN 737.42 694.78 740.27 797.96 SD 279.99 202.28 288.58 306.63
A test for simple effects was performed for each of
the significant interactions. The results of these tests
revealed significant differences for the dual task previ-
ous numbers MRT for both age (F233=3.92 p.=.013) and session (F233=7.02, p_<.001), symbol-digit de-
layed recall MRT for age (F233=2.98, £=.039) only, and symbol-digit delayed recall number correct for
both age (F233=3.00, p_=.038) and session (F233=4.22,
£=.007). ATukey's Honestly Significant Differences (HSD)
test was performed on the cell means for the signifi-
cant simple effects and yielded significant mean dif-
ferences (p<.05) for the dual task previous numbers
MRT, the symbol-digit delayed recall MRT, and number correct measure for the age variable. Simple
effects tests on the session variable produced mean
differences on the symbol digit delay recall MRT and
number correct, and visual comparisons with divided
attention MRT. The results of those tests are ex-
plained below for each measure. Figures 1-3 display each effect, respectively. Figure 4 displays the divided
attention visual comparison MRT trend. For other
trend information, means and standard deviations for
all non significant measures are shown in Table 12 of Appendix B.
The dual task previous numbers MRT measure
yielded significant mean differences during all four
sessions for the age variable and one significant mean
difference for younger age subjects on the sessions
variable (Figure 1). Mean differences were detected at the baseline (pre-drinking) session between the younger
and older age groups, the younger age group and the
control group, the middle and older age groups, and
the middle age group and the control group. Signifi- cant mean differences were demonstrated at the 0.04% session between the older age group and both the younger age group and the control group. The 0.027%
session yielded one significant mean difference, that
between the younger and older age groups. The only
significant mean difference at the 0.0135% intoxica- tion session occurred between the younger age group
and the control group. The only significant mean
difference for the session variable was in the younger
age group between the baseline and the .027% ses- sion, in the direction expected for an alcohol effect.
The symbol-digit delayed recall MRT measure
(Figure 2) showed significant mean differences for the
age variable at the baseline session between the older
and younger age groups, and between the older and
middle age groups, and significant mean differences
on the sessions variable for the younger age group.
17

Table 10. Symbol-digit delayed recall mean reaction time, means and standard deviations (msec.) for three age categories at baseline (.00) and three levels of alcohol intoxication.
Age Category .00
Alcohol intoxication level .04 .027 .0135
Younger
Middle
Older
Control
MEAN 1843.39 SD 654.30
MEAN 2487.00 SD 916.39
MEAN 4553.03 SD 2030.97
MEAN 3197.34 SD 2156.18
2336.13 1137.66
3037.62 1418.57
4470.25 2288.69
3057.45 2152.11
2215.90 2998.53 1177.43 1301.04
2319.10 3089.14 1131.10 1213.85
3978.07 3351.83 3418.90 1320.82
2744.94 3047.42 1853.74 1461.97
Table 11. Symbol-digit delayed recall number correct, means and standard deviations (msec.) for three age categories at baseline (.00) and three levels of alcohol intoxication
Age Category .00
Alcohol intoxication level .04 .027 .0135
Younger MEAN SD
6.00 0.00
5.66 5.70 0.60 0.62
5.52 0.99
Middle MEAN SD
5.54 0.78
4.75 4.83 1.36 1.59
4.67 1.50
Older MEAN SD
5.00 1.12
4.20 5.43 1.34 0.79
5.25 1.14
Control MEAN SD
5.36 1.10
5.54 5.83 1.00 0.48
5.25 1.26

There was a mean difference at the 0.04% session
between only the older and the younger age groups.
The only significant mean difference for the session
variable was for the younger age group between the
baseline and the .014% session, in the direction that suggests an alcohol effect.
The symbol-digit delayed recall correct measure
(Figure 3) yielded significant mean differences for the age variable and the session variable. The significant
mean differences for the age variable were between the
younger and older age groups at both the baseline and
the 0.04% session. The only significant mean differ-
ence for the sessions variable was for the older age
group between the baseline and the .04% session, in
the direction that indicates an alcohol effect.
Posthoc analysis for the Divided Attention Visual
Comparison MRT measure (Figure 4) indicated sig-
nificant mean differences for the age variable and the
session variable. The significant mean differences for
the age variable occurred at both the baseline and the 0.04% session between the younger and the middle
and older age groups. Significant mean differences for
the sessions variable were between the baseline and the 0.04% session for both the older and middle age
groups, in the direction that indicates an alcohol
effect. The younger age group demonstrated a signifi-
cant mean difference between the baseline and the
0.027% session and between the 0.04% and the
0.027% sessions, in the direction of an alcohol effect for the 0.027% session.
(0 T3 C o Ü a> CO
0.00% 0.040% 0.027% 0.014%
Sessions
■e-Younger -e-Middle -*-0lder
Figure 1. Mean reaction time for divided attention dual task compared across pre- and post- drinking sessions by age group.
19

OT ■o c o Ü Q> W
CO T3 C o Ü <D (0
0.00% 0.040% 0.027% 0.014%
Sessions
■B-Younger -e-Middle -*-Older
Figure 2. Mean reaction time for symbol-digit delay recall compared across pre- and post- drinking sessions by age group.
0.00% 0.040% 0.027% 0.014%
Sessions
■a-Younger -e-Middle ■*-Older
Figure 3. Mean reaction time for symbol-digit delay recall number correct compared across pre- and post- drinking sessions by age group.
20

w C o Ü <D V)
3000
2700
2400
2100
1800
1500 0.00% 0.040% 0.027%
Sessions
0.014%
■e-Younger ■©• Middle ■*• Older
Figure 4. Mean reaction time for divided attention visual comparison compared across pre- and post- drinking sessions by age group.
DISCUSSION
These data support the existing literature concern- ing quantitative changes in information processing speed with aging (Cerella, 1985, 1990; Hale et al., 1987; Myerson et al., 1990; Salthouse, 1985, 1991; Myerson & Hale, 1993). There was an increase in mean reaction time across tasks and across the three age groups, supporting the findings of Davies, Taylor,
and Dorn (1992) that an age effect is apparent, to
some extent, across different tasks. Younger age sub- jects in the study performed significantly faster than older age subjects on all of the baseline MRT mea-
sures, and performed significantly faster than the middle age subjects on 70% of the baseline MRT measures. The middle age group was significantly
faster than the older age group on 80% of the MRT
measures. The longer MRTs demonstrated by older subjects
did not enhance their accuracy when compared to the younger age subjects. Younger subjects produced more
accurate (statistically significant) scores on 80% of the
tests that measured MRT and number correct. Our older aged subjects demonstrated increasingly longer reaction times as task complexity increased, thus sup- porting the findings of Lima et al. (1991). Older age subjects also demonstrated more within subject vari- ance as the tasks became more complex. Two tests proved to be particularly troublesome for subjects
over age 40. The shifting attention test required
subjects to identify a rule underlying the presented
stimuli. The "previous number alone" test required subjects to indicate which number (1, 2, or 3) was displayed after another number appeared on the screen.
Younger subjects significantly outperformed both the middle and older subjects on all of the measures for both of these tasks, further supporting Lima et al.
Two potential subjects removed themselves from the experiment on the basis of the computerized nature of the testing process. While unfamiliarity with computers might be perceived as the basis for some of the obtained differences, this seems unlikely,
21

since all tests were administered by computer. Sub-
jects who were computer illiterate were given addi-
tional time to familiarize themselves with the computer
and overcome their fears on the initial training day.
Additionally, the human/computer interaction, with
the exception of the tracking task, was solely with the
light pen. That mode of interaction placed limited demands on subjects relative to their ability to interact
with the computer. In the overall comparison of baseline (pre-drink-
ing) performance of alcohol subjects with perfor- mance on the alcohol measures, the alcohol sessions yielded significant age differences on 52% (.040%),
44% (.027%) and 40% (.014%) of the measures,
whereas the baseline session yielded significant differ-
ences on 60% of the measures. However, the compari-
son of control group subjects yielded a significant
difference on 72% of the measures for the baseline and
all post-baseline sessions. This finding suggests that
the alcohol sessions altered (reduced) the pattern of performance differences between age groups, in a way that control sessions did not. The drop in significant age differences on these sessions for alcohol subjects can be attributed to a constriction in the range of scores on the measures between the older and younger age alcohol subjects. Of interest is the last session measures where the older age subjects improved, while the younger age subjects showed a slight decrement in performance. Further research is indicated to deter- mine age-related learning curves as related to test
stability with this battery. In age and alcohol research,
concerns about stability of performance across mea-
sures are important issues. These data indicate that the COGSCREEN test battery is sensitive to decre-
mental effects on information processing time and cognitive reductions associated with aging.
Generally, the results of this study do not support a typical alcohol effect. The MANOVA results indi- cate significant age and session interactions on 16% of the measures; however, the simple effects tests yielded results that failed to evidence sessional patterns con- sistent with BrAC levels. It may be that the alcohol levels used in this study were low enough that subjects were able to overcome the effects of the ingested alcohol by motivation. However, the alcohol sessions did appear to reduce differences between the age groups.
REFERENCES
Billings, C. E., Demosthenes, T., White, T. R., & Ohara, D. B. (1991). Effects of alcohol on pilot performance in simulated flight. Aviation, Space, and Environmental Medicine, 62, 233-235.
Billings, C. E., Wick, R. L., Gerke, R. J., and Chase, R. C. (1972). The effects of alcohol on pilot performance during instrument flight. Technical Report DOT/ FAA/AM-72/4. Washington, D.C.; U.S. Depart- ment of Transportation, Federal Aviation Admin- istration, Office of Aviation Medicine.
Birren, J.E. (1974). Translations in gerontology— from lab to life. The American Psychologist, 22., 808-15.
Cahalan, D., Cisin, I. H., & Crossley, H. M. (1967). American Drinking Practices: A National Survey of Behavior and Attitudes Related to Alcoholic Bever- ages. Report No. 3. Washington, D. C: Social Research Group, The George Washington Uni- versity.
Canfield, D. V., Kupiec, T. C, and Huffine, E. F. (1992). Postmortem alcohol production in fatal air- craft accidents. Technical Report DOT/FAA/AM- 92/24. Washington, D.C.; U.S. Department of Transportation, Federal Aviation Administration, Office of Aviation Medicine.
Cerella, J. E (1985). Information Processing rates in the elderly. Psychological Bulletin, 9_8, 67-83.
Cerella, J. E. (1990). Aging and information processing rate. In J.E. Birren & K. W. Schaie (Eds.) Hand- book of the psychology ofaging (3rd ed., pp. 201- 221). San Diego, CA: Academic Press.
Collins, W. E., andMertens, H. W. (1991). Age, alcohol, and simulated altitude: Effects on performance and breathalyzer scores. Aviation, Space, and Environ- mental Medicine, 62(3), 236-240
Connors, G. J., and Maisto, S. A., (1980). Effects of alcohol, instruction and consumption rate on mo- tor performance. Journal of Studies on Alcohol, 41, 509-17.
Davies, D. R, Taylor, A. & Dorn, L. (1992). Aging and human performance. In Smith and Jones (Eds.) Handbook of Human Performance (Vol. 3, pp. 23- 61). London: Academic Press.
22

Dubowski, K. M. (1985). Absorption, distribution and elimination of alcohol: Highway safety aspects. Journal of Studies on Alcohol (Supplement), 10. 98-108.
Finnigan, F. and Hammersley, R., (1992). The effects of alcohol on performance. In the Handbook of Hu- man Performance, Volume 2, Health and Perfor- mance. , London: Academic Press.
Gilson, R. D., Schroeder, D. J., Collins, W. E., Guedry, F. E. (1971). Effects of different alcohol dosages and display illumination on tracking performance during vestibular stimulation. Aerospace Medicine, 43.(6), 656-660.
Hale, S., Lima, S. D. & Myerson, J. (1991). General cognitive slowing in the nonlexical domain: An ex$enmentAv2Xi6.a.üon. Psychology and Aging, 6(4), 512-521.
Hale, S., Myerson, J., & Wagstaff, D. (1987). General slowing of nonverbal information processing: Evi- dence for a power law. Journal of Gerontology, 42, 131-136.
Holloway, F. A. (1994). Low-dose alcohol effects on human behavior and performance: An update on post 1984 studies. Technical Report DOT/FAA/ AM-94/24. Washington, D.C.; U.S. Department of Transportation, Federal Aviation Administration.
Horst, R. L. and Kay, G. G., (1991a). Personal com- puter-based tests of cognitive function for occupa- tional medical certification. Proceedings of the Sixth International Symposium on Aviation Psychology, Columbus, OH, April 29-May 2, 2,734-739.
Horst, R. L. and Kay, G. G., (1991b). Cognitive function evaluation in medical certification of airmen: Devel- opment and validation of a prototype test battery. Report FAA/933-015-90. Oklahoma City, OK: Federal Aviation Administration.
Kane, R. L., and Kay, G.G. (1992). Computerized assessment in neuropsychology: A review of tests and test batteries. NeuropsychologicalReview, 2(1), 1-117.
Lentz, S. K, and Rundell, O. H. (1976). Sustained control of blood alcohol levels. Alcohol Technical Reports, 5(2), 33-36.
Linnoila, M., Erwin, C, Ramm, D., and Cleveland, W., (1980). Effects of age and alcohol on psychomotor performance of men. Journal of Studies on Alcohol, 41, 488-494.
Lima, S. D., Hale, S. and Myerson, J. (1991). How general is general slowing? Evidence from the lexi- cal domain. Journal of Gerontology, 6, 416-425.
Maylor, E. A, and Rabitt, P. M. (1987). Effects of alcohol and practice on choice reaction time. Per- ception and Psychophysics, 44, 117-126
Maylor, E. A, Rabbitt, P. M. A., James, G. H., and Kerr, S. A. (1990). Effects of alcohol and extended practice on divided-attention performance. Per- ception and Psychophysics, 48, 445-52.
McLean, G. A, Wilcox, B. C, and Canfield, D. V., (1991). Selection criteria for alcohol detection meth- ods. Technical Report DOT/FAA/AM-91/12. Washington, D.C.; U.S. Department of Trans- portation, Federal Aviation Administration, Of- fice of Aviation Medicine.
Millar, K, Hammersley, R. H., and Finnigan, F. (1992). Reduction of alcohol-induced performance im- pairment by prior ingestion of food. British Jour- nal of Psychology, 83.(2), 261-278.
Morrow, D., Leirer, V., and Yesavage, J. (1990). The influence of alcohol and aging on radio communi- cation during flight. Aviation, Space, andEnviron- mental Medicine, 61, 12-20.
Morrow, D, Yesavage, J., Leirer, V, Dolhert, N., Taylor, J., & Tinklemberg, J. (1993). The time course of alcohol impairment of general aviation pilot per- formance in a Frasca 141 simulator. Aviation Space and Environmental Medicine, 64, 697-705.
Moskowitz, H, Burns, M. M., Williams, A. F. (1985). Skills performance at low blood alcohol levels. Journal of Studies on Alcohol, 46(6), 482-485.
Moskowitz, H. and Robinson, CD., (1988). Effects of low doses of alcohol on driving-related skills: A review of the evidence. DOT National Highway Traffic Safety Administration Technical Report, DOT HS 807 280.
Moskowitz, H. & Sharma, S. (1974). Effect of alcohol on peripheral vision as a function of attention. Human Factors, 16, 174-180.
23

Myerson, J. and Hale, S. (1993). General slowing and age invariance in cognitive processing: The other side of the coin. In John Cerella (Ed.) Adult Infor- mation Processing: Limits on Loss (pp. 115-141). San Diego Academic Press.
Myerson, J., Hale, S., Wagstaff, D., Poon, L. W., and Smith, G. A. (1990). The information-loss model: A mathematical theory of age-related cognitive slowing. Psychological Review, 9_Z, 475-487.
Niaura, R. S., Nathan, P. E., Frankenstein, W., Shapiro, A. P., and Brick, J. (1987). Gender differences in acute psychomotor, cognitive, and pharmacoki- netic response to alcohol. Addictive Behaviors, 12, 345-56.
Obitz, F.W., Rhodes, L.E., and Creel, D. (1977). Effect of alcohol and monetary reward on visually evoked potentials and reaction time. Journal of Studies on Alcohol, 28(H), 2057-2064.
Ross, L. E. (1988). Alcohol: Is the new limit too much? Aviation Safety, 8(3), 1-6.
Ross, L. E., & Mundt, J. C. (1986). Effects of a low blood alcohol level on pilot performance. Proceed- ings of the Human Factors Society— 30th Annual Meeting, 1182-1186.
Ross, L. E, Yeazel, L. M., and Chau, A. W., (1992). Pilot performance with blood alcohol concentra- tions below 0.04%. Aviation, Space, and Environ- mental Medicine, 63_, 951-6.
Salthouse, T. A. (1985). A Theory of Cognitive Aging. Amersterdam: North-Holland.
Salthouse, T. A. (1991) Mediation of adult age differ- ences in cognition by reductions in working memory and speed of processing. Psychological Science,!, 179-183.
Spirduso, W. W. and Clifford, P. (1978). Phyiscal fittness, aging, and psychomotor speed: A review. Jounal of Gerontology, 3_3_, 26-30.
Spirduso, W. W. and MacRae, P. G. (1990). In J.E. Birren & K. W. Schaie (Eds.) Handbook of the psychology of aging (3rd ed.). San Diego, CA: Aca- demic Press.
Tabachnick, B. G., and Fidell, L. S., (1989). Using Multivatiate Statistics, 2nd Ed. NY: Harper & Row.
Weingartner, and Murphy D. L (1977). Mood-state- dependent retrieval of verbal associations. Journal of Abnormal Psychology, 86(3), 276-284.
24

APPENDIX A
BACKWARD DIGIT SPAN
Groups of three to six digits are presented sequentially, with the subject being required to reproduce each sequence in reverse order.
VISUAL SEQUENCE COMPARISON
Pairs of alphanumeric strings, four to eight characters in length, are presented simultaneously on the right and
left halves of the screen. The subject indicates "same" or "different" for each pair of strings, with "same" meaning
the same characters in the same positions.
SYMBOL DIGIT CODING
Six paired symbols and digits are displayed near the top of the screen throughout the test. Farther down the
screen a row of symbols are presented in random order, with associated blank spaces. The subject fills in the
associated digit for each symbol, referring to those displayed at the top of the screen.
SYMBOL DIGIT CODING-IMMEDIATE RECALL, DELAYED RECALL
Immediately after the Symbol Digit Coding Test, and again after an approximately 30 minute delay, the six
symbols appear in random order and the subject's task is to recall the digits that had been paired with each of the six symbols.
MATCHING TO SAMPLE
A grid pattern with filled and empty cells (the "sample") is presented briefly, followed after a short delay by that same pattern along with a slightly different "foil" pattern. A forced-choice response is required, with the subject indicating the grid pattern that is the same as the one presented previously.
DIVIDED ATTENTION
In the upper half of the screen a horizontal bar moves continuously up or down within a circular display,
changing direction at unpredictable times. The subject is instructed to respond when the moving bar passes from the center region of the circle into the upper or lower regions, which are delimited by a different color. This
response temporarily returns the bar to the center of the circle. This monitoring task is performed alone and concurrendy with a Visual Sequence Comparison task.
SHIFTING ATTENTION
Four response boxes are displayed near the bottom of the screen, one with a colored border, one with an uncolored border, one with no border both containing a colored arrow pointing right, and one with no border
but with an uncolored arrow pointing left. Stimuli are displayed in a similar box above this row of response
boxes. There are five conditions, requiring the subject to respond according to different rules.
DUAL TASK TRACKING
There are two tasks, each performed separately and then concurrently. One is a second-order compensatory
tracking task in which the subject taps the right and left arrow keys on the keyboard in an attempt to center a
vertical bar moving along a horizontal line. The other task involves the sequential presentation of three numbers
in random order with the subject responding with the light pen as to the previous number presented.
Al

APPENDIX B
TABLE 12. Means and Standard deviations of performance measures for baseline (.00) and three levels of alcohol intoxication — .00, .040, .027, and .0135— by a mixed age control group and
three age groups — younger, 25-27; middle, 42-47; and older, 57-62.
PERFORMANCE MEASURE AND GROUP .00 .04 .027 .0135 BACKWARD DIGIT SPAN
Number Correct YOUNGER MEAN 7.917 7.091 6.417 7.273
S.D. 2.644 3.476 3.753 3.570
MIDDLE MEAN 7.000 7.750 8.167 8.750 S.D 3.191 1.765 2.290 2.667
OLDER MEAN 7.417 6.900 7.083 7.500 S.D 3.147 3.017 3.349 3.083
CONTROL MEAN 8.083 7.667 7.542 7.875 S.D. 3.147 3.017 3.349 3.083
VISUAL SEQUENCE COMPARISON Number Correct
YOUNGER MEAN S.D.
19.570 .786
19.500 .674
19.201 .897
19.500 .905
MIDDLE MEAN S.D.
19.750 .452
19.583 .515
19.167 .937
19.750 .452
OLDER MEAN S.D.
19.500 .674
19.500 .879
19.500 .905
19.750 .452
CONTROL MEAN S.D.
19.625 .495
19.542 .588
19.458 .721
19.750 .442
Mean Reaction Time (MRT) YOUNGER MEAN 1837.568
S.D. 570.767 1747.529 1944.973 1923.183
711.957 764.967 669.160
MIDDLE MEAN 2421.777 2329.327 2350.315 2208.900 S.D. 648.974 748.977 726.561 620.329
OLDER MEAN 2905.915 2533.400 2576.863 2546.438 S.D. 705.252 624.565 552.439 558.675
CONTROL MEAN 2289.193 2126.794 2132.152 2121.423 S.D. 795.120 546.743 583.082 613.566
Bl
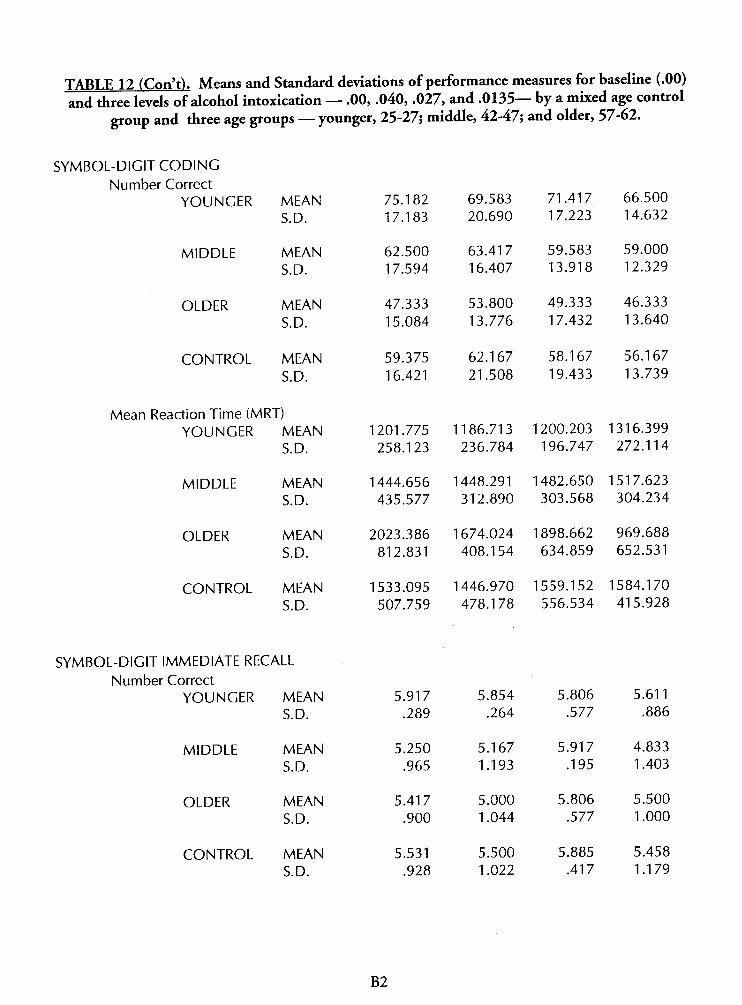
TABLE 12 (Con't). Means and Standard deviations of performance measures for baseline (.00) and three levels of alcohol intoxication — .00, .040, .027, and .0135— by a mixed age control
group and three age groups — younger, 25-27; middle, 42-47; and older, 57-62.
SYMBOL-DIGIT CODING Number Correct
YOUNGER MEAN S.D.
75.182 17.183
69.583 20.690
71.417 17.223
66.500 14.632
MIDDLE MEAN S.D.
62.500 17.594
63.417 16.407
59.583 13.918
59.000 12.329
OLDER MEAN S.D.
47.333 15.084
53.800 13.776
49.333 17.432
46.333 13.640
CONTROL MEAN S.D.
59.375 16.421
62.167 21.508
58.167 19.433
56.167 13.739
Mean Reaction Time (MRT) YOUNGER MEAN 1201.775
S.D. 258.123 1186.713 1200.203 1316.399 236.784 196.747 272.114
MIDDLE MEAN 1444.656 1448.291 1482.650 1517.623 S.D. 435.577 312.890 303.568 304.234
OLDER MEAN 2023.386 1674.024 1898.662 969.688 S.D. 812.831 408.154 634.859 652.531
CONTROL MEAN 1533.095 1446.970 1559.152 1584.170 S.D. 507.759 478.178 556.534 415.928
SYMBOL-DIGIT IMMEDIATE RECALL Number Correct
YOUNGER MEAN S.D.
MIDDLE
OLDER
MEAN S.D.
MEAN S.D.
CONTROL MEAN S.D.
5.917 5.854 5.806 5.611 .289 .264 .577 .886
5.250 5.167 5.917 4.833 .965 1.193 .195 1.403
5.417 5.000 5.806 5.500 .900 1.044 .577 1.000
5.531 5.500 5.885 5.458 .928 1.022 .417 1.179
B2

TART F. 12 (Con't). Means and Standard deviations of performance measures for baseline (.00) and three levels of alcohol intoxication — .00, .040, .027, and .0135— by a mixed age control
group and three age groups — younger, 25-27; middle, 42-47; and over, 57-62.
Mean Reaction Time (MRT) YOUNGER MEAN 1201.775
S.D. 258.123
MIDDLE MEAN 1444.656 S.D. 435.577
OLDER MEAN 2023.386 S.D. 812.831
CONTROL MEAN 1533.095 S.D. 507.759
1186.713 1200.203 1316.399 236.784 196.747 272.114
1448.291 1482.650 1517.623 312.890 303.568 304.234
1674.024 1898.662 1969.688 408.154 734.859 652.531
1446.970 1559.152 1584.170 478.178 556.534 415.928
SYMBOL-DIGIT DELAYED RECALL Number Correct
YOUNGER MEAN 6.000 5.666 5.701 5.521 S.D. .000 .603 .623 .991
MIDDLE MEAN 5.542 4.750 4.833 4.667 S.D. .775 1.357 1.586 1.497
OLDER MEAN 5.000 4.200 5.431 5.250 S.D. 1.128 1.335 .786 1.138
CONTROLMEAN 5.365 5.542 5.833 5.250 S.D. 1.101 .977 .482 1.260
Reaction Time (MRT) YOUNGER MEAN 1843.388 2336.125 2215.896 2998.528
S.D. 654.303 1137.660 1177.434 1301.035
MIDDLE MEAN 2487.001 3037.623 2319.098 3089.139 S.D. 916.394 1418.574 1131.103 1213.103
OLDER MEAN 4553.028 4470.251 3978.069 3351.833 S.D. 2030.976 2288.691 3418.895 1320.821
CONTROL MEAN 3197.340 3057.452 2744.944 3047.417 S.D.. 2156.179 2152.110 1853.735 1461.969
B3

TABLE 12 (Con't). Means and Standard deviations of performance measures for baseline (.00) and three levels of alcohol intoxication — .00, .040, .027, and .0135— by a mixed age control
group and three age groups — younger, 25-27; middle, 42-47; and over, 57-62.
MATCHING TO SAMPLE Number Correct
YOUNGER S.D.
MEAN .866
19.250 .866
19.250 .492
19.333 .452
19.750
MIDDLE MEAN S.D.
19.250 .866
18.545 1.076
18.833 1.467
19.417 1.240
OLDER MEAN S.D.
17.854 1.487
17.200 1.335
17.583 2.314
18.917 1.165
CONTROL MEAN S.D.
18.292 1.429
18.625 1.610
18.167 1.465
18.813 1.538
Mean Reaction Time (MRT) YOUNGER MEAN 1484.621 1647.704 1570.513 1343.382
S.D. 245.783 393.497 328.829 293.749
MIDDLE MEAN S.D.
1661.852 424.472
1925.700 432.254
1931.758 545.113
1750.877 495.985
OLDER MEAN S.D.
2085.979 432.678
2118.508 365.031
2027.700 427.859
1784.270 310.452
CONTROL MEAN S.D.
1727.116 339.252
1714.883 332.145
1769.149 414.538
1564.472 351.267
DIVIDED ATTENTION Number Correct
YOUNGER
MIDDLE
OLDER
MEAN S.D
MEAN S.D.
MEAN S.D.
CONTROL MEAN S.D
18.833 17.417 18.583 19.056 .718 1.443 1.832 .679
18.333 17.500 17.750 18.500 1.371 1.679 1.215 1.087
17.833 18.550 17.417 16.750 .718 1.066 1.311 2.050
18.375 18.458 17.458 16.438 1.173 1.444 1.744 2.786
B4

TART.K 12 (Con't). Means and Standard deviations of performance measures for baseline (.00) and three levels of alcohol intoxication — .00, .040, .027, and .0135— by a mixed age control
group and three age groups — younger, 25-27; middle, 42-47; and over, 57-62.
Mean Reaction Time (MRT) YOUNGER MEAN 1985.907 2072.767 2255.454 2118.349
S.D. 752.454 960.141 1113.937 1055.230
MIDDLE MEAN 2466.270 2688.218 2560.442 2509.174 S.D. 719.394 910.505 782.317 821.248
OLDER MEAN 2534.991 2672.565 2484.678 2463.873 S.D. 569.069 582.056 496.356 565.421
CONTROL MEAN 2238.798 2219.439 2167.703 2260.358 S.D. 571.961 701.346 649.520 695.746
DUAL TASKING Number Correct
YOUNGER MEAN 16.833 17.910 18.667 16.333 S.D. 5.006 5.373 5.883 5.033
MIDDLE MEAN 19.500 20.667 19.833 18.800 S.D. 3.497 3.939 3.834 3.511
OLDER MEAN 18.200 19.400 18.917 19.250 S.D. 3.352 2.670 3.232 3.194
CONTROL MEAN 17.138 18.583 17.694 14.542 S.D. 2.782 4.452 3.837 4.969
DUAL TASKING Mean Reaction Time
YOUNGER MEAN 498.010 639.603 588.688 602.268 S.D. 146.586 239.640 131.297 180.776
MIDDLE MEAN 524.222 714.149 739.307 706.192 S.D. 169.881 250.444 264.487 165.973
OLDER MEAN 730.780 949.798 882.365 786.447 S.D. 183.574 291.599 245.037 185.617
CONTROL MEAN 737.416 694.780 740.266 797.955 S.D. 279.993 202.277 288.845 306.626
B5

TABLE 12 (Con't). Means and Standard deviations of performance measures for baseline (.00) and three levels of alcohol intoxication — .00, .040, .027, and .0135— by a mixed age control
group and three age groups — younger, 25-27; middle, 42-47; and over, 57-62.
Number Premature Respo YOUNGER
MIDDLE
nses MEAN S.D. MEAN S.D.
1.917 2.314 2.400 2.054
2.114 1.366 2.500 1.784
1.750 1.765 2.083 1.929
1.917 1.564 2.067 1.207
OLDER MEAN S.D.
1.875 1.334
3.000 2.449
2.750 1.765
1.333 1.435
CONTROL MEAN S.D.
2.042 1.429
2.208 2.187
2.458 1.688
2.250 1.775
SHIFTING ATTENTION Number Correct
YOUNGER MEAN S.D.
49.750 2.221
47.583 3.029
50.091 2.109
48.500 3.030
MIDDLE MEAN S.D.
37.917 13.249
38.417 10.122
37.250 10.481
39.917 9.249
OLDER MEAN S.D.
38.333 14.462
41.275 6.240
37.917 12.631
40.333 11.665
CONTROL MEAN S.D.
41.542 10.974
42.042 9.355
42.792 9.926
41.292 9.742
SHIFTING ATTENTION Mean Reaction Time (MRT)
YOUNGER MEAN S.D.
664.511 143.985
648.380 119.825
634.893 101.379
610.458 123.419
MIDDLE MEAN S.D.
OLDER MEAN S.D.
CONTROL MEAN S.D.
870.506 359.641
992.426 503.229
903.573 360.237
812.009 279.112
842.377 359.343
849.438 404.147
804.659 380.891
1026.779 1016.911 1035.316 228.634 416.723 405.455
814.298 320.418
759.825 248.671
B6

TART.R 12 (Con't). Means and Standard deviations of performance measures for baseline (.00) and three levels of alcohol intoxication — .00, .040, .027, and .0135— by a mixed age control
group and three age groups — younger, 25-27; middle, 42-47; and over, 57-62.
Number of Lost Rules YOUNGER MEAN
S.D. 1.417 1.084
1.333 1.557
2.273 1.135
2.000 .953
MIDDLE MEAN S.D.
3.583 2.429
3.417 2.712
4.689 2.898
3.417 1.881
OLDER MEAN S.D.
2.250 1.545
2.200 1.991
3.417 2.746
2.500 1.732
CONTROL MEAN S.D.
2.583 2.244
2.583 2.104
2.667 1.685
3.063 1.794
DUAL TASKING Tracking Alone
Mean Reaction Time YOUNGER MEAN
S.D. 396.110 186.154
363.209 173.632
335.338 162.700
298.047 158.012
MIDDLE MEAN S.D.
561.859 164.223
527.475 310.414
505.611 273.546
446.729 139.241
OLDER MEAN S.D.
622.134 180.795
579.516 162.315
500.037 180.098
488.848 145.336
CONTROL MEAN S.D.
541.220 251.975
518.060 265.134
423.289 230.972
469.849 245.903
Average Absolute Error YOUNGER MEAN
S.D. 17.671 14.638
8.572 3.764
12.541 13.516
12.505 11.255
MIDDLE MEAN S.D.
13.672 14.117
16.798 21.015
13.542 15.470
11.905 5.850
OLDER MEAN S.D.
16.698 19.629
24.350 17.244
13.090 6.737
18.538 18.126
CONTROL MEAN S.D.
19.899 15.384
20.833 20.139
19.527 16.031
24.210 23.200
B7

TABLE 12 (Con't). Means and Standard deviations of performance measures for baseline (.00) and three levels of alcohol intoxication — .00, .040, .027, and .0135— by a mixed age control
group and three age groups — younger, 25-27; middle, 42-47; and over, 57-62.
Previous Numbers Alone Correct
YOUNGER MEAN 39.833 39.750 40.833 42.417 S.D. 5.474 6.482 5.306 5.869
MIDDLE MEAN 34.500 35.917 35.333 36.667 S.D. 4.777 7.403 6.329 4.355
OLDER MEAN 30.667 32.300 32.917 35.083
S.D. 6.706 6.354 6.855 4.542
CONTROL MEAN 33.625 35.583 37.792 36.625 S.D. 8.139 7.824 6.833 7.027
Alone MRT YOUNGER MEAN 396.110 363.209 335.338 298.047 S.D. 186.154 173.632 162.700 158.012
MIDDLE MEAN 561.859 527.475 505.611 446.729 S.D. 164.223 310.414 273.546 139.241
OLDER MEAN 622.134 579.516 500.037 488.848 S.D. 180.795 162.315 180.098 145.336
CONTROL MEAN 541.220 518.060 423.289 469.489 S.D. 251.975 265.134 230.972 245.903
DUAL TASKING Previous Numbers Correct
YOUNGER MEAN 30.583 33.667 36.167 33.667 S.D. 7.329 8.038 7.457 8.500
MIDDLE MEAN 28.583 30.583 31.083 33.667 S.D. 5.869 6.445 5.435 4.559
OLDER MEAN 21.917 23.200 23.417 25.167 S.D. 6.097 4.152 7.513 5.271
CONTROL MEAN 25.333 27.917 29.792 30.708 S.D. 9.964 9.297 8.506 9.248
B8

TABLE 12 (Con't). Means and Standard deviations of performance measures for baseline (.00) and three levels of alcohol intoxication — .00, .040, .027, and .0135— by a mixed age control
group and three age groups — younger, 25-27; middle, 42-47; and over, 57-62.
DUAL TASKING MRT
YOUNGER MEAN S.D.
616.717 210.526
534.302 222.120
455.52 206.561
536.218 295.772
MIDDLE MEAN S.D
710.152 232.339
652.036 209.475
604.422 186.538
533.764 159.938
OLDER MEAN S.D
824.796 212.567
858.223 133.670
801.495 200.025
717.440 190.368
CONTROL MEAN S.D.
753.540 317.066
713.495 304.600
647.615 283.582
581.070 270.930
Average absolute error YOUNGER MEAN
S.D. 40.576 28.554
36.482 26.139
39.643 28.627
39.406 33.066
MIDDLE MEAN S.D.
52.306 30.061
46.729 26.415
43.465 24.442
45.978 29.955
OLDER MEAN S.D.
72.054 20.347
78.014 16.220
76.578 20.224
73.798 17.940
CONTROL MEAN S.D.
61.315 28.048
63.999 29.525
58.362 30.699
59.608 29.382
B9

.o re
Its 11 4> 3
ss s s
£
2 i L. n v V E >
■Sä1
J £ S BO u < V
Q
s
Q. 3 O k. DO
O) DO re V.
QJ DO c
S s >~ c re
s s s ss ss s ss
Q. 3 o
CD DO re
<u DO c 3 O >- c re
S
U
Q
cu § L. c e £,2 > § i2 s o a.
^ a» _ c a.
'& = * SP o c S 1- 4) 5o E
BO u < ft)
a
s s s s s s s s
si 5 u
A« z "
0s 0s o^ 0s o^ tf^ O^ 0s- 0s O^ O*" ©** 0s" o* 0s O^ O^ ö" o^ o** ON ON^t O Ot Ot K^C KTT Ot^TfOOK Tj-tN * N r- -<fr Tfr- * r- CNt- CN ,— Tj- fN .-■*}■ Tf CN oo ooo o oo oo oo oo oooooo
u 2 CD CD c c
_o _o < <
re
re a)
£:§ »8 to eo
H H 0Ä C£ 2 c
1—
85 DO C
D05 C
o
Cod
rr
ect "O re
t/> </i _^ O (J
re re ,ro Q. Q.I- Ä o F E« .00 (J Mji o O 3
bo
lD
mbe
r Ü .2 u "re re -c
_ -o o <u n E 3 3 .ü II U ]^ > to to
_CD
P u
re Si
2 u
.E _Q
1 = |z
CD
IPS O = u « 00 0£
b -o 0
c 0> >.Q
to
DOS
|2 o = u <° u ~ CD OOQi
Q T3 _ <D
c CD ^Q to
_CD 3
CC C 4->
.2 S
t! O < Ü5 00 jQ .E E *: 3 IE Z to
<u 0) .£5 -Q E E 3 3 z z t/1 <Sl 3 3 o O > > <u CD
Q. Q.
(J
ID* 3
O
o _y re
vO
II Z
Cl ÄU.S. GOVEBNMENT PUNTING OFFICE: l»M - ««M»«7/«)0»2