Embed Size (px)
Citation preview

SOMALILAND IN- FIGURES
EDITION 6

Table of Contents Preface Page
1. Introduction 2
2. Geography and Climate 2
2.1 Location
2.2 Area
2.3 Climate
2.4 Rainfall
2.5 Humidity
3. Administrative sub-divisions 3
3.1 State
3.2 Regions and Districts
3.3 Capital
3.4 Other principal towns
3.5 Ports
4. Population 4
4.1 Vital Statistics
4.2 Population density
4.3 Religion
4.4 Languages
4.5 Currency
5. Livestock 5
6. Agriculture 6
6.1 Rain-fed farming and Irrigation
6.2 Marketing of Agricultural produce
6.3 Cereal harvest in 2007
7. Fisheries 8
7.1 Artisan fishing
7.2 Industrial Fishing
7.3 Fish canneries
7.4 Marketing
8. Economy 12
8.1 Banking
8.2 Import and Export
9. Transport and Communication 50
10. Education 54
10.1 Primary education
10.2 Secondary education
10.3 Higher education
11. Health 72
11.1 Public health
11.2 Private health
12. Miscellaneous 74
12.1. Criminal Statistics In Somaliland 2006---2007
12.2 Water
I

LIST OF TABLES Table 5.1 Estimated total population of Livestock: 2003------2007 5
Table 6.1 Estimated area, production and yield of major crops 7
Table7.1 Price of Fish in 2007(January to December 9
Table 7.2 Industrial (off-shore) Production on seasonal based. 10
T able 7.3 Fishing fleet spatial distributions on site base: 2007 11
Table 8.1 Central government revenue and expenditure at current price: 2003—2007 12
Table 8.2 Trends in expenditure: 2007 13
Table 8.3 Trends in revenue: 2007 13
Table 8.4 local government revenue and expenditure Hargeisa: 2003—2007 14
Table 8.5 Local government revenue and expenditure Gabilay: 2003----2007 15
Table 8.6 Local government revenue and expenditure Borama: 2003----2007 16
Table 8.7 Local government revenue and expenditure Burco: 2003----2007 17
Table 8.8 Local government revenue and expenditure Berbera: 2003—2007 18
Table 8.9 Total Local governments revenue and expenditure 2003--------2007 19
Table 8.10 Total of Food Items through Berbera port: 2003 20
Table 8.10 (Continued) Total of Non-Food Items through Berbera port: 2003 22
Table 8.11Total of Food Items through Berbera port: 2004 24
Table 8.11(Continued)Total of Non-Food Items through Berbera port: 2004 26
Table 8.12Total of Food Items through Berbera port: 2005 28
Table 8.12 (Continued)Total of Non-Food Items through Berbera port: 2005 30
Table 8.13 Total of Food Items through Berbera port: 2006 32
Table 8.13 (Continued)Total of Non-Food Items through Berbera port: 2006 34
Table 8.14 Total of Food Items Through Berbera port: 2007 36
Table 8 .14 (Continued) Import of Non-Food commodities through Berbera port: 2007 38
II

Table 8.15 Some of the Indicators Imported on Yearly Comparison 40
Table 8.16 Import of Containers through berbera Port: 2004---2007 41
Table 8.17 Export of goats and sheep through Berbera Port: 2003-2007 42
Table 8.18 Export of cattle through Berbera Port: 2003—2007 43
Table 8.19 Export of livestock through Berbera port: 2003—2007 44
Table 8.20 Export of camel through Berbera Port: 2003---2007 45
Table 8.21 Export of hide and skin through Berbera Port: 2003---2007 46
Table 8.22 Export of beeyo through Berbera Port: 2003---2007 47
Table 8.23 Berbera Port Traffic: 2003-2007 48
Table 8.24 Import of fuel: 2003----2007 49
Table 9.1 Traffic Movement Statistics: 2006 50
Table9.2 Aircraft Traffic Volume: 2006 51
Table 9.3 Traffic Movement Statistics: 2007 52
Table 9.4 Aircraft Traffic Volume: 2007 53
Table 10.1 Growth of public & private Education: 97/98----------06/07 54
Table 10.2 Growth of primary Education (Public & Private): 98/99---06/07 55
Table 10.3 Distribution of Primary education by regions: 05/06 56
Table 10.4 Primary education Students Enrolment by region: 05/06 57
Table10.5 Primary Education Distribution of Students by Gender & region: 05/06 58
Table 10.6 Primary & Secondary Examination results: 05/06—06/07 59
Table 10.2.1 Growth of Secondary (Public & private) education: 06/07 60
Table 10.2.2 Public & Private Secondary schools distribution by region: 06/07 62
Table 10.3.1 Number of Students enrolled at Amoud University: 2007 64
Table 10.3.2 Number of Students graduated from Amoud University: 2004---2007 65
Table 10.3.3 Number of Students enrolled at Hargeisa University: 2007 66
Table 10.3.4 Number of students graduated from Hargeisa University: 2004—2007. 67
Table 10.3.5 Number of students enrolled at Burco University: 2007 68
III
Table 10.3.6 Number of students enrolled at Admas University: 2007 69
Table 10.3.7 Number of students enrolled at Eelo American University: 2007 70
Table 10.3.8 Number of students enrolled at Gollis University: 2007 71
Table11.1 Number of TB Patients in selected towns: 2003---------2007 72
Table 11.2 Availability of Private health services: 2007 73
Table 12.1 Criminal Statistics in Somaliland: 2006-2007 74
Table 12.1 Number of water facilities by region: 2007 75
Table 12.2 Boreholes and their functional status: 2007 76
IV
LITS OF CHARTS Chart1 Estimated Population of livestock: 2003------2007 5
Chart 2 Estimated area, production and yield of major crops during 2003----2007 7
Chart 3 Price of Fish in Hargeisa: 2007 9
Chart 4 The Industrial (off-shore) Production on season base 10
Chart 5 Fishing fleet spatial distribution on site base: 2007 11
Chart6 Central government revenue and expenditure at current price: 2003 – 2007 12
Chart 7 Local government revenue and expenditure Hargeisa: 2003 – 2007 14
Chart8 Local Gover’t Revenue and Expenditure Gabiley: 2004—2007 15
Chart 9 Changes in Revenue (2003-2007). Borama Local Government 16
Chart10 Change in Expenditure (2003-2007). Borama Local Government 17
Chart 11 Local government revenue Burco: 2003 – 2007 18
Chart 12 Total Local Government Expenditure and Revenue 19
Chart 13 Total of Food Items through Berbera port: 2003 21
Chart 14 Total of Non-Food Items through Berbera port: 2003 23
Chart 15 Total of Food Items through Berbera port: 2004 25
Chart 16 Total of Non-Food Items through Berbera port: 2004 27
Chart 17 Total of Food Items through Berbera port: 2005 29
Chart 18 Total of Non-Food Items through Berbera port: 2005 31
Chart 19 Total of Food Items through Berbera port: 2006 33
Chart 20 Total of Non-Food Items through Berbera port: 2006 35
Chart 21 Total of Food Items through Berbera port: 2007 37
Chart 22 Total of Non-Food Items through Berbera port: 2007 39
Chart 23 Some of the Indicators Imported on Yearly Comparison 40
Chart 24 Import Containers through Berbera Port 2004-------2007 41
Chart 25 Total Export of goats and sheep through Berbera Port 2003----2007 42
Chart 26 Total Export of Cattle through Berbera Port: 2003----2007 43
VI

Chart 27 Total Export of livestock through Berbera Port: 2003----2007 44
Chart 28 Total Export of Camel through Berbera Port 2003---2007 45
Chart 39 Total Export of hide and skin pieces through Berbera Port: 2003—2007 46
Chart 30 Total Export of Beeyo through berbera Port: 2003----2007 47
Chart 31 Total Berbera Port Traffic: 2003----2007 48
Chart 32 Import of Fuel: 2003------2007 49
Chart 33 Passenger Movement for major Airports (2006 Cargo Movement (In/Out) 50
Chart 34 Passenger Movement for major Airports (2007) Cargo Movement (In/Out) 52
Chart 35 Growth of public and Private Education 1997/98----2006/2007 54
Chart 36 Growth of Primary Education (Public and Private) 1998/99----------2006/2007 55
Chart 37 Distribution of primary education by region: 2005/2006 56
Chart 38 Primary Education Students Enrolment by Region (Urban and Rural): 2005/06 57
Chart 39 Primary Education—Distribution of students by Gender and Region “005/006 58
Chart 40 Primary and Secondary examination results (national): 05/06 and 06/07 59
Chart 41 Growth of Secondary Education (Public and private): 1996/97---2006/2007 61
Chart 42(A) Total of Public and Private Secondary Schools Distribution by region: 05/06 63
Chart 42(B) Public and Private Secondary Schools Distribution by region: 06-07 63
Chart 43 total of (M) and (F)Number of students enrolled at Amoud University :2007 64
Chart 44 Number of Students graduated from Amoud University: 2004—2007 65
Chart 45 Number of Students enrolment at UoH( 2007)Grand total of( M) and Female 66
Chart 46 Number of Graduated students From UoH 2004—2007 67
Chart 47 Number of Students enrolment of Burco University 2007 68
Chart 48 Number of students enrolled in Admas University. total of Male and Female 69
Chart 49 Number of students enrolled at Eelo American University: 2007. total of (M/F) 70
Chart 50 Number of Students enrolment at Gollis University: 2007 total of (M/)F 71
Chart 51 Number of TB Patients in selected towns: 2003--------2007. 72
Chart 52 Number of water facilities by region: 2007 75
Chart 53 Functioning and Not Functioning Boreholes in Somaliland 76 VII

PREFACE
The Ministry National Planning and Coordination (MNP&C) has the honour of presenting the 2010 edition of
Somaliland in-figures. This booklet is the seven publications in series. It contains official statistical data on
various components of the economic and social activities in the Republic. Its purpose is to provide
information on different sectors to assist in the planning and development of the nation.
Data contained in this booklet is based mainly on the administrative records of the ministries and agencies
of the state. The MNP&C is grateful for the assistance they provided. Somaliland In-figures will be regularly
updated. Therefore, we welcome the continued support of existing sources and feedback from users of this
data.
We express our thanks and gratitude to the United Nations Fund Population Agency (UNFPA)
Somalia/Somaliland who sponsored and assisted in the preparation of this booklet.
Comments and suggestions may be sent to the Department of Statistics and Research at the MNP&C in
Hargeisa.
“ XOG LA HEL YAABA TALO LA HEL.”
1

1. INTRODUCTION
The former British Somaliland Protectorate achieved full independence from the United Kingdom on 26th
June 1960. On 1st July 1960, the state of Somaliland united with Somalia, creating Somali Republic.
The Republic of Somaliland restored its independence after the total collapse of Somalia on 18 May 1991.
The decision was made by the Congress of Council of Clan Elders held in Burao from 27th April to 15th
May1991.
Constitutionally, the Republic of Somaliland is a democratic rate with a multi-party system.
2. GEOGRAPHY AND CLIMATE
2.1. LOCATION The Republic of Somaliland is situated in the Horn of Africa. Its boundaries are defined by the Gulf of Aden to the north, Somalia in the east, the Federal Republic of Ethiopia in the south-west, and the Republic of Djibouti in the north-west. It lies between Latitudes 8* and 11*27` north and Longitudes 42*35` and 49*east with mountains rising to six and seven thousand feet in the centre and in the east of country respectively.
2.2. AREA
The total area of the Republic of Somaliland is 137, 600Sqkms with coastline of 850kms.
2.3. CLIMATE
Somaliland is located north of the equator. It is semi-arid. The average daily temperatures range between
25”C to35”C. The sun passes vertically over head twice a year, on 22nd March and 23rd September.
Somaliland consists of three main topographic zones:
The Coastal Plain(Guban)
The Coastal Range(Ogo)
The Plateau(Hawd)
The Coastal Plain (Guban) is a Zone with high temperatures and low rainfall. Summer temperatures in the
region easily average over 100”F. During the winter season, both human and livestock population are
concentrated in the region.
2

The Coastal Range (Ogo) is a high plateau to the immediate south of the Guban. Its elevation from the sea
level ranges between 6000ft to 7000ft in the south. The rainfall is heavier than Guban , although it varies
tremendously with the zone.
The plateau (Hawd) region lies to the Ogo. It is generally more populated during the wet season, when
surface water is available. It is also an important area for grazing.
2.4. RAINFALL
Somalilanders recognise four seasons in the year, Gu and Hagaa are the summer periods and Jilaal and Deyr
are the winter seasons.
The average annual rainfall is 14.5 inches in the most parts of country. The Gu and Deyr(summer ) rainfall
occurs between April and September. Gu, which is the first rainy season (summer) (late March, April and
May), experiences the heaviest rainfall in Ogo and Hawd. This constitutes the period of fresh grazing and
abundant surface water. It is also the breeding season for livestock. Summer season, but widely in many
parts of country.The Deyr(September and October) is the second, but small rainy season. The Jilaal is the
Deyr winter season(November to March or early April) and is the season of thirst. The Ogo and Hawd
receive virtually no rainfall in winter. The rainfall in the Guban zone, known as “Hays”, is between January
and March or from December and January.
2.5. HUMIDITY
The humidity in the country varies from 63% in the dry season to 82% in the wet season.
3 ADMINISTRATIVE SUB-DIVISION
3.1. STATE
The administrative structure of the state consists of judiciary, legislative (House of Elders, and the House of
Representatives) and an executive (the President and his chosen Council of Ministries) who may not be
Members of Parliament.
3.2. REGIONS AND DISTRICTS
The country divided into twelve regions, namely Awdal, Marodi-jeeh, Sahil , Togdheer, Sanag , Sool ,Gabilay,
Salal, Odweine, Saraar, Buhodle, and Badhan which are sub-divided into 57 districts.
3

3.3. CAPITAL
The capital of the Republic of Somaliland is Hargeisa. The estimated population is nearly 680,000.
3.4. OTHER PRINCIPLE TOWNS
Other towns are Borama, Berbera, Burao, Erigavo, and Las-canood.
3.5. PORTS
The principal port of Somaliland is Berbera port.
4 POPULATION
The population of Somaliland was estimated at 3.5 million in 2006. The consists of nomadic people (55%)
and urban and rural dwellers (45%)
4.1. VITA L STATISTICS
The population growth rate is 3.14%. This figure is calculated from the average crude birth rate of 4.46% and
crude death rate of 1.32%. The life expectancy at birth is between 49 and 60 years.
4.2. POPULATION DENSITY
The population density in the Republic of Somaliland is estimated at 25 persons per square Km in 2006.
4.3. RELIGION
Somaliland is an Islamic State and Somalilanders are Muslims. The influence of Islam throughout Somaliland
is profound and faith plays a major role in everyday life.
4.4. LANGUAGES
The official languages of the country are Somali. Arabic and English are also widely spoken.
4.5. CURRENCY
The official currency in the Republic of Somaliland is the Somaliland Shilling. The shilling is divided into
100cents. Currency notes of 500, 100, 50, 20, 10, and 5 shillings are used.
4

5. LIVESTOCK
Contribution of livestock to the national economy is estimated at 60-65%. About 60% of the Somaliland
population rely mainly on the products and by-products of their livestock for daily sustenance
Table 5.1
Estimated Population of livestock: 2003------2007
Year Goat Sheep Camel Cattle Total
2003 7,001 7,644 1,542 364 16,551
2004 7,169 7,774 1,561 368 16,872
2005 7,341 7,906 1578 373 17,198
2006 7,517 8,041 1,596 378 17532
2007 7,698 8,178 1,614 383 17,873
Source: Ministry of National Planning & Coordination (Department of Statistics & Research)*
Note: The estimates are based on 1975 Somalia census of livestock population and the annual growth rate, goat: 2.4% sheep: 1.7% camel: 1.1% and cattle: 1.2%
Chart1
Estimated Population of livestock: 2003------2007
5

6. AGRICULTURE
Somaliland has total area of about 137,600sqkms.Land under cultivation is currently estimated at 3% of the
total geographical area. Another 7% of the area has potential for agricultural development. The rainfall, soil
(fertility and depth) and topography are the main determinants of these estimates.
6.1. RAIN-FED FARMING AND IRRIGATION
Rain-fed farming is the main agricultural production system. The main crops grown are cereals. Sorghum is
the principal crop, utilising approximately 70% of the rain-fed agricultural land. Another 25% of the land is
used for maize. Other crops such as cowpeas, millet, groundnuts, beans and barely are also grown in
scattered marginal lands.
Irrigation farms are mainly situated along the banks of the streams (Togs) and other water sources close to
the riverbanks. Channelling from the source to the farm is mainly done by diversion of perennial water
(springs) to the farm through rudimentary earth canals or floods. The cultivable area of these farms is
subject to floods and is therefore in danger of being washed away. Most of the irrigated farms are used to
cultivate vegetable and fruits for commercial purposes.
6.3. MARKETING OF AGRICULTURAL PRODUCE
Farmers sell their products at the local market. Where possible, farm produce is transported to the markets
in the urban centres using light transport trucks or donkey carts. Small retailers who are supplied directly by
the producers or wholesalers sell the produce. There are middlemen who also operate between wholesalers
and retailers.
6.4. CEREAL HARVEST IN 2007
Harvest in Somaliland normally occurs three times a year. The 2007 GU/Karan result was only two
harvests—(GU—sorghum and Karan--- maize). The total cereal harvest area of Somaliland has been
estimated at 37,221ha with total cereal production of 26,744 tonnes (85% sorghum and 15% maize)
according to the Ministry of Agriculture.
6

Table 6.1
Estimated area, production and yield of major crops during 2003----2007
Selected Indicators 2003
2004
2005
2006
2007
Average 2004--2005
1. Maize
Area(ha) 11,770 6,720 10,250 7,709 6,384
Production(tons) 3,289 2,688 4,603 1,760 4,022 3,646
Yield(Tones/Ha) 0.07 0.07 0.10 0.07 0.11
2.Sorghum
Area(Ha) 34,287 32,556 32,430 31,179
Production(Tons) 24,915 14,392.2 21,112 18,155 22,722 17,752.1
Yield (Tonnes/Ha) 0.54 0.37 0.50 0.70 0.61
TOTAL 0.44 0.60 0.77 0.70
Area(Ha) 46,057 39,276 42,680 25,864 37,563
Production(tons) 28,204 17,080.2 25,715 19,915 26,744 21,398
Yield (Tons/Ha) 0.61 0.44 0.60 0.77 0.72
Source: Ministry of Agriculture.
Chart 2
Estimated area, production and yield of major crops during 2003----2007
7

7. FISHERIES
The warm water of the Gulf of Aden borders the country of Somaliland over a coastline spanning 850kms on
its southern fringes. This coastline extends from Loya—addo in west to Elayo in east and is characterised by
sandy beaches broken at intervals by rocky cliffs that often penetrate into the shallow waters.
The continental shelf is relatively narrow, rarely exceeding 15kms, except in the west near the Djibouti
border. Where it averages 100kms, artisan fishermen harvest various tropical fish. They include types of
tuna, snappers, groupers, grunts, trevally, emperors, barracudas, goatfish,parrotfish
Spanish mackerels, sea breams, horse mackerels and mulleys. Other marine organisms caught occasionally
by local fishermen include sea cucumbers, shrimps, lobsters and edible crabs. Production of fish in
Somaliland is still very low (it’s less than 10% of the pre—war level and constitutes less than 2% of the Gross
National Product (GNP)).
According to various reports published by international organisation, fisheries in Somaliland remain
untapped.FAO estimated an abundance of fish in the national waters of 200,000 tons and that a maximum
sustainable yield of 40,000 tons could be harvested without endangering the stocks. At the present time,
estimated fish production is quite low compared to the potential. The shark fishing industry is the mainstay
of the artisan fishing community in Somaliland and more than 90% of the fishing fleet hunts for sharks for
their valuable fins. In addition to these, a sizeable yield of sea cucumbers reaching several tonnes per year is
harvested in the waters of Zeila and nearby islands. Furthermore, edible crabs and shrimps are caught in
Zeila and Togoshi areas. Local fishermen market around 30—50Kgs of live, edible crabs daily to Djibouti on
foot.
7. 1 ARTISAN FISHING
Artisan conducts most fishing activity in Somaliland. Above 170 operational boats are scattered along the
lengthy coast and there are around 15 fishing communities composed of active fishermen and their
dependents. Berbera serves as a focal point for the fishing industry in Somaliland. Fish caught at Berbera
range from 100kgs to 500kgs per day and are transported immediately to Hargeisa or to Burao for local
consumption. The current fishing fleet consists of 425 motor boats and 109 canoes, of which 428 are
operational.
7.2. INDUSTRIAL FISHING
Presently, no industrial fishing is undertaken by foreign vessels. The country does not have deep sea fishing
vessels.
8
7.3. FISH CANNERY

The country has one fish cannery at Laskhoreh in Sanag region. It was built in 2002; it was built by a group of
local businessmen who installed a new canning machine. Production started in 2002 at capacity of 1-2.5
tonnes per a day.
7.4. MARKETING
Catches of fresh fish such as groupers, snappers, emperors, tuna, mackerels, and travally are sold locally in
the internal markets such as Berbera, Hargeisa, Burao and Borama and Erigavo, at the price of US $2.10 per
Kilogramme.
Local fishermen do not have access to an open external market for exportation of their goods. Trucks
transport goods from the coast to the towns are in short supply and the roads are narrow and inaccessible in
the most of the eastern and northwest of the coast.
The most important item exported by fishermen is dried, salted shark fins. This marine product is exported
to south-east Asian countries and usually generates a good source of income for fishermen (around US $ 1-
1.5 million a year).
Table 7.1
Price of Fish in Hargeisa: 2007 (SL.Sh)
Month Price/kg
January 12,531.25
February 12,562.50
March 12,234.34
April 11,875.00
May 12,000.00
June 12,000.00
July 12,562.50
August 13,000.00
September 12,162.50
October 12,656.25
November 11,912.50
December 12,437.50
Source: Ministry of Planning & Coordination (Department of Statistics).
9

Chart 3
Price of Fish in Hargeisa: 2007 (SL.Sh)
Table 7.2
The Industrial (off-shore) Production on season base
SEASON PRODUCTION IN MT
8/10/03—18/6/04 1,233.00
15/9/04—11/5/05 2,133.00
28/9/05---12/4/05 1,377.9
16/9/06---10/4/07 1,283.00
Total 6,006.9 Source: Ministry of Fishing and Marine Resource
Chart 4
The Industrial (off-shore) Production on season base
10

Table 7.3
Fishing Fleet spatial distribution on Site bases: 2007
SITE Number of Motor Boats
Number of Canoe Total
Number of Operating
Number of non Operating
Zeila 45
17
62
51
11
Lughaia 15
5
20
13
7
Bulahar -0-
4
4
4
-0-
Berbera/Karin 55
20
75
65
14
Heis/Mait
10
10
20
10
10
Las-Qoray/Elayo
300
50
350
285
64
Source: Ministry of Fishing and Marine Resource.
Chart 5
Fishing fleet spatial distribution on site base: 2007
11

8 .Economy The backbone and the source of wealth of Somaliland economy is the livestock. About 65% of the
population depends either directly or indirectly on livestock and livestock products for their livelihood. Crop
husbandry provides subsistence for about 20% of the State’s population. Foreign Aids and Remittances also
play a major role in the economy of the country.
8.1 BANKING
One the provision of the National Constitution of the Republic Of Somaliland is the establishment of a bank
to carry out Central Bank functions. The Bank of Somaliland was inaugurated in 1994 with appropriate bank
laws to ensure that banking regulations are carried out. The Bank of Somaliland also operates as a
commercial bank and has eight branches throughout the country.
Table 8.1
Central government revenue and expenditure at current price: 2003 - 2007
Year
Revenue
Expenditure
Surplus/(Deficit)
2003
120,808,413,523
120,808,413,523
---0---
2004
144,848,772,610
144,848,772,610
---0--
2005
148,252,211,709
148,252,211,709
---0---
2006
164,669,033,000
164,669,033,000
---0---
2007
202,759,848,704
202,759,848,704
---0-
Source: Ministry of Finance.
Chart6
Central government revenue and expenditure at current price: 2003 - 2007
12

Table 8.2
Trends in expenditure: 2007
Head/Expenditure
Amount
A. Opening Balance 1/1/2007
---0--
B. Budget Expenditure
202,759,848,704
C. Out of Budget Expenditure Below line
of Account
---0---
D. Total Expenditure(B+C)
202,759,848,704
Total ( A+D)
202,759,848,704
Source: Ministry Of Finance.
Table 8.3
Trends in revenue: 2007
Head/Income
Amount
Income from the use of property
642,810,900
Direct tax income
195,224,082,300
Service income
4,987,800
Income from property
7,887,967,704
Add. Surplus (Extra Revenue)
--0--
Total
202,759,848,704
Source: Ministry of Finance
13

Table 8.4
Local government revenue and expenditure Hargeisa: 2003 – 2007 (Sl.sh.)
Revenue
Expenditure
Surplus/ Deficit
2003
9,432,260,237
9,363,025,811
69,234,426
2004
10,254,909,430
10,219,874,082
35,035,348
2005
11,754,390,237
11,748,540,002
5,850,235
2006
12,728,915,953
12,714,374,034
14,540,919
2007
13,613,400,103
13,973,211,237
-359,811,134
Source: Local Government of Hargeisa
Chart 7
Local government revenue and expenditure Hargeisa: 2003 – 2007 (Sl.sh.)
14

Table 8.5
Local Gover’t Revenue and Expenditure Gabiley: 2004--2007
Year Revenue Expenditure Surplus
2004 3,341,915,000 3,255,618,000 86,297,000
2005 3,157,180,000 3,089,250,000 67,930,000
2006 3,568,832,000 3,439,336,000 129,496,000
2007 3,769,572,000 3,550,972,000 218,600,000
Source:Local gov’t of Gabiley
Chart8
Local Gover’t Revenue and Expenditure Gabiley: 2004--2007
15

Table 8.6
Local government revenue and expenditure Boroma: 2003 – 2007 (Sl.Sh)
Year
Revenue
Expenditure
Surplus
Deficit
2003
1,679,212,205
1,679,212,205
0
0
2004
1,646,353,876
1,639,918,567
6,435,309
0
2005
1,572,586,716
1,577,191,239
0
4,604,523
2006
1,848,244,458
1,836,631,527
11,612,931
2007
2,188,459,257
2,188,711,916
0
242,659
Source: Local Government of Borama
Chart 9
Change in Revenue and Expenditure (2003-2007). Borama Local Government
16

Table 8.7
Local government revenue and expenditure Burco: 2003 – 2007 (Sl.Sh)
Year
Revenue
Expenditure
Surplus
2003
4,270,000,000
4,270,000,000
--0--
2004
3,439,787,275
3,426,030,115
63,757,160
2005
2,971,345,621
2,907,178,017
64,167,604
2006
3,916,113,038
3,914,480,639
1,632,400
2007
4,173,799,376 4,137,638,891 36,160,485
Source: Local Government Burao
Chart 10
Local government revenue and Expenditure Burco: 2003 – 2007
17

Table 8.8
Local government revenue and expenditure Berbera: 2003 – 2007 (Sl.Sh)
Year
Revenue
Expenditure
Surplus
2003
N/A
N/A
N/A
2004
1,393,388,205
1,373,537,601
20,850,604
2005
1,057,032,611
867,264,883
189,767,728
2006
1,118,267,310
985,471,075
202,796,235
2007
2,299,205,867
1,662,767,082
636,438,785
Source: Local Government of Berbera
Chart 11
Local government revenue and expenditure Berbera: 2003 – 2007 (Sl.Sh)
18

Table 8.9
Total Local government revenue and expenditure (Sl.Sh)
Year
Revenue
Expenditure
Surplus/dificit
2003
18,230,016,442
18,024,116,016
205,900,426
2004
20,126,353,786
19,913,978,365
212,375,421
2005
17,541,189,564
20,189,424,141
-2,648,234,577
2006
19,264,259,721
22,890,294,275
-3,626,034,554
2007
18,101,065,227
23,850,534,044
-5,749,468,817
Source: Major Municipalities of Somaliland
Chart 12
Total Local Government Expenditure and Revenue
19

Table 8.10
Total of Food Items through Berbera port: 2003 (Tonnes)
Month
Sugar
Rice
Wheat flour
Wheat
Cooking oil
Pasta
Dates
Biscuits
Jan
0
12,109
300
0
16
1,752
4
120
Feb
19,977
8,400
3401
820
45
238
91
133
March
12,507
4
2,769
829
1,142
84
48
114
April
6,936
16,066
137
0
1,910
203
61
85
May
19
302
6,592
0
970
409
225
163
June
21,983
7928
373
0
1,587
725
42
222
July
0
2
1068
15,000
2,137
724
54
178
Aug
0
2,400
6,666
0
3,666
284
0
133
Sept
6,329
2509
7,983
25,825
3,464
1,420
333
254
Oct
11,994
0
4650
54
864
498
537
132
Nov
21,062
6,999
1,255
702
1,244
1,412
258
177
Dec
24
12,393
5,163
2,028
1,181
985
13
161
Total 100831 69112 40357 45258 18226 8734 1666 2072
20

Chart 13
Total of Food Items through Berbera port: 2003
21

Table 8.10 (Continued)
Total of Non-Food Items through Berbera port: 2003
(Tonnes)
Month
Cloth
Car spares
Cigarettes
Soap
Bdg/Mats
Fuel
Others
Jan
855
603
44
80
8,814
8,608
1,867
Feb
554
476
78
542
6,460
104
2,025
March
507
849
481
659
3,765
169
2,226
April
454
135
270
600
4,660
6,747
1,491
May
704
969
312
605
13,655
169
2,910
June
853
674
468
221
10,304
2,958
2,780
July
276
497
111
339
7,902
4,485
2,063
Aug
516
149
274
506
8,062
7,485
2,850
Sep
744
780
359
639
14,661
3,104
3,193
Oct
833
552
380
268
28,700
6,857
2,204
Nov
675
547
104
478
12,268
281
2,649
Dec
655
920
280
162
5,277
6,590
2,589
Total
7,626
7,151
3,161
5,099
124,528
47,555
28,847
22

Chart 14
Total of Non-Food Items through Berbera port: 2003
23

Table 8.11
Total of Food Items through Berbera port: 2004
(Tonnes)
Month
Sugar
Rice
Wheat flour
Wheat
Cooking oil &Oil Beans
Pasta
Dates
Biscuits
Jan
26,810
2,992
0
1,169
1780
148
235
Feb
12,021
9,993
5,188
0
1,177
1199
29
198
March
12,970
11,980
3,815
0
507
941
229
241
April
8,593
6
696
0
1,033
347
264
199
May
0
156
4,888
0
1,578
1178
183
322
June
3
0
4,296
0
1804
2743
43
89
July
17,341
10,117
400
0 3,161
1501
10
237
Aug
13,603
695
1,800
0
1,508
367
70
53
Sept
65
11,989
6,686
40
3,552
3262
694
159
Oct
21,012
11,460
8,890
143
4,663
1934
828
214
Nov
14,040
5
253
0
4953
1552
243
139
Dec
35,595
8,608
1,560
0
789
413
212
119
Total
162,053
68,001
38,462
183
17,197
2,953
2,206
24

Chart 15
Total of Food Items through Berbera port: 2004
25

Table 8.11
Total of Non-Food Items through Berbera port: 2004 (Tonnes)
Month
Clothes
Car/spares
Cigarettes
Soap
Bdg/Mats & cement
Fuel
Others
Jan
1,037
819
434
381
17,468
2,064
2,978
Feb
494
923
192
502
22,403
8,427
3,251
March
871
403
195
340
3,448
3,270
1,975
April
844
1,207
224
713
6,042
119
3,320
May
557
897
324
652
4,911
7,946
1,966
June
790
967
176
480
8,196
3,675
3,594
July
714
265
396
656
5,849
2,824
3,113
Aug
751
884
77
743
6,263
5,679
2,123
Sep
813
799
368
488
22,855
369
3,421
Oct
959
705
261
941
17,169
7,074
2,595
Nov
680
386
180
545
5,936
5,032
2,382
Dec
1,112
421
361
342
8,970
5,709
2,299
Total
11,731
8,666
3,191
6,783
122,210
52,188
32,957
26
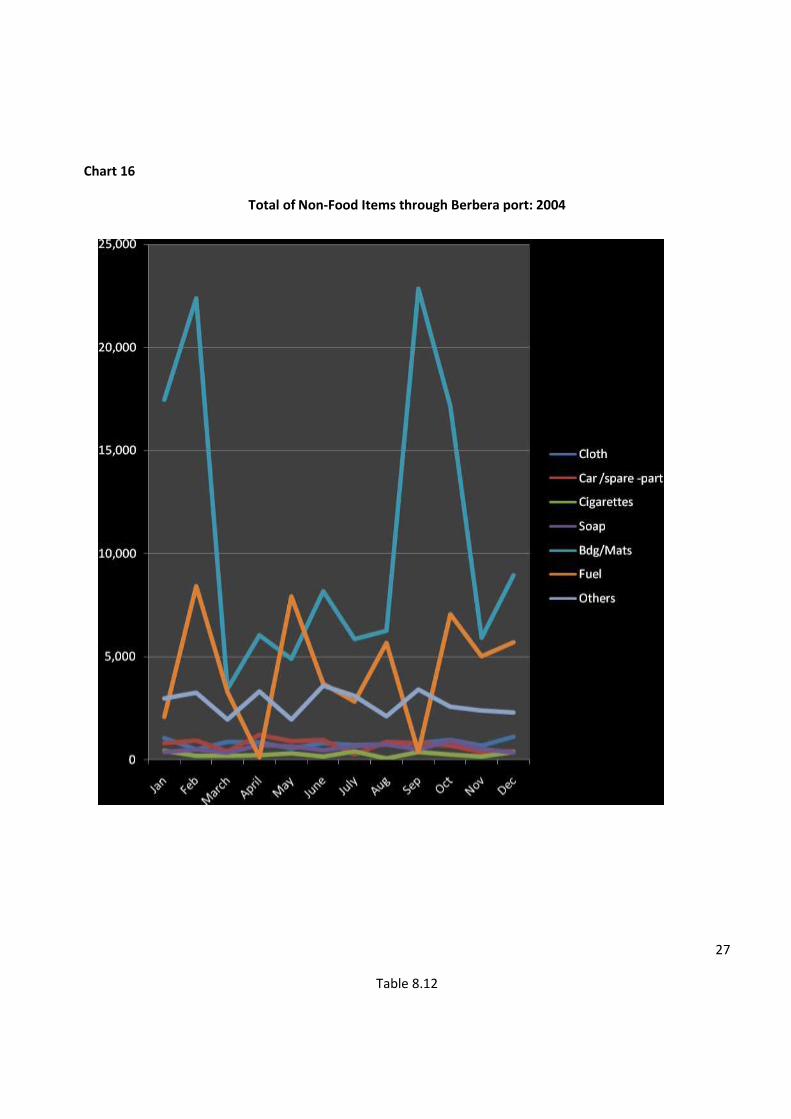
Chart 16
Total of Non-Food Items through Berbera port: 2004
27
Table 8.12

Total of Food Items through Berbera port: 2005 (Tonnes)
Month
Sugar
Rice
Wheat flour
Wheat
Cooking oil and
beans oil
Pasta
Dates
Biscuits
Jan
18,984
16,840
1,036
0
3,067
2,719
78
225
Feb
8,443
4
3858
0
2,014
1,691
63
320
March
14,007
0
1,317
0
3,542
1,205
112
215
April
11,987
2
4814
0
3,280
561
128
132
May
45
4,956
6,661
714
2,823
1,260
111
156
June
82
8,523
2,470
0
890
403
52
332
July
4,514
10,013
580
0
1,009
1,251
103
185
Aug
15,917
800
4,450
7
1,085
1,203
47
325
Sept
48,140
5,715
2830
126
2,559
420
1,201
187
Oct
323
982
8,793
0
1,530
428
199
181
Nov
0
2,115
7,619
58
2,704
1,183
108
324
Dec
6,999
604
3,594
0
3,548
1,690
102
260
Total
129,441
50,555
48,022
905
28,031
14,1014
2,305
2,842
28
Chart 17

Total of Food Items through Berbera port: 2005
29

Table 8.12
Import of commodities through Berbera port: 2005 (Tonnes)
Month
Clothes
Car /spares &
Cigarettes
Soap
Bdg/Mats & Cements
Fuel & Eng. Oil
Others
Jan
888
279
227
945
8,873
4,529
3,462
Feb
1,248
655
167
647
16,536
5,411
3,277
March
864
699
289
1,235
4,032
2,120
3,910
April
900
683
257
432
5,700
8,695
3,838
May
707
396
142
448
12,916
63
3,169
June
366
367
166
841
12,227
88
2,614
July
844
553
181
326
5,208
197
3,987
Aug
661
482
417
950
17,448
7,813
3,004
Sep
706
635
217
781
19,441
4,668
3,376
Oct
862
523
225
486
6,827
1,234
2,233
Nov
1,964
607
340
1,356
29,532
8,463
5,245
Dec
1,721
568
479
1,045
11,896
238
4,471
Total
11,731
6,449
3,107
9492
152,636
48,519
42,586
Source: Berbera Port Authority.
30

Chart 18
Total of Non-Food Items through Berbera port: 2005
31

Table 8.13
Total of Food Items through Berbera port: 2006
(Tonnes)
Month
Sugar
Rice
Wheat flour
Wheat
Cooking oil &Oil beans
Pasta
Dates
Biscuits
Jan
29,609
13,843
3,804
0
1,326
874
112
102
Feb
5,946
8,880
6,031
0
450
301
261
347
March
121
4,968
4,435
0
3,580
2,946
313
494
April
27,062
1,160
5,696
0
1,134
1,321
107
197
May
5,048
2,059
1,000
295
2,597
2,669
363
322
June
8,501
7,798
1,907
1,070
3,331
2,147
56
128
July
22,119
10,215
2,998
0
1,005
1,427
96
491
Aug
5,700
8,396
6,237
0
3,060
1,198
234
0
Sept
13
77
1,578
160
2,200
1,908
694
439
Oct
21,918
8,500
7,994
0
1,746
2,512
801
241
Nov
--0-
19,920
1,369
117
473
418
0
300
Dec
--0-
1,280
6,628
0
1,669
1,823
8
605
Total
126,037
87,996
49,677
1,642
22,571
19,544
3,045
3,666
32

Chart 19
Total of Food Items through Berbera port: 2006
33

Table 8.13 (Continued)
Total of Non-Food Items through Berbera port: 2006 (Tonnes)
Month
Cloth
Car /spare -part
Cigarettes
Soap
Bdg/Mats
Fuel
Others
Jan
1,002
357
243
1,268
13,983
4,517
2,665
Feb
1,273
1,563
166
827
17,146
1,938
3,788
March
1,232
966
338
2820
6,145
338
5,516
April
1,193
733
105
799
11,656
4,074
3,086
May
1,563
288
249
409
10,280
4,554
4,294
June
1,322
800
155
1,044
8,346
1,404
4,294
July
923
635
541
963
7,768
163
6,833
Aug
1,413
562
408
273
10,168
41
5,230
Sep
1,813
1,297
295
330
13,263
8,048
7,204
Oct
1,828
881
309
513
1,770
9,003
6,535
Nov
1,639
347
288
1,017
6,727
1,987
4,826
Dec
1,484
881
378
2,215
26,800
7,665
5,261
Total
16,685
8,310
3,475
12,478
138,152
43,732
59,532
Source: Berbera Port Authority.
34

Chart 20
Total of Non-Food Items through Berbera port: 2006
35

Table 8.14
Total of Food Items Through Berbera port: 2007 (Tonnes)
Month
Sugar
Rice
Wheat flour
Wheat
Oil beans & C/ oil
Pasta
Dates
Biscuits
Jan
15,673
5
802
0
1,603
1,062
90
123
Feb
22,973
12,287
897
0
1,894
1,648
178
385
March
40,450
7,594
5,485
0
3,787
2,062
201
450
April
16,091
6,129
8,666
0
1,530
2,880
233
230
May
-0-
741
8,160
1,343
4,089
1,830
330
486
June
646
--0—
3,005
0
909
1,777
105
89
July
12,206
9,106
892
1,476
5,264
2,156
190
115
Aug
11,591
880
1,971
592
3,036
1,398
881
281
Sept
18,657
19,041
6,011
0
3,996
807
960
296
Oct
-0-
1,108
1,392
0
2,037
628
387
154
Nov
6,477
25,323
4,938
0
461
1,069
114
241
Dec
29,312
5,548
4,598
0
4,782
1,716
197
698
Total
174,076
89,762
46,817
3,411
33,388
19,033
3,866
3,548
Source: Berbera Port Authority.
36

Chart 21
Total of Food Items through Berbera port: 2007
37

Table 8 .14 (Continued)
Import of Non-Food commodities through Berbera port: 2007 (Tonnes)
Month
Clothes
Car spares
Cigarettes
Soap
Bdg/Mats
Fuel
Others
Jan
1,332
443
418
1,274
13,983
91
7,100
Feb
1,675
780
435
2,700
17,146
72
7,066
March
989
930
953
1,067
10,145
2,998
8,671
April
1,009
1,102
623
377
11,656
4,366
5,161
May
1,211
884
686
627
10,280
87
6,697
June
1,011
422
395
301
9,346
90
3,832
July
1,031
942
952
824
7,768
245
6,810
Aug
2,071
873
555
733
10,168
138
9,424
Sept
578
897
368
63
13,263
10,452
4,278
Oct
1,600
401
511
1,143
1,770
1,631
4,938
Nov
2,266
995
754
418
6,727
165
7,857
Dec
1,449
737
679
804
32,900
108
7,533
Total
16,222
9,406
7,329
10,331
138,152
20,443
79,367
Source: Berbera Port Authority.
38
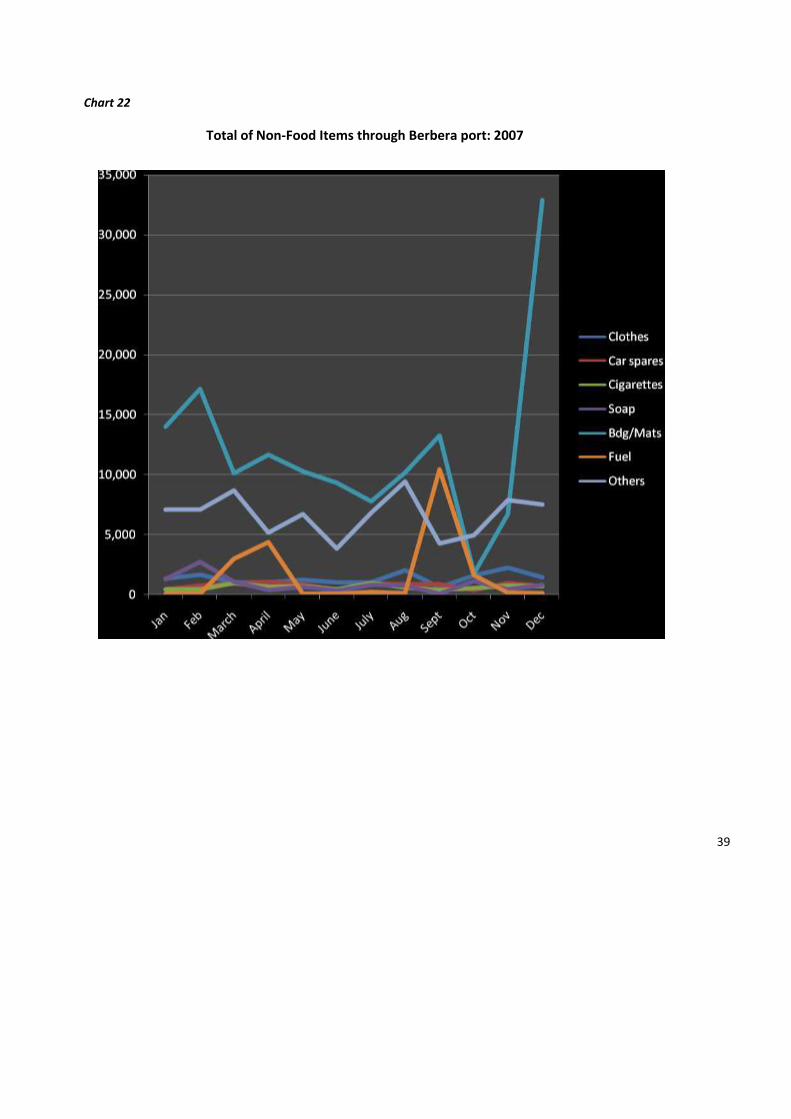
Chart 22
Total of Non-Food Items through Berbera port: 2007
39

Table 8.15
Some of the Indicators Imported on Yearly Comparison (TONNES)
Sugar Rice Wheat Flour Bdg/Mats Fuel
2003 100,831 69,112 40,357 124,528 47,555
2004 162,053 68,001 38,462 122,210 52,188
2005 129,441 50,555 48,022 152,636 48,519
2006 126,037 87,996 49,677 138,152 43,732
2007 174,076 89,762 46,817 138,152 20,443
Source: Berbera Port Authority.
Chart 23
Some of the Indicators Imported on Yearly Comparison Tones
40

Table 8.16
Import Containers through Berbera Port 2004-------2007
Year Size 20 Size 40 TEU Weight (Kg)
2004 3,032 875 4,782 71,117,795
2005 3,499 1,153 5,805 88,060,113
2006 3,737 1,476 6,689 106,060734
2007 4,437 1,378 7,193 125,079,414
Source: Berbera Port Authority.
Chart 24
Import Containers through Berbera Port 2004-------2007
41

Table 8.17
Export of goats and sheep through Berbera Port 2003----2007
Month 2003
2004 2005 2006 2007
Jan
122,950 176,326 130,231 99,956 42,618
Feb
61,046 35,573 66,856 58,011 73,699
March
22,655 25,207 19,749 86,187 38,927
April
12,035 35,176 45,458 66,784 15130
May
22,971 42,030 54,799 67,553 73,832
June
16,502 39,800 36,335 56,919 35315
July
27,306 59,041 67,537 85,879 76,879
August
24,817 55,874 75,918 75,108 110,689
Sept
49,863 53,501 54,266 92,324 106,531
Oct
40,262 73,023 142,554 108,187 113,348
Nov
72,819 92,677 119,982 92,959 315,867
Dec
67,720 17,128 216,410 309,744 347,219
Total
540,946 858,358 1,030,095 1,199,611 1,350,054
Source: Berbera Port Authority
Chart 25
Total Export of goats and sheep through Berbera Port 2003----2007
42

Table 8.18
Export of Cattle through Berbera Port: 2003----2007
Month 2003
2004 2005 2006 2007
January 10,293
14,840 14,895 9,142 5,295
Feb 5,003
9,435 11,303 8,628 6,323
Mach 3,273
10,782 12,934 6,020 3,244
April 1,566
10,985 8,650 4,005 1,151
May 2,518
7,461 8,174 3,942 4,728
June 3,866
8,390 7,347 3,803 9,593
July 6,591
11,950 8,893 8,871 10,103
August 3,694
9,829 10,698 7,786 8,605
September 7,835
9,942
8,643
11,207
9,119
October 7,726
10,386 17,547 8,723 7,841
November 9,519
13,085 15,760 10,388 10,788
December 13,961
14,821 23,617 15,115 11,353
Total 75,845
131,869 148,061 97,631 88,143
Source: Berbera Port Authority
Chart 26
Total Export of Cattle through Berbera Port: 2003----2007
43

Table 8.19
Export of livestock through Berbera Port: 2003----2007
Month 2003
2004 2005 2006 2007 Total
January 136,190
191,166 144,926 109,661 49,240
February 68,205
46,026 80,159 68,523 81,371
March 28,101
37,239 32,683 96,477 43,958
April 13,601
46,171 55,176 75,173 17,513
May 27,894
50,116 62,873 72,371 78,990
June 21,168
48,916 44,159 62,425 46,428
July 36,465
70,991 77,361 95,773 88,373
August 29,910
65,703 86,944 85,177 120,291
September 60,842
64,971 63,355 106,225 117,089
October November
50763 82,188
83,409 106,752
160,436 13,050
118,362 105,558
121,116 327,566
December 83,188 184,949 243,003 325,382
359,407
TOTAL 638,665 997,357
1,183,225 1,321,107 1,452,442
Source: Berbera Port Authortity
Chart 27
Total Export of livestock through Berbera Port: 2003----2007
44

Table 8.20
Export of Camel through Berbera Port 2003---2007
Month 2003 2004 2005 2006 2007
Jan
2,947 0 0 563 1,327
Feb
2,156 1,018 0 1,884 1,3499
March
2,173 1,250 0 4270 1,787
April
--0- --0- 1,068 4,384 1,232
May
2,405 625 0 876 430
June
800 726 477 1703 1,620
July
2568 -0- 1,131 1,023 1,391
August
1,399 -0- 328 2,283 997
September
3,144 1528 446 2,694 1,439
October 2,775 0 335 1,452 927
November --0- 1009 308 2,211 911
December 1,507 0 976 522 835
Total 21,874 7,132 5,069 23,865 14,245
Source: Berbera Port Authority
Chart 28
Total Export of Camel through Berbera Port 2003---2007
45

Table 8.21
Export of hide and skin pieces through Berbera Port: 2003—2007 (Piece)
Month 2003 2004 2005 2006 2007
January 200,728 207,056 229,406 276,695 35,600
February 202,600 308,860 413,633 181,896 140,126
March 308903 175,043 328,913 330,827 206,949
April 92,323 283,032 234,615 37,320 107,625
May 210,000 369,669 340,326 243,755 203,220
June 228325 261,000 103,040 78,849 62,000
July 0 358,030 313,280 210,761 192,027
August 282,780 564,853 227,310 75,409 328,069
September 132,650 419,260 84,942 170,075 362,650
October 1,60565 335,953 121,915 136,470 232,352
November 68,563 225,804 484,311 223,983 287,356
December 80,100 347,420 232,032 124,580 451,401
Total 1,971,577 3,762,942 3,123,723 2,090,620 2,609,375
Source: Berbera Port Authority
Chart 29
Total Export of hide and skin pieces through Berbera Port: 2003--2007
46

Table 8.22
Export of Beeyo through Berbera Port: 2003----2007 ( Kg)
Month 2003 2004 2005 2006 2007
January 2000 0 13,870 31,655 0
February 400 0 14,000 21,261 67,482
March 4000 4,600 0 49,325 33,900
April 0 0 29,000 70,535 157,500
May 0 16,400 3,750 65,215 66,500
June 3000 4,610 29,000 25,590 3,500
July 0 4,550 10,600 50,000 129,920
August 2000 24,809 22,580 1,200 52,460
September 3,400 5,200 15,345 29,829 1,940
October 0 25,560 5,700 780 19,400
November 6,240 17,460 74,435 75,821 32,104
December 0 25,300 54,440 1,800 50,000
Total 21,040 171,499 272,720 423,011 614,706
Source: Berbera Port Authority.
Chart 30
Total Export of Beeyo through berbera Port: 2003----2007 ( Kg)
47

Table 8.23
Berbera Port Traffic: 2003----2007 (NO)
Year Dhows Ships Total
2003
72 146 218
2004
106 340 446
2005
114 340 454
2006
148 329 477
2007
104 278 382
Source: Berbera Port Authority
Chart 31 Total Berbera Port Traffic: 2003----2007 (NO)
48
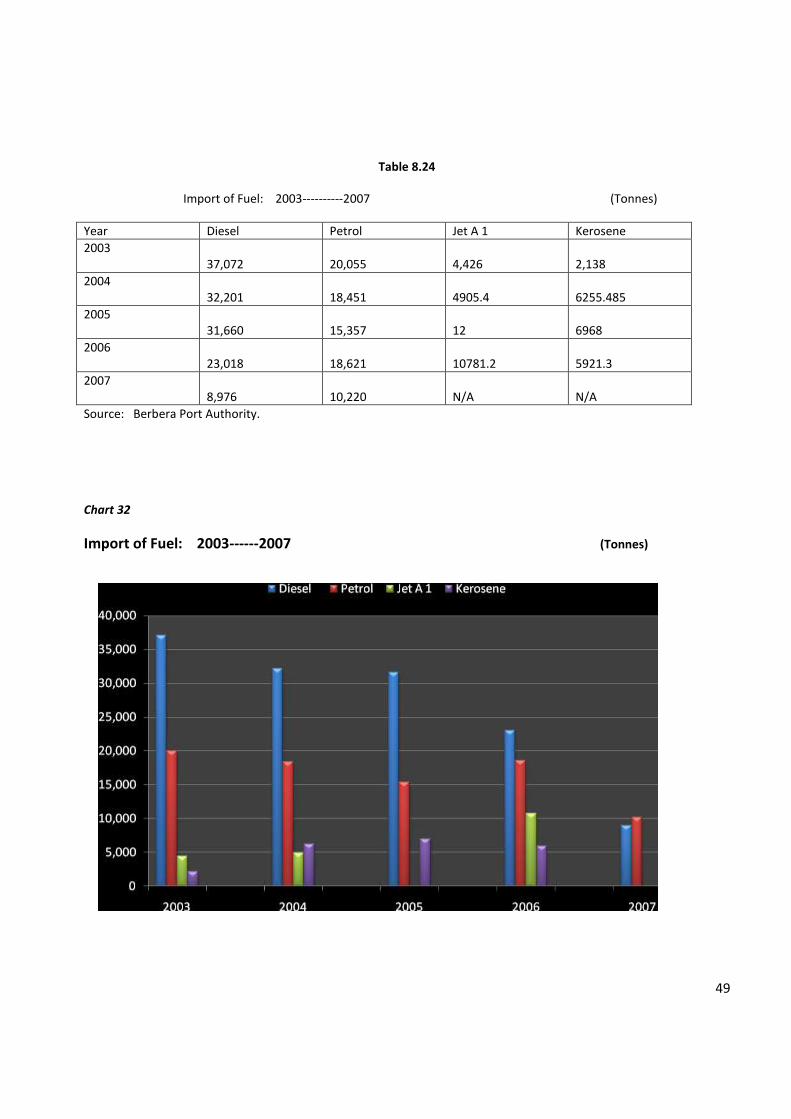
Table 8.24
Import of Fuel: 2003----------2007 (Tonnes)
Year Diesel Petrol Jet A 1 Kerosene
2003 37,072
20,055
4,426
2,138
2004 32,201
18,451
4905.4
6255.485
2005 31,660
15,357
12
6968
2006 23,018
18,621
10781.2
5921.3
2007 8,976
10,220
N/A
N/A
Source: Berbera Port Authority.
Chart 32
Import of Fuel: 2003------2007 (Tonnes)
49

9. TRANSPORT AND COMMUNICATION Table 9.1
Traffic Movement Statistics for Major Airports: 2006
Month Commercial Passenger Non –Commercial Passenger Commercial CGO
PAX In PAX out
Total PAX In PAX Out
Total CGO in Kg CGO Out Kg
January 2303 2,022 4,325 0 0 0 126,622 0
February 1,830 1,574 3,404 0 0 0 155,950 0
March 2,670 2,460 5,130 441 410 851 178,620 0
April 1,945 2,035 3,980 479 402 881 104,045 79,283
May 3,651 1,884 5,535 75 93 68 77,905 71,800
June 3,571 1,732 5,303 78 100 178 62,360 73,400
July 4,060 2,206 6,266 534 481 1,015 67,395 94,300
August 2,894 3812 6,706 484 591 1,075 246,995 64,412
September 1,960 2,734 4,694 225 216 441 207,018 66,145
October 1,515 1,595 3,110 156 159 315 207,018 54,775
November 2,142 2,523 4,665 410 302 712 171,610 78,577
December 2,798 2,910 5,708 345 278 623 158,000 105,154
Total 31,339 7,487 58,826 3,227 3,032 6,259 1,763,538 687,846
Source: Ministry of Civil Aviation & Air Transport.
Chart 33
Passenger Movement for major Airports (2006) Cargo Movement (In/Out)
50

Table 9.2
AIR TRAFFIC VOLUME: 2006
Operators
II-18
AN-12
AN-08
AN-26/24
FK-50
DC--9
L-410
BE-20/19
Others
DAALO
366
194
DAMAL
STAR
GALAD
DJIBOUTI
50
180
CARGO FLIGHT
41
83
ETHIOPIA
206
JUBA
ECHO
264
UNCAS
38
Total TOTAL
457 83 - 374 206 - - 38 264
Source: Ministry of Civil Aviation and Air Transport.
51

Table 9.3
TRAFFIC MOVEMENT FOR MAJOR AIR PORTS: 2007
Commercial Passenger Non-Commercial Passenger Commercial CGO
Month PAX IN PAX OUT
Total PAX IN PAX OUT
Total CGO IN CGO out
January 4759 4995 9,754 602 322 924 137,000 -
February 2616 2903 5,519 372 326 698 178000
March 2913 2975 5,888 169 191 360 136900
April 5294 3442 8,736 511 453 964 137797 79283
May 3881 3745 7,626 --- ----- --- 119859 71800
June 8357 5072 13,429 947 631 1,578 33993 73400
July 9759 6167 15,926 906 632 1,538 85334 94300
August 6858 6867 13,725 720 415 1,135 112303 64412
September 5731 7265 12,996 832 877 1,709 259204 66145
October 5529 4742 10,271 709 771 1,480 203954 54775
November 6432 5389 11,821 927 881 1,808 168188 78577
December 8266 7815 16,081 692 698 1,390 243603 105154
Total 70,395 61377 131,772 7387 6197 13,584 1836135 687846
Source: Ministry of Civil Aviation and Air Transport.
Chart 34
Passenger Movement for major Airports (2007) Cargo Movement (In/Out)
52

Table 9.4
Aircraft Traffic Volume 2007
Operator 11-8 An-12 An-08 AN26/24 FK-50 DC-9 L-410 BE20/19 Total
Daalo
359
9
0
495
0
0
0
0
863
Damal
-
-
-
Djibouti
21
0
0
242
0
0
0
0
263
Cargo flights
95
76
-
2
0
0
0
0
173
Air Express
157
157
Ethiopia
211
211
Juba
146
146
EU
412
412
UNCAS
346
346
Others
10
Total
621
85
0
739
211
157
0
758
2,581
Sources: Ministry of Civil Aviation and Air Transport.
53

10. EDUCATION
The current education system is based on a primary level with eight grades followed by a secondary level
with four grades. Overall, the number of Students enrolled in Primary, Secondary schools and Universities in
Somaliland continues to grow.
Table 10.1
Growth of public and Private Education 1997/98----2006/2007
Year Primary schools
Secondary schools
Family life
Vocational
Universities
1997/98 165 3 11 2 1
1998/99 144 5 13 3 2
1999/00 174 13 13 4 2
2000/01 294 15 13 4 2
2001/02 307 16 17 4 2
2002/03 353 20 24 4 2
2003/04 385 29 33 4 2
2004/05 412 35 33 2 3
2005/06 516 43 N/B 2 5
2006/2007 N/A 44 N/A 2 6
Source: Ministry of Education.
Chart 35
Growth of public and Private Education 1997/98----2006/2007
54

10.1 PRIMARY EDUCATION
Operational of primary schools have increased in number by 56% Compared to last year 04/05.
Most of the schools were constructed by International Community.
Table 10.2
Growth of Primary Education (Public and Private) 1998/99----------2006/2007
Year Schools classes Male Female Total Teachers
1998/99 144 887 26,356 9,641 35,997 960
1999/00 174 1,106 32,720 12503 45,223 1,167
2000/01 222 1,893 38,106 14,819 52,925 1,921
2001/02 307 2,078 56,951 27,723 84,674 2,062
2002/03 354 2,386 63,912 32,294 96,206 2,346
2003/04 385 2,65 70,617 35,863 106,480 2,590
2004/05 412 2586 79,878 38,438 118,316 2,801
2005/06 516 3,277 85,665 51,091 136,756 3,941
2006/07 N/A N/A 94,627 56,873 151,500 N/A
Source: MINISTRY OF EDUCATION.
Chart 36
Growth of Primary Education (Public and Private) 1998/99----------2006/2007
55

Table 10.3
Distribution of primary education by region: 2005/2006
Region Schools Classes Student Enrolment Teachers
Male Female FM Total Male Female
AWDAL 72 424 10,679 5956 16,635 426 44
M.JEEX 183 1366 39,107 22,493 61,600 1456 206
SAHIL 38 166 3,917 2158 6,075 176 29
TOGDHEER 75 517 18,590 12,320 30,910 791 68
SOOL 59 458 6,764 4,088 10,852 276 22
SANAAG 89 346 6608 4079 10,687 398 49
TOTAL 516 3277 85,665 51,094 136,759 3,523 418
SOURCE: MINISTRY OF EDUCATION
Chart 37
Distribution of primary education by region: 2005/2006
56

Table 10.4
Primary Education Students Enrolment by Region: 2005/06
Region Students Enrolment Urban Rural
Awdal 16,635 13,088 3,547
Maroodi Jeex 61,600 50,369 11,231
Sahil 6,075 3,120 2,955
Togdheer 30,910 20,179 10,731
Sanag 10,852 5,843 5,009
Sool 10,687 6,986 4,701
Total 136,759 99,585 37,174
Source: Ministry of education
Chart 38
Primary Education Students Enrolment by Region (Urban and Rural): 2005/06
57

Table10.5
Primary Education—Distribution of students by Gender and Region “005/006
Region URBAN RURAL
Male Female Male Female
Maroodi Jeex 31,300 19,096 7,807 3,397
Awdal 8,784 4,304 1,895 1,652
Sahil 2,703 1,396 1,214 762
Togdheer 9,751 10,428 8,839 1,892
Sanag 3,498 2,568 3,110 1,511
Sool 4,299 2,687 2,465 1,401
Total 60,335 40,479 25,327 10,615
Source: Ministry of Education
Chart 39
Primary Education—Distribution of students by Gender and Region “005/006
58

Table 10.6
Primary and Secondary examination results (national): 05/06 and 06/07
Year Type Schools Students Passed Failed Absent
2005-2006 Grade 8 Form 4
75 23
4,480 2,010
3,717 1,689
597 228
141 93
Total 98 6,490 5,406 825 234
2006-2007 Grade 8 Form 4
88 27
5,231 2,468
4,751 2,370
369 16
101 82
Total 115 7,699 7,121 385 183
Source: Ministry of Education.
Chart 40
Primary and Secondary examination results (national): 05/06 and 06/07
59

10.2 SECONDARY EDUCATION
Table 10.2.1 Growth of Secondary Education (Public and private): 1996/97--------2006/2007
Sou
rce:
Min
istry
of
Edu
cati
on
60
+ +
No. of Schools
No. of Classes
Student enrolment Teacher
Male Female Total
1996/97 3 7 278 51 329 29
1997/98 3 19 778 139 917 37
1998/99 5 28 1,065 178 1,243 59
1999/00 13 69 2,246 526 2,772 127
2000/01 15 98 3,548 832 4,380 174
2001/02 16 123 4,700 1,052 5,752 232
2002/03 2003/04
24 30
178 225
7,502 8,458
1,664 2,315
9166 10,773
294 358
2004/05
35
233
9,254
2,590
11,844
300
2005/06 43 243 10,565 3,204 13,769 315
2006/07
44
253
11,681
3,732
15,413
325

Chart 41
Growth of Secondary Education (Public and private): 1996/97--------2006/2007
61

Table 10.2.2
Public and Private Secondary Schools Distribution by region: 05/06--------06/07
Region Form 1-4
2005/2006 2006/2007
Sch. Male Female Total Sch. Male Female Total
Maroodi Jeex
1-4
21
5990
1706
7696
26
6261
1770
8031
Awdal
1-4
5
1772
656
2428
6
1898
793
2691
Sahil
1-4
4
709
229
938
3
622
127
749
Togdheer
1-4
6
899
222
1121
3
659
146
805
Sanag
1-4
4
700
228
928
4
633
217
850
Sool
1-4
3
495
163
658
3
494
162
656
Total
43
10,565
3,204
13,769
44
11,681
3,732
15,413
Source: Ministry of Education.
62

Chart 42(A)
Total of Public and Private Secondary Schools Distribution by region: 05/06
Chart 42(B)
Public and Private Secondary Schools Distribution by region: 06-07
63

10.3. HIGHER EDUCATION
Amoud University
Amoud University is located in Amoud Valley, 4.5 kilometres east of Borama in the Awdal Region of
Somaliland, on the campus of the prestigious former Amoud Secondary School. The idea of establishing
Amoud University was conceived by the intellectuals and elders of Somaliland, particularly of the Awdal
region. It was formally proposed in a workshop in Borama on 6th August 1996. The workshop agreed to the
proposed and adopted a resolution for the establishment of Amoud University.
Amoud University officially started functioning in September 1997. Presently,the faculties of education,
medicine, business and public administration, agriculture, law, financial planning , sharia and information
technology are established and preparations are underway for the faculties of Economics and Engineering
etc.
Table 10.3.1
Number of students enrolled at Amoud University: 2007
Faculties Freshman Sophomore Junior Senior TM TF Gr.Tatal
Business 91 37 50 123 55 178
Education 40 29 20 65 24 89
Agriculture 66 40 52 119 39 158
Medicine 32 36 25 23 104 26 116
Sharia and Law
54
50
-0-
-0-
74
30
104
Freshman 210 -0- -0- -0- 150 60 210
Total 296 283 131 145 635 234 855
Source: Amoud University.
Chart 43
Grand total of Male and Female Number of students enrolled at Amoud University :2007
64

Table 10.3.2
Number of Students graduated from Amoud University: 2004--2007
Year Faculties Male Female Total
2004 Business 50 21 71
2004 Education 1 11 12
2005 Business 60 23 83
2005 Education 49 5 54
2006 Busines 64 28 92
2006 Education 55 11 66
2007 Business 72 24 96
2007 Education 40 14 54
2007 Medicine 4 1 5
Total 395 138 533
Source: Amoud University.
Chart 44
Number of Students graduated from Amoud University: 2004--2007
65

Hargeisa University Hargeisa University was established 0n 23rd October 2000 in the capital of Somaliland (Hargeisa).It was second University formed. Regular classes started on 1st November 2000.His Excellency the late Mr Mohammed H. Ibrahim Egal, the former President of the Republic of Somaliland, inaugurated the University during its official opening ceremony. Presently the faculties are business, law, medicine, Islamic study, sciences & information technology. Future plans of the University include the establishment of Engineering and Economics etc. Table 10.3.3 Number of Students enrolment at Hargeisa University: 2007
Faculties Freshman Sophomore Junior Senior TM TF G.Total
Business 595 281 260 148 1004 280 1284
Islamic Studies
78
-0-
11
-0-
40
49
89
Science 85 25 8 22 119 21 140
Law 96 171 90 58 305 110 415
Information Technology
95
-0-
-0-
-0-
79
16
95
Medicine 31 25 37 20 86 27 113
Total 980 502 406 248 1633 503 2136
Source: Hargeisa University. Chart 45 Number of Students enrolment at Hargeisa University 2007 Grand total of Male and Female
66

Table 10.3.4 Number of Graduated students From Hargeisa University: 2004—2007
Year Faculty Male Female Total
2004 Business & Administration
49
9
58
2004
Science
6
3
9
2005
Business and Administration
28
13
41
2005 Science
2
1
3
2005 Islamic Studies
-0-
6
6
2006 Business & Administration
43
7
50
2006
Law
27
1
28
2007
Business & Administration
79
20
99
2007
Law
24 3 27
2007
Islamic Studies
--0--
7
7
Grand Total
258
70
328
Source: Hargeisa University. Chart 46
Number of Graduated students From Hargeisa University: 2004—2007
67

Burao University Burao University was established on September 2004.Burco University is located 2kilometers west of Burao,
on the campus of the prestigious former Institute of Rural and Environment. Currently the faculties of
education Veterinary, business, Islamic & law are established.Future plan of University include the
establishment of other faculties.
Table 10.3.5
Number of Students enrolment of Burao University 2007
Faculties Freshman Sophomore Junior Senior TM TF G.Total
Education 30 49 79 79
Veterinary 22 14 36 36
Business 49 16 11 10 19 50 86
Islamic and Law
40
45
37
58
85
Total 141 110 25 10 56 223 279
Source: Burco University.
Chart 47
Number of Students enrolment of Burao University 2007
68

Admas University Admas University was established by natives of Somalilanders on September 2006 as a response to the needs of the society of Somaliland. Admas University is affiliated autonomous branch of Adams University in Ethiopia, which is one of the mainly high-status private advanced learning institutions in Ethiopia. Presently the faculties are Accounting, Management, Economics,& ICT. Future plan of the University include an expansion into planning, Management, Education and Marketing. Table 10.3.6 Number of Students enrolment of Admas University 2007
Faculty Freshman Sophomore Junior Senior T M TF G. Total
ITC 167 94 194 67 261
Economic 106 44 129 21 150
Management 99 61 82 78 160
Accounting 81 90 113 58 171
Total 453 289 518 224 742
Source: Adams University. Chart 48 Number of students enrolled in Admas University. Grand total of Male and Female
69

Eelo American University
Eelo American University is situated in Borama, on the Campus of the honoured at Mahfuud`s Building. The
thought of establishing Eelo American University was conceived by intellectuals from Hashi family. Eel
American University officially started functioning on 17 September 2007. Presently, the faculties of
Engineering, Computer Science, and Management Science are established. Future plans of the University
include an expansion into Economics, Medicine, Law and Agriculture faculties etc.
Table 10.3.7
Number of students enrolled at Eelo American University: 2007
Faculty Freshman Sophomore Junior Senior TM TF Total
Engineering 79 76 3 79
Computer Science
137
98
39
137
Management Science
38
21
17
38
Total 254 196 59 255
Source: Eelo American University.
Chart 49
Number of students enrolled at Eelo American University: 2007. Grand total of Male and Female
70

Golis University
Golis university is located in west of Hargeisa city the capital of Somaliland .Golis university was established
on 2004 in Hargeisa, as non-profit making institution. Officially it was started on 2005 and was upgraded to a
University within 10 months of its opening. Presently, the faculties of Education, Engineering, ICT, Law, and
Criminal Justice & Police Science are established.
Table 10.3.8
Number of Students enrolment at Gollis University: 2007
Faculties Freshman Sophomore Junior Senior TM TF Total
Education 452 341 111 452
Engineering 38 52 29 117 2 119
ITC 45 11 41 15 56
Shari& Law 15 15 15
CJ& Police 43 33 10 43
Total 98 515 29 43 547 138 685
Source: Golis University.
Chart 50
Number of Students enrolment at Golis University: 2007 Grand total of Male and Female
71

11. Health The approximately 3.4million population of Somaliland is served by 24 Hospitals, 79 Health Centres and 157
health Posts. However the health sectors received the greatest amount of assistance from the International
Organizations.
Public Health. Table 11.3 Available health services facilities.
Selected
Indicator
Marood
Jeex
Sahil Awdal Togdheer Sanag Sool Total
Hospitals 3 3 2 2 3 2 15
Beds 550 250 380 270 130 140 1,720
MCH
Centres
24 6 15 18 8 8 79
Sources: Ministry of Health &Labour.
Table 11.4 Availability of health services Personnel.
Selected
indicators
Maroodi
Jeex
Sahil Awdal Togdheer Sanag Sool Total
Medical
Doctors
21 3 11 12 4 2 53
Nurses 132 10 17 46 24 4 233
Midwives 20 5 9 10 5 1 50
Lab.Technicians 7 1 2 3 1 1 15
Dental
Technician
1 0 0 0 0 0 1
X-ray Tech
nician
2 0 1 1 0 0 4
Physiotherapist 1 0 1 0 0 0 2
Auxiliary 111 51 46 68 40 9 325
Sources: Ministry Of Health & Labour
72

Table 11.3
Number of TB Patients in selected towns: 2003--------2007.
Selected Towns
2003
2004
2005
2006
2007
Total
Borama 212 529 475 422 320
Hargeisa 630 1925 2150 1849 1858
Berbera 200 583 282 202 210
Burco N/A 878 730 649 686
Gabilay N/a 208 162 161 144
Total 1,042 4,223 3,799 3,283 3,218
Source: Ministry of Health and labour.
Chart 51
Number of TB Patients in selected towns: 2003--------2007.
73

Table 11.4
Availability of Private Health Services: 2007
Selected towns
Name of Hospitals
Doctors
Nurses
Midwives
X-Ray Technicians
Beds
Laboratory technologists
Hargeisa Manhal Hospital
13 10 5 1 85 4
Magan Hospital
1 3 3 0 24 0
Red Sea Hospital
1
6
0
0
13
2
Ugbaad Maternity Hospital
1
1
3
0
12
1
Bukaankaal Hospital
2
3
0
0
22
2
Edna Maternity Hospital
5
6
20
0
50
4
Borama Alaale Hospital
3
3
3
2
30
2
General Total
26
32
34
3
236
15
Source: Private Health Sector.
74

12. Miscellaneous Table 12.1.1
12.1 Criminal Statistics in Somaliland: 2006-2007
SN. Region Number of Cases Number Cases
Convicted
Number of Cases Pending
2006 2007 2006 2007 2006 2007
Hargeisa 840 858 593 694 247 164
Gabiley 310 170 270 140 40 30
Awdal 316 345 259 292 57 53
Sahil 156 227 144 205 12 22
Togdheer 371 345 346 319 25 26
Sool 9 42 16 38 3 4
Sanag 260 250 240 220 20 30
Total 2272 2237 1868 1908 404 329
Source: Attorney General of Somaliland
75
12.2 Water
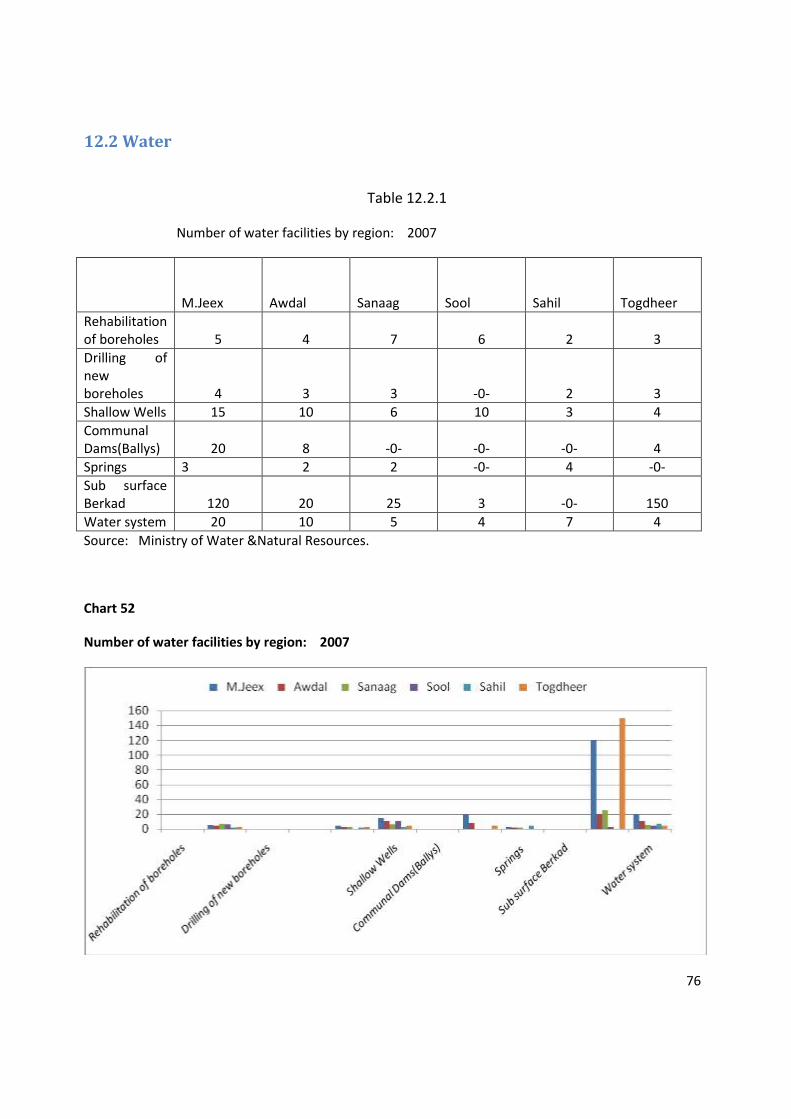
Table 12.2.1
Number of water facilities by region: 2007
M.Jeex
Awdal
Sanaag
Sool
Sahil
Togdheer
Rehabilitation of boreholes
5
4
7
6
2
3
Drilling of new boreholes
4
3
3
-0-
2
3
Shallow Wells 15 10 6 10 3 4
Communal Dams(Ballys)
20
8
-0-
-0-
-0-
4
Springs 3 2 2 -0- 4 -0-
Sub surface Berkad
120
20
25
3
-0-
150
Water system 20 10 5 4 7 4
Source: Ministry of Water &Natural Resources.
Chart 52
Number of water facilities by region: 2007
76

Table 12.3
Boreholes and their Functional status
Region Functioning Not Functioning Total
Marood Jeex 14 0 14
Awdal 6 4 10
Sanaag 15 11 26
Togdheer 11 2 13
Sahil 6 0 6
Sool 10 1 11
Total 62 18 80
Source: Ministry of Water & Natural Resources.
Chart 53
Functioning and Not Functioning Boreholes in Somaliland
77

Table 12.4
Exchange rate (base: USD) 2007
Month Buying Selling Agio
JAN 6.422.42 6,313.70 108.70
FEB 6,336.79 6,438.93 -102.14
MAR 6,319.03 6,443.06 -124.03
APR 6,305.00 6,447.00 -142.00
MAY 6,280.65 6,370.97 -90.32
JUN 6,306.67 6,408.33 -101.67
JUL 6,125.16 6,417.74 -770.81
AUG 6,288.71 6,425.48 136.77
SEP 6,085.00 6,203.33 118.33
OCT 6,032.26 6,156.45 124.19
NOV 5,803.33 5,953.33 150.00
DEC 5,620.97 5,744.19 116.77
Average 6,136.69 6,276.88 -48.02
Source: MNPC
CHART 54 EXCHANGE RATE (2007)
78

Chart 55 CERELEAS & BREAD(2007)
Source: MNP&C
CHATR 55 FUEL AND CHARCOAL (2007)
Source: MNP&C
79

CHART 56 KHAT (2007)
Source: MNP&C
80


![Case study - Charcoal production in Somaliland[1]](https://img.dokumen.tips/doc/110x75/58f280fb1a28abce018b458b/case-study-charcoal-production-in-somaliland1.jpg)