Embed Size (px)
Citation preview
EVALUATION: NOVEMBER 2015 PUBLICATION: JUNE 2017
JONATHAN LAIN
OXFAM GB
www.oxfam.org.uk/effectiveness
RESILIENCE IN ETHIOPIA AND SOMALILAND Impact evaluation of the reconstruction project ‘Development of Enabling Conditions for Pastoralist and Agro-Pastoralist Communities’
Effectiveness Review Series 2015/16
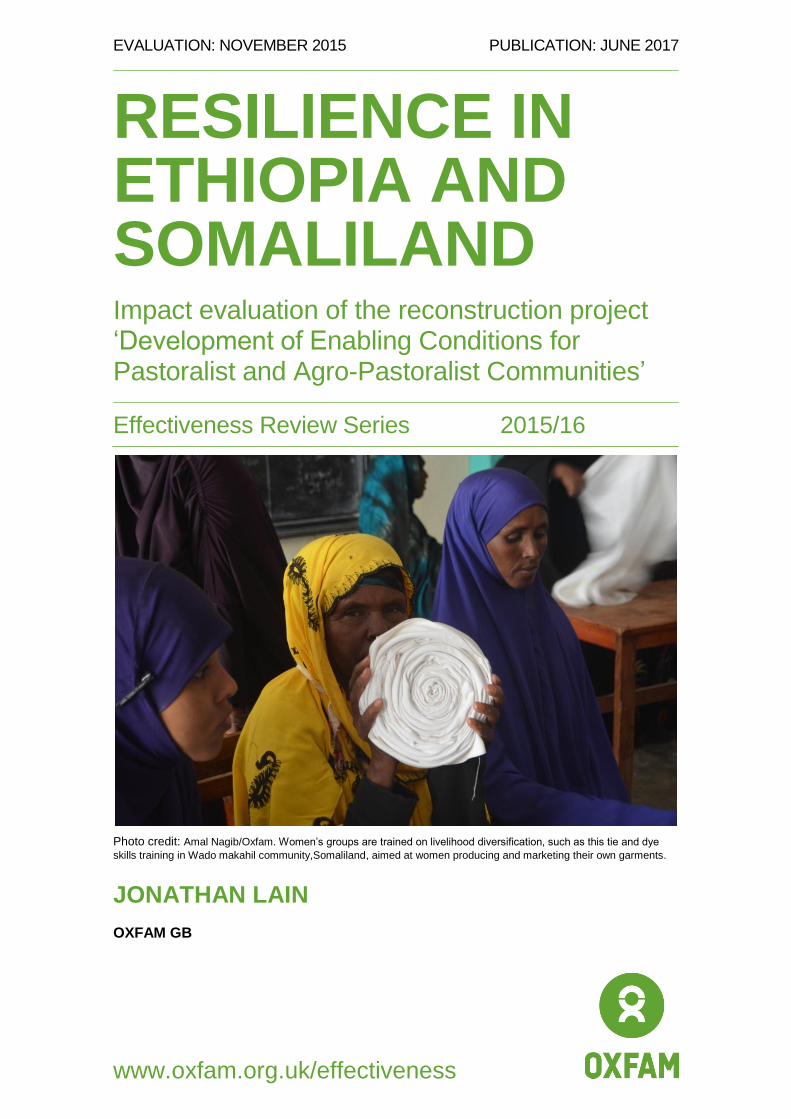
Photo credit: Amal Nagib/Oxfam. Women’s groups are trained on livelihood diversification, such as this tie and dye
skills training in Wado makahil community,Somaliland, aimed at women producing and marketing their own garments.

Resilience in Ethiopia and Somaliland: Impact evaluation of the reconstruction project ‘Development of Enabling
Conditions for Pastoralist and Agro-Pastoralist Communities’ Effectiveness Review Series 2015–16 2
ACKNOWLEDGEMENTS We would like to thank the staff of the partner organisations and of Oxfam in Ethiopia and
Somaliland for their support in carrying out this Effectiveness Review. Particular thanks are due
to Mohammed Ahmed Hussein, Million Ali and Muktar Hassan. Thanks are also due to Ahmed
Abdirahman and Abdulahi Haji, for their excellent leadership of the survey process. Additionally,
we are grateful to Kristen McCollum and Emily Tomkys for their support during the data
collection. Finally, we thank Rob Fuller for his vital comments on earlier drafts of this report.

Resilience in Ethiopia and Somaliland: Impact evaluation of the reconstruction project ‘Development of Enabling
Conditions for Pastoralist and Agro-Pastoralist Communities’ Effectiveness Review Series 2015–16 3
CONTENTS Acknowledgements .................................................................................................... 2
Executive Summary .................................................................................................... 4
1 Introduction ............................................................................................................ 11
2 Project Description ................................................................................................ 13
3 Evaluation design .................................................................................................. 17
4 Data ......................................................................................................................... 19
4.1 Respondents interviewed .............................................................................. 19
4.2 Analysis .......................................................................................................... 22
5 Measuring Resilience in Ethiopia and Somaliland .............................................. 24
6 Results .................................................................................................................... 29
6.1 Introduction .................................................................................................... 29
6.2 Involvement in project activities ................................................................... 30
6.3 Livestock ........................................................................................................ 35
6.4 Crops .............................................................................................................. 39
6.5 Non-Farm Activities ....................................................................................... 41
6.6 Responses to Drought ................................................................................... 43
6.7 Wealth ............................................................................................................. 44
6.8 Indicators of Resilience ................................................................................. 45
6.8.1 Dimension 1: Livelihood viability .................................................................... 48
6.8.2 Dimension 2: Innovation potential .................................................................. 49
6.8.3 Dimension 3: Access to contingency resources and support ...................... 50
6.8.4 Dimension 4: Integrity of the natural and built environment ........................ 52
6.8.5 Dimension 5: Social and institutional capability ........................................... 53
7 Conclusions ........................................................................................................... 56
7.1 Conclusions ........................................................................................................ 56
7.2 Programme learning considerations ................................................................. 57
Appendix 1: Thresholds for characteristics of resilience ...................................... 59
Appendix 2: Baseline Statistics before matching................................................... 63
Appendix 3: Methodology used for propensity score matching ........................... 65
Appendix 4: Robustness checks ............................................................................. 69
Appendix 5: Subgroup Analysis .............................................................................. 85
Appendix 6: Weighting Exercise .............................................................................. 89
Bibliography .............................................................................................................. 90
Notes ......................................................................................................................... 91
Resilience in Ethiopia and Somaliland: Impact evaluation of the reconstruction project ‘Development of Enabling
Conditions for Pastoralist and Agro-Pastoralist Communities’ Effectiveness Review Series 2015–16 4
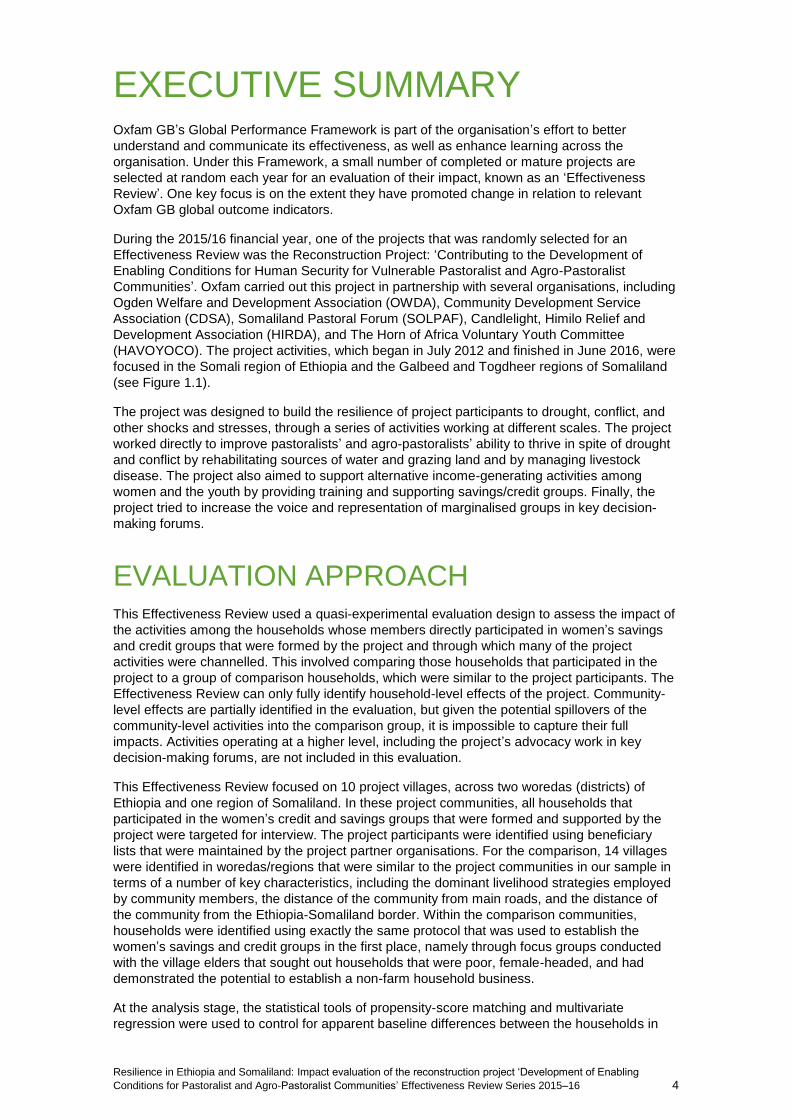
EXECUTIVE SUMMARY Oxfam GB’s Global Performance Framework is part of the organisation’s effort to better
understand and communicate its effectiveness, as well as enhance learning across the
organisation. Under this Framework, a small number of completed or mature projects are
selected at random each year for an evaluation of their impact, known as an ‘Effectiveness
Review’. One key focus is on the extent they have promoted change in relation to relevant
Oxfam GB global outcome indicators.
During the 2015/16 financial year, one of the projects that was randomly selected for an
Effectiveness Review was the Reconstruction Project: ‘Contributing to the Development of
Enabling Conditions for Human Security for Vulnerable Pastoralist and Agro-Pastoralist
Communities’. Oxfam carried out this project in partnership with several organisations, including
Ogden Welfare and Development Association (OWDA), Community Development Service
Association (CDSA), Somaliland Pastoral Forum (SOLPAF), Candlelight, Himilo Relief and
Development Association (HIRDA), and The Horn of Africa Voluntary Youth Committee
(HAVOYOCO). The project activities, which began in July 2012 and finished in June 2016, were
focused in the Somali region of Ethiopia and the Galbeed and Togdheer regions of Somaliland
(see Figure 1.1).
The project was designed to build the resilience of project participants to drought, conflict, and
other shocks and stresses, through a series of activities working at different scales. The project
worked directly to improve pastoralists’ and agro-pastoralists’ ability to thrive in spite of drought
and conflict by rehabilitating sources of water and grazing land and by managing livestock
disease. The project also aimed to support alternative income-generating activities among
women and the youth by providing training and supporting savings/credit groups. Finally, the
project tried to increase the voice and representation of marginalised groups in key decision-
making forums.
EVALUATION APPROACH This Effectiveness Review used a quasi-experimental evaluation design to assess the impact of
the activities among the households whose members directly participated in women’s savings
and credit groups that were formed by the project and through which many of the project
activities were channelled. This involved comparing those households that participated in the
project to a group of comparison households, which were similar to the project participants. The
Effectiveness Review can only fully identify household-level effects of the project. Community-
level effects are partially identified in the evaluation, but given the potential spillovers of the
community-level activities into the comparison group, it is impossible to capture their full
impacts. Activities operating at a higher level, including the project’s advocacy work in key
decision-making forums, are not included in this evaluation.
This Effectiveness Review focused on 10 project villages, across two woredas (districts) of
Ethiopia and one region of Somaliland. In these project communities, all households that
participated in the women’s credit and savings groups that were formed and supported by the
project were targeted for interview. The project participants were identified using beneficiary
lists that were maintained by the project partner organisations. For the comparison, 14 villages
were identified in woredas/regions that were similar to the project communities in our sample in
terms of a number of key characteristics, including the dominant livelihood strategies employed
by community members, the distance of the community from main roads, and the distance of
the community from the Ethiopia-Somaliland border. Within the comparison communities,
households were identified using exactly the same protocol that was used to establish the
women’s savings and credit groups in the first place, namely through focus groups conducted
with the village elders that sought out households that were poor, female-headed, and had
demonstrated the potential to establish a non-farm household business.
At the analysis stage, the statistical tools of propensity-score matching and multivariate
regression were used to control for apparent baseline differences between the households in

Resilience in Ethiopia and Somaliland: Impact evaluation of the reconstruction project ‘Development of Enabling
Conditions for Pastoralist and Agro-Pastoralist Communities’ Effectiveness Review Series 2015–16 5
the project and comparison communities, to increase confidence when making estimates of the
project’s impact.
The primary aim of the Effectiveness Review was to investigate the project’s impact on building
resilience to shocks and stresses. This was assessed by identifying 36 characteristics that were
thought to be associated with resilience, for which data could be collected in the household
survey. These characteristics were formulated under Oxfam GB’s multidimensional framework
for measuring resilience, and developed through discussions with project staff and focus groups
conducted in local communities. In general, these indicators were chosen to focus on the
intermediate steps between project activities and final well-being outcomes, although some
measures of project outputs were included. It should also be noted that we sought to generate a
mix of indicators that were connected to the project’s Logic Model and those that were not. A full
list of indicators and a summary of the results for each is shown in Table 1.

Resilience in Ethiopia and Somaliland: Impact evaluation of the reconstruction project ‘Development of Enabling
Conditions for Pastoralist and Agro-Pastoralist Communities’ Effectiveness Review Series 2015–16 6
Table 1: Characteristics of resilience examined in this Effectiveness Review
Dimension Characteristic Connected
to
project
logic?
Evidence of
positive
impact?
Livelihood viability
Ownership of productive assets No Yes
Dietary diversity Yes Yes
Livelihood diversification Yes Yes
Crop diversification Yes Yes
Livestock herd size Yes Yes
Ownership of pack animal No No
Livestock vaccination Yes Yes
Access to CAHW Yes No
Ability to sell milk during the dry season Yes Yes
Ownership/renting of land No No
Innovation potential
Attitude to change No No
Access to credit Yes Yes
Awareness of climate change No No
Adoption of innovative practices No Yes
Access to markets No Yes
Growing new crop varieties Yes No
Access to
contingency
resources and
support
Awareness of drought preparedness plan Yes Yes
Group participation Yes Yes
Social connectivity No No
Awareness of local leaders’ plans No Yes
Savings Yes Yes
Remittances or formal earnings No Yes
Ownership of fungible livestock Yes Yes
Back-up animal feed Yes No
Integrity of natural
and built
environment
Availability of water Yes Yes
Separation of water sources No Yes
Availability of grazing land Yes Yes
Charcoal production practices Yes No
Social and
institutional
capability
Early-warning system Yes Yes
Effectiveness of local leaders Yes Yes
Support for adaptation No Yes
Women participate in community
discussions/gatherings Yes
No
Women have influence over household
decisions Yes
No
Youth participation in community decisions Yes No
Confidence in selling livestock across the
border Yes
No
Experience of disputes over resources Yes No
Resilience in Ethiopia and Somaliland: Impact evaluation of the reconstruction project ‘Development of Enabling
Conditions for Pastoralist and Agro-Pastoralist Communities’ Effectiveness Review Series 2015–16 7
RESULTS Our data suggest that the project improved the resilience of project households substantially.
Project households scored positively in 47 percent of the resilience indicators identified for this
Effectiveness Review, compared with just 37 percent for the comparison group. Vitally, there
were positive and statistically significant effects for the project households across all five of the
dimensions of resilience used in this Effectiveness Review, suggesting that the project achieved
a balanced approach to building resilience.
The resilience indicators used in this Effectiveness Review comprise a combination of ‘output-
related’ indicators that were relatively low down the project logic (and therefore more closely
related to the project activities) and outcome indicators that were higher up the project logic, as
well as some indicators that were not connected to the project logic at all. It is these higher-level
indicators that demonstrate how far the project was able to succeed along its Logic Model, and
are therefore of particular interest for this evaluation. Our data do not support the notion that the
project had a clear positive effect on the representation of women and youth, despite the
importance of these outcomes for the project logic. However, the results for a number of the
other important indicators of resilience were far more positive. For example, it is clear that
project households had larger herds, were more able to sell milk during the dry season, and had
a greater propensity to adopt innovations – although these indicators were part of the project
logic, they were relatively high up the causal chain and were not directly connected to the
project activities. Therefore, the positive results in this evaluation are not solely driven by low-
level ‘output-related’ indicators of resilience.
The project also had substantial effects on household wealth. In this Effectiveness Review,
wealth was understood as a final well-being outcome, which would improve despite shocks,
stresses and uncertainty, if and only if households were resilient. This result is particularly
striking, because changes to household wealth typically take a long time, but the survey work
for this evaluation was carried out before the Reconstruction Project had closed. However, it
should be borne in mind that this may partly be the result of a previous Oxfam project working
with similar participants in the same area.
There were a number of other aspects of the project logic that were lower down the causal
chain, which it was possible to investigate for this Effectiveness Review. Firstly, the project
households experienced a number of positive effects in terms of livestock. Not only were project
households’ herds larger, but also women’s control over these herds seemed to have been
improved by the project, measured in terms of the proportion of types of animals for which they
were mainly responsible. The proportion of animals that were vaccinated was also substantially
higher among the project households. However, the results around livestock sales were
somewhat equivocal, and did not necessarily fit with the project’s logic model.
Project households were moderately more likely to grow crops and had more diverse crop
portfolios, partly due to extra growth of elephant grass and qhoboc. However, the project did not
appear to affect women’s control over and responsibility for the crop portfolio, either at the
cultivation or the marketing stage. In part, this may be because the long-standing traditions that
influence which household members are responsible for the crop portfolio may take a long time
to change, and the Reconstruction Project had been working just three and a half years when
the fieldwork for this evaluation was carried out.
The project’s effects on non-farm livelihood strategies are among the strongest and most robust
positive results identified in this Effectiveness Review. Project households were substantially
more likely to engage in non-farm income-generating activities. It appears that these effects
were almost entirely driven by household businesses – such as petty commerce or tea shops –
many of which had business plans. Vitally, these positive differences between project and non-
project households are observed for female household members. This matches the project
logic.
One area where the results of this Effectiveness Review were more ambiguous was around
responses to drought. On the one hand, project households took some actions that were clearly
positive coping strategies, such as feeding their animals on husks. However, they were also
more likely to feed their animals on weeds, some varieties of which are unsuitable for livestock

Resilience in Ethiopia and Somaliland: Impact evaluation of the reconstruction project ‘Development of Enabling
Conditions for Pastoralist and Agro-Pastoralist Communities’ Effectiveness Review Series 2015–16 8
nutrition. It is possible, therefore, that this latter behaviour represents a more negative response
to drought.
The main results of this Effectiveness Review are summarised in Table 2.
Table 2: Key results of this Effectiveness Review
Outcome
area
Connected to
project
logic?
Evidence of
positive
impact?
Comments
Resilience
Livelihood viability
See Table 1
Yes
Most significant effects arose in terms of
livelihood diversification, livestock herd
sizes, and the ability to sell milk during
the dry season. No effect on project
households’ access to CAHWs, despite
its direct link to the project activities.
Innovation potential Yes
There was a positive effect on access to
credit in-line with the project logic. There
were also higher levels of adoption of
innovative practices and access to
markets among project households.
Access to contingency resources
and support access Yes
Many indicators around awareness of
disaster plans and group participation
were higher in project households, given
their direct connection to the project
activities. However, project households
were also more likely to receive
remittances/formal earnings.
Integrity of natural and built
environment Yes
Project households report having better
access to water and grazing land. They
are also more likely to use separate
water sources for human and animal
consumption.
Social and institutional capability Mixed
Positive effects reserved for indicators
directly linked to the Project Logic around
early-warning systems, local leaders, and
adaptation support. No evidence of
impact on the voice of women and youth.
Wealth No Yes
Wealth was higher for the project
households by approximately 0.6 of a
standard deviation. Wealth was
measured using information about
ownership of various assets (including
livestock, productive equipment and
household goods), as well as about
housing conditions.
Livestock Yes Yes
Herd sizes were higher in project
households, especially for sheep/goats
and cows. These effects were mainly
reserved for Somaliland. More of these
animals were vaccinated, and women
had more responsibility for these herds.
Crops Yes Yes
Project households had a more
diversified crop portfolio, but women’s
responsibility for crops was apparently
unaffected.
Non-farm livelihoods Yes Yes There were strong positive results
Resilience in Ethiopia and Somaliland: Impact evaluation of the reconstruction project ‘Development of Enabling
Conditions for Pastoralist and Agro-Pastoralist Communities’ Effectiveness Review Series 2015–16 9
suggesting that project households were
more likely to engage in non-farm
household businesses and to prepare a
formal business plan.
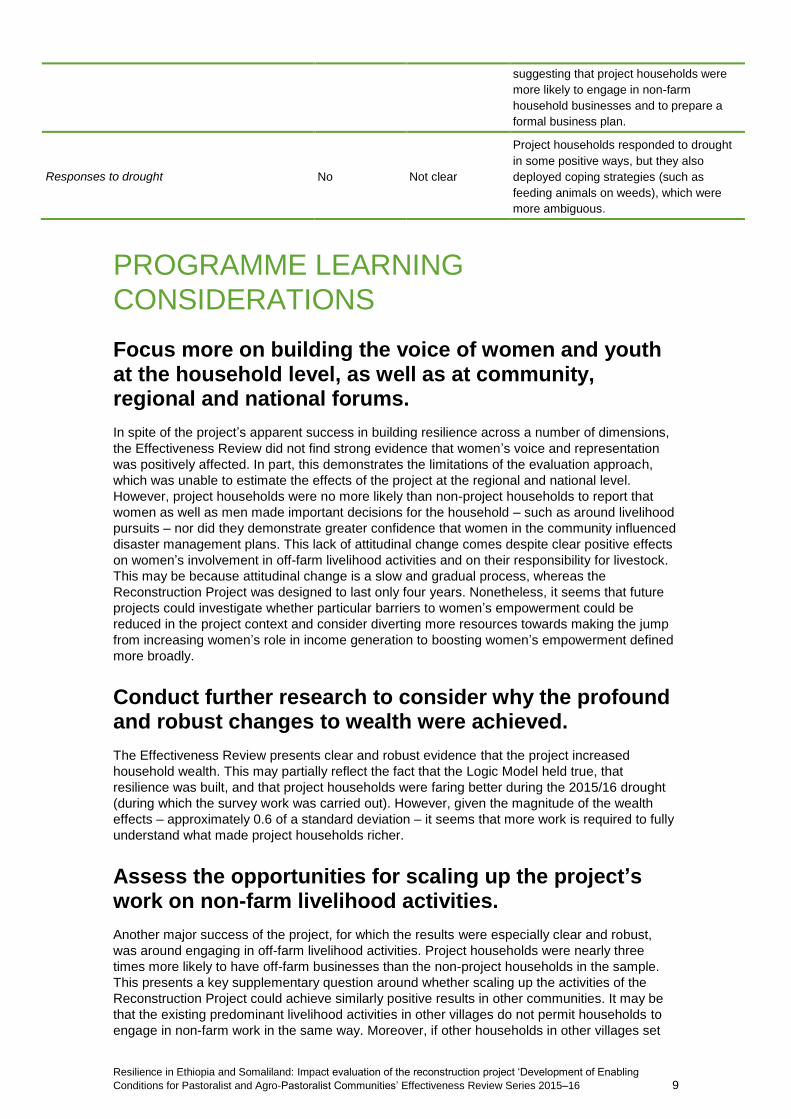
Responses to drought No Not clear
Project households responded to drought
in some positive ways, but they also
deployed coping strategies (such as
feeding animals on weeds), which were
more ambiguous.
PROGRAMME LEARNING
CONSIDERATIONS
Focus more on building the voice of women and youth at the household level, as well as at community, regional and national forums.
In spite of the project’s apparent success in building resilience across a number of dimensions,
the Effectiveness Review did not find strong evidence that women’s voice and representation
was positively affected. In part, this demonstrates the limitations of the evaluation approach,
which was unable to estimate the effects of the project at the regional and national level.
However, project households were no more likely than non-project households to report that
women as well as men made important decisions for the household – such as around livelihood
pursuits – nor did they demonstrate greater confidence that women in the community influenced
disaster management plans. This lack of attitudinal change comes despite clear positive effects
on women’s involvement in off-farm livelihood activities and on their responsibility for livestock.
This may be because attitudinal change is a slow and gradual process, whereas the
Reconstruction Project was designed to last only four years. Nonetheless, it seems that future
projects could investigate whether particular barriers to women’s empowerment could be
reduced in the project context and consider diverting more resources towards making the jump
from increasing women’s role in income generation to boosting women’s empowerment defined
more broadly.
Conduct further research to consider why the profound and robust changes to wealth were achieved.
The Effectiveness Review presents clear and robust evidence that the project increased
household wealth. This may partially reflect the fact that the Logic Model held true, that
resilience was built, and that project households were faring better during the 2015/16 drought
(during which the survey work was carried out). However, given the magnitude of the wealth
effects – approximately 0.6 of a standard deviation – it seems that more work is required to fully
understand what made project households richer.
Assess the opportunities for scaling up the project’s work on non-farm livelihood activities.
Another major success of the project, for which the results were especially clear and robust,
was around engaging in off-farm livelihood activities. Project households were nearly three
times more likely to have off-farm businesses than the non-project households in the sample.
This presents a key supplementary question around whether scaling up the activities of the
Reconstruction Project could achieve similarly positive results in other communities. It may be
that the existing predominant livelihood activities in other villages do not permit households to
engage in non-farm work in the same way. Moreover, if other households in other villages set

Resilience in Ethiopia and Somaliland: Impact evaluation of the reconstruction project ‘Development of Enabling
Conditions for Pastoralist and Agro-Pastoralist Communities’ Effectiveness Review Series 2015–16 10
up off-farm businesses, this will increase the supply of the goods and services these businesses
provide, driving down their prices and hence the returns to doing this kind of work. Assessing
the importance of these types of issues will be vital for ascertaining whether the project activities
could generate similar uptake of non-farm livelihoods if scaled up.
Consider different approaches to monitoring to ensure beneficiary lists are well-maintained and up-to-date.
Although the project households clearly participated more in women’s credit and savings
groups, the overall proportion of the intervention households participating in these groups was
still just 54 percent. This is in spite of the fact that the sample of intervention households was
created directly from the most up-to-date lists of women in the credit and savings groups that
were available from the project partner organisations. It would be useful to know why these
households did not identify themselves as participating in the women’s savings and credit
groups, despite being on the beneficiary lists. If this is because the lists are out-of-date, then
improved monitoring of who is participating in the community groups that were set-up and
supported by the project would be useful, as well as recording why households stop
participating.

Resilience in Ethiopia and Somaliland: Impact evaluation of the reconstruction project ‘Development of Enabling
Conditions for Pastoralist and Agro-Pastoralist Communities’ Effectiveness Review Series 2015–16 11
1 INTRODUCTION Oxfam GB’s Global Performance Framework is part of the organisation’s effort to better
understand and communicate its effectiveness, as well as enhance learning across the
organisation. Under this Framework, a small number of completed or mature projects are
selected at random each year for an evaluation of their impact, known as an ‘Effectiveness
Review’. One key focus is on the extent they have promoted change in relation to relevant
Oxfam GB global outcome indicators.
During the 2015/16 financial year, one of the projects that was randomly selected for an
Effectiveness Review was the Reconstruction Project: ‘Contributing to the Development of
Enabling Conditions for Human Security for Vulnerable Pastoralist and Agro-Pastoralist
Communities’. Oxfam carried out this project in partnership with several organisations, including
Ogden Welfare and Development Association (OWDA), Community Development Service
Association (CDSA), Somaliland Pastoral Forum (SOLPAF), Candlelight, Himilo Relief and
Development Association (HIRDA), and The Horn of Africa Voluntary Youth Committee
(HAVOYOCO). The project activities, which began in July 2012 and finished in June 2016, are
focused in the Somali region of Ethiopia and the Galbeed and Togdheer regions of Somaliland
(see Figure 1.1).
The project was designed to build the resilience of project participants to drought, conflict, and
other shocks and stresses, through a series of activities working at different scales. The project
worked directly to improve pastoralists’ and agro-pastoralists’ ability to thrive in spite of drought
and conflict, by rehabilitating sources of water and grazing land, and by managing livestock
disease. The project also aimed to support alternative income-generating activities among
women and the youth, by providing training and supporting savings/credit groups. Finally, the
project tried to increase the voice and representation of marginalised groups in key decision-
making forums.
The Effectiveness Review, for which the fieldwork was carried out in November 2015, was
aimed at evaluating the success of this project in enabling households to maintain and improve
their well-being, in spite of shocks, stresses, and uncertainty. Due to logistical constraints, the
survey work did not cover the entire project area, and was instead focused in two woredas
(districts) of the Somali region of Ethiopia and the Galbeed region of Somaliland. This is shown
in Figure 1.1.

Resilience in Ethiopia and Somaliland: Impact evaluation of the reconstruction project ‘Development of Enabling
Conditions for Pastoralist and Agro-Pastoralist Communities’ Effectiveness Review Series 2015–16 12
Figure 1.1 – Project Areas and Survey Areas for Ethiopia and Somaliland Effectiveness
Review
Source: Oxfam
This report presents the findings of the Effectiveness Review. Section 2 briefly reviews the
activities and the logic of the project. Section 3 describes the evaluation design used, and
Section 4 describes how this design was implemented. Section 5 presents the approach used to
measure resilience. Section 6 shows the results of the data analysis, based on the comparison
of outcome measures between project and non-project households. Section 7 concludes with a
summary of the findings and some considerations for future learning.

Resilience in Ethiopia and Somaliland: Impact evaluation of the reconstruction project ‘Development of Enabling
Conditions for Pastoralist and Agro-Pastoralist Communities’ Effectiveness Review Series 2015–16 13
2 PROJECT DESCRIPTION
2.1 PROJECT ACTIVITIES The project under review aims to build households’ ability to respond to and withstand drought,
as well as the added stresses of livestock disease and conflict over resources that typically
occur in the dry season.
The project operates in both the Somali region of Ethiopia and two regions over the border in
Somaliland (Galbeed and Togdheer). The area is characterised by arid and semi-arid land,
where livelihoods are strongly linked to climatic patterns with extended dry seasons followed by
periods of rain. Indeed, most rural households in these areas of Ethiopia and Somaliland
practise pastoralism or agro-pastoralism, to enable them to thrive in spite of these testing
environmental conditions. In recent years, seasonal patterns of rainfall have become far less
dependable, and in both 2011 and 2015–2016, during the time at which the fieldwork was taking
place, the communities in Ethiopia and Somaliland were affected by severe drought. This has
placed extra strain on the traditional coping mechanisms used by pastoralists and agro-
pastoralists. Droughts of this type not only result directly in the loss of livestock and crops due to
shortage of water and suitable grazing land, but may also lead to outbreaks of animal diseases
and disputes over natural resources, which further threaten households’ well-being. The 2015–
2016 drought was also accompanied by short-run and erratic rain storms, which did little to help
livelihoods, and in fact caused damage to crops and livestock.
Given this context, the Reconstruction Project implemented a number of activities at different
scales with the ultimate aim of building households’ resilience. The project was, in part, a
continuation of Oxfam’s previous European Commission Humanitarian Aid and Civil Protection
(ECHO)-funded projects. However, this evaluation focuses primarily on the activities of the
Reconstruction Project, which ran from July 2012, until the time of the fieldwork in November
2015. The project activities finished in June 2016.
The Reconstruction Project has three overarching objectives:
1. Make pastoralist and agro-pastoralist communities more resilient to drought and
conflict.
2. Increase voice and representation of civil society, especially women’s organisations and
youth, in decision-making forums.
3. Raise cross-border issues affecting Ethiopia and Somaliland pastoralists and agro-
pastoralists at regional and national platforms.
Evidently, these objectives are extremely wide-ranging so, as we explain below, this evaluation
will consider a subset of the activities undertaken by the project.
The activities of the project operate at a number of different scales. Firstly, some activities in the
project targeted specific individuals and households within the beneficiary communities. A
series of trainings were provided to the most vulnerable groups in each community. Around 20
young people (aged 16–30) participated in vocational training, to allow them to undertake jobs
outside of pastoralism and agro-pastoralism, without relying on the environmentally damaging
production of charcoal. Those wishing to participate were tested with a formal assessment to
ensure their suitability for the vocational training. The youth in the project communities were
also given awareness training on natural resource management, which focused in particular on
the negative impacts of cutting down trees for charcoal.
A substantial component of the project was targeted at women within the beneficiary
communities. In particular, the project helped establish and support women’s savings and credit
groups, which followed Islamic banking principles, in almost all of the beneficiary communities.
Approximately 20 women in each Ethiopian project village and 30 women in each Somalilander
project village participated in these groups, so nearly 800 households were reached. The
Resilience in Ethiopia and Somaliland: Impact evaluation of the reconstruction project ‘Development of Enabling
Conditions for Pastoralist and Agro-Pastoralist Communities’ Effectiveness Review Series 2015–16 14
project provided these groups with direct grants and inputs (such as seeds and tools), and
helped to train participants in different livelihood strategies and in the creation of formal
business plans. Livelihood diversification for women was also supported by organising
exchange visits between communities, where ideas and know-how could be shared and
discussed with others.
Other aspects of the project were targeted at the village-level, aiming to benefit virtually all
individuals and households within the community. Many of these activities are related to
livestock. The project built the capacity of Community Animal Health Workers so as to provide
better veterinary services to households, as well as surveying the area for potential outbreaks of
animal disease. Pastureland was also rehabilitated to improve its suitability for grazing during
the dry season.
Other village-level activities were intended to benefit all households in the community, whether
they owned livestock or not. Firstly, public water sources were restored and improved, by
helping to construct communal ‘dams’ – which consist of large pits lined with plastic sheeting to
prevent percolation – and ‘birkads’, which enable water to be stored underground or under
covers to prevent loss due to evaporation. The project also supported Community-Based
Disaster Risk Management Committees (CBDRMCs) to develop drought management plans,
and helped with the dissemination of early-warning information when changes in climatic
conditions threatened.
Although the village-level activities were mainly experienced within project communities, it is
possible that others in the district may also have benefited. In particular, the sites for water and
rangeland rehabilitation were chosen strategically so that pastoralists from outside the project
communities could pass through and use them to sustain their livestock when migrating.
Therefore, it was intended that these effects of the projects, at least partially, ‘spilled over’ into
non-beneficiary communities.
There were some further activities of the project that worked directly on the links between (1)
project communities and other communities and (2) project communities and higher-level
institutions, such as regional or national governments. On the former, the project helped create
spaces for interactions between different clans and community groups, such as organising
sports matches between young people from different communities. However, there were also
activities aiming to connect institutions within the community, such as the CBDRMCs, with
higher-level governance structures. For the Ethiopia sites, ‘hybrid committees’ were established,
which brought together representatives from local village groups and regional government
institutions. Although direct advocacy activities were not possible on the Ethiopia side, in
Somaliland, some of the partner organisations were engaged in efforts to change policies
related to natural resource management for the country as a whole.
2.2 PROJECT LOGIC AND INTENDED
OUTCOMES In this section, we describe how the project was supposed to achieve its goals. Using existing
documentation about the project, as well as through discussions with the team implementing the
project, we can map out the intended causal links from project activities (green), via outputs
(orange) and intermediate outcomes (red), to overall resilience outcomes (purple). This results
in the Logic Model shown in Figure 2.1. It should be noted that this diagram stops at the factors
that could be considered drivers or characteristics of resilience, and does not include the final
outcomes beyond resilience (such as improved well-being and realisation of rights), that the
project may have been trying to promote in the long run.
Resilience in Ethiopia and Somaliland: Impact evaluation of the reconstruction project ‘Development of Enabling
Conditions for Pastoralist and Agro-Pastoralist Communities’ Effectiveness Review Series 2015–16 15
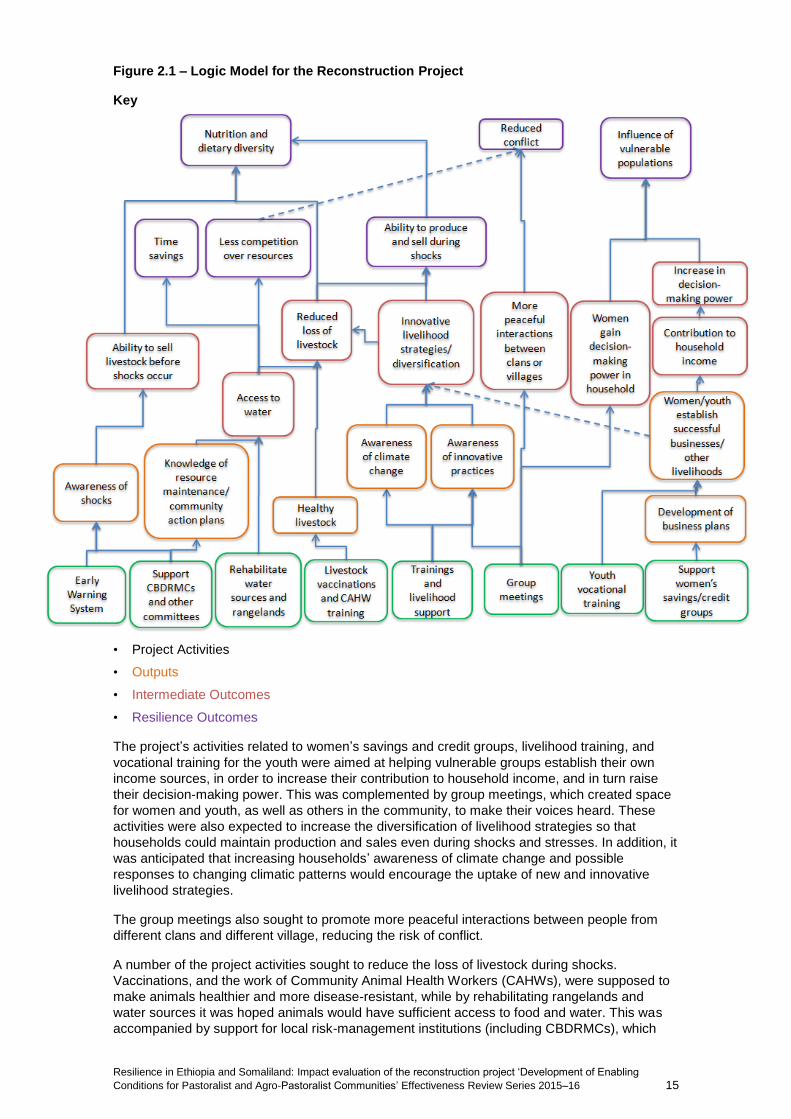
Figure 2.1 – Logic Model for the Reconstruction Project
Key
• Project Activities
• Outputs
• Intermediate Outcomes
• Resilience Outcomes
The project’s activities related to women’s savings and credit groups, livelihood training, and
vocational training for the youth were aimed at helping vulnerable groups establish their own
income sources, in order to increase their contribution to household income, and in turn raise
their decision-making power. This was complemented by group meetings, which created space
for women and youth, as well as others in the community, to make their voices heard. These
activities were also expected to increase the diversification of livelihood strategies so that
households could maintain production and sales even during shocks and stresses. In addition, it
was anticipated that increasing households’ awareness of climate change and possible
responses to changing climatic patterns would encourage the uptake of new and innovative
livelihood strategies.
The group meetings also sought to promote more peaceful interactions between people from
different clans and different village, reducing the risk of conflict.
A number of the project activities sought to reduce the loss of livestock during shocks.
Vaccinations, and the work of Community Animal Health Workers (CAHWs), were supposed to
make animals healthier and more disease-resistant, while by rehabilitating rangelands and
water sources it was hoped animals would have sufficient access to food and water. This was
accompanied by support for local risk-management institutions (including CBDRMCs), which
Resilience in Ethiopia and Somaliland: Impact evaluation of the reconstruction project ‘Development of Enabling
Conditions for Pastoralist and Agro-Pastoralist Communities’ Effectiveness Review Series 2015–16 16
were designed to increase knowledge and understanding of resource maintenance. Better
access to water (and rangeland) was also expected to lead to time savings and reduce conflict
over resources.
Finally, support to local institutions and early-warning systems was aimed at promoting better
awareness of shocks so that households could take appropriate action. For example,
households may have been better placed to fatten and sell animals when the market was more
lucrative, if they had better access to weather forecasts.
The diagram in Figure 2.1 also includes improved nutrition and dietary diversity as an ultimate
aim of the project. Although this may be regarded as an outcome beyond resilience, it also
contributes to current levels of resilience, insofar as households with superior nutrition may be
able to withstand health shocks better. For this reason, dietary diversity will remain part of this
evaluation.

Resilience in Ethiopia and Somaliland: Impact evaluation of the reconstruction project ‘Development of Enabling
Conditions for Pastoralist and Agro-Pastoralist Communities’ Effectiveness Review Series 2015–16 17
3 EVALUATION DESIGN The central problem in evaluating the impact of any project or programme is how to compare
the outcomes that resulted from that project with what would have been the case had the
project or programme not been carried out. In the case of this Effectiveness Review, information
about the situation of households in the project communities was collected through a household
questionnaire, but clearly it was not possible to know what their situation would have been had
the project activities not been undertaken. In any evaluation, this ‘counterfactual’ situation
cannot be directly observed: it can only be estimated.
In the evaluation of programmes that involve a large number of units (such as individuals,
households, or communities), it is possible to make a comparison between units that were
subject to the programme and those that were not. As long as the two groups are similar in all
respects except for the implementation of the specific project, observing the situation of those
where the project was not implemented can provide a good estimate of the counterfactual.
This evaluation focuses on assessing both household- and community-level impacts of the
project. Therefore, we aim to compare the direct beneficiaries within project communities with
similar households in similar non-project communities.
An ideal approach to an evaluation such as this is to select at random the sites in which the
project will be implemented, as well as the households who can participate in the project.
Random selection minimises the probability of there being systematic differences between the
project participants and non-participants, and so maximises the confidence that any differences
in outcomes are due to the effects of the project.
However, in the case of the project examined in this Effectiveness Review, neither the
communities where the project was implemented, nor the participant households within those
communities, were selected at random.
At the community level, the implementers targeted poor villages, which were especially
vulnerable to drought-related risks. However, within the same districts and regions, there were a
number of other communities with similar characteristics that faced similar risks, but which were
not included in the Reconstruction Project. This allowed a ‘quasi-experimental’ evaluation
approach to be adopted, in which the situations of households in communities not included in
the project – in so-called ‘comparison’ sites – were assumed to provide a reasonable estimate
for the counterfactual of households who participated in the project.
This approach cannot fully evaluate the community-level effects of the Reconstruction Project.
This is because the project focused on strategic locations, where the rehabilitation of water
sources and grazing land would benefit not just community members, but also other pastoralists
and agro-pastoralists who were travelling through the project area. As a result of these
‘spillover’ effects, the comparison sites could not perfectly represent the situation of villages
where the project had been completely absent.
It is important to note that within the project communities, those who participated in the
household-level activities of the project were not a random cross-section of residents. In this
evaluation, we elected to focus on the participants in the women’s savings and credit groups.
This is because these activities reached far more households than other individual-/household-
level activities, such as vocational training for the youth. Also, there were clear and organised
lists of beneficiaries, which could be used to track project participants for interview. Finally, the
women’s savings and credit groups were formed and maintained by the project according to
clear criteria. In particular, the project targeted poor women from female-headed households,
who were willing and able to try new non-farm livelihood activities. These women were identified
through focus-group-style discussions between project staff and local community elders. Exactly
the same procedure was used to select members for the women’s savings and credit groups in
Ethiopia and Somaliland.
As such, it is likely that the households who participated in the activities that were channelled
through the women’s savings and credit groups differed from their non-participant neighbours –
for example, in terms of their wealth, household composition, their sense of initiative, willingness

Resilience in Ethiopia and Somaliland: Impact evaluation of the reconstruction project ‘Development of Enabling
Conditions for Pastoralist and Agro-Pastoralist Communities’ Effectiveness Review Series 2015–16 18
to take risks, and social connections. It was therefore necessary to identify similar households
within the comparison communities to create a suitable counterfactual for the project
participants.
In order to do this, we applied an approximate version of the methodology that was originally
used to create the women’s savings and credit groups. The evaluation sought to identify those
women who would have participated in the project, if it had been operating in the comparison
sites. The survey team conducted focus group discussions with community elders to identify
women from poor, female-headed households, who were both willing and able to engage in
non-farm activities.1 These definitions were fixed in advance with project staff to ensure they
matched the original criteria used to select project participants.
The analysis used in this evaluation also allowed us to improve the confidence in our
comparison between those households that did and did not participate in the project.
Households in the project communities were ‘matched’ with households with similar
characteristics in the comparison communities. Matching was performed on the basis of a
variety of observable characteristics – including household size, productive activities, and
indicators of material well-being, such as housing conditions and ownership of assets. Since
some of these characteristics may have been affected by the project itself (particularly those
relating to productive activities and wealth indicators), this matching procedure was performed
on the basis of these indicators before the implementation of the project. Although baseline data
were not available in this case, survey respondents were asked to recall some basic information
about their household’s situation at the start of 2012, before the project was implemented. This
recalled baseline data is unlikely to be highly accurate. However, it still serves as a suitable
proxy for households’ baseline situation, enhancing the reliability of the comparisons made in
this report.
The survey data provided a large number of baseline household characteristics on which
matching could be carried out. (The characteristics that were in fact used are listed in Appendix
3.) In practice, it is very difficult to find households in the comparison communities that
correspond exactly in all these characteristics to households in the project communities.
Instead, these characteristics were used to calculate a ‘propensity score’ – the conditional
probability of the household being in an intervention community, given particular background
variables or observable characteristics. Households in the project and comparison communities
were then matched based on this propensity score. After matching, it was possible to test
whether the distributions of each baseline characteristic were similar between the two groups.
Technical details on this approach are described in Appendix 3.
As a check on the results derived from the propensity-score matching process, results were also
estimated using multivariate regression models. Like propensity-score matching, multivariate
regression also controls for measured differences between the intervention and comparison
groups, but it does so by isolating the variation in the outcome variable explained by being in
the intervention group after the effects of other explanatory variables have been accounted for.
The regression models tested are described in Appendix 4.
It should be noted that both propensity-score matching and multivariate regression rely on the
assumption that the ‘observed’ characteristics (those that are collected in the survey and
controlled for in the analysis) capture all of the relevant differences between the two groups. If
there are ‘unobserved’ differences between the groups – such as individuals’ attitudes or
motivation, differences in local leadership, weather, or other contextual conditions – then
estimates of outcomes derived from them may be misleading. This is a cause for particular
caution when evaluating a project in which participants were to some extent self-selected. This
point is further discussed in Sections 6 and 7 when interpreting the statistical results.

Resilience in Ethiopia and Somaliland: Impact evaluation of the reconstruction project ‘Development of Enabling
Conditions for Pastoralist and Agro-Pastoralist Communities’ Effectiveness Review Series 2015–16 19
4 DATA
4.1 RESPONDENTS INTERVIEWED To form a sample of project and comparison households, we first selected a subset of the
woredas/regions in which the project was working, and then a subset of the communities within
those districts. We then established a procedure to select households within the chosen
communities.
On the Ethiopia side of the border, two out of the six project woredas were selected. In
particular, the evaluation focused on areas where households were employing both agro-
pastoralist and pastoralist livelihood strategies. For this reason, alongside the logistical
difficulties associated with travelling far from the main cities, Harshin and Gashamo woreda
were ruled out of the sample. Daroor woreda was eliminated from the potential sample because
it had been created during the lifetime of the project, and its administrative relationship with the
pre-existing Aware woreda – from which it was formed – was unclear. Finally, we chose not to
include Jijiga woreda in the sample, not only because it contained the capital and largest city of
the Somali region (Jijiga), but also because it was unique in not sharing a border with
Somaliland. The presence of the border was especially interesting for this evaluation because
some of the project activities explicitly tried to make movement between Ethiopia and
Somaliland easier for pastoralists and agro-pastoralists. Thus, for the Ethiopia side, this
evaluation focuses on the woredas of Awbere and Kebribeyah.
In Somaliland, there were no official district structures comparable to the woredas in Ethiopia
that could be used for the first stage of sampling.2 However, we elected to restrict the sample to
just one of the two project regions – Galbeed. This is because the Togdheer region did not
contain a suitable mix of households engaging in pastoralism and agro-pastoralism, and many
of the project areas were too remote to reach within the time available for the survey.
Within the selected woredas/regions, we aimed to include all of the project communities in the
evaluation. However, some sites had to be excluded from the sample, leaving us with six
communities from Ethiopia (three each from Awbere and Kebribeyah) and four communities
from Somaliland. There were a number of reasons why certain sites had to be omitted. Firstly, in
some communities initially targeted by the project, it turned out that, ultimately, no project
activities were carried out (as occurred Hartsheikh in Kebribeyah woreda). Also, some
communities were clear outliers, and would have reduced the consistency and coherence of the
sample. For example, Awbere Town was excluded from the sample, even though some
activities were undertaken there, because the community was effectively urban and therefore
quite different from the rural, pastoralist and agro-pastoralist communities with which the project
mainly worked.3
In order to establish which communities would be suitable for comparison purposes, a list of key
socio-economic and geographical characteristics was drawn up, which was based on the
original criteria used to determine whether communities could participate in the project. These
characteristics were mainly related to the communities’ vulnerability to drought-related risks,
including:
• The dominant livelihood strategies employed by community members.
• The distance of the community from main roads.
• The distance of the community from the Ethiopia-Somaliland border.
• Overall community wealth levels.
• The migration patterns of community members.
Through discussions with partner staff, we were able to identify a total of 14 suitable
comparison communities – eight in Ethiopia and six in Somaliland.
Resilience in Ethiopia and Somaliland: Impact evaluation of the reconstruction project ‘Development of Enabling
Conditions for Pastoralist and Agro-Pastoralist Communities’ Effectiveness Review Series 2015–16 20
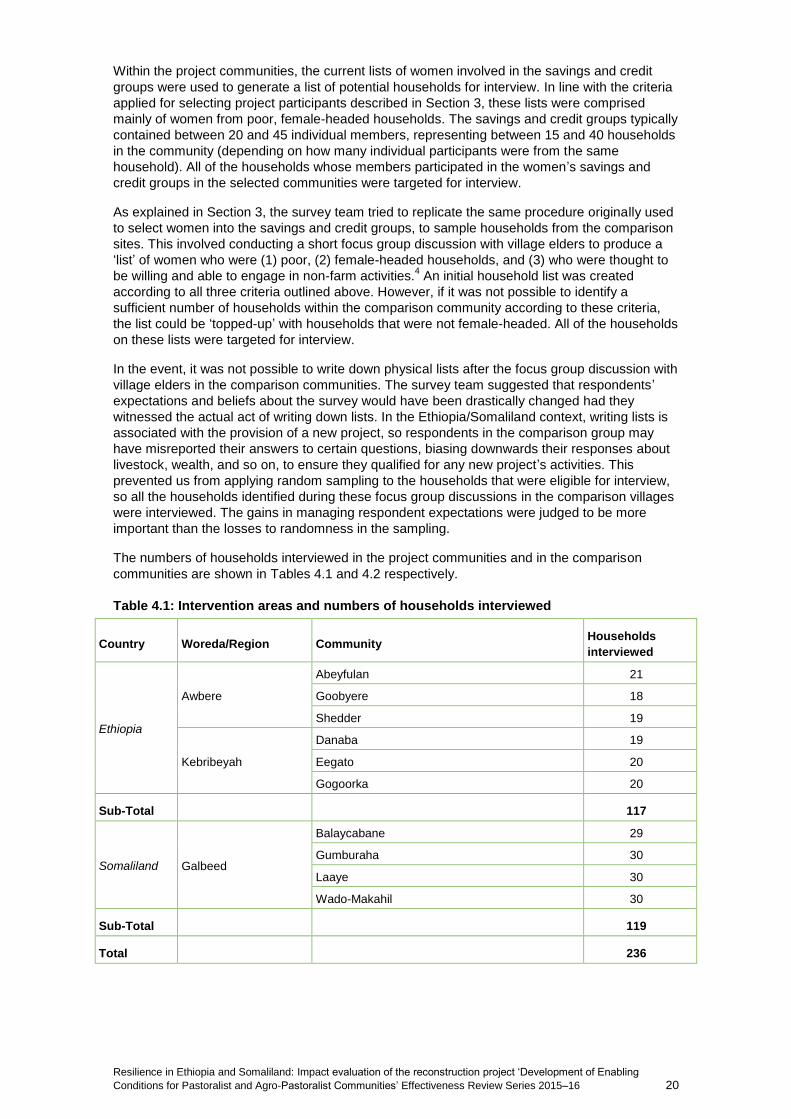
Within the project communities, the current lists of women involved in the savings and credit
groups were used to generate a list of potential households for interview. In line with the criteria
applied for selecting project participants described in Section 3, these lists were comprised
mainly of women from poor, female-headed households. The savings and credit groups typically
contained between 20 and 45 individual members, representing between 15 and 40 households
in the community (depending on how many individual participants were from the same
household). All of the households whose members participated in the women’s savings and
credit groups in the selected communities were targeted for interview.
As explained in Section 3, the survey team tried to replicate the same procedure originally used
to select women into the savings and credit groups, to sample households from the comparison
sites. This involved conducting a short focus group discussion with village elders to produce a
‘list’ of women who were (1) poor, (2) female-headed households, and (3) who were thought to
be willing and able to engage in non-farm activities.4 An initial household list was created
according to all three criteria outlined above. However, if it was not possible to identify a
sufficient number of households within the comparison community according to these criteria,
the list could be ‘topped-up’ with households that were not female-headed. All of the households
on these lists were targeted for interview.
In the event, it was not possible to write down physical lists after the focus group discussion with
village elders in the comparison communities. The survey team suggested that respondents’
expectations and beliefs about the survey would have been drastically changed had they
witnessed the actual act of writing down lists. In the Ethiopia/Somaliland context, writing lists is
associated with the provision of a new project, so respondents in the comparison group may
have misreported their answers to certain questions, biasing downwards their responses about
livestock, wealth, and so on, to ensure they qualified for any new project’s activities. This
prevented us from applying random sampling to the households that were eligible for interview,
so all the households identified during these focus group discussions in the comparison villages
were interviewed. The gains in managing respondent expectations were judged to be more
important than the losses to randomness in the sampling.
The numbers of households interviewed in the project communities and in the comparison
communities are shown in Tables 4.1 and 4.2 respectively.
Table 4.1: Intervention areas and numbers of households interviewed
Country Woreda/Region Community Households
interviewed
Ethiopia
Awbere
Abeyfulan 21
Goobyere 18
Shedder 19
Kebribeyah
Danaba 19
Eegato 20
Gogoorka 20
Sub-Total 117
Somaliland Galbeed
Balaycabane 29
Gumburaha 30
Laaye 30
Wado-Makahil 30
Sub-Total 119
Total 236

Resilience in Ethiopia and Somaliland: Impact evaluation of the reconstruction project ‘Development of Enabling
Conditions for Pastoralist and Agro-Pastoralist Communities’ Effectiveness Review Series 2015–16 21
Table 4.2: Comparison areas and numbers of households interviewed
Country Woreda/Region Community Households
interviewed
Ethiopia
Awbere
Gaadab 30
Hasadin 29
Heroson 30
Lefessa 36
Qarandiqod 12
Kebribeyah
Gilo 24
Guyo 30
Hartsheikh 30
Sub-Total 221
Somaliland Galbeed
Goryo 35
Gumar 36
Habasweyn 34
Ijara 40
Magalo Farxan 40
Qudha Aburin 33
Sub-Total 218
Total 439
The data for this evaluation were principally collected at the household-level. Questionnaires
were conducted with a particular household member, but they were asked to answer questions
for the household as a whole. A household was defined as those individuals who normally (in
the last three months) slept in the same hut or house, and shared meals.
Given the project’s focus on female community members, the survey team targeted adult
women in the sampled households for interview. However, if this was not possible after
revisiting the household once, the questionnaire was undertaken with the most senior adult
male household member available. Further revisits, to ensure a female respondent could be
interviewed from the sampled household, were not practically possible given the remoteness of
some of the project and comparison communities. In the event, approximately 85 percent of the
interviewees were female.
Before the survey started, respondents were given some basic information about the purpose of
the survey, to help manage their expectations. The enumerators explained that the survey was
being undertaken to help Oxfam better understand the lives of pastoralists in the community,
and that it was for ‘research purposes only’. It was also made clear that no special support
would come to households, as a result of the answers to questions in the survey.
Interviews were carried out using mobile devices. The questionnaire was created in a piece of
Open Data Kit software, called SurveyCTO, and then downloaded onto a mobile phone given to
each enumerator. The functionality of the mobile phones was reduced, so that they could only
be used for data-collection purposes. The data were uploaded nightly by field supervisors and
checked by the evaluation team to ensure high data quality.

Resilience in Ethiopia and Somaliland: Impact evaluation of the reconstruction project ‘Development of Enabling
Conditions for Pastoralist and Agro-Pastoralist Communities’ Effectiveness Review Series 2015–16 22
4.2 ANALYSIS Before analysing the effects of the project on resilience outcomes, we compared project
households and comparison households in terms of their demographic characteristics,
livelihoods activities and economic situation at the start of 2012 (that is, before the
Reconstruction Project began). This helps to check the suitability of the comparison group, and
ascertain what variables could be included in the main analysis to control for observable
differences between project and non-project households.
Some of the data were based on information recalled during the questionnaire. The
enumerators worked with the respondents to establish a suitable event or season, before
beginning the main content of the questionnaire, to help them consistently think about the
correct time period when answering the recall questions. However, given the difficulties of
remembering specific aspects of livelihoods, asset ownership, and other activities, it is possible
that these recall questions may be subject to measurement error.
The full comparison of project participant households and comparison households in terms of all
these characteristics is shown in Appendix 2. There are three key differences, which we wish to
highlight.
Firstly, the project households in our sample are somewhat larger than comparison households.
Among the participants, households had 5.86 members, while the comparison households had
just 5.11 members, on average. However, the demographic make-up of these households
appeared to be similar between the project participants and the comparison group – the
proportions of children, elderly people, and the mix of males and females were not substantially
different.
Secondly, income sources at the start of 2012 appeared to be more diversified for the project
households compared to the non-project households. Perhaps the most striking difference was
for farming crops, where approximately 78 percent of the project households engaged in crop
cultivation, but just 52 percent of the comparison households. Participation in household
businesses and regular paid employment were also somewhat higher for the project
households. Interestingly, project households were also more likely to have members engaging
in ‘guus’ work – this means going to other households or businesses and working without
monetary payment in exchange for food and accommodation. It is not, a priori, clear whether
this should be interpreted as a positive aspect of income diversification, or a coping strategy
employed by more vulnerable households.
Thirdly, project households were richer, on average, than comparison households, at the start of
2012. We explain how wealth was measured in more detail in Section 6.7 below. The proportion
of project households in the upper quintile of the wealth distribution was significantly greater
than the proportion of non-project households, while the inverse was true for the lowest two
wealth quintiles. However, the proportions of project and comparison households in the third
and fourth quintiles were approximately equal.
Any differences between project and comparison households that existed before the project
have the potential to bias any comparison of the project’s outcomes between the members of
the project and comparison respondents. We therefore controlled for these baseline and
demographic differences when making such comparisons. This was especially important for
livelihoods and wealth, which could be regarded as potential outcomes of the project – we hope
to find out whether the project affected these outcomes, rather than there simply being
differences between the project participants and the comparison group.
Some of the differences between the project participant households and the comparison group
identified above may be down to recall error. However, this would require the project
participants to systematically overstate their livelihood diversification and wealth and/or the
comparison households to systematically understate. There are two potential reasons this might
have happened in our survey. Firstly, it may have been difficult for project respondents to
remember back to a time before any project activities, so their recall answers may include some
mix of their baseline status and the effects of the project. If the project helped them diversify
livelihoods or become wealthier, this may cause them to overestimate livelihood diversification
Resilience in Ethiopia and Somaliland: Impact evaluation of the reconstruction project ‘Development of Enabling
Conditions for Pastoralist and Agro-Pastoralist Communities’ Effectiveness Review Series 2015–16 23
and/or wealth at the start of 2012.5 Secondly, the comparison households may have partially
used the survey to express their discontent for having not received support from a project like
the Reconstruction Project. Although the enumerators were trained to manage expectations and
explain the purpose of the survey carefully, for recalled wealth – which is difficult to objectively
verify – this logic may have caused the comparison households to underestimate their situation
at the start of 2012.6
However, in the absence of these types of systematic biases for the project participant
households and comparison households, any measurement error that arises due to recall would
actually lead to differences between project and non-project households to be underestimated.7
Thus, it is unlikely that there are truly no differences between project households and
comparison group in terms of livelihood strategies and wealth at the start of 2012. We therefore
believe it is important to control for differences in recalled livelihoods/wealth in our main
analysis.
As described in Section 3, the main approach used in this Effectiveness Review to control for
the baseline differences was propensity-score matching (PSM). The variables on which
respondents were matched were selected from the full list detailed in Appendix 2 and based on
two key factors. Firstly, we selected those variables that were thought to be the most significant
in influencing respondents’ participation in the project. Secondly, we aimed to include variables
that could affect potential project outcomes as well as the likelihood of participating in the
project.
In particular, households’ involvement in livelihood activities at the start of 2012 – especially
crop growth, household businesses, and regular paid employment – was used for the matching,
as was households’ wealth at the start of 2012. This was in spite of concerns about the degree
of recall error in those data. The list of matching variables selected and the full details of the
matching procedure are described in Appendix 3.
After matching, project participant households and comparison households appeared to be
reasonably well balanced in terms of each of the selected variables. One caveat is that 31 of the
236 project participant households in the sample and 8 of the 439 comparison households could
not be matched and had to be dropped from the analysis. Consequently, the estimates of the
project’s impact presented in Section 6 are not based on the whole population interviewed, but
exclude a non-random minority.
However, the 31 households from the intervention group that were dropped from the sample
were richer and were more likely to have been engaging in non-farm livelihood activities both at
the time of the survey and at the start of 2012. As such, omitting these observations from the
sample is more likely to bias downwards the results we report below in Section 6, by ‘artificially’
making the intervention group poorer and less diversified in terms of livelihoods.
All the results described in Section 6 of the report were tested for robustness by estimating
them with several alternative statistical models, including alternative PSM models and linear or
probit regression models. These robustness checks are shown in Appendix 4. However, the
results of the alternative PSM and regression models generally produced estimates of
outcomes that were similar in magnitude and in statistical significance to those derived from the
original PSM model. The few cases where the models produced divergent results are discussed
in Section 6, in the text or in endnotes.
We also consider whether there are differences by gender of the household head and by
country. However, we reserve the results of this subgroup analysis for Appendix 5.
As mentioned in Section 3, PSM and regression models can only control for the baseline
differences between project and comparison households for which data was collected in the
survey. If there are any ‘unobserved’ differences between the two groups – such as individuals’
attitudes or motivation, differences in local leadership, or weather, or other contextual conditions
– then these may bias the estimates of outcomes described in Section 6. The evaluation design
and the selection of respondents were intended to minimise any potential for unobserved
differences, but this possibility cannot be excluded, and must be borne in mind when
interpreting the results.

Resilience in Ethiopia and Somaliland: Impact evaluation of the reconstruction project ‘Development of Enabling
Conditions for Pastoralist and Agro-Pastoralist Communities’ Effectiveness Review Series 2015–16 24
5 MEASURING RESILIENCE IN ETHIOPIA AND SOMALILAND The Reconstruction Project was specifically aimed at increasing households’ resilience. As part
of its Global Performance Framework, Oxfam GB has developed an innovative approach to
measure the resilience of households to shocks and stress and their ability to adapt to change.8
This approach involves capturing data on various household and community characteristics
falling under the five interrelated dimensions.
Oxfam defines resilience as ‘the ability of women and men to realise their rights and improve
their well-being in spite of shocks, stresses, and uncertainty’. One reason why measuring
resilience is challenging is that we can only really assess whether a system has successfully
coped or adapted after the fact.
In this Effectiveness Review, we were partially able to observe how well households had coped
with shocks, stresses, and uncertainty because the survey work was carried out during the early
stages of the 2015–2016 drought. In Section 6, we consider how well households were able to
maintain their herds, what coping strategies they deployed, and levels of household wealth.
However, looking at these sorts of final outcomes is not sufficient to tell us about the project’s
full impact on resilience for at least three reasons. Firstly, the fieldwork for this Effectiveness
Review was carried out relatively early on in the 2015–2016 drought, so its full effects on final
well-being outcomes may not be totally captured by our data. Secondly, focusing on
households’ ability to withstand drought alone may not give a complete idea of their ability to
deal with other shocks, stresses and uncertainty (although many of the shocks in the
Ethiopian/Somalilander context are likely to be related to drought). Finally, focusing on previous
shocks is backward-looking, and does not allow us to investigate the project’s impact on
resilience in the future.
The characteristics approach to resilience measurement, which we adopt in this section, is
based on the assumption that there are particular characteristics of households and
communities that affect how well they are able to cope with shocks and positively adapt to
change. Insofar as there are multiple final well-being outcomes, about which we are ultimately
concerned, and many potential shocks and stresses, there should also be a wide range of
resilience characteristics. Where possible, we also wish to conceptualise resilience as operating
at many different levels (individual, household, community, and so on) as well as for different
shocks with different time horizons. As a consequence, the number of resilience characteristics
is potentially very high. A limitation, of course, is that we do not know for certain how relevant
particular characteristics actually are; rather, we assume they are important based on common
sense, theory, and an understanding of the local context.
To help structure discussions around the list of characteristics that inform the overall measure of
resilience, we have typically used five ‘dimensions’. These are presented in Figure 5.1.9
First, if we think about what a household would need in order to cope with current and future
shocks, stresses and uncertainty, a viable livelihood is likely to be one of them. If a shock
happens, for instance, a household dependent on just one precarious livelihood activity is likely
to be more negatively affected than another that has one or more less sensitive alternatives to
fall back on, all other things being equal. In addition, households that are on the margins of
survival are less likely to be resilient than their relatively more wealthy counterparts. Where
longer-term climatic trend prediction information exists, it is also important to assess how viable
current livelihood strategies would be given the range of likely future climatic scenarios.
Innovation potential focuses on a household’s ability to positively adjust to change, whether
anticipated or not. We can hypothesise that such potential is dependent on factors such as the
knowledge and attitudes of relevant household members themselves, their ability to take risks,
and their access to weather prediction, market information and relevant technology and
resources.

Resilience in Ethiopia and Somaliland: Impact evaluation of the reconstruction project ‘Development of Enabling
Conditions for Pastoralist and Agro-Pastoralist Communities’ Effectiveness Review Series 2015–16 25
Moreover, there will likely be times when even households with the most ‘resilient’ and adaptive
livelihood strategies will find it tough to get by. Access to contingency resources and
external support – e.g. savings, food and seed reserves, social protection, kin and non-kin
support networks, and emergency services – are, therefore, likely to be critical in supporting
households in coping with shocks and positively adjusting to change.
Figure 5.1: Dimensions affecting the ability of households and communities to minimise
risks from shocks and adapt to emerging trends and uncertainty
It is further recognised that healthy ecosystems are better able to cope and adjust to climatic
shocks/change than those that are relatively more degraded. We may reasonably assume –
again, with all other things being equal – that households whose livelihoods are dependent on
healthier ecosystems will be in a better position to adjust to climatic shocks/change than those
that are not. The presence of appropriate infrastructure (e.g. pit latrines and roads) that is
resilient to shocks and stresses is equally important; if critical infrastructure no longer functions
or collapses in times of shocks and stress, the livelihoods and/or health of community members
can be negatively affected.
In most, if not all cases, it is necessary to look beyond the household level when examining
resilience and adaptive capacity. Indeed, it is reasonable to assume that households are
normally better able to successfully adjust to climatic shocks/change when they are part of
larger coordinated efforts at the community level and beyond. The social and institutional
capability dimension, in particular, is concerned with the effectiveness of informal and formal
institutions in reducing risk, supporting positive adaptation, and ensuring equitable access to
essential services in times of shock/stress. In the absence of this capability, we can assume
that community-level duty bearers will be less effective in fulfilling their responsibilities in
supporting community members to reduce risk and/or successfully adapt.
While the five dimensions of resilience described here provide an overall framework, the
challenge in creating a measure of resilience is to identify specific characteristics that are
appropriate to the local context. For this Effectiveness Review, we consulted local staff from
each of the different partner organisations and from Oxfam to identify what factors they
considered the most important for contributing towards resilience within the project area. Two
focus groups were then carried out, one comprised entirely of women and one comprised
entirely of men, in a community that was similar to those included in the survey.10
This enabled
us to further probe people’s understanding of what factors contributed to their resilience.
This process led to a set of characteristics of resilience being identified, listed in Table 5.1. It is
important to note at this stage that while not all characteristics considered in this Effectiveness
Review may be directly linked to the project activities, all are deemed to be important to a
household’s overall resilience in this particular context. The right-hand column of Table 5.1
shows the characteristics on which the project was expected to have an impact, given its logic
model. It should also be noted that, even among the indicators that were connected to the

Resilience in Ethiopia and Somaliland: Impact evaluation of the reconstruction project ‘Development of Enabling
Conditions for Pastoralist and Agro-Pastoralist Communities’ Effectiveness Review Series 2015–16 26
project logic, some were more directly related to project activities and could be considered
‘output-related’, while others were further along the project’s Logic Model. It is these higher-level
measures of resilience that are of particular interest in this Effectiveness Review.
The questionnaire used in the Effectiveness Review included questions relating to each of the
characteristics listed in Table 5.1.
Data from these various indicators of resilience were aggregated using an approach similar to
the Alkire-Foster method, adapted from the framework used by the Oxford Poverty and Human
Development Institute for measuring multidimensional constructs, such as poverty and women’s
empowerment. For each characteristic, a benchmark was defined based on what it means for a
household to be faring reasonably well in relation to the characteristic in question. The particular
benchmarks used for each characteristic are detailed in Appendix 1. For example, each
household was defined as scoring positively in terms of livestock herd size, if they owned at
least five cows/herd camels or at least 40 sheep/goats. These cut-offs were developed through
conversations with project staff and by checking the summary statistics for each variable to
ensure the proposed thresholds were not obscuring important variation in the data. There is,
however, inevitably a degree of arbitrariness in defining such cut-offs. Alternative cut-offs and
formulations of the indicators were tested as a check on the robustness of the results obtained
from applying the cut-offs.
Having used the cut-offs to create a binary variable for each characteristic of resilience, it was
then necessary to find some way of aggregating across all the indicators of resilience. One of
the biggest challenges in constructing this type of index is finding ways to weight different
indicators – or indeed different dimensions – against one another to construct an index that
adequately reflects what is important for resilience in the local context. We adopt four different
strategies for assigning weights to the indicators in this Effectiveness Review, to ensure that our
findings are not sensitive to different assumptions about what truly matters for resilience.
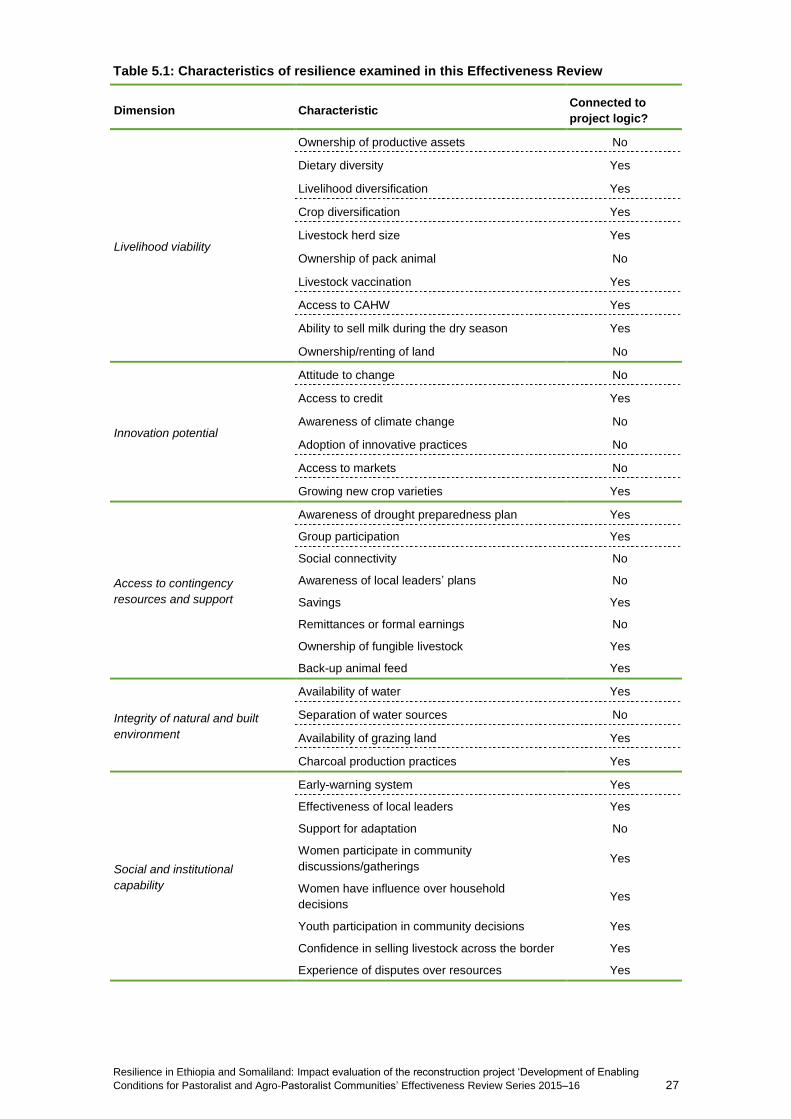
Resilience in Ethiopia and Somaliland: Impact evaluation of the reconstruction project ‘Development of Enabling
Conditions for Pastoralist and Agro-Pastoralist Communities’ Effectiveness Review Series 2015–16 27
Table 5.1: Characteristics of resilience examined in this Effectiveness Review
Dimension Characteristic Connected to
project logic?
Livelihood viability
Ownership of productive assets No
Dietary diversity Yes
Livelihood diversification Yes
Crop diversification Yes
Livestock herd size Yes
Ownership of pack animal No
Livestock vaccination Yes
Access to CAHW Yes
Ability to sell milk during the dry season Yes
Ownership/renting of land No
Innovation potential
Attitude to change No
Access to credit Yes
Awareness of climate change No
Adoption of innovative practices No
Access to markets No
Growing new crop varieties Yes
Access to contingency
resources and support
Awareness of drought preparedness plan Yes
Group participation Yes
Social connectivity No
Awareness of local leaders’ plans No
Savings Yes
Remittances or formal earnings No
Ownership of fungible livestock Yes
Back-up animal feed Yes
Integrity of natural and built
environment
Availability of water Yes
Separation of water sources No
Availability of grazing land Yes
Charcoal production practices Yes
Social and institutional
capability
Early-warning system Yes
Effectiveness of local leaders Yes
Support for adaptation No
Women participate in community
discussions/gatherings Yes
Women have influence over household
decisions Yes
Youth participation in community decisions Yes
Confidence in selling livestock across the border Yes
Experience of disputes over resources Yes
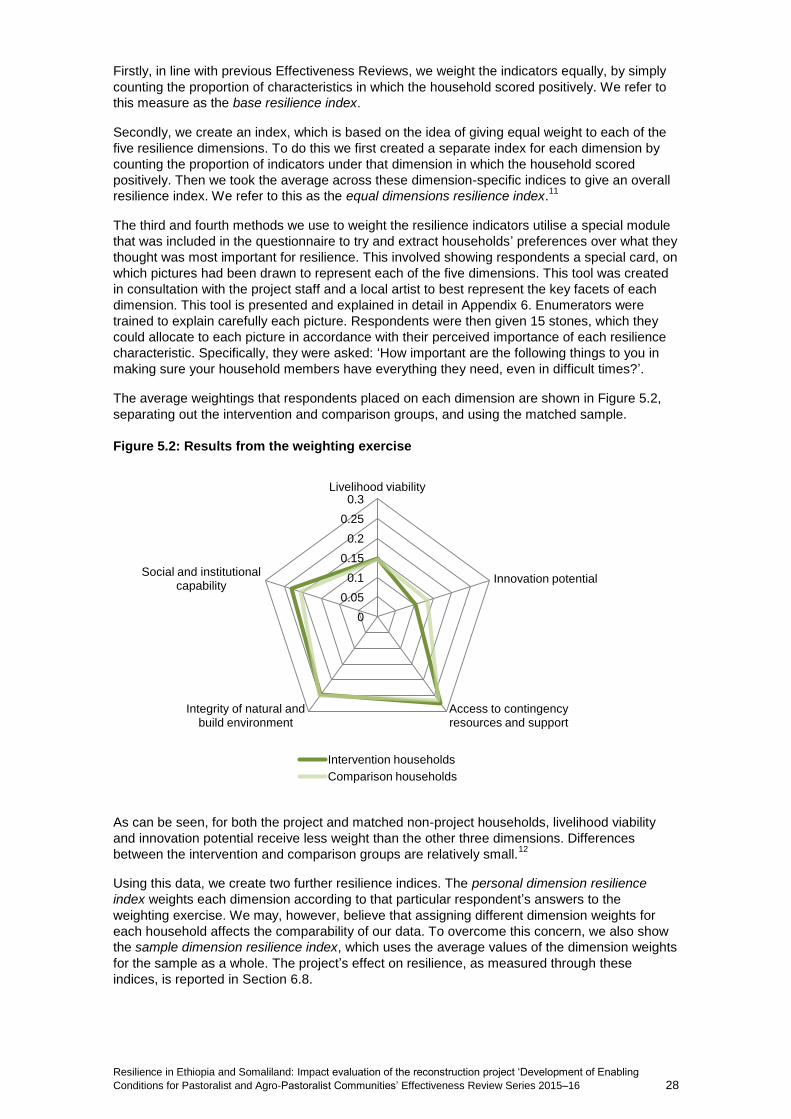
Resilience in Ethiopia and Somaliland: Impact evaluation of the reconstruction project ‘Development of Enabling
Conditions for Pastoralist and Agro-Pastoralist Communities’ Effectiveness Review Series 2015–16 28
Firstly, in line with previous Effectiveness Reviews, we weight the indicators equally, by simply
counting the proportion of characteristics in which the household scored positively. We refer to
this measure as the base resilience index.
Secondly, we create an index, which is based on the idea of giving equal weight to each of the
five resilience dimensions. To do this we first created a separate index for each dimension by
counting the proportion of indicators under that dimension in which the household scored
positively. Then we took the average across these dimension-specific indices to give an overall
resilience index. We refer to this as the equal dimensions resilience index.11
The third and fourth methods we use to weight the resilience indicators utilise a special module
that was included in the questionnaire to try and extract households’ preferences over what they
thought was most important for resilience. This involved showing respondents a special card, on
which pictures had been drawn to represent each of the five dimensions. This tool was created
in consultation with the project staff and a local artist to best represent the key facets of each
dimension. This tool is presented and explained in detail in Appendix 6. Enumerators were
trained to explain carefully each picture. Respondents were then given 15 stones, which they
could allocate to each picture in accordance with their perceived importance of each resilience
characteristic. Specifically, they were asked: ‘How important are the following things to you in
making sure your household members have everything they need, even in difficult times?’.
The average weightings that respondents placed on each dimension are shown in Figure 5.2,
separating out the intervention and comparison groups, and using the matched sample.
Figure 5.2: Results from the weighting exercise
As can be seen, for both the project and matched non-project households, livelihood viability
and innovation potential receive less weight than the other three dimensions. Differences
between the intervention and comparison groups are relatively small.12
Using this data, we create two further resilience indices. The personal dimension resilience
index weights each dimension according to that particular respondent’s answers to the
weighting exercise. We may, however, believe that assigning different dimension weights for
each household affects the comparability of our data. To overcome this concern, we also show
the sample dimension resilience index, which uses the average values of the dimension weights
for the sample as a whole. The project’s effect on resilience, as measured through these
indices, is reported in Section 6.8.
0
0.05
0.1
0.15
0.2
0.25
0.3 Livelihood viability
Innovation potential
Access to contingency resources and support
Integrity of natural and build environment
Social and institutional capability
Intervention households
Comparison households

Resilience in Ethiopia and Somaliland: Impact evaluation of the reconstruction project ‘Development of Enabling
Conditions for Pastoralist and Agro-Pastoralist Communities’ Effectiveness Review Series 2015–16 29
6 RESULTS This report is intended to be free from excessive technical jargon, with more detailed technical
information being reserved for the appendixes and endnotes. However, there are some
statistical concepts that cannot be avoided when discussing the results. In this report, results
will usually be stated as the average difference between the project households (referred to as
the ‘intervention group’) and the matched non-project households (named the ‘comparison
group’). In the tables of results following, statistical significance will be indicated with asterisks,
with three asterisks (***) indicating a p-value of less than 1 per cent, two asterisks (**) indicating
a p-value of less than 5 per cent and one asterisk (*) indicating a p-value of less than 10 per
cent. The higher the p-value, the less confident we are that the measured estimate reflects the
true impact, as opposed to simply random variation in the data. Results with a p-value of more
than 10 per cent are not considered to be statistically significant.
6.1 INTRODUCTION This section presents a comparison of the households containing women who were participating
in the savings and credit groups set up and supported by the project with households having
similar characteristics in the comparison communities, in terms of various outcome measures
relating to the project under review. As described above, asterisks are used in the results tables
to indicate where the differences are statistically significant at at least the 10 per cent
significance level.
All the results are shown after correcting for observed baseline differences between the
households interviewed in the project communities and those in the comparison communities
using a propensity-score matching (PSM) procedure. This means that when we report
differences in the means for intervention group outcomes and comparison group outcomes, this
is for the matched sample. More information about the procedure applied is found in Appendix
3. All outcomes discussed here have also been tested for robustness with alternative statistical
models, as described in Appendix 4. In cases where those alternative models produce markedly
different results from those shown in the tables in this section, this is discussed in the text or in
the endnotes.
There are two key limitations to our analysis, which have been described above, but are
repeated here because they directly affect the interpretation of our results:
1. A non-random minority of households were excluded from the analysis during the
matching process (31 of 236 intervention group households and 8 of the 439
comparison group households). This means that the results shown in the tables in this
section are not based on a fully representative sample of households in the project
communities.
However, the 31 households from the intervention group that were dropped from the
sample were richer and were more likely to have been engaging in non-farm livelihood
activities both at the time of the survey and at the start of 2012. As such, omitting these
observations from the sample is more likely to bias downwards the results we report
below in Section 6, by ‘artificially’ making the intervention group poorer and less
diversified in terms of livelihoods.
2. There may be ‘non-observable’ differences between the project participants and
comparison households – such as individuals’ attitudes or motivation, differences in
local leadership, weather or other contextual conditions. If these unobserved differences
also influence the potential outcomes we consider in this section, then our estimates of
the projects’ effects will be biased.
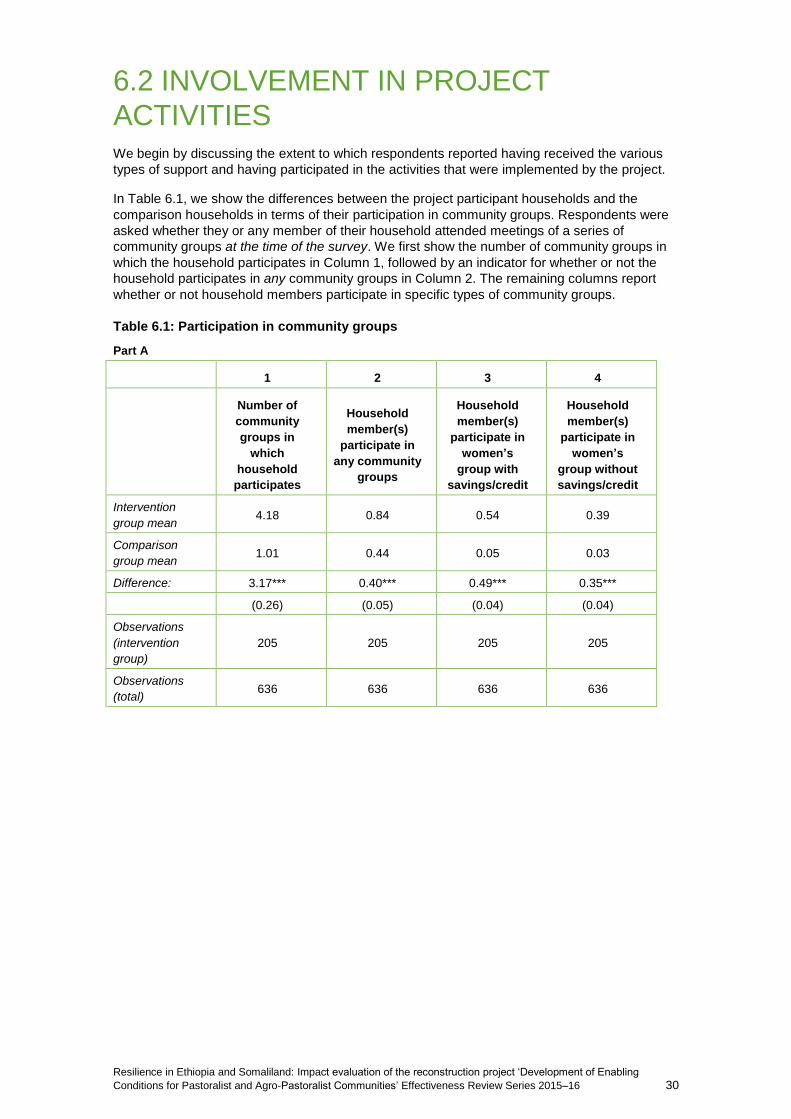
Resilience in Ethiopia and Somaliland: Impact evaluation of the reconstruction project ‘Development of Enabling
Conditions for Pastoralist and Agro-Pastoralist Communities’ Effectiveness Review Series 2015–16 30
6.2 INVOLVEMENT IN PROJECT
ACTIVITIES We begin by discussing the extent to which respondents reported having received the various
types of support and having participated in the activities that were implemented by the project.
In Table 6.1, we show the differences between the project participant households and the
comparison households in terms of their participation in community groups. Respondents were
asked whether they or any member of their household attended meetings of a series of
community groups at the time of the survey. We first show the number of community groups in
which the household participates in Column 1, followed by an indicator for whether or not the
household participates in any community groups in Column 2. The remaining columns report
whether or not household members participate in specific types of community groups.
Table 6.1: Participation in community groups
Part A
1 2 3 4
Number of
community
groups in
which
household
participates
Household
member(s)
participate in
any community
groups
Household
member(s)
participate in
women’s
group with
savings/credit
Household
member(s)
participate in
women’s
group without
savings/credit
Intervention
group mean 4.18 0.84 0.54 0.39
Comparison
group mean 1.01 0.44 0.05 0.03
Difference: 3.17*** 0.40*** 0.49*** 0.35***
(0.26) (0.05) (0.04) (0.04)
Observations
(intervention
group)
205 205 205 205
Observations
(total) 636 636 636 636
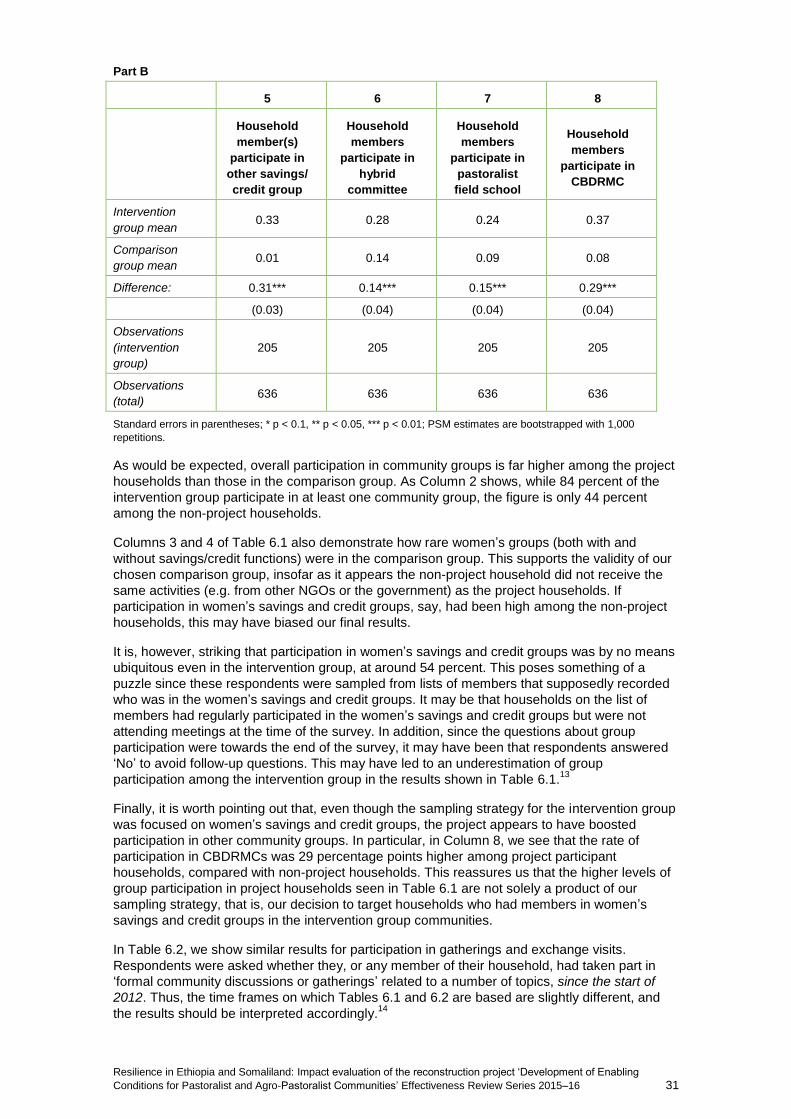
Resilience in Ethiopia and Somaliland: Impact evaluation of the reconstruction project ‘Development of Enabling
Conditions for Pastoralist and Agro-Pastoralist Communities’ Effectiveness Review Series 2015–16 31
Part B
5 6 7 8
Household
member(s)
participate in
other savings/
credit group
Household
members
participate in
hybrid
committee
Household
members
participate in
pastoralist
field school
Household
members
participate in
CBDRMC
Intervention
group mean 0.33 0.28 0.24 0.37
Comparison
group mean 0.01 0.14 0.09 0.08
Difference: 0.31*** 0.14*** 0.15*** 0.29***
(0.03) (0.04) (0.04) (0.04)
Observations
(intervention
group)
205 205 205 205
Observations
(total) 636 636 636 636
Standard errors in parentheses; * p < 0.1, ** p < 0.05, *** p < 0.01; PSM estimates are bootstrapped with 1,000
repetitions.
As would be expected, overall participation in community groups is far higher among the project
households than those in the comparison group. As Column 2 shows, while 84 percent of the
intervention group participate in at least one community group, the figure is only 44 percent
among the non-project households.
Columns 3 and 4 of Table 6.1 also demonstrate how rare women’s groups (both with and
without savings/credit functions) were in the comparison group. This supports the validity of our
chosen comparison group, insofar as it appears the non-project household did not receive the
same activities (e.g. from other NGOs or the government) as the project households. If
participation in women’s savings and credit groups, say, had been high among the non-project
households, this may have biased our final results.
It is, however, striking that participation in women’s savings and credit groups was by no means
ubiquitous even in the intervention group, at around 54 percent. This poses something of a
puzzle since these respondents were sampled from lists of members that supposedly recorded
who was in the women’s savings and credit groups. It may be that households on the list of
members had regularly participated in the women’s savings and credit groups but were not
attending meetings at the time of the survey. In addition, since the questions about group
participation were towards the end of the survey, it may have been that respondents answered
‘No’ to avoid follow-up questions. This may have led to an underestimation of group
participation among the intervention group in the results shown in Table 6.1.13
Finally, it is worth pointing out that, even though the sampling strategy for the intervention group
was focused on women’s savings and credit groups, the project appears to have boosted
participation in other community groups. In particular, in Column 8, we see that the rate of
participation in CBDRMCs was 29 percentage points higher among project participant
households, compared with non-project households. This reassures us that the higher levels of
group participation in project households seen in Table 6.1 are not solely a product of our
sampling strategy, that is, our decision to target households who had members in women’s
savings and credit groups in the intervention group communities.
In Table 6.2, we show similar results for participation in gatherings and exchange visits.
Respondents were asked whether they, or any member of their household, had taken part in
‘formal community discussions or gatherings’ related to a number of topics, since the start of
2012. Thus, the time frames on which Tables 6.1 and 6.2 are based are slightly different, and
the results should be interpreted accordingly.14

Resilience in Ethiopia and Somaliland: Impact evaluation of the reconstruction project ‘Development of Enabling
Conditions for Pastoralist and Agro-Pastoralist Communities’ Effectiveness Review Series 2015–16 32
Table 6.2: Participation in community gatherings and exchange visits
Part A
1 2 3 4 5
Number of
gatherings
participated
in since
start of 2012
Household
member(s)
participated
in any
gatherings
since start
of 2012
Gathering(s)
related to
the division
of labour
between
women and
men
Gathering(s)
related to
the
environment
al impact of
charcoal
production
Gathering(s)
related to
sports
Intervention
group mean 1.63 0.50 0.28 0.25 0.12
Comparison
group mean 0.77 0.29 0.12 0.12 0.09
Difference: 0.87*** 0.21*** 0.16*** 0.14*** 0.03
(0.18) (0.05) (0.04) (0.04) (0.03)
Observations
(intervention
group)
205 205 205 205 205
Observations
(total) 636 636 636 636 636
Part B
6 7 8 9
Gathering(s)
related to
peace-building
Gathering(s)
related to
drought
preparedness
Gatherings(s)
related to
sharing new
livelihood
practices
Participation In
exchange visits
Intervention
group mean 0.39 0.30 0.29 0.11
Comparison
group mean 0.23 0.11 0.10 0.02
Difference: 0.16*** 0.19*** 0.19*** 0.10***
(0.04) (0.04) (0.04) (0.02)
Observations
(intervention
group)
205 205 205 205
Observations
(total) 636 636 636 636
Standard errors in parentheses; * p < 0.1, ** p < 0.05, *** p < 0.01; PSM estimates are bootstrapped with 1,000
repetitions.
In general, it appears that participation in formal community discussions or gatherings is far less
widespread than participation in community groups, even though the questionnaire allowed
respondents to report the gatherings they were involved with since the start of 2012 (rather than
just the gatherings they were attending at the time of the survey). In the intervention group, just
50 percent of households had any members who had participated in any such gatherings since
the start of 2012. That said, this was significantly higher than in the comparison group, where
the analogous participation rate was just 29 percent. The largest differences between the
intervention and comparison groups appear to arise for gatherings related to the division of
labour between women and men in the household (Column 3), peace-building (Column 6),
drought preparedness (Column 7), and new livelihood practices (Column 8). By contrast,
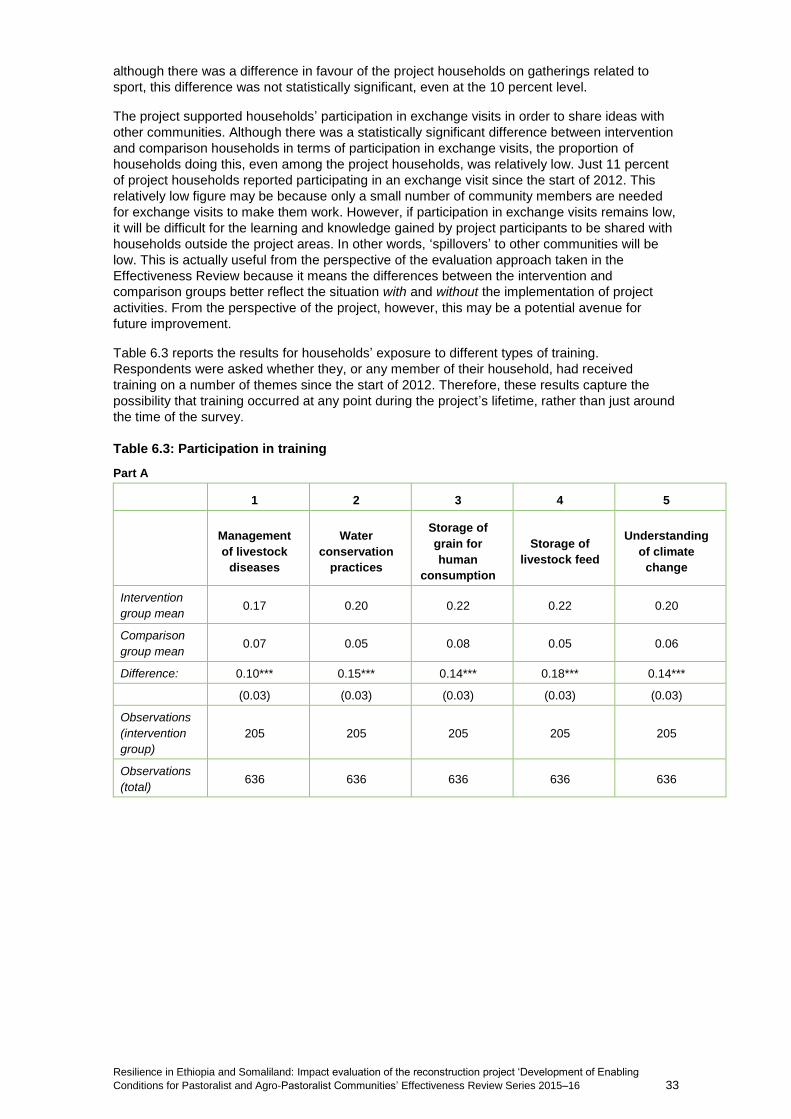
Resilience in Ethiopia and Somaliland: Impact evaluation of the reconstruction project ‘Development of Enabling
Conditions for Pastoralist and Agro-Pastoralist Communities’ Effectiveness Review Series 2015–16 33
although there was a difference in favour of the project households on gatherings related to
sport, this difference was not statistically significant, even at the 10 percent level.
The project supported households’ participation in exchange visits in order to share ideas with
other communities. Although there was a statistically significant difference between intervention
and comparison households in terms of participation in exchange visits, the proportion of
households doing this, even among the project households, was relatively low. Just 11 percent
of project households reported participating in an exchange visit since the start of 2012. This
relatively low figure may be because only a small number of community members are needed
for exchange visits to make them work. However, if participation in exchange visits remains low,
it will be difficult for the learning and knowledge gained by project participants to be shared with
households outside the project areas. In other words, ‘spillovers’ to other communities will be
low. This is actually useful from the perspective of the evaluation approach taken in the
Effectiveness Review because it means the differences between the intervention and
comparison groups better reflect the situation with and without the implementation of project
activities. From the perspective of the project, however, this may be a potential avenue for
future improvement.
Table 6.3 reports the results for households’ exposure to different types of training.
Respondents were asked whether they, or any member of their household, had received
training on a number of themes since the start of 2012. Therefore, these results capture the
possibility that training occurred at any point during the project’s lifetime, rather than just around
the time of the survey.
Table 6.3: Participation in training
Part A
1 2 3 4 5
Management
of livestock
diseases
Water
conservation
practices
Storage of
grain for
human
consumption
Storage of
livestock feed
Understanding
of climate
change
Intervention
group mean 0.17 0.20 0.22 0.22 0.20
Comparison
group mean 0.07 0.05 0.08 0.05 0.06
Difference: 0.10*** 0.15*** 0.14*** 0.18*** 0.14***
(0.03) (0.03) (0.03) (0.03) (0.03)
Observations
(intervention
group)
205 205 205 205 205
Observations
(total) 636 636 636 636 636
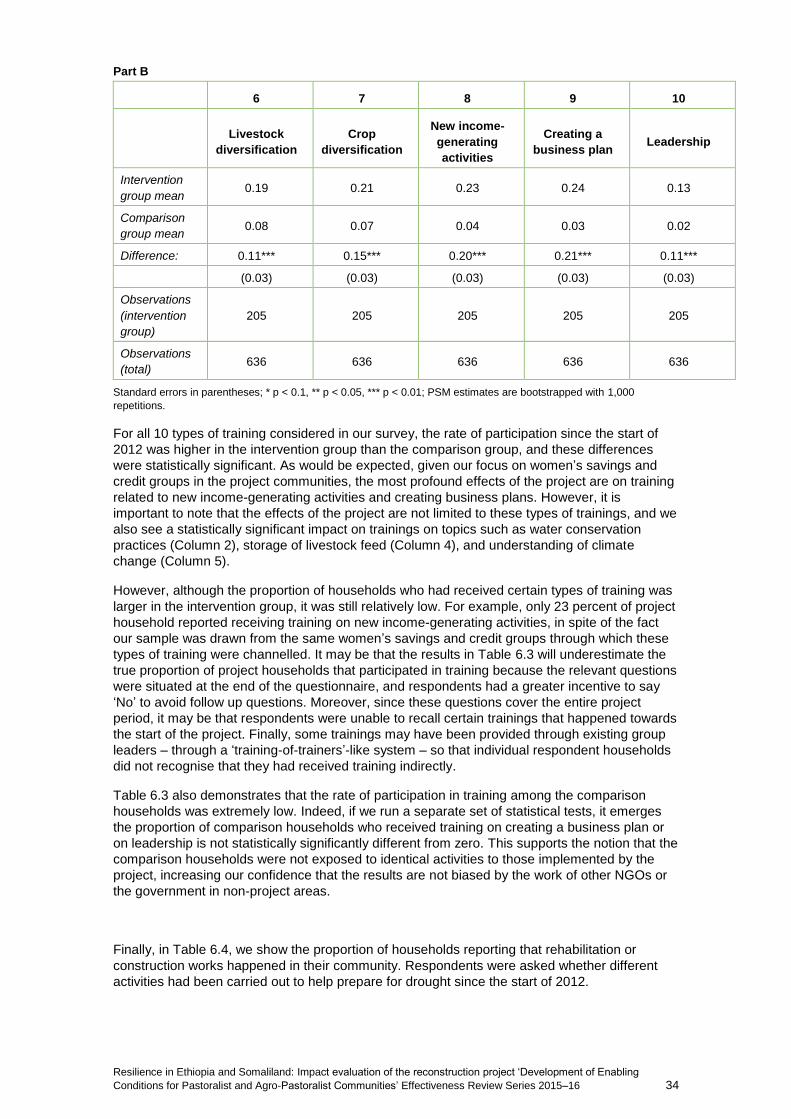
Resilience in Ethiopia and Somaliland: Impact evaluation of the reconstruction project ‘Development of Enabling
Conditions for Pastoralist and Agro-Pastoralist Communities’ Effectiveness Review Series 2015–16 34
Part B
6 7 8 9 10
Livestock
diversification
Crop
diversification
New income-
generating
activities
Creating a
business plan Leadership
Intervention
group mean 0.19 0.21 0.23 0.24 0.13
Comparison
group mean 0.08 0.07 0.04 0.03 0.02
Difference: 0.11*** 0.15*** 0.20*** 0.21*** 0.11***
(0.03) (0.03) (0.03) (0.03) (0.03)
Observations
(intervention
group)
205 205 205 205 205
Observations
(total) 636 636 636 636 636
Standard errors in parentheses; * p < 0.1, ** p < 0.05, *** p < 0.01; PSM estimates are bootstrapped with 1,000
repetitions.
For all 10 types of training considered in our survey, the rate of participation since the start of
2012 was higher in the intervention group than the comparison group, and these differences
were statistically significant. As would be expected, given our focus on women’s savings and
credit groups in the project communities, the most profound effects of the project are on training
related to new income-generating activities and creating business plans. However, it is
important to note that the effects of the project are not limited to these types of trainings, and we
also see a statistically significant impact on trainings on topics such as water conservation
practices (Column 2), storage of livestock feed (Column 4), and understanding of climate
change (Column 5).
However, although the proportion of households who had received certain types of training was
larger in the intervention group, it was still relatively low. For example, only 23 percent of project
household reported receiving training on new income-generating activities, in spite of the fact
our sample was drawn from the same women’s savings and credit groups through which these
types of training were channelled. It may be that the results in Table 6.3 will underestimate the
true proportion of project households that participated in training because the relevant questions
were situated at the end of the questionnaire, and respondents had a greater incentive to say
‘No’ to avoid follow up questions. Moreover, since these questions cover the entire project
period, it may be that respondents were unable to recall certain trainings that happened towards
the start of the project. Finally, some trainings may have been provided through existing group
leaders – through a ‘training-of-trainers’-like system – so that individual respondent households
did not recognise that they had received training indirectly.
Table 6.3 also demonstrates that the rate of participation in training among the comparison
households was extremely low. Indeed, if we run a separate set of statistical tests, it emerges
the proportion of comparison households who received training on creating a business plan or
on leadership is not statistically significantly different from zero. This supports the notion that the
comparison households were not exposed to identical activities to those implemented by the
project, increasing our confidence that the results are not biased by the work of other NGOs or
the government in non-project areas.
Finally, in Table 6.4, we show the proportion of households reporting that rehabilitation or
construction works happened in their community. Respondents were asked whether different
activities had been carried out to help prepare for drought since the start of 2012.
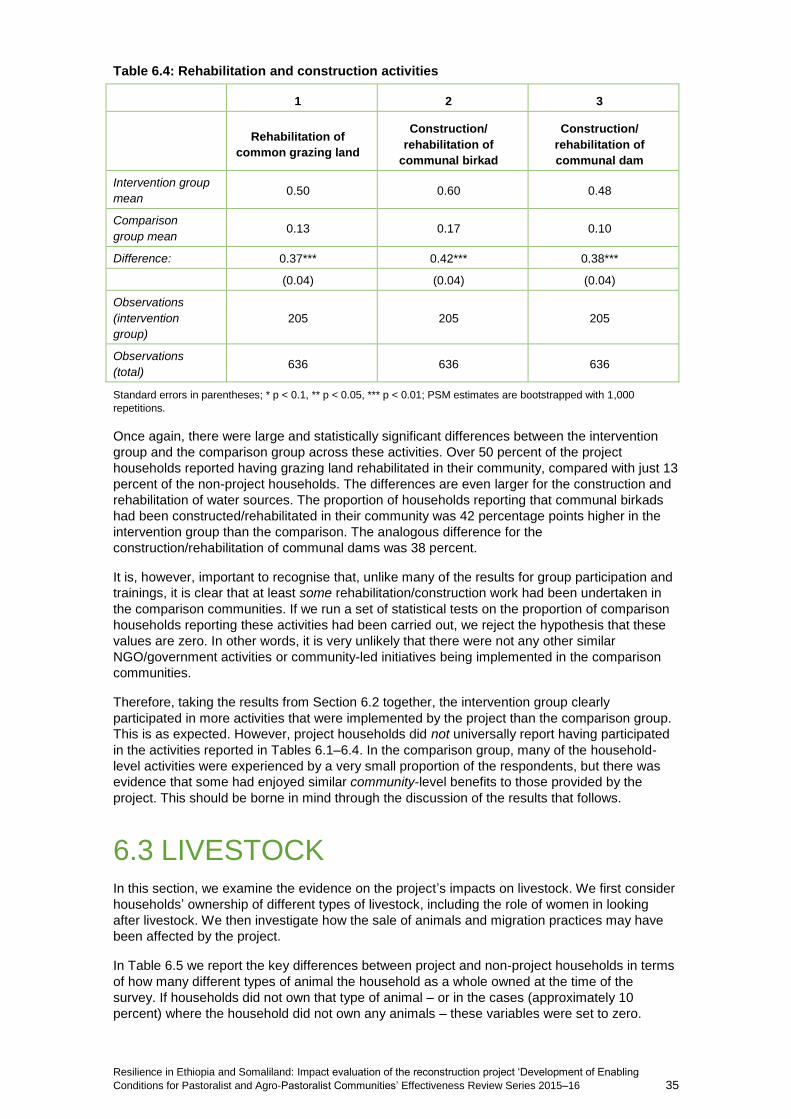
Resilience in Ethiopia and Somaliland: Impact evaluation of the reconstruction project ‘Development of Enabling
Conditions for Pastoralist and Agro-Pastoralist Communities’ Effectiveness Review Series 2015–16 35
Table 6.4: Rehabilitation and construction activities
1 2 3
Rehabilitation of
common grazing land
Construction/
rehabilitation of
communal birkad
Construction/
rehabilitation of
communal dam
Intervention group
mean 0.50 0.60 0.48
Comparison
group mean 0.13 0.17 0.10
Difference: 0.37*** 0.42*** 0.38***
(0.04) (0.04) (0.04)
Observations
(intervention
group)
205 205 205
Observations
(total) 636 636 636
Standard errors in parentheses; * p < 0.1, ** p < 0.05, *** p < 0.01; PSM estimates are bootstrapped with 1,000
repetitions.
Once again, there were large and statistically significant differences between the intervention
group and the comparison group across these activities. Over 50 percent of the project
households reported having grazing land rehabilitated in their community, compared with just 13
percent of the non-project households. The differences are even larger for the construction and
rehabilitation of water sources. The proportion of households reporting that communal birkads
had been constructed/rehabilitated in their community was 42 percentage points higher in the
intervention group than the comparison. The analogous difference for the
construction/rehabilitation of communal dams was 38 percent.
It is, however, important to recognise that, unlike many of the results for group participation and
trainings, it is clear that at least some rehabilitation/construction work had been undertaken in
the comparison communities. If we run a set of statistical tests on the proportion of comparison
households reporting these activities had been carried out, we reject the hypothesis that these
values are zero. In other words, it is very unlikely that there were not any other similar
NGO/government activities or community-led initiatives being implemented in the comparison
communities.
Therefore, taking the results from Section 6.2 together, the intervention group clearly
participated in more activities that were implemented by the project than the comparison group.
This is as expected. However, project households did not universally report having participated
in the activities reported in Tables 6.1–6.4. In the comparison group, many of the household-
level activities were experienced by a very small proportion of the respondents, but there was
evidence that some had enjoyed similar community-level benefits to those provided by the
project. This should be borne in mind through the discussion of the results that follows.
6.3 LIVESTOCK In this section, we examine the evidence on the project’s impacts on livestock. We first consider
households’ ownership of different types of livestock, including the role of women in looking
after livestock. We then investigate how the sale of animals and migration practices may have
been affected by the project.
In Table 6.5 we report the key differences between project and non-project households in terms
of how many different types of animal the household as a whole owned at the time of the
survey. If households did not own that type of animal – or in the cases (approximately 10
percent) where the household did not own any animals – these variables were set to zero.
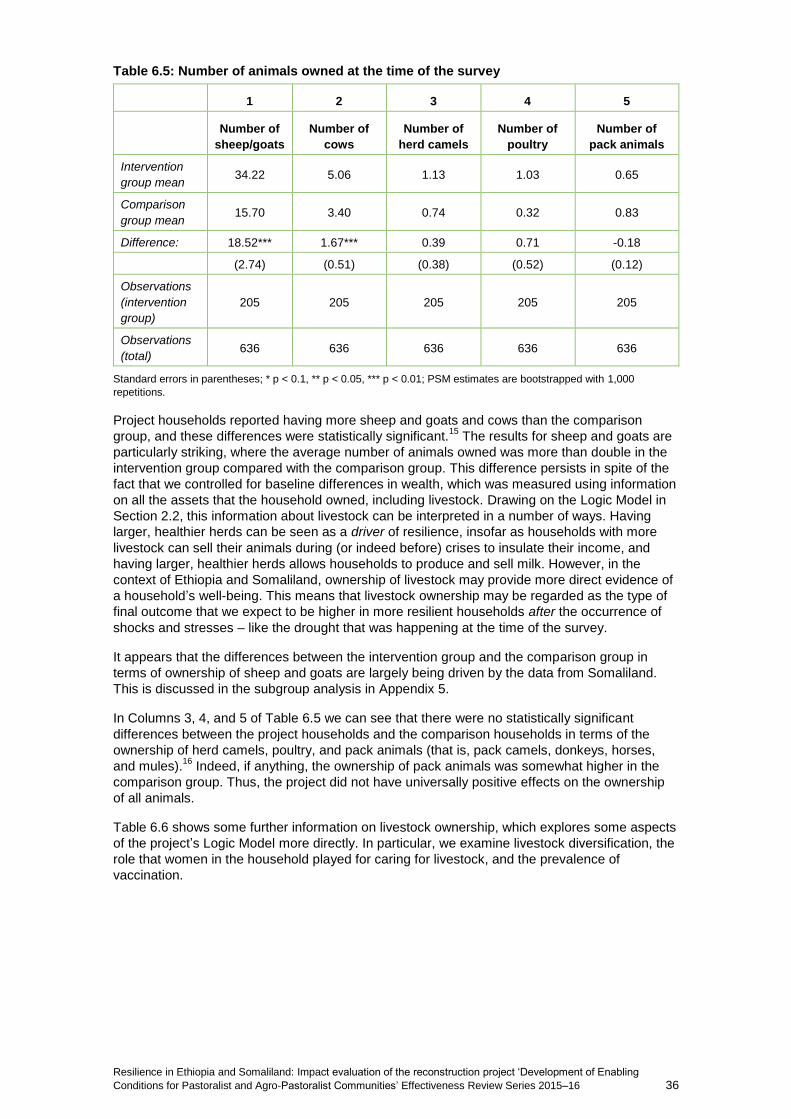
Resilience in Ethiopia and Somaliland: Impact evaluation of the reconstruction project ‘Development of Enabling
Conditions for Pastoralist and Agro-Pastoralist Communities’ Effectiveness Review Series 2015–16 36
Table 6.5: Number of animals owned at the time of the survey
1 2 3 4 5
Number of
sheep/goats
Number of
cows
Number of
herd camels
Number of
poultry
Number of
pack animals
Intervention
group mean 34.22 5.06 1.13 1.03 0.65
Comparison
group mean 15.70 3.40 0.74 0.32 0.83
Difference: 18.52*** 1.67*** 0.39 0.71 -0.18
(2.74) (0.51) (0.38) (0.52) (0.12)
Observations
(intervention
group)
205 205 205 205 205
Observations
(total) 636 636 636 636 636
Standard errors in parentheses; * p < 0.1, ** p < 0.05, *** p < 0.01; PSM estimates are bootstrapped with 1,000
repetitions.
Project households reported having more sheep and goats and cows than the comparison
group, and these differences were statistically significant.15
The results for sheep and goats are
particularly striking, where the average number of animals owned was more than double in the
intervention group compared with the comparison group. This difference persists in spite of the
fact that we controlled for baseline differences in wealth, which was measured using information
on all the assets that the household owned, including livestock. Drawing on the Logic Model in
Section 2.2, this information about livestock can be interpreted in a number of ways. Having
larger, healthier herds can be seen as a driver of resilience, insofar as households with more
livestock can sell their animals during (or indeed before) crises to insulate their income, and
having larger, healthier herds allows households to produce and sell milk. However, in the
context of Ethiopia and Somaliland, ownership of livestock may provide more direct evidence of
a household’s well-being. This means that livestock ownership may be regarded as the type of
final outcome that we expect to be higher in more resilient households after the occurrence of
shocks and stresses – like the drought that was happening at the time of the survey.
It appears that the differences between the intervention group and the comparison group in
terms of ownership of sheep and goats are largely being driven by the data from Somaliland.
This is discussed in the subgroup analysis in Appendix 5.
In Columns 3, 4, and 5 of Table 6.5 we can see that there were no statistically significant
differences between the project households and the comparison households in terms of the
ownership of herd camels, poultry, and pack animals (that is, pack camels, donkeys, horses,
and mules).16
Indeed, if anything, the ownership of pack animals was somewhat higher in the
comparison group. Thus, the project did not have universally positive effects on the ownership
of all animals.
Table 6.6 shows some further information on livestock ownership, which explores some aspects
of the project’s Logic Model more directly. In particular, we examine livestock diversification, the
role that women in the household played for caring for livestock, and the prevalence of
vaccination.

Resilience in Ethiopia and Somaliland: Impact evaluation of the reconstruction project ‘Development of Enabling
Conditions for Pastoralist and Agro-Pastoralist Communities’ Effectiveness Review Series 2015–16 37
Table 6.6: Other aspects of livestock ownership
1 2 3 4 5
Number of
types of
animals
owned
Number of
types of
animals for
which women
were mainly
responsible
Proportion of
types of
animals for
which women
were mainly
responsible
(restricted
sample)
Number of
herd animals
that were
vaccinated
Proportion of
herd animals
that were
vaccinated
Intervention
group mean 3.44 1.02 0.32 27.63 0.68
Comparison
group mean 3.35 0.65 0.21 7.60 0.47
Difference: 0.09 0.37*** 0.10*** 20.04*** 0.21***
(0.17) (0.12) (0.04) (2.60) (0.04)
Observations
(intervention
group)
205 205 196 205 183
Observations
(total) 636 636 557 636 532
Standard errors in parentheses; * p < 0.1, ** p < 0.05, *** p < 0.01; PSM estimates are bootstrapped with 1,000
repetitions.
In Column 1, we report the number of different types of animals that households owned, on
average. We can see here that there are no statistically significant differences between the
project and the matched non-project households in our sample. Thus, even if the project helped
households to increase the size of their herds, as Table 6.5 indicates, it does not appear that it
had an effect on livestock diversification.17
Columns 2 and 3 report first the number then the proportion of different types of animals for
which women were mainly responsible. It should be noted that, since around 10 percent of the
sample did not report owning any animals, the results in Column 3 are related to a selected sub-
sample of livestock-owning households. Nonetheless, these results show that women in project
households had more responsibility for animal care than in comparison households, and that
these differences were statistically significant. This supports the notion that the project boosted
women’s contribution to household income.18
Columns 4 and 5 also confirm that the project increased both the numbers and the proportions
of households’ animals that were vaccinated. We focus these results on herd animals – that is
sheep, goats, cows, and herd camels – because these comprised the largest part of
households’ livestock ownership. The results in Column 5 are especially striking, suggesting
that 68 percent of project households’ herd animals were vaccinated on average, 21 percentage
points higher than in the comparison group.
In Table 6.7 we examine how households’ livestock sales differed between the intervention
group and comparison group. In Column 1, we show the proportion of households that reported
selling any livestock in the past 12 months. This was 13 percentage points higher among the
project households than among the matched non-project households. However, it is not clear, a
priori, whether this is a positive or a negative impact. Households could sell their livestock as a
result of sensible business practices, where they maintain their herds and create profit, or out of
desperation during crises or for strategic destocking in advance of a crisis.

Resilience in Ethiopia and Somaliland: Impact evaluation of the reconstruction project ‘Development of Enabling
Conditions for Pastoralist and Agro-Pastoralist Communities’ Effectiveness Review Series 2015–16 38
Table 6.7: Livestock sales
1 2 3 4 5
Household
sold any
livestock in the
last 12 months
Household
fattened/improved
animals before
selling them
Household
fattened/improved
animals before
selling them
(restricted
sample)
Household
sold animals
in non-Jilaal
seasons
Household
sold animals
in non-Jilaal
seasons
(restricted
sample)
Intervention
group mean 0.50 0.42 0.86 0.35 0.68
Comparison
group mean 0.36 0.30 0.80 0.21 0.57
Difference: 0.13*** 0.12** 0.06 0.14*** 0.10
(0.05) (0.05) (0.06) (0.05) (0.07)
Observations
(intervention
group)
205 205 102 205 102
Observations
(total) 636 636 213 636 213
Standard errors in parentheses; * p < 0.1, ** p < 0.05, *** p < 0.01; PSM estimates are bootstrapped with 1,000
repetitions.
To try and ascertain whether the higher rate of sales among the project households represented
a positive change, we first considered whether households were fattening or improving their
animals prior to sale. In Column 2 we construct this indicator in such a way that, if the
household fattened or improved their animals prior to sale, the variable took the value one,
whereas it took the value zero if either the household made sales, but did not fatten/improve
animals or the household made no sales. Here we can see that the proportion of households
making sales after positively investing in animals before their sale was indeed higher in the
intervention group than the comparison group. However, if we restrict this sample to those
households that actually made sales, as we do in Column 3, there appear to be no statistically
significant differences between project and non-project households in terms of whether those
sales were preceded by animal fattening or improvement. In part, this may be due to the smaller
size available, when we restrict the analysis to livestock-selling households. Nonetheless, our
evidence is somewhat ambiguous about whether the project had a positive impact on pre-sale
investment in livestock.
The evidence in Columns 4 and 5, which relates to the timing of livestock sales, also appears to
be mixed. Those households that made livestock sales were asked to identify all the seasons in
which they sold their animals. In Table 6.7 we show the proportion of households in the
intervention and comparison groups that reported making sales in seasons other than Jilaal –
the long dry season. Sales made outside the Jilaal season were understood to be more positive
for household well-being, insofar as livestock prices are generally lower in the dry season when
many households may destock simultaneously. Once again, we first look at the full sample, then
restrict the data to the sub-sample of households reporting that they had in fact made sales in
the previous 12 months. The only statistically significant effects arise for the full sample (in
Column 4). As such, the evidence is, again, somewhat ambiguous in terms of whether or not
the project succeeded in supporting sales outside the Jilaal season.
Finally, in Table 6.8, we report the differences in migration practices between the intervention
and comparison groups. Respondents were asked whether anyone in their household had
migrated in the previous 12 months in response to drought, and if they did migrate they were
asked how long ago this occurred and how far they migrated before resettling.
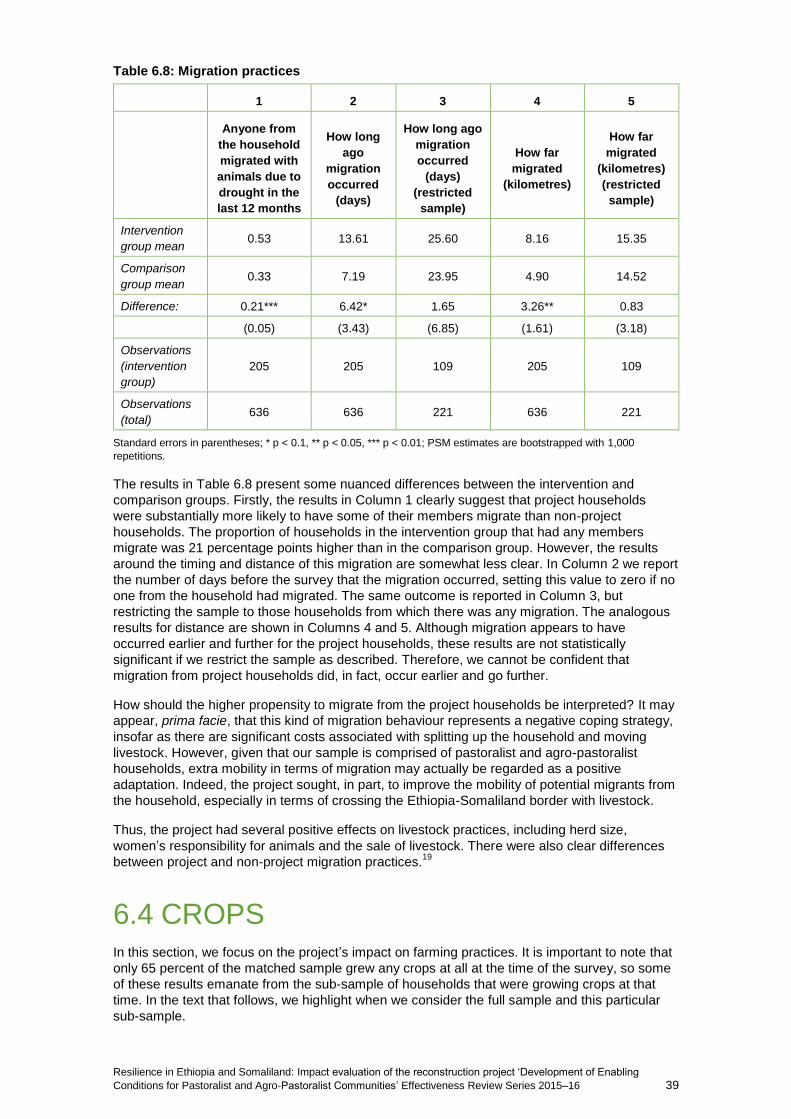
Resilience in Ethiopia and Somaliland: Impact evaluation of the reconstruction project ‘Development of Enabling
Conditions for Pastoralist and Agro-Pastoralist Communities’ Effectiveness Review Series 2015–16 39
Table 6.8: Migration practices
1 2 3 4 5
Anyone from
the household
migrated with
animals due to
drought in the
last 12 months
How long
ago
migration
occurred
(days)
How long ago
migration
occurred
(days)
(restricted
sample)
How far
migrated
(kilometres)
How far
migrated
(kilometres)
(restricted
sample)
Intervention
group mean 0.53 13.61 25.60 8.16 15.35
Comparison
group mean 0.33 7.19 23.95 4.90 14.52
Difference: 0.21*** 6.42* 1.65 3.26** 0.83
(0.05) (3.43) (6.85) (1.61) (3.18)
Observations
(intervention
group)
205 205 109 205 109
Observations
(total) 636 636 221 636 221
Standard errors in parentheses; * p < 0.1, ** p < 0.05, *** p < 0.01; PSM estimates are bootstrapped with 1,000
repetitions.
The results in Table 6.8 present some nuanced differences between the intervention and
comparison groups. Firstly, the results in Column 1 clearly suggest that project households
were substantially more likely to have some of their members migrate than non-project
households. The proportion of households in the intervention group that had any members
migrate was 21 percentage points higher than in the comparison group. However, the results
around the timing and distance of this migration are somewhat less clear. In Column 2 we report
the number of days before the survey that the migration occurred, setting this value to zero if no
one from the household had migrated. The same outcome is reported in Column 3, but
restricting the sample to those households from which there was any migration. The analogous
results for distance are shown in Columns 4 and 5. Although migration appears to have
occurred earlier and further for the project households, these results are not statistically
significant if we restrict the sample as described. Therefore, we cannot be confident that
migration from project households did, in fact, occur earlier and go further.
How should the higher propensity to migrate from the project households be interpreted? It may
appear, prima facie, that this kind of migration behaviour represents a negative coping strategy,
insofar as there are significant costs associated with splitting up the household and moving
livestock. However, given that our sample is comprised of pastoralist and agro-pastoralist
households, extra mobility in terms of migration may actually be regarded as a positive
adaptation. Indeed, the project sought, in part, to improve the mobility of potential migrants from
the household, especially in terms of crossing the Ethiopia-Somaliland border with livestock.
Thus, the project had several positive effects on livestock practices, including herd size,
women’s responsibility for animals and the sale of livestock. There were also clear differences
between project and non-project migration practices.19
6.4 CROPS In this section, we focus on the project’s impact on farming practices. It is important to note that
only 65 percent of the matched sample grew any crops at all at the time of the survey, so some
of these results emanate from the sub-sample of households that were growing crops at that
time. In the text that follows, we highlight when we consider the full sample and this particular
sub-sample.
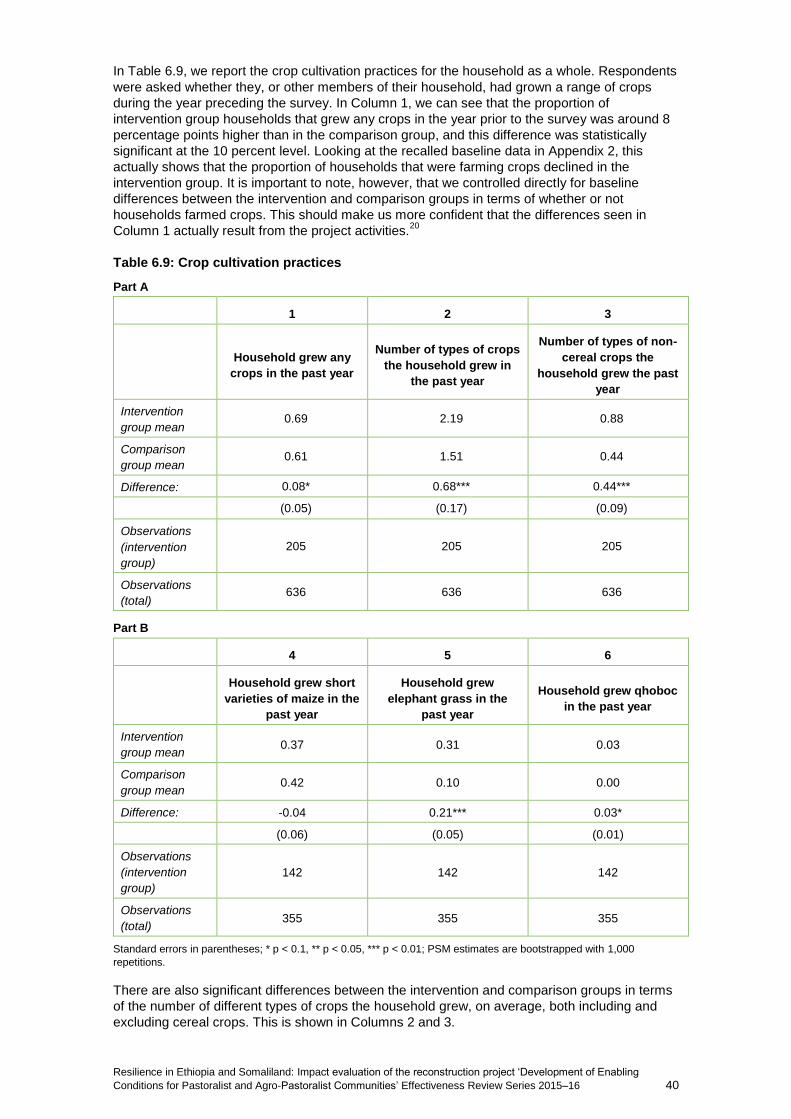
Resilience in Ethiopia and Somaliland: Impact evaluation of the reconstruction project ‘Development of Enabling
Conditions for Pastoralist and Agro-Pastoralist Communities’ Effectiveness Review Series 2015–16 40
In Table 6.9, we report the crop cultivation practices for the household as a whole. Respondents
were asked whether they, or other members of their household, had grown a range of crops
during the year preceding the survey. In Column 1, we can see that the proportion of
intervention group households that grew any crops in the year prior to the survey was around 8
percentage points higher than in the comparison group, and this difference was statistically
significant at the 10 percent level. Looking at the recalled baseline data in Appendix 2, this
actually shows that the proportion of households that were farming crops declined in the
intervention group. It is important to note, however, that we controlled directly for baseline
differences between the intervention and comparison groups in terms of whether or not
households farmed crops. This should make us more confident that the differences seen in
Column 1 actually result from the project activities.20
Table 6.9: Crop cultivation practices
Part A
1 2 3
Household grew any
crops in the past year
Number of types of crops
the household grew in
the past year
Number of types of non-
cereal crops the
household grew the past
year
Intervention
group mean 0.69 2.19 0.88
Comparison
group mean 0.61 1.51 0.44
Difference: 0.08* 0.68*** 0.44***
(0.05) (0.17) (0.09)
Observations
(intervention
group)
205 205 205
Observations
(total) 636 636 636
Part B
4 5 6
Household grew short
varieties of maize in the
past year
Household grew
elephant grass in the
past year
Household grew qhoboc
in the past year
Intervention
group mean 0.37 0.31 0.03
Comparison
group mean 0.42 0.10 0.00
Difference: -0.04 0.21*** 0.03*
(0.06) (0.05) (0.01)
Observations
(intervention
group)
142 142 142
Observations
(total) 355 355 355
Standard errors in parentheses; * p < 0.1, ** p < 0.05, *** p < 0.01; PSM estimates are bootstrapped with 1,000
repetitions.
There are also significant differences between the intervention and comparison groups in terms
of the number of different types of crops the household grew, on average, both including and
excluding cereal crops. This is shown in Columns 2 and 3.
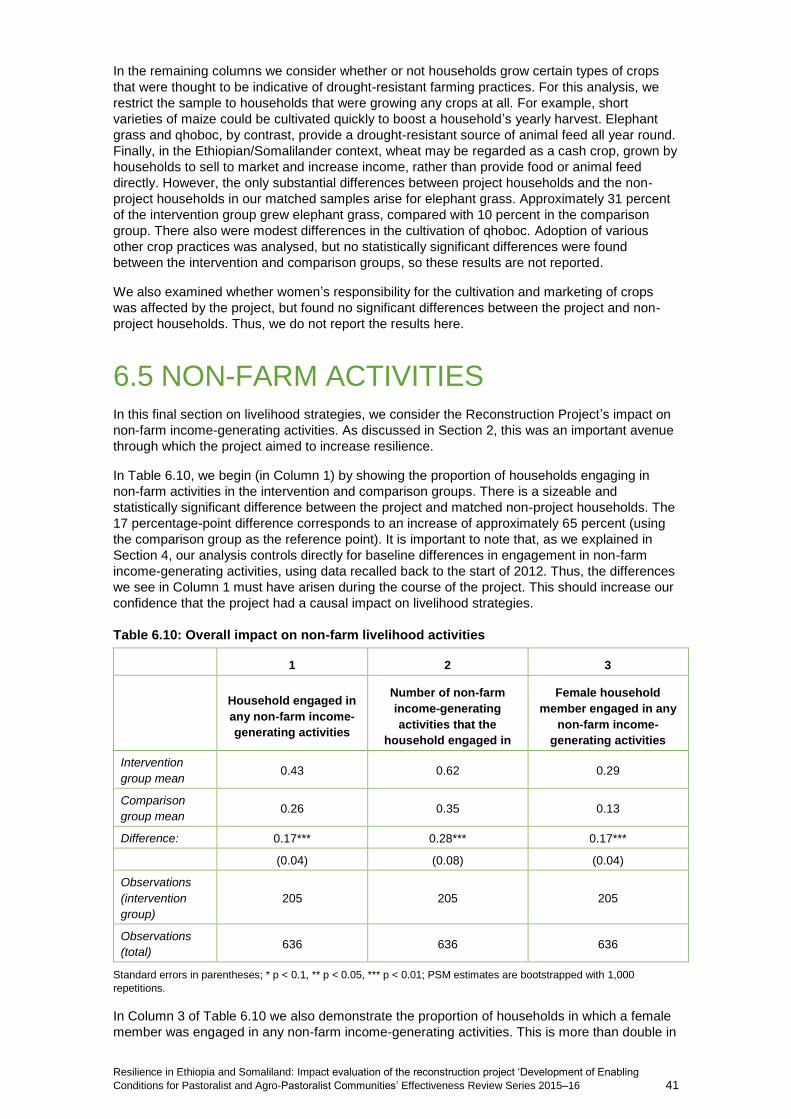
Resilience in Ethiopia and Somaliland: Impact evaluation of the reconstruction project ‘Development of Enabling
Conditions for Pastoralist and Agro-Pastoralist Communities’ Effectiveness Review Series 2015–16 41
In the remaining columns we consider whether or not households grow certain types of crops
that were thought to be indicative of drought-resistant farming practices. For this analysis, we
restrict the sample to households that were growing any crops at all. For example, short
varieties of maize could be cultivated quickly to boost a household’s yearly harvest. Elephant
grass and qhoboc, by contrast, provide a drought-resistant source of animal feed all year round.
Finally, in the Ethiopian/Somalilander context, wheat may be regarded as a cash crop, grown by
households to sell to market and increase income, rather than provide food or animal feed
directly. However, the only substantial differences between project households and the non-
project households in our matched samples arise for elephant grass. Approximately 31 percent
of the intervention group grew elephant grass, compared with 10 percent in the comparison
group. There also were modest differences in the cultivation of qhoboc. Adoption of various
other crop practices was analysed, but no statistically significant differences were found
between the intervention and comparison groups, so these results are not reported.
We also examined whether women’s responsibility for the cultivation and marketing of crops
was affected by the project, but found no significant differences between the project and non-
project households. Thus, we do not report the results here.
6.5 NON-FARM ACTIVITIES In this final section on livelihood strategies, we consider the Reconstruction Project’s impact on
non-farm income-generating activities. As discussed in Section 2, this was an important avenue
through which the project aimed to increase resilience.
In Table 6.10, we begin (in Column 1) by showing the proportion of households engaging in
non-farm activities in the intervention and comparison groups. There is a sizeable and
statistically significant difference between the project and matched non-project households. The
17 percentage-point difference corresponds to an increase of approximately 65 percent (using
the comparison group as the reference point). It is important to note that, as we explained in
Section 4, our analysis controls directly for baseline differences in engagement in non-farm
income-generating activities, using data recalled back to the start of 2012. Thus, the differences
we see in Column 1 must have arisen during the course of the project. This should increase our
confidence that the project had a causal impact on livelihood strategies.
Table 6.10: Overall impact on non-farm livelihood activities
1 2 3
Household engaged in
any non-farm income-
generating activities
Number of non-farm
income-generating
activities that the
household engaged in
Female household
member engaged in any
non-farm income-
generating activities
Intervention
group mean 0.43 0.62 0.29
Comparison
group mean 0.26 0.35 0.13
Difference: 0.17*** 0.28*** 0.17***
(0.04) (0.08) (0.04)
Observations
(intervention
group)
205 205 205
Observations
(total) 636 636 636
Standard errors in parentheses; * p < 0.1, ** p < 0.05, *** p < 0.01; PSM estimates are bootstrapped with 1,000
repetitions.
In Column 3 of Table 6.10 we also demonstrate the proportion of households in which a female
member was engaged in any non-farm income-generating activities. This is more than double in
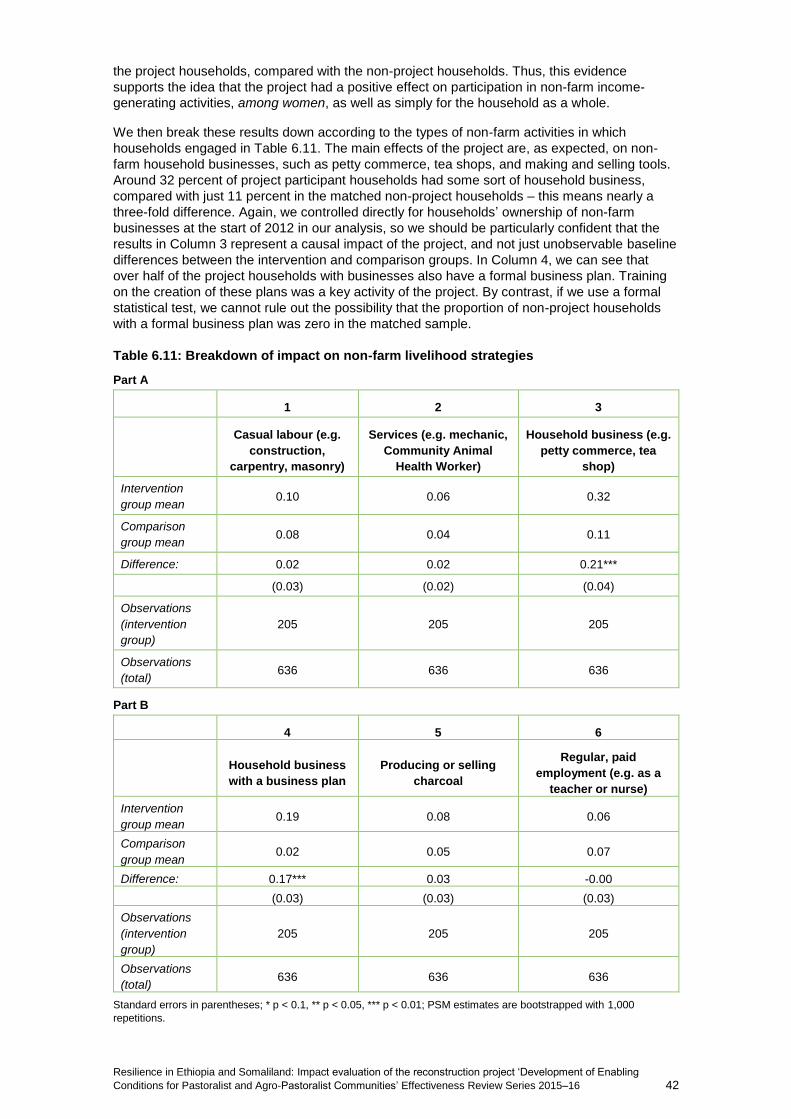
Resilience in Ethiopia and Somaliland: Impact evaluation of the reconstruction project ‘Development of Enabling
Conditions for Pastoralist and Agro-Pastoralist Communities’ Effectiveness Review Series 2015–16 42
the project households, compared with the non-project households. Thus, this evidence
supports the idea that the project had a positive effect on participation in non-farm income-
generating activities, among women, as well as simply for the household as a whole.
We then break these results down according to the types of non-farm activities in which
households engaged in Table 6.11. The main effects of the project are, as expected, on non-
farm household businesses, such as petty commerce, tea shops, and making and selling tools.
Around 32 percent of project participant households had some sort of household business,
compared with just 11 percent in the matched non-project households – this means nearly a
three-fold difference. Again, we controlled directly for households’ ownership of non-farm
businesses at the start of 2012 in our analysis, so we should be particularly confident that the
results in Column 3 represent a causal impact of the project, and not just unobservable baseline
differences between the intervention and comparison groups. In Column 4, we can see that
over half of the project households with businesses also have a formal business plan. Training
on the creation of these plans was a key activity of the project. By contrast, if we use a formal
statistical test, we cannot rule out the possibility that the proportion of non-project households
with a formal business plan was zero in the matched sample.
Table 6.11: Breakdown of impact on non-farm livelihood strategies
Part A
1 2 3
Casual labour (e.g.
construction,
carpentry, masonry)
Services (e.g. mechanic,
Community Animal
Health Worker)
Household business (e.g.
petty commerce, tea
shop)
Intervention
group mean 0.10 0.06 0.32
Comparison
group mean 0.08 0.04 0.11
Difference: 0.02 0.02 0.21***
(0.03) (0.02) (0.04)
Observations
(intervention
group)
205 205 205
Observations
(total) 636 636 636
Part B
4 5 6
Household business
with a business plan
Producing or selling
charcoal
Regular, paid
employment (e.g. as a
teacher or nurse)
Intervention
group mean 0.19 0.08 0.06
Comparison
group mean 0.02 0.05 0.07
Difference: 0.17*** 0.03 -0.00
(0.03) (0.03) (0.03)
Observations
(intervention
group)
205 205 205
Observations
(total) 636 636 636
Standard errors in parentheses; * p < 0.1, ** p < 0.05, *** p < 0.01; PSM estimates are bootstrapped with 1,000
repetitions.
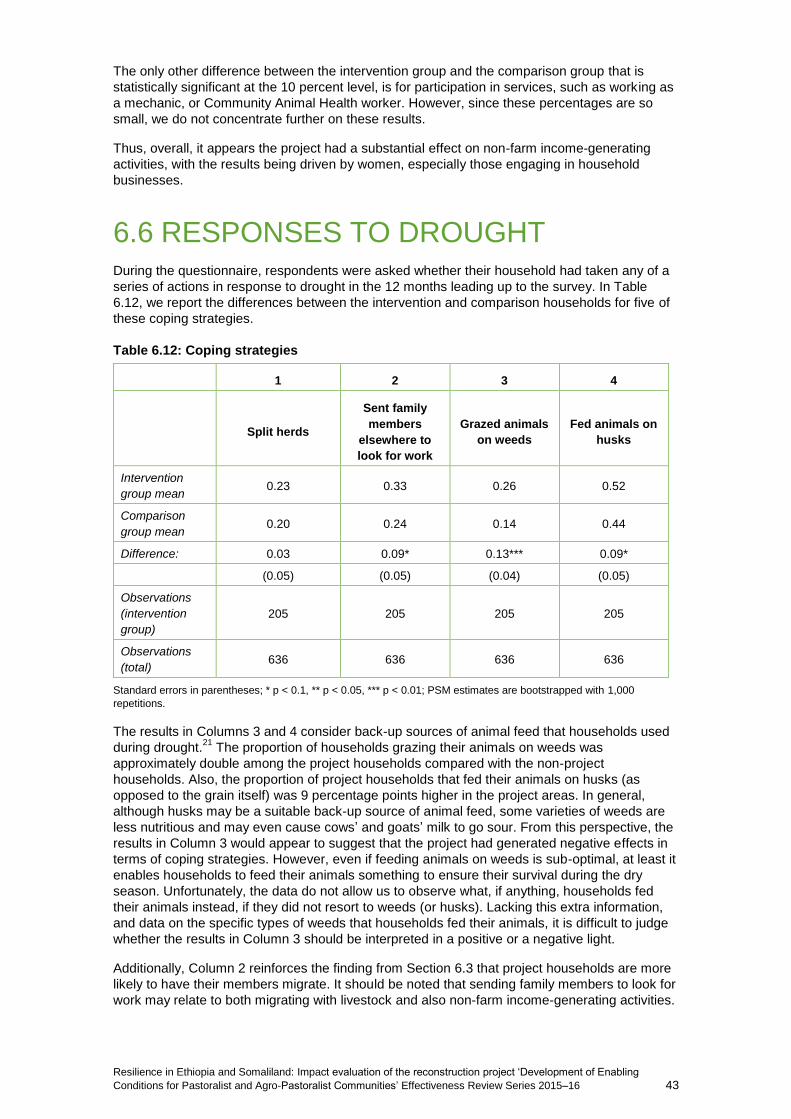
Resilience in Ethiopia and Somaliland: Impact evaluation of the reconstruction project ‘Development of Enabling
Conditions for Pastoralist and Agro-Pastoralist Communities’ Effectiveness Review Series 2015–16 43
The only other difference between the intervention group and the comparison group that is
statistically significant at the 10 percent level, is for participation in services, such as working as
a mechanic, or Community Animal Health worker. However, since these percentages are so
small, we do not concentrate further on these results.
Thus, overall, it appears the project had a substantial effect on non-farm income-generating
activities, with the results being driven by women, especially those engaging in household
businesses.
6.6 RESPONSES TO DROUGHT During the questionnaire, respondents were asked whether their household had taken any of a
series of actions in response to drought in the 12 months leading up to the survey. In Table
6.12, we report the differences between the intervention and comparison households for five of
these coping strategies.
Table 6.12: Coping strategies
1 2 3 4
Split herds
Sent family
members
elsewhere to
look for work
Grazed animals
on weeds
Fed animals on
husks
Intervention
group mean 0.23 0.33 0.26 0.52
Comparison
group mean 0.20 0.24 0.14 0.44
Difference: 0.03 0.09* 0.13*** 0.09*
(0.05) (0.05) (0.04) (0.05)
Observations
(intervention
group)
205 205 205 205
Observations
(total) 636 636 636 636
Standard errors in parentheses; * p < 0.1, ** p < 0.05, *** p < 0.01; PSM estimates are bootstrapped with 1,000
repetitions.
The results in Columns 3 and 4 consider back-up sources of animal feed that households used
during drought.21
The proportion of households grazing their animals on weeds was
approximately double among the project households compared with the non-project
households. Also, the proportion of project households that fed their animals on husks (as
opposed to the grain itself) was 9 percentage points higher in the project areas. In general,
although husks may be a suitable back-up source of animal feed, some varieties of weeds are
less nutritious and may even cause cows’ and goats’ milk to go sour. From this perspective, the
results in Column 3 would appear to suggest that the project had generated negative effects in
terms of coping strategies. However, even if feeding animals on weeds is sub-optimal, at least it
enables households to feed their animals something to ensure their survival during the dry
season. Unfortunately, the data do not allow us to observe what, if anything, households fed
their animals instead, if they did not resort to weeds (or husks). Lacking this extra information,
and data on the specific types of weeds that households fed their animals, it is difficult to judge
whether the results in Column 3 should be interpreted in a positive or a negative light.
Additionally, Column 2 reinforces the finding from Section 6.3 that project households are more
likely to have their members migrate. It should be noted that sending family members to look for
work may relate to both migrating with livestock and also non-farm income-generating activities.

Resilience in Ethiopia and Somaliland: Impact evaluation of the reconstruction project ‘Development of Enabling
Conditions for Pastoralist and Agro-Pastoralist Communities’ Effectiveness Review Series 2015–16 44
6.7 WEALTH In this section, we explore the project’s impact on households’ wealth. Like livestock, wealth
may be interpreted in two ways from the perspective of resilience. Firstly, wealth may be seen
as a driver of resilience, insofar as households can sell off assets in times of crisis but also more
easily finance the costly investments needed to adapt livelihood strategies and innovate.
However, wealth may also been regarded as exactly the type of well-being indicator – a ‘final’
outcome – which would be improved in spite of shocks, stresses, and uncertainty in more
resilient households. Typically, these types of final well-being outcomes take more time to
change than more immediate drivers or characteristics of resilience.
During the course of the questionnaire, respondents were asked to provide information about
their own household’s ownership of various assets (including livestock, productive equipment,
and household goods), as well as about the conditions of the family’s house, both at the start of
2012 and at the time of the survey. This information on asset ownership and housing conditions
was used to generate an index of overall household wealth.
The wealth index was generated under the assumption that, if each of the assets and housing
characteristics constituted suitable indicators of household wealth, they should be correlated
with each other. That is, a household that scores favourably on one particular wealth indicator
should be more likely to do so for other wealth indicators. A small number of items that had low
or negative correlations with the others were therefore not considered to be good wealth
indicators and so were excluded from the index.22
A data reduction technique called principal component analysis (PCA) was used to produce two
indices of overall wealth, one based on the recalled data from the start of 2012, and one based
on the household’s situation at the time of the survey. In particular, our wealth index is taken
directly from the first principal component.23
PCA enables us to assign weights to the different
assets, to capture as much information as possible from the data. Broadly, PCA assigns more
weight to those assets that are less correlated with all the other assets, as these carry more
information. By contrast, items with more intra-correlation are given less weight.
In order to ensure the same weights were applied to assets for both the recalled wealth index
and the wealth index for the time of the survey, data from these two time periods were pooled
before undertaking the PCA procedure. This means changes in wealth can be more easily
compared over time. It should also be noted that the wealth index for the start of 2012 is the
measure that has been used throughout this analysis to control for baseline differences in
wealth status between project and non-project households.
For the analysis in this section, we start by ‘normalising’ the wealth index.24
This means that the
impacts of the project that we report can be directly understood as the number of standard
deviations by which the project improved wealth. This means the results from this Effectiveness
Review can be more easily compared to other similar evaluations. In Table 6.13, we estimate
the project’s impact on wealth in two ways. In Column 1 we report wealth for the project and
non-project households at the time of the survey, using the regular matching procedure that has
been used throughout the other tables in this report. In Column 2, however, we take a slightly
different approach. We calculate the differences between wealth at the time of the survey and at
the start of 2012, and compare these differences between project and non-project households
in the matched sample. For the results in Column 2, it is necessary to omit recalled wealth from
the matching process.25
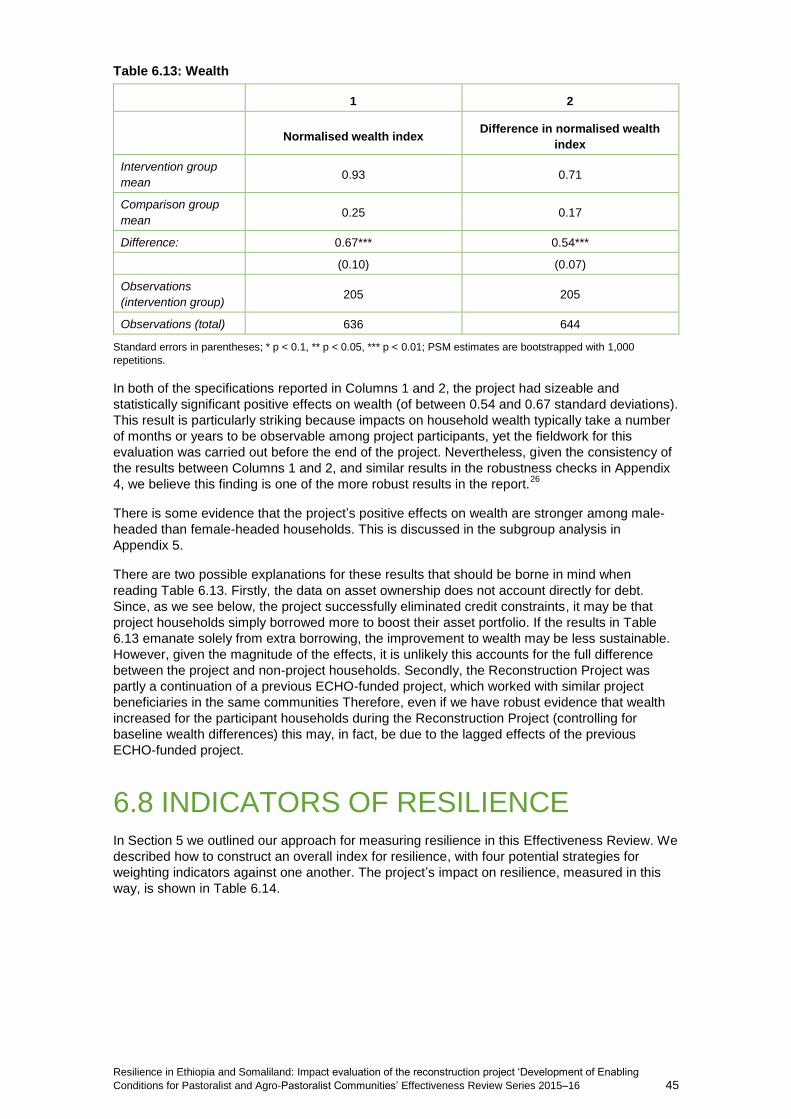
Resilience in Ethiopia and Somaliland: Impact evaluation of the reconstruction project ‘Development of Enabling
Conditions for Pastoralist and Agro-Pastoralist Communities’ Effectiveness Review Series 2015–16 45
Table 6.13: Wealth
1 2
Normalised wealth index Difference in normalised wealth
index
Intervention group
mean 0.93 0.71
Comparison group
mean 0.25 0.17
Difference: 0.67*** 0.54***
(0.10) (0.07)
Observations
(intervention group) 205 205
Observations (total) 636 644
Standard errors in parentheses; * p < 0.1, ** p < 0.05, *** p < 0.01; PSM estimates are bootstrapped with 1,000
repetitions.
In both of the specifications reported in Columns 1 and 2, the project had sizeable and
statistically significant positive effects on wealth (of between 0.54 and 0.67 standard deviations).
This result is particularly striking because impacts on household wealth typically take a number
of months or years to be observable among project participants, yet the fieldwork for this
evaluation was carried out before the end of the project. Nevertheless, given the consistency of
the results between Columns 1 and 2, and similar results in the robustness checks in Appendix
4, we believe this finding is one of the more robust results in the report.26
There is some evidence that the project’s positive effects on wealth are stronger among male-
headed than female-headed households. This is discussed in the subgroup analysis in
Appendix 5.
There are two possible explanations for these results that should be borne in mind when
reading Table 6.13. Firstly, the data on asset ownership does not account directly for debt.
Since, as we see below, the project successfully eliminated credit constraints, it may be that
project households simply borrowed more to boost their asset portfolio. If the results in Table
6.13 emanate solely from extra borrowing, the improvement to wealth may be less sustainable.
However, given the magnitude of the effects, it is unlikely this accounts for the full difference
between the project and non-project households. Secondly, the Reconstruction Project was
partly a continuation of a previous ECHO-funded project, which worked with similar project
beneficiaries in the same communities Therefore, even if we have robust evidence that wealth
increased for the participant households during the Reconstruction Project (controlling for
baseline wealth differences) this may, in fact, be due to the lagged effects of the previous
ECHO-funded project.
6.8 INDICATORS OF RESILIENCE In Section 5 we outlined our approach for measuring resilience in this Effectiveness Review. We
described how to construct an overall index for resilience, with four potential strategies for
weighting indicators against one another. The project’s impact on resilience, measured in this
way, is shown in Table 6.14.

Resilience in Ethiopia and Somaliland: Impact evaluation of the reconstruction project ‘Development of Enabling
Conditions for Pastoralist and Agro-Pastoralist Communities’ Effectiveness Review Series 2015–16 46
Table 6.14: Indices of resilience
1 2 3 4
Base resilience
index
Equal
dimensions
resilience index
Personal
dimensions
resilience index
Sample
dimensions
resilience index
Intervention
group mean 0.47 0.48 0.47 0.47
Comparison
group mean 0.37 0.38 0.37 0.37
Difference: 0.11*** 0.10*** 0.10*** 0.10***
(0.01) (0.01) (0.01) (0.01)
Observations
(intervention
group)
205 205 205 205
Observations
(total) 636 636 636 636
Standard errors in parentheses; * p < 0.1, ** p < 0.05, *** p < 0.01; PSM estimates are bootstrapped with 1,000
repetitions
There is clear evidence that the project had a positive impact on households’ resilience. Using
all four weighting strategies, the resilience index was approximately 10 percentage points higher
in the intervention group compared with the comparison group. Focusing just on the base
resilience index in Column 1, the results imply that project households scored positively, on
average, in 47 percent of the resilience indicators, compared with just 37 percent for the
comparison group. This corresponds to a difference of approximately 27 percent, using the non-
project households as a reference point. All of these results were statistically significant, even at
the 1 percent level.
In the subgroup analysis Appendix 5, we also show that there are some differences between
Ethiopia and Somaliland in terms of the resilience index and the effects of the project. It appears
that, on average, the Ethiopian households in our sample were less resilient than the
Somalilander households, but that the project had more a more sizeable overall impact on
resilience in Ethiopia.
To understand better what is driving these positive impacts on the resilience index, it is
important to compare project and comparison households in terms of all the constituent
indicators. To gain an initial overview, Figure 6.1 presents the average proportions of
intervention and comparison group households scoring positively on each of the resilience
indicators. We then describe the results under each dimension of resilience in the sub-sections
that follow.
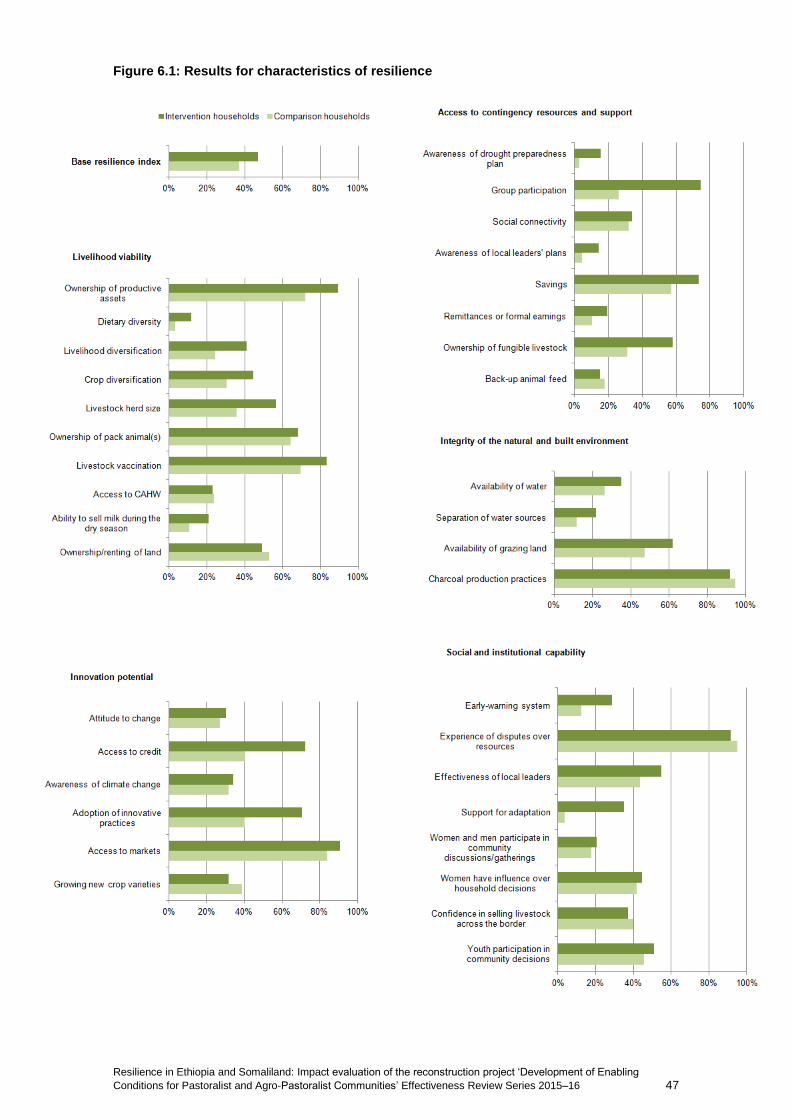
Resilience in Ethiopia and Somaliland: Impact evaluation of the reconstruction project ‘Development of Enabling
Conditions for Pastoralist and Agro-Pastoralist Communities’ Effectiveness Review Series 2015–16 47
Figure 6.1: Results for characteristics of resilience
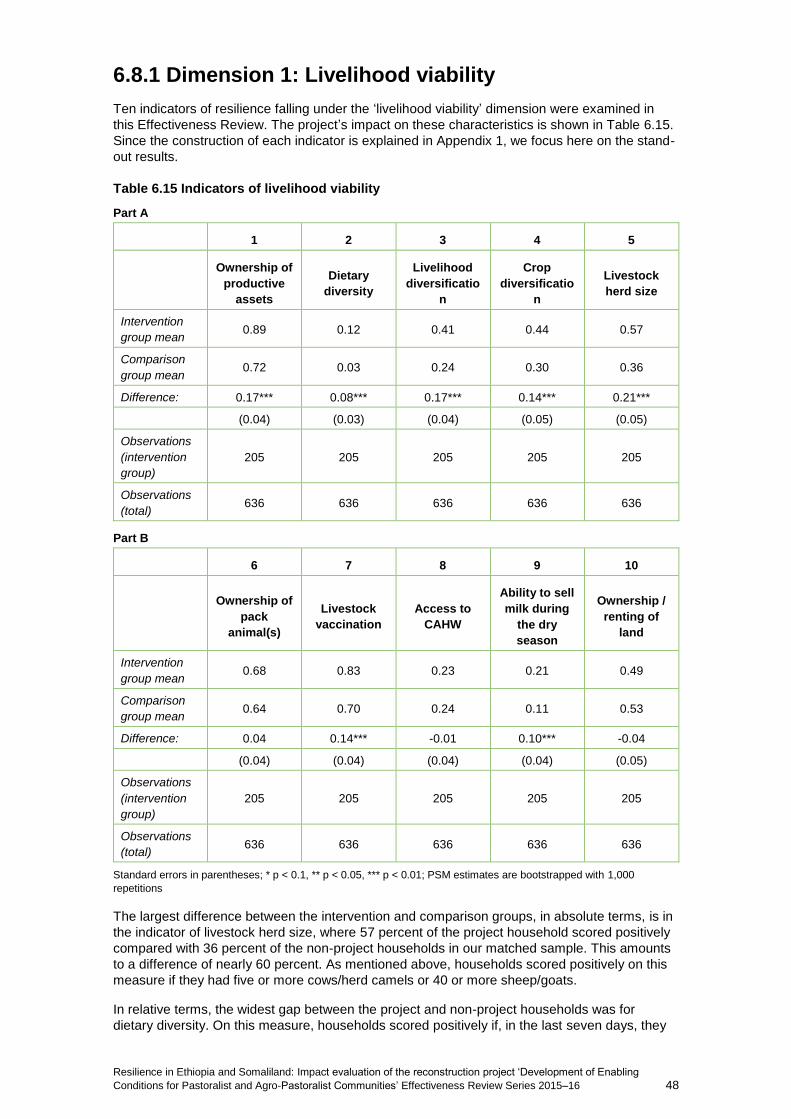
Resilience in Ethiopia and Somaliland: Impact evaluation of the reconstruction project ‘Development of Enabling
Conditions for Pastoralist and Agro-Pastoralist Communities’ Effectiveness Review Series 2015–16 48
6.8.1 Dimension 1: Livelihood viability
Ten indicators of resilience falling under the ‘livelihood viability’ dimension were examined in
this Effectiveness Review. The project’s impact on these characteristics is shown in Table 6.15.
Since the construction of each indicator is explained in Appendix 1, we focus here on the stand-
out results.
Table 6.15 Indicators of livelihood viability
Part A
1 2 3 4 5
Ownership of
productive
assets
Dietary
diversity
Livelihood
diversificatio
n
Crop
diversificatio
n
Livestock
herd size
Intervention
group mean 0.89 0.12 0.41 0.44 0.57
Comparison
group mean 0.72 0.03 0.24 0.30 0.36
Difference: 0.17*** 0.08*** 0.17*** 0.14*** 0.21***
(0.04) (0.03) (0.04) (0.05) (0.05)
Observations
(intervention
group)
205 205 205 205 205
Observations
(total) 636 636 636 636 636
Part B
6 7 8 9 10
Ownership of
pack
animal(s)
Livestock
vaccination
Access to
CAHW
Ability to sell
milk during
the dry
season
Ownership /
renting of
land
Intervention
group mean 0.68 0.83 0.23 0.21 0.49
Comparison
group mean 0.64 0.70 0.24 0.11 0.53
Difference: 0.04 0.14*** -0.01 0.10*** -0.04
(0.04) (0.04) (0.04) (0.04) (0.05)
Observations
(intervention
group)
205 205 205 205 205
Observations
(total) 636 636 636 636 636
Standard errors in parentheses; * p < 0.1, ** p < 0.05, *** p < 0.01; PSM estimates are bootstrapped with 1,000
repetitions
The largest difference between the intervention and comparison groups, in absolute terms, is in
the indicator of livestock herd size, where 57 percent of the project household scored positively
compared with 36 percent of the non-project households in our matched sample. This amounts
to a difference of nearly 60 percent. As mentioned above, households scored positively on this
measure if they had five or more cows/herd camels or 40 or more sheep/goats.
In relative terms, the widest gap between the project and non-project households was for
dietary diversity. On this measure, households scored positively if, in the last seven days, they

Resilience in Ethiopia and Somaliland: Impact evaluation of the reconstruction project ‘Development of Enabling
Conditions for Pastoralist and Agro-Pastoralist Communities’ Effectiveness Review Series 2015–16 49
had consumed a carbohydrate source every day, a protein source on at least three days, and
some fruit or vegetables on at least three days. The 8 percentage point gap between the
intervention and comparison groups corresponds to nearly a three-fold difference, using the
comparison group as the reference point. This result prevails because so few households, both
in and out of the project, met the threshold for dietary diversity.
There is no evidence of positive change for three out of the ten characteristics identified under
the livelihood viability dimension: (1) ownership of pack animals, (2) access to Community
Animal Health Workers (CAHW), and (3) ownership/rental of land. The second of these is
particularly surprising because this is something the project had worked directly on. However,
access to CAHWs was higher, if anything, in the comparison group (although this difference is
not statistically significant). In part, this may reflect complementary activities being undertaken
by the government and/or other NGOs in non-project communities. It may also be that the
CAHWs cover an area larger than the project communities in which they are based, so these
effects of the project spilled over into the comparison group.
6.8.2 Dimension 2: Innovation potential
We identified six characteristics that were thought to capture ‘innovation potential’ in this
Effectiveness Review. We report these results in Table 6.16, once again concentrating on the
main results in the following text and reserving the full explanation of each indicator for
Appendix 1.
Table 6.16: Indicators of innovation potential
Part A
1 2 3
Attitude to change Access to credit Awareness of climate
change
Intervention
group mean 0.30 0.72 0.34
Comparison
group mean 0.27 0.40 0.32
Difference: 0.03 0.32*** 0.03
(0.05) (0.05) (0.05)
Observations
(intervention
group)
205 205 205
Observations
(total) 636 636 636

Resilience in Ethiopia and Somaliland: Impact evaluation of the reconstruction project ‘Development of Enabling
Conditions for Pastoralist and Agro-Pastoralist Communities’ Effectiveness Review Series 2015–16 50
Part B
4 5 6
Adoption of innovative
practices Access to markets
Growing new crop
varieties
Intervention
group mean 0.71 0.91 0.32
Comparison
group mean 0.40 0.84 0.39
Difference: 0.30*** 0.07** -0.07
(0.05) (0.03) (0.05)
Observations
(intervention
group)
205 205 205
Observations
(total) 636 636 636
Standard errors in parentheses; * p < 0.1, ** p < 0.05, *** p < 0.01; PSM estimates are bootstrapped with 1,000
repetitions
Project households had substantially better access to credit than their non-project comparators,
and they were more able to adopt innovative practices. In the intervention group 72 percent of
households suggested they would be able to borrow 3,000 birr for a business opportunity (from
at least one source) compared with just 40 percent of the comparison group. This matches the
intended project logic presented in Section 2. It was hoped that participants in the women’s
savings and credit groups would be less constrained over borrowing to finance new livelihood
practices. Importantly, the indicator on adoption of innovative practices is restricted to those
innovations that were not directly related to the activities of the project. Thus, the 30 percentage
point difference between project and non-project households in our matched sample indicates
that those in the intervention group had done more than simply absorb the training and direct
inputs emanating from the project.
In spite of these concrete improvements, the project does not appear to have had a statistically
significant effect on respondents’ attitudes to change/new livelihood practices or their
awareness of climate change. These attitudes were extracted from a set of opinions questions,
during which respondents were asked to choose between two options. The options were written
so that there were no ‘right’ or ‘wrong’ answers. For example, one of the questions relating to
attitude to change asked respondents whether they agreed more with; (1) ‘We should not be
afraid to try new and different livelihood activities – sometimes they are better than the
traditional livelihood activities’ or (2) ‘It is best to continue doing what we already know and do
well, rather than experimenting with new approaches’. Given that attitudes were similar between
the intervention and comparison groups, it seems plausible that project households’ greater
ability to innovate arose because hard constraints – such as credit – were relaxed (as opposed
to the preferences of the project households actually being changed).
6.8.3 Dimension 3: Access to contingency resources and support
We used eight indicators to measure ‘access to contingency resources and support’ in this
Effectiveness Review, many of which draw on indicators that have been discussed previously in
this report. These results are presented in Table 6.17.
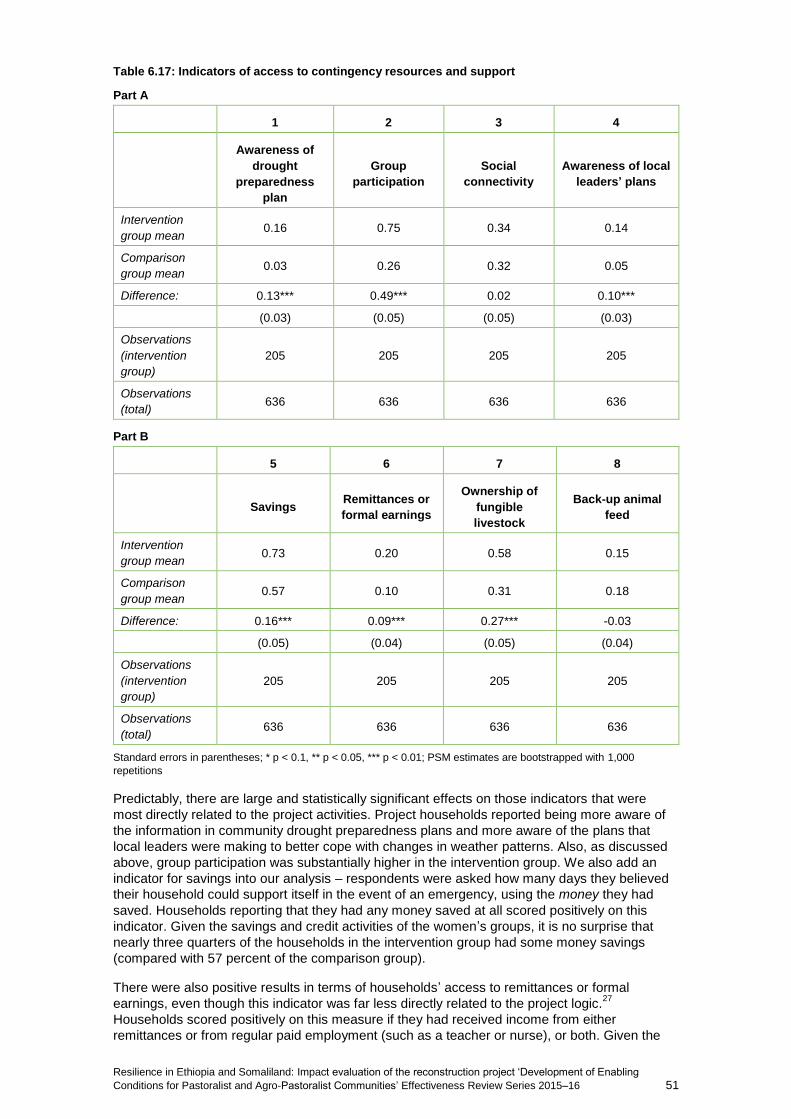
Resilience in Ethiopia and Somaliland: Impact evaluation of the reconstruction project ‘Development of Enabling
Conditions for Pastoralist and Agro-Pastoralist Communities’ Effectiveness Review Series 2015–16 51
Table 6.17: Indicators of access to contingency resources and support
Part A
1 2 3 4
Awareness of
drought
preparedness
plan
Group
participation
Social
connectivity
Awareness of local
leaders’ plans
Intervention
group mean 0.16 0.75 0.34 0.14
Comparison
group mean 0.03 0.26 0.32 0.05
Difference: 0.13*** 0.49*** 0.02 0.10***
(0.03) (0.05) (0.05) (0.03)
Observations
(intervention
group)
205 205 205 205
Observations
(total) 636 636 636 636
Part B
5 6 7 8
Savings Remittances or
formal earnings
Ownership of
fungible
livestock
Back-up animal
feed
Intervention
group mean 0.73 0.20 0.58 0.15
Comparison
group mean 0.57 0.10 0.31 0.18
Difference: 0.16*** 0.09*** 0.27*** -0.03
(0.05) (0.04) (0.05) (0.04)
Observations
(intervention
group)
205 205 205 205
Observations
(total) 636 636 636 636
Standard errors in parentheses; * p < 0.1, ** p < 0.05, *** p < 0.01; PSM estimates are bootstrapped with 1,000
repetitions
Predictably, there are large and statistically significant effects on those indicators that were
most directly related to the project activities. Project households reported being more aware of
the information in community drought preparedness plans and more aware of the plans that
local leaders were making to better cope with changes in weather patterns. Also, as discussed
above, group participation was substantially higher in the intervention group. We also add an
indicator for savings into our analysis – respondents were asked how many days they believed
their household could support itself in the event of an emergency, using the money they had
saved. Households reporting that they had any money saved at all scored positively on this
indicator. Given the savings and credit activities of the women’s groups, it is no surprise that
nearly three quarters of the households in the intervention group had some money savings
(compared with 57 percent of the comparison group).
There were also positive results in terms of households’ access to remittances or formal
earnings, even though this indicator was far less directly related to the project logic.27
Households scored positively on this measure if they had received income from either
remittances or from regular paid employment (such as a teacher or nurse), or both. Given the

Resilience in Ethiopia and Somaliland: Impact evaluation of the reconstruction project ‘Development of Enabling
Conditions for Pastoralist and Agro-Pastoralist Communities’ Effectiveness Review Series 2015–16 52
results in Table 6.11 (above) where we saw that there were actually no differences between
project and non-project households in the matched sample in terms of participation in regular
paid employment, it is clear that the results in Table 6.17 are being driven by remittances. This
fits with our previous finding that migration had been more prevalent (and to more distant
locations) among the project households. Far from these migration practices representing a
negative coping strategy, it may be that they demonstrate a means to increase the spatial
spread of the household to diversify incomes and keep household consumption high even
during difficult times.
6.8.4 Dimension 4: Integrity of the natural and built environment
While characteristics of the natural environment are likely to be highly important for resilience in
the context of the Reconstruction Project, there were relatively few indicators that could be
extracted from household-level survey data. Nonetheless, we present the evidence from four
indicators that may capture the ‘integrity of the natural and built environment’ in Table 6.18.
Table 6.18: Indicators for the integrity of the natural and built environment
1 2 3 4
Availability of
water
Separation of
water sources
Availability of
grazing land
Charcoal
production
practices
Intervention
group mean 0.35 0.22 0.62 0.92
Comparison
group mean 0.26 0.12 0.47 0.95
Difference: 0.09* 0.10*** 0.15*** -0.03
(0.05) (0.03) (0.05) (0.03)
Observations
(intervention
group)
205 205 205 205
Observations
(total) 636 636 636 636
Standard errors in parentheses; * p < 0.1, ** p < 0.05, *** p < 0.01; PSM estimates are bootstrapped with 1,000
repetitions
There were statistically significant differences between the project and non-project households
in terms of the indicators related to water and grazing land. Although the majority of households
in the sample as a whole did not typically use separate sources of water for consumption by
people and by animals, the proportion was nearly double in the intervention group relative to the
comparison group. Also, the proportion of households reporting that they experienced only
small problems or no problems at all accessing suitable grasslands for grazing was 15
percentage points higher among project households than non-project households, a difference
of approximately a third (using the comparison group as the reference point).
It should be noted that, if anything, the results in Table 6.18 may underestimate the full impact
of the project on the availability of water and grazing land. This is because the effects of
activities such as the rehabilitation of water sources and rangelands may well ‘spill over’ onto
non-project communities, including those used for comparison purposes in this evaluation.
Thus, by looking at the difference between the intervention and comparison groups in terms of
the indicators in Columns 1–3 in Table 6.18, we are only estimating the additional community-
specific benefits of the project, over and above the benefits that have accrued to the district or
the region at large. It is particularly important to bear this in mind when interpreting the results
because, as discussed, many of the sites for water and rangeland rehabilitation work were
selected strategically to ensure these types of spillovers would occur. The fourth column in
Table 6.18 indicates that there were no significant differences between the project and non-

Resilience in Ethiopia and Somaliland: Impact evaluation of the reconstruction project ‘Development of Enabling
Conditions for Pastoralist and Agro-Pastoralist Communities’ Effectiveness Review Series 2015–16 53
project households in terms of the production of charcoal. For this measure, households scored
positively if they were not producing and selling charcoal to generate income. This fits with the
finding from Section 6.8.2 that awareness of climate change was unchanged by the project
activities, and suggests a future area of work for the project.
6.8.5 Dimension 5: Social and institutional capability
Given the project’s focus on increasing the voice and representation of vulnerable groups –
especially women and youth – in the community, we aimed to measure ‘social and institutional
capability’ from a number of different angles in this evaluation. Like the environmental
dimension in Section 6.8.4, we may be unable to capture fully the elements of social and
institutional capability that relate to systemic transformation (such as intra-household
bargaining, community-level leadership, district governance, and so on). Nonetheless, we were
able to establish eight indicators from our data, the results for which are reported in Table 6.19.
Table 6.19: Indicators of social and institutional capability
Part A
1 2 3 4
Early-warning
system
Effectiveness of
local leaders
Support for
adaptation
Women
participate in
community
discussions/
gatherings
Intervention
group mean 0.29 0.55 0.35 0.20
Comparison
group mean 0.12 0.43 0.04 0.18
Difference: 0.16*** 0.11** 0.32*** 0.03
(0.04) (0.05) (0.04) (0.04)
Observations
(intervention
group)
205 205 205 205
Observations
(total) 636 636 636 636
Part B
5 6 7 8
Women have
influence over
household
decisions
Youth
participation in
community
decisions
Confidence in
selling livestock
across the
border
Experience of
disputes over
resources
Intervention
group mean 0.44 0.51 0.37 0.92
Comparison
group mean 0.42 0.46 0.40 0.95
Difference: 0.03 0.05 -0.03 -0.03
(0.05) (0.05) (0.05) (0.03)
Observations
(intervention
group)
205 205 205 205
Observations
(total) 636 636 636 636
Standard errors in parentheses; * p < 0.1, ** p < 0.05, *** p < 0.01; PSM estimates are bootstrapped with 1,000
repetitions

Resilience in Ethiopia and Somaliland: Impact evaluation of the reconstruction project ‘Development of Enabling
Conditions for Pastoralist and Agro-Pastoralist Communities’ Effectiveness Review Series 2015–16 54
The largest statistically significant differences between the intervention and comparison groups
were seen for those indicators that were linked most directly to the project’s activities.
Households were scored positively for the early-warning system if they reported being ‘very
confident’ that they would receive early warning information about future droughts that was
reliable and would come in good time. Approximately 29 percent of the intervention group
scored positively on this measure, compared with just 12 percent of the comparison group. The
difference between project and non-project households in terms of support for adaptation –
measured by households’ access to an extension agent – was even more profound. Almost
none of the comparison group scored positively on this measure, compared with around 35
percent of the intervention group.
However, the results relating to the representation of women and youth appear to be far less
positive. For example, in Column 4 we report the proportion of households in which female
members had taken part in any type of formal community discussion or gathering, since the
start of 2012. There was no statistically significant difference between project and non-project
households in our matched sample for this indicator. Similarly equivocal results arise in
Columns 5 and 6, which are based on opinions questions around women’s influence over
household decisions and young people’s influence over community decisions. Therefore, the
positive results around women’s involvement in income-generation discussed in Sections 6.3
and 6.5 above do not necessarily seem to have translated to an attitudinal shift regarding
women’s role in the household. This may be because changing attitudes takes a long time,
whereas the Reconstruction Project had worked with communities for just three and a half years
at the time of the survey.
In the final two columns of Table 6.19 we report two more indicators, which may be able to
capture other system-level aspects of resilience. Firstly, we consider whether the project
households were better able to sell their livestock across the Ethiopia-Somaliland border than
the non-project households in the matched sample. In fact, we do not detect statistically
significant differences between the two groups. This is partly anticipated, because much of the
work the project had undertaken to make cross-border sales easier was targeted at the regional
or national level. As such, the methodology employed in this Effectiveness Review would be
unable to pick this up fully. We also consider whether the incidence of disputes over access to
land or water was reduced by the project. For the indicator in Column 8, households scored
positively if they did not experience any such disputes over the 12 months up to the survey.
Over 90 percent of the matched sample, across both the intervention and comparison groups,
reported not having experienced any disputes over access to land or water, but there were no
statistically significant differences between the project and non-project households. It seems,
therefore, that the conflict issue was relatively less severe than other drought-related stresses,
so the effects of the project in this regard were likely to be limited.
6.8.6 Comparing across dimensions
To provide an overall picture of the project’s impact across the five dimensions of resilience
considered for this Effectiveness Review, we present the evidence for each dimension-specific
index. These indices have been created by averaging across all the indicators for each
dimension. The results, using the matched sample, are shown in Figure 6.2.

Resilience in Ethiopia and Somaliland: Impact evaluation of the reconstruction project ‘Development of Enabling
Conditions for Pastoralist and Agro-Pastoralist Communities’ Effectiveness Review Series 2015–16 55
Figure 6.2: Dimension-specific resilience indices
This diagram echoes the broad findings we presented in Tables 6.14–6.19. There are positive
and significant differences between the project and non-project households, across all five
dimensions of resilience. The most profound impacts of the project have occurred for the
dimension of ‘access to contingency resources and support’, but there have also been sizeable
effects on ‘livelihood viability’ and ‘innovation potential’. However, this evaluation finds less
substantial evidence of differences between project and non-project households for
environmental, social, and institutional aspects of resilience.
0
0.1
0.2
0.3
0.4
0.5
0.6 Livelihood viability
Innovation potential
Access to contingency
resources and support
Integrity of natural and build
environment
Social and institutional capability
Intervention households
Comparison households

Resilience in Ethiopia and Somaliland: Impact evaluation of the reconstruction project ‘Development of Enabling
Conditions for Pastoralist and Agro-Pastoralist Communities’ Effectiveness Review Series 2015–16 56
7 CONCLUSIONS
7.1 CONCLUSIONS We use this section to summarise the main findings from Section 6.
Firstly, as would be expected, the households identified as project participants had clearly
participated more in the activities associated with the project than the comparison households in
our sample. These differences were most profound in terms of involvement in community
groups and participation in trainings. In part, this was because the rate of participation in these
activities was so low in the comparison group. Project households had greater exposure to
community-level construction and rehabilitation activities, such as building communal birkads or
rehabilitating grazing land. However, it was clear that some households in the comparison
group had also experienced these activities during the project duration. This may reflect the
activities of other NGOs or government agencies or, alternatively, spillover effects of the
Reconstruction Project.
The project households also experienced a number of positive effects in terms of livestock.
Project households owned more sheep/goats and cows at the time of the survey, although their
herds did not appear to be any more diversified than the comparison group. Vitally, women’s
control over these herds also seemed to be improved by the project, measured in terms of the
proportion of types of animals for which they were mainly responsible. The proportion of animals
that were vaccinated was also substantially higher among the project households. However, the
results around livestock sale practices were somewhat equivocal, and did not necessarily fit
with the project’s logic model.
Project households were moderately more likely to grow crops and had more diverse crop
portfolios, partly due to extra growth of elephant grass and qhoboc. However, the project did not
appear to affect women’s control over and responsibility for the crop portfolio, either at the
cultivation or the marketing stage. In part, this may be because the long-standing traditions that
influence which household members are responsible for the crop portfolio may take a long time
to change, while the Reconstruction Project had been working just three and a half years when
the fieldwork for this evaluation was carried out.
The project’s effects on non-farm livelihood strategies are among the strongest and most robust
positive results identified in this Effectiveness Review. Project households were substantially
more likely to engage in non-farm income-generating activities, despite the fact that we
controlled directly for baseline livelihood strategies in our analysis. This increases our
confidence that these results occurred during the project duration, and they are not driven
instead by unobservable differences between project and non-project households. It appears
that these effects were almost entirely driven by household businesses – such as petty
commerce or tea shops – many of which had business plans. Vitally, these positive differences
between project and non-project households are observed for female household members. This
matches the project logic.
The project also appears to have increased households’ wealth. In this Effectiveness Review,
wealth was understood as a final well-being outcome, which would improve despite shocks,
stresses, and uncertainty, if, and only if, households were resilient. This result is particularly
striking because changes to household wealth typically take a long time to effect, but the survey
work for this evaluation was carried before the Reconstruction Project had closed. The results
are also robust to using an alternative specification, in which we compare the difference
between current and recalled baseline wealth for the project and non-project households in our
sample. Again, this should give us extra confidence that the differences between the project and
comparison households in our sample can be attributed to the project, and not to other
unobservable characteristics. However, these positive wealth effects may at least partly be a
result of the previous Oxfam ECHO-funded project, which was carried out in many of the same
communities, as well as of the project under review.
Resilience in Ethiopia and Somaliland: Impact evaluation of the reconstruction project ‘Development of Enabling
Conditions for Pastoralist and Agro-Pastoralist Communities’ Effectiveness Review Series 2015–16 57
One area where the results of this Effectiveness Review were more ambiguous was around
responses to drought. On the one hand, project households took some actions that were clearly
positive coping strategies, such as feeding their animals on husks. However, they were also
more likely to feed their animals on weeds, some varieties of which are unsuitable for livestock
nutrition. It is possible, therefore, that this latter behaviour represents a more negative response
to drought.
The main outcome, on which this Effectiveness Review focused, was resilience. We created a
list of indicators on the basis of conversations with project staff and focus group discussions
with local communities, which could plausibly have influenced households’ ability to deal with
shocks, stresses, and uncertainty in the future. These were structured under the five
dimensions developed for Oxfam GB’s approach for measuring resilience. The indicators were
also aggregated to produce a set of overall resilience indexes. We experimented with different
strategies for weighting the indicators and dimensions to best reflect resilience in the local
context.
The project had substantial positive effects on the overall index of resilience, regardless of the
weighting method used. The base resilience index was approximately 27 percent higher among
the project households compared with the non-project households in our sample. Vitally, there
were positive and statistically significant effects for the project households across all five of the
dimensions of resilience used in this Effectiveness Review, suggesting that the project achieved
a balanced approach to building resilience.
The resilience indicators used in this Effectiveness Review comprise a combination of ‘output-
related’ indicators that were relatively low down the project logic (and therefore more closely
related to the project activities) and outcome indicators that were higher up the project logic, as
well as some indicators that were not connected to the project logic at all. It is these higher-level
indicators that demonstrate whether or not the project was able to succeed a long way along its
Logic Model, and are therefore of particular interest for this evaluation. Our data do not support
the notion that the project had a clear positive effect on the representation of women and youth,
despite the importance of these outcomes for the project logic. However, the results for a
number of the other, higher-level indicators of resilience were far more positive. For example, it
is clear that project households had larger herds, were more able to sell milk during the dry
season, and had a greater propensity to adopt innovations – although these indicators were part
of the project logic, they were relatively high up the causal chain and were not directly
connected to the project activities. Therefore, the positive results in this evaluation are not solely
driven by low-level ‘output-related’ indicators of resilience.
7.2 PROGRAMME LEARNING
CONSIDERATIONS
Focus more on building the voice of women and youth at the household level, as well as at community, regional, and national forums.
In spite of the project’s apparent success in building resilience across a number of dimensions,
the Effectiveness Review did not find strong evidence that women’s voice and representation
was positively affected. In part, this demonstrates the limitations of the evaluation approach,
which was unable to estimate the effects of the project at the regional and national level.
However, project households were no more likely than non-project households to report that
women as well as men made important decisions for the household – such as around livelihood
pursuits – nor did they demonstrate greater confidence that women in the community influenced
disaster management plans. This lack of attitudinal change comes despite clear positive effects
on women’s involvement in off-farm livelihood activities and on their responsibility for livestock.
This may be because attitudinal change is a slow and gradual process, whereas the
Reconstruction Project was designed to last only four years. Nonetheless, it seems that future
projects could investigate whether particular barriers to women’s empowerment could be

Resilience in Ethiopia and Somaliland: Impact evaluation of the reconstruction project ‘Development of Enabling
Conditions for Pastoralist and Agro-Pastoralist Communities’ Effectiveness Review Series 2015–16 58
reduced in the project context and consider diverting more resources towards making the jump
from increasing women’s role in income generation to boosting women’s empowerment defined
more broadly.
Conduct further research to consider why the profound and robust changes to wealth were achieved.
The Effectiveness Review presents clear and robust evidence that the project increased
household wealth. This may partially reflect the fact that the Logic Model held true, that
resilience was built, and that project households were faring better during the 2015/16 drought
(during which the survey work was carried out). However, given the magnitude of the wealth
effects – approximately 0.6 of a standard deviation – it seems that more work is required to fully
understand what made project households richer.
Assess the opportunities for scaling up the project’s work on non-farm livelihood activities.
Another major success of the project, for which the results were especially clear and robust,
was around engaging in off-farm livelihood activities. Project households were nearly three
times more likely to have off-farm businesses than the non-project households in the sample.
This presents a key supplementary question around whether scaling up the activities of the
Reconstruction Project could achieve similarly positive results in other communities. It may be
that the existing predominant livelihood activities in other villages do not permit households to
engage in non-farm work in the same way. Moreover, if other households in other villages set
up off-farm businesses, this will increase the supply of the goods and services these businesses
provide, driving down their prices and hence the returns to doing this kind of work. Assessing
the importance of these types of issues will be vital for ascertaining whether the project activities
could generate similar uptake of non-farm livelihoods if scaled up.
Consider different approaches to monitoring to ensure beneficiary lists are well-maintained and up-to-date.
Although the project households clearly participated more in women’s credit and savings
groups, the overall proportion of the intervention households participating in these groups was
still just 54 percent. This is in spite of the fact that the sample of intervention group households
was created directly from the most up-to-date lists of women in the credit and savings groups
that were available from the project partner organisations. It would be useful to know why these
households did not identify themselves as participating in the women’s savings and credit
groups, despite being on the beneficiary lists. If this is because the lists are out-of-date, then
improved monitoring of who is participating in the community groups that were set-up and
supported by the project would be useful, as well as recording why households stop
participating.
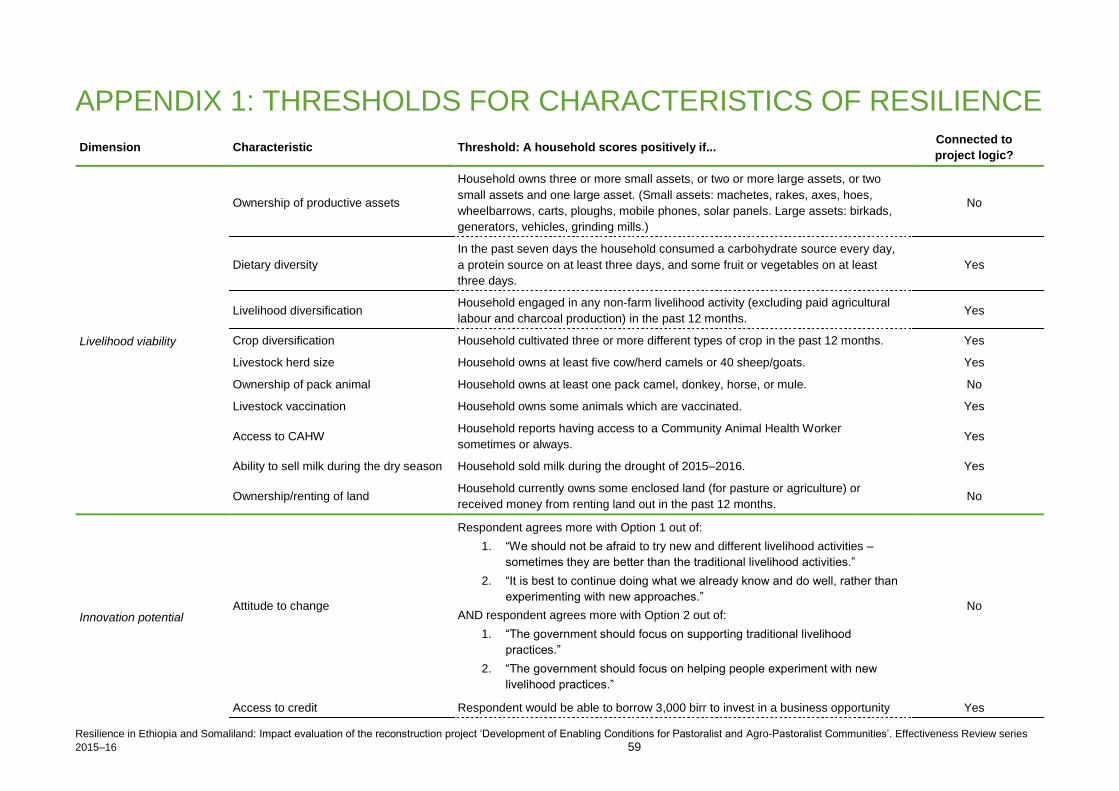
Resilience in Ethiopia and Somaliland: Impact evaluation of the reconstruction project ‘Development of Enabling Conditions for Pastoralist and Agro-Pastoralist Communities’. Effectiveness Review series
2015–16 59
APPENDIX 1: THRESHOLDS FOR CHARACTERISTICS OF RESILIENCE
Dimension Characteristic Threshold: A household scores positively if... Connected to
project logic?
Livelihood viability
Ownership of productive assets
Household owns three or more small assets, or two or more large assets, or two
small assets and one large asset. (Small assets: machetes, rakes, axes, hoes,
wheelbarrows, carts, ploughs, mobile phones, solar panels. Large assets: birkads,
generators, vehicles, grinding mills.)
No
Dietary diversity
In the past seven days the household consumed a carbohydrate source every day,
a protein source on at least three days, and some fruit or vegetables on at least
three days.
Yes
Livelihood diversification Household engaged in any non-farm livelihood activity (excluding paid agricultural
labour and charcoal production) in the past 12 months. Yes
Crop diversification Household cultivated three or more different types of crop in the past 12 months. Yes
Livestock herd size Household owns at least five cow/herd camels or 40 sheep/goats. Yes
Ownership of pack animal Household owns at least one pack camel, donkey, horse, or mule. No
Livestock vaccination Household owns some animals which are vaccinated. Yes
Access to CAHW Household reports having access to a Community Animal Health Worker
sometimes or always. Yes
Ability to sell milk during the dry season Household sold milk during the drought of 2015–2016. Yes
Ownership/renting of land Household currently owns some enclosed land (for pasture or agriculture) or
received money from renting land out in the past 12 months. No
Innovation potential Attitude to change
Respondent agrees more with Option 1 out of:
1. “We should not be afraid to try new and different livelihood activities –
sometimes they are better than the traditional livelihood activities.”
2. “It is best to continue doing what we already know and do well, rather than
experimenting with new approaches.”
AND respondent agrees more with Option 2 out of:
1. “The government should focus on supporting traditional livelihood
practices.”
2. “The government should focus on helping people experiment with new
livelihood practices.”
No
Access to credit Respondent would be able to borrow 3,000 birr to invest in a business opportunity Yes

Resilience in Ethiopia and Somaliland: Impact evaluation of the reconstruction project ‘Development of Enabling Conditions for Pastoralist and Agro-Pastoralist Communities’. Effectiveness Review series
2015–16 60
Dimension Characteristic Threshold: A household scores positively if... Connected to
project logic?
from any of the possible sources provided in the questionnaire. (Potential sources:
relatives or neighbours in the community, a moneylender, family members outside
the community, a savings group or revolving fund in the community, a bank or
formal financial institution.)
Awareness of climate change
Respondent agrees more with Option 2 out of:
1. “10 to 20 years into the future, the weather patterns in this area will be
similar to those of the past.”
2. “The frequency and severity of droughts in this area continue to increase.”
No
Adoption of innovative practices Respondent had adopted any innovative practice that was not directly related to the
project. No
Access to markets
Respondent did not have severe problems gaining access to reliable information on
market prices for livestock in the past 12 months, nor did they experience any
severe problems bringing livestock to market.
No
Growing new crop varieties Household reported growing onions, tomatoes, watermelons, or any other non-
cereal crops during the past year. Yes
Access to contingency
resources and support
Awareness of drought preparedness
plan
Respondent reports that the community has a drought contingency plan, and that
they are at least partly aware of its contents. Yes
Group participation Household participates in two or more community groups. Yes
Social connectivity
Respondent agrees more with Option 1 out of:
1. “We receive news from other villages when there is news such as a birth
or a death.”
2. “We are only interested in news from our own community.”
AND respondent agrees more with Option 1 out of:
1. We regularly help our neighbours with food, money, or other commodities
when they have gone through hard times.”
2. “It is each household’s own responsibility to ensure all their needs are
met.”
No
Awareness of local leaders’ plans
Respondent reports that leaders in the community are marking plans and taking
action to the community to cope with changes in weather patterns, and that they
are at least partly aware of what they are doing.
No
Savings Respondent reports that household has any money savings. Yes

Resilience in Ethiopia and Somaliland: Impact evaluation of the reconstruction project ‘Development of Enabling Conditions for Pastoralist and Agro-Pastoralist Communities’. Effectiveness Review series
2015–16 61
Dimension Characteristic Threshold: A household scores positively if... Connected to
project logic?
Remittances or formal earnings Household gained any income from remittances or regular, paid employment in the
last 12 months. No
Ownership of fungible livestock Household owns at least 20 sheep or goats or poultry. Yes
Back-up animal feed Household had stored animal feed as silage and not fed their animals weeds or
husks in the last 12 months. Yes
Integrity of the natural
and built environment
Availability of water
Household had used any of the following water sources during the most recent
drought: pits lined by plastic sheets, private or communal birkads, ponds/water
points, modern boreholes.
Yes
Separation of water sources Household always used separate sources of water for themselves and their
livestock. No
Availability of grazing land Household experienced small problems or no problems at all in accessing suitable
grasslands for grazing in the last 12 months. Yes
Charcoal production practices Household is not currently engaged in the production and sale of charcoal. Yes
Social and institutional
capability
Early-warning system
Respondent was ‘very confident’ that they would receive early-warning information
about the coming of a drought in the future that would both be reliable and come in
good time.
Yes
Effectiveness of local leaders
Respondents agrees more with Option 2 out of:
1. “Leaders in our community are not responsible for creating action plans in
case our community experiences a crisis.”
2. “These days, leaders in our community do a good job in ensuring the
basic needs of members of our community are met during times of crises.”
Yes
Support for adaptation
The household received help from a government extension agent or government
programme to help try out new farming techniques and/or livestock management
practices, and the support provided as at least ‘moderately helpful’.
No
Women participate in community
discussions/gatherings
A woman, or women, from the household had participated in any formal community
discussions or gatherings since the start of 2012. Yes
Women have influence over household
decisions
Respondent agrees more with Option 1 out of:
1. “Women in this household should make important decisions about the
household’s livelihood pursuits.”
2. “It is best to have the men make the important decisions about livelihoods
for our household.”
Yes
Youth participation in community Respondent agrees more with Option 1 out of: Yes
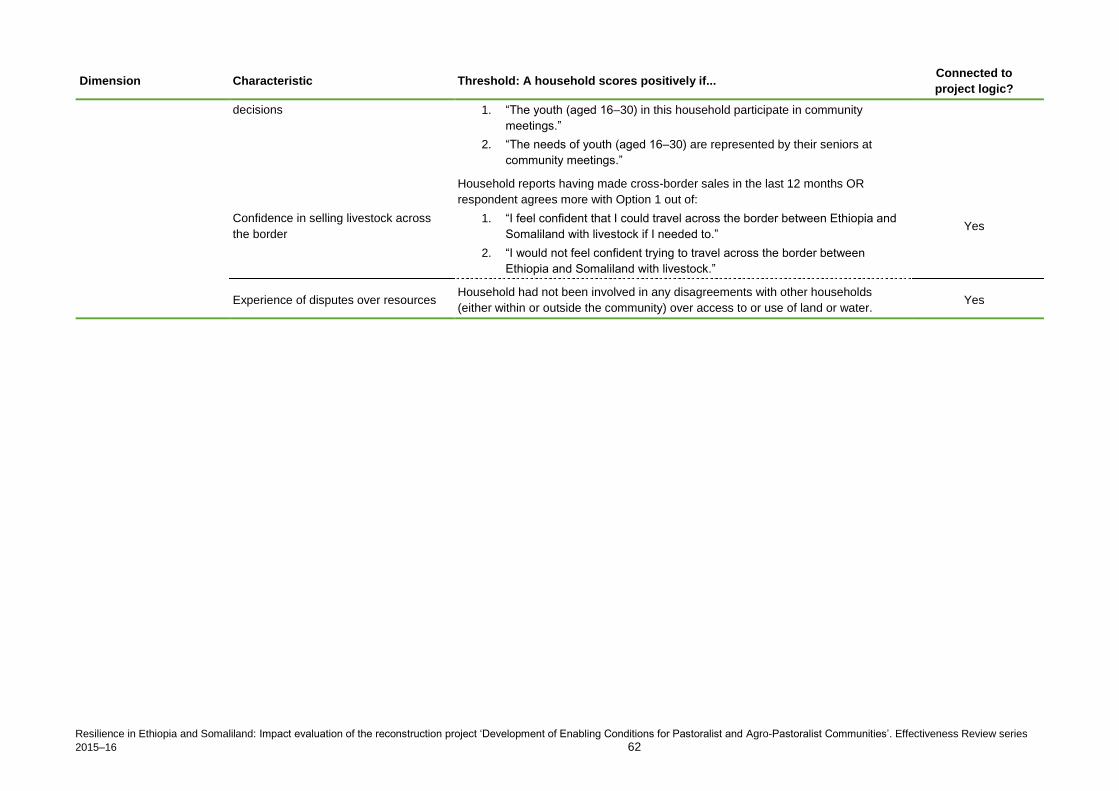
Resilience in Ethiopia and Somaliland: Impact evaluation of the reconstruction project ‘Development of Enabling Conditions for Pastoralist and Agro-Pastoralist Communities’. Effectiveness Review series
2015–16 62
Dimension Characteristic Threshold: A household scores positively if... Connected to
project logic?
decisions 1. “The youth (aged 16–30) in this household participate in community
meetings.”
2. “The needs of youth (aged 16–30) are represented by their seniors at
community meetings.”
Confidence in selling livestock across
the border
Household reports having made cross-border sales in the last 12 months OR
respondent agrees more with Option 1 out of:
1. “I feel confident that I could travel across the border between Ethiopia and
Somaliland with livestock if I needed to.”
2. “I would not feel confident trying to travel across the border between
Ethiopia and Somaliland with livestock.”
Yes
Experience of disputes over resources Household had not been involved in any disagreements with other households
(either within or outside the community) over access to or use of land or water. Yes

Resilience in Ethiopia and Somaliland: Impact evaluation of the reconstruction project ‘Development of Enabling
Conditions for Pastoralist and Agro-Pastoralist Communities’. Effectiveness Review series 2015–16 63
APPENDIX 2: BASELINE STATISTICS
BEFORE MATCHING
Table A2.1: Descriptive statistics before matching
Intervention
mean
Comparison
mean Difference
Standard
error
Proportion of households
in Ethiopia (%) 49.58 50.34 -0.77 4.04
Proportion of households
in Somaliland (%) 50.42 49.66 0.77 4.04
Household size 5.86 5.11 0.75***
0.18
Proportion of household
members who are children
(less than 15 years) (%)
39.26 34.10 5.16* 2.03
Proportion of household
members who are school
age (7 to 18 years) (%)
32.13 32.13 -0.00 1.92
Proportion of household
members who are elderly
(more than 65 years) (%)
1.94 3.16 -1.23 0.90
Proportion of household
members who are male
(%)
48.24 47.07 1.17 1.69
Household head is male
(%) 30.93 32.80 -1.87 3.77
Age of household head
(years) 40.43 40.44 -0.01 1.05
Household head can write
their own name (%) 60.59 50.57 10.02
* 4.01
Household head
completed primary
education (%)
9.75 7.29 2.46 2.21
Number of minutes it took
to walk to the nearest
water source during the dry
sea
215.36 201.27 14.10 19.47
Number of minutes it took
to walk to the centre of the
community, at the start of
2012
12.02 12.63 -0.61 1.18
Proportion of households
engaging in:
Farming crops (%) 78.39 52.39 26.00***
3.80
Paid agricultural labour (%) 28.81 12.30 16.51***
3.04
Casual labour (e.g.
construction, carpentry,
masonry) (%)
13.14 5.92 7.21** 2.23
Services (e.g. mechanic,
Community Animal Health 13.14 2.73 10.40
*** 1.93

Resilience in Ethiopia and Somaliland: Impact evaluation of the reconstruction project ‘Development of Enabling
Conditions for Pastoralist and Agro-Pastoralist Communities’. Effectiveness Review series 2015–16 64
Worker) (%)
Household business (e.g.
petty commerce, tea shop)
(%)
24.15 6.38 17.77***
2.59
Producing or selling
charcoal (%) 16.53 3.87 12.65
*** 2.18
Regular, paid employment
(e.g. as a teacher or nurse)
(%)
16.10 1.14 14.96***
1.89
Remittances (%) 16.53 3.19 13.34***
2.11
Renting out land (%) 16.95 0.91 16.04***
1.90
Guus/free service work 46.61 18.45 28.16***
3.48
Household was in the
lowest 20% of the wealth
distribution, at the start of
2012
6.78 27.11 -20.33***
3.14
Household was in the
second 20% of the wealth
distribution, at the start of
2012
13.14 23.69 -10.55** 3.21
Household was in the third
20% of the wealth
distribution, at the start of
2012
19.49 20.27 -0.78 3.23
Household was in the
fourth 20% of the wealth
distribution, at the start of
2012
24.58 17.54 7.04* 3.22
Household was in the
highest 20% of the wealth
distribution, at the start of
201
36.02 11.39 24.63***
3.09
Observations 236 439 675
The construction of the wealth index is described in Section 6
Variables dated 2012 are estimates, based on recall data
* p < 0.1, ** p < 0.05, *** p < 0.01

Resilience in Ethiopia and Somaliland: Impact evaluation of the reconstruction project ‘Development of Enabling
Conditions for Pastoralist and Agro-Pastoralist Communities’. Effectiveness Review series 2015–16 65
APPENDIX 3: METHODOLOGY USED
FOR PROPENSITY SCORE MATCHING The results presented in Section 6 of this report were estimated using propensity-score
matching (PSM). PSM is a statistical technique that allows us to estimate the effect of an
intervention by accounting for the covariates that predict receiving the intervention, or
‘treatment’. The idea behind PSM is to match similar individuals in the treatment or intervention
group to those in the control or comparison group, based on observed characteristics at
baseline. After each participant is matched with a non-participant, the average treatment effect
on the treated (those who benefited from the intervention) is equal to the difference in average
outcomes of the intervention and the comparison groups after project completion. This appendix
describes and tests the specific matching procedure employed in this Effectiveness Review. A
practical guide on the different approaches to matching may be found in Caliendo and Kopeinig
(2008).
Estimating propensity scores
Finding an exact match for treated individuals, based on various baseline characteristics, would
be very hard to implement in practice. Rosenbaum and Rubin (1983) demonstrated that a
‘propensity score’ could summarise all this information in one single variable. The propensity
score is defined as the conditional probability of receiving the intervention given background
variables. Specifically, propensity scores are calculated using a statistical probability model (e.g.
probit or logit) to estimate the probability of participating in the project, conditional on a set of
characteristics.
Table A3.1 and shows the variables used to estimate the propensity score. Here, we report the
marginal effects at the mean, and the corresponding standard errors. Following Caliendo and
Kopeinig (2008), only variables that influence the participation decision, but which are not
affected by participation in the project, were included in our matching model. In the table, the
dependent variable corresponds to whether or not an individual received the intervention – it is
equal to one if the household belongs to one of the communities that benefited from the project
activities, and zero otherwise. The coefficients in the table correspond to the marginal effects,
i.e. the change in the probability of receiving the intervention if the independent variable is
increased by one.
Defining the region of common support
After estimating the propensity scores, we need to verify that there is a potential match for the
observations in the intervention group with those from the comparison group. This means
checking that there is common support. The area of common support is the region where the
propensity score distributions of the intervention and comparison groups overlap. The common
support assumption ensures that each ‘treatment [intervention] observation has a comparison
observation “nearby” in the propensity score distribution’ (Heckman, LaLonde and Smith, 1999).
Figure A3.1 shows the propensity score density plots for both groups. We observe that,
although the distributions of propensity scores are clearly different between the intervention and
comparison groups in each case, there is a reasonably good area of overlap between the
groups. However, in constructing the model for household-level outcomes, 31 observations from
the intervention group and 8 observations from the comparison group were dropped because
there was not a suitable match for them.

Resilience in Ethiopia and Somaliland: Impact evaluation of the reconstruction project ‘Development of Enabling
Conditions for Pastoralist and Agro-Pastoralist Communities’. Effectiveness Review series 2015–16 66
Table A3.1: Estimating the propensity score
Marginal effect Standard error p-value
Household head is male?
(1=Y, 0=N) -0.0224 0.0450 0.6181
HH head is above median
age? (1=Y, 0=N) -0.0462 0.0410 0.2598
Household size 0.0187* 0.0094 0.0473
HH undertook farming of
crops at the start 2012? (1=Y,
0=N)
0.1168** 0.0435 0.0073
HH engaged in non-farm
income-generating activities
at the start of 2012? (1=Y,
0=N)
-0.0421 0.0661 0.5243
HH had a household
business at the start of 2012?
(1=Y, 0=N)
0.2979** 0.0910 0.0011
Any HH member engaged in
regular, paid work at the start
of 2012? (1=Y, 0=N)
0.5398***
0.0781 0.0000
HH was in the second 20% of
the wealth distribution, at the
start of 2012
0.1469 0.0765 0.0547
HH was in the third 20% of
the wealth distribution, at the
start of 2012
0.2662***
0.0737 0.0003
HH was in the fourth 20% of
the wealth distribution, at the
start of 2012
0.3089***
0.0733 0.0000
HH was in the highest 20% of
the wealth distribution, at the
start of 2012
0.5057***
0.0642 0.0000
Observations 675
The construction of the wealth index is described in Section 6. Variables dated 2012 are estimates, based on recall data
Dependent variable is binary, taking 1 for project participant households, and 0 otherwise
* p < 0.1, ** p < 0.05, *** p < 0.01

Resilience in Ethiopia and Somaliland: Impact evaluation of the reconstruction project ‘Development of Enabling
Conditions for Pastoralist and Agro-Pastoralist Communities’. Effectiveness Review series 2015–16 67
Figure A3.1: Histogram of propensity scores in intervention and comparison groups
Matching intervention households to comparison households
Following Rosenbaum and Rubin (1983), households were matched on the basis of their
propensity scores. The literature has developed a variety of matching procedures. After a series
of checks, we decided to employ the kernel matching algorithm for the results presented in this
Effectiveness Review. Kernel matching assigns more weight to the closest comparison group
observations that are found within a selected ‘bandwidth’. Thus ‘good’ matches are given
greater weight than ‘poor’ matches. We used the psmatch2 module in Stata with a bandwidth of
0.06 and restricted the analysis to the area of common support. When using PSM, standard
errors of the estimates were bootstrapped using 1,000 repetitions, to account for the additional
variation caused by the estimation of the propensity scores.28
Checking balance
For PSM to be valid, the intervention group and the matched comparison group need to be
balanced. In other words, the intervention and comparison groups need to be similar in terms of
their observed characteristics. The most straightforward method of doing this is to test whether
there are any statistically significant differences in baseline covariates between both groups in
the matched sample. The balance of each of the matching variables after kernel matching is
shown in Tables A3.2. There are no statistically significant differences between the intervention
and comparison groups for any of the matching variables used, in the matched sample. For all
of these variables, the p-values for the difference in means tests are larger than 0.2. We can
therefore conclude in each case that we have found a satisfactory match for the observable
variable our sample.

Resilience in Ethiopia and Somaliland: Impact evaluation of the reconstruction project ‘Development of Enabling
Conditions for Pastoralist and Agro-Pastoralist Communities’. Effectiveness Review series 2015–16 68
Table A3.2: Balancing test on matching variables for household-level outcomes
Intervention
group mean
Comparison group
mean p-value
Household head is male? (1=Y,
0=N) 0.31 0.37 0.23
HH head is above median age?
(1=Y, 0=N) 0.39 0.37 0.77
Household size 5.95 5.94 0.98
HH undertook farming of crops at
the start 2012? (1=Y, 0=N) 0.77 0.74 0.6
HH engaged in non-farm income-
generating activities at the start of
2012? (1=Y, 0=N)
0.25 0.24 0.76
HH had a household business at
the start of 2012? (1=Y, 0=N) 0.14 0.11 0.28
Any HH member engaged in
regular, paid work at the start of
2012? (1=Y, 0=N)
0.04 0.06 0.64
HH was in the second 20% of the
wealth distribution, at the start of
2012
0.13 0.13 0.79
HH was in the third 20% of the
wealth distribution, at the start of
2012
0.2 0.2 0.87
HH was in the fourth 20% of the
wealth distribution, at the start of
2012
0.24 0.26 0.76
HH was in the highest 20% of the
wealth distribution, at the start of
2012
0.35 0.34 0.93
The construction of the wealth index is described in Section 6
Variables dated 2012 are estimates, based on recall data
* p < 0.1, ** p < 0.05, *** p < 0.01

Resilience in Ethiopia and Somaliland: Impact evaluation of the reconstruction project ‘Development of Enabling
Conditions for Pastoralist and Agro-Pastoralist Communities’. Effectiveness Review series 2015–16 69
APPENDIX 4: ROBUSTNESS CHECKS In order to assess the robustness of the results presented in Section 6, a series of checks were
carried out to determine whether the main findings of this report are sensitive to the estimation
procedure – propensity score matching with the kernel method – that was used to control for
observable differences between the intervention and comparison groups. This appendix
presents five key types of robustness checks.
1 Multivariate regression
The first robustness test estimated the impact of project participation using an ordinary least
squares (OLS) regression. The main idea behind OLS is to isolate the variation in the outcome
variable that is due to the intervention status – the project’s impact – by controlling directly for
the influence that observable differences between the intervention and comparison groups have
on outcomes. To do this, we estimate Equation 1.29
Equation 1
In Equation 1, is the dependent variable (the outcome) and is a column vector of the same
matching variables listed in Tables A3.1 or A3.2. The intervention status is given by a dummy
variable ( ), which takes the value 1 if the household participated in the project and 0
otherwise. The key difference between this OLS regression model and the propensity score
matching procedure used in the main report is that the OLS regression estimates a direct
parametric relationship between the covariates in and the dependent variable . This means
it is possible to include the observations that were excluded due to being off common support in
Section 6 by extrapolating the relationship between and . It should be borne in mind,
however, that extrapolating in this way may bias the results if the covariates are distributed very
differently between the intervention and comparison groups (Rubin, 2001).30
It is also important to note that, as with the PSM methods used in the main body of the report,
OLS regressions can only account for observable differences between the intervention and
comparison groups. Unobservable differences may still bias the results. In the tables that follow,
only the estimate of will be reported.
2 Multivariate regression including recalled baseline group participation
In the main results, we did not control for baseline differences in group participation between the
intervention and comparison groups. This is because it emerged after the fieldwork that some of
the women’s savings and credit groups had been formed before the true start of the
Reconstruction Project, due to scoping activities and the work of the previous ECHO-funded
project. Therefore, controlling for recalled participation in community groups at the start of 2012
would risk biasing the estimated effects of the project downwards.
Despite these doubts, we tested whether controlling for recalled baseline group participation
affects our results by estimating Equation 2 using OLS.
Equation 2
The variables are defined in exactly the same way as in Equation 1, but is a column vector of
variables measuring participation in community groups:
1. Number of groups the household participated in at baseline
2. Whether or not any household members participated in women’s groups with
credit/saving

Resilience in Ethiopia and Somaliland: Impact evaluation of the reconstruction project ‘Development of Enabling
Conditions for Pastoralist and Agro-Pastoralist Communities’. Effectiveness Review series 2015–16 70
3. Whether or not any household members participated in women’s groups without
credit/saving
Once again, we only report the estimates of .
3 Propensity score weighting
Following the example of Hirano and Imbens (2001) we also estimate OLS regressions, using
exactly the same model as in Equation 1, but weighting the observations according to the
propensity score. Observations are assigned weights equal to 1 for the intervention households
and for the comparison households. The variable represents the
probability of a household being in the intervention group, given their observable characteristics,
measured through the vector of matching variables – this was estimated in the probit
regressions in Appendix 3. We report the estimates of in the same way as the regular OLS
regressions.
4 Nearest neighbour matching
The nearest neighbour (NN) matching algorithm matches each observation from the
intervention group with an observation from the comparison group that is closest in terms of
their propensity score.31
In this robustness check, we apply the NN method ‘with replacement’,
meaning that comparison observations can be matched to intervention observations more than
once.32
In the tables below, we report the estimated differences between the intervention and
comparison groups.
5 Nearest neighbour with exact country matching
When the NN matching algorithm is used it is possible to apply certain restrictions to what
matches are permitted. One possibility with the data in this Effectiveness Review is to constrain
the matching process so that Ethiopian households in the intervention group can only be
matched with Ethiopian households in the comparison group (and the same for Somaliland).
This eliminates the possibility that an Ethiopian household is matched to a Somalilander
household, and vice versa. Again, the estimated differences between the intervention and
comparison groups are reported in the tables below.
In the remainder of this appendix, we report these robustness checks for the main results of the
report.

Resilience in Ethiopia and Somaliland: Impact evaluation of the reconstruction project ‘Development of Enabling
Conditions for Pastoralist and Agro-Pastoralist Communities’. Effectiveness Review series 2015–16 71
Table A4.1: Overall resilience indexes
1 2 3 4
Base
resilience
index
Equal
dimensions
resilience
index
Personal
dimensions
resilience
index
Sample
dimensions
resilience
index
OLS regression 0.11*** 0.10*** 0.10*** 0.10***
(0.01) (0.01) (0.01) (0.01)
N 675 675 675 675
OLS regression
with recalled
group
participation
0.08*** 0.08*** 0.07*** 0.08***
(0.01) (0.01) (0.01) (0.01)
N 675 675 675 675
OLS with PS
weighting 0.10*** 0.10*** 0.10*** 0.10***
(0.01) (0.01) (0.01) (0.01)
N 636 636 636 636
Nearest
neighbour 0.11*** 0.10*** 0.10*** 0.10***
(0.01) (0.01) (0.01) (0.01)
N 636 636 636 636
Nearest
neighbour with
exact country
matching
0.10*** 0.10*** 0.10*** 0.10***
(0.01) (0.01) (0.01) (0.01)
N 636 636 636 636
Robust standard errors in parentheses; * p < 0.1, ** p < 0.05, *** p < 0.01.
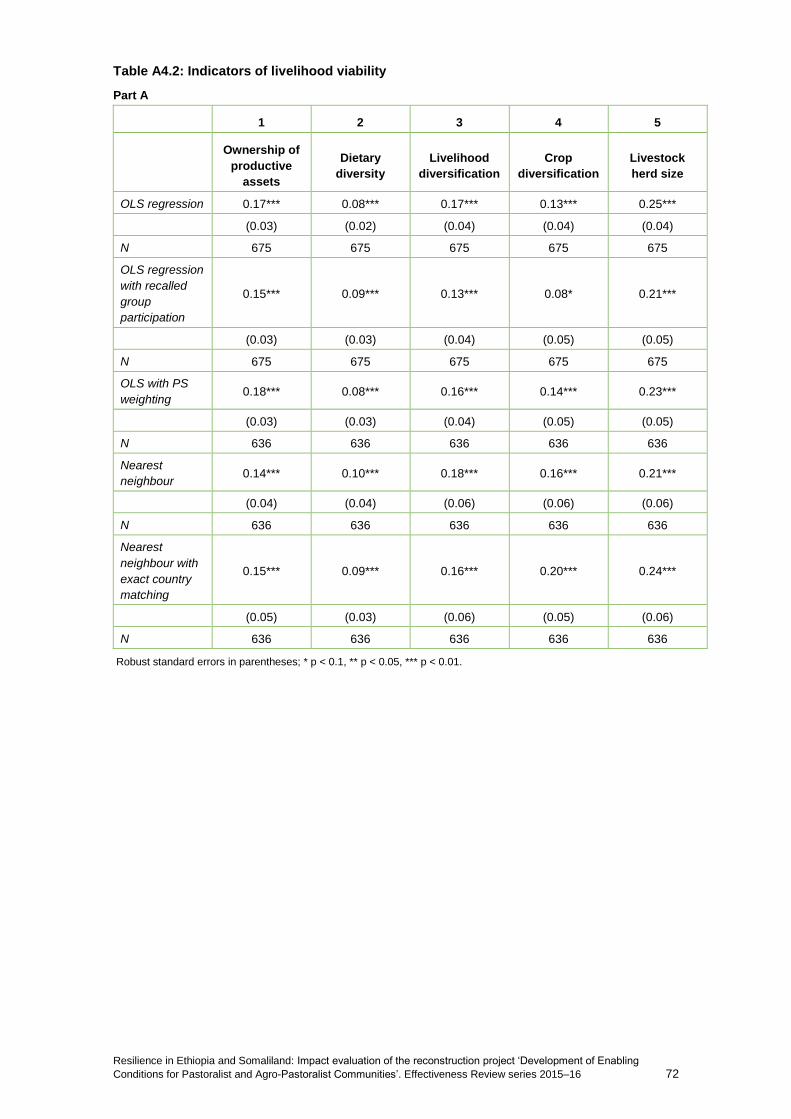
Resilience in Ethiopia and Somaliland: Impact evaluation of the reconstruction project ‘Development of Enabling
Conditions for Pastoralist and Agro-Pastoralist Communities’. Effectiveness Review series 2015–16 72
Table A4.2: Indicators of livelihood viability
Part A
1 2 3 4 5
Ownership of
productive
assets
Dietary
diversity
Livelihood
diversification
Crop
diversification
Livestock
herd size
OLS regression 0.17*** 0.08*** 0.17*** 0.13*** 0.25***
(0.03) (0.02) (0.04) (0.04) (0.04)
N 675 675 675 675 675
OLS regression
with recalled
group
participation
0.15*** 0.09*** 0.13*** 0.08* 0.21***
(0.03) (0.03) (0.04) (0.05) (0.05)
N 675 675 675 675 675
OLS with PS
weighting 0.18*** 0.08*** 0.16*** 0.14*** 0.23***
(0.03) (0.03) (0.04) (0.05) (0.05)
N 636 636 636 636 636
Nearest
neighbour 0.14*** 0.10*** 0.18*** 0.16*** 0.21***
(0.04) (0.04) (0.06) (0.06) (0.06)
N 636 636 636 636 636
Nearest
neighbour with
exact country
matching
0.15*** 0.09*** 0.16*** 0.20*** 0.24***
(0.05) (0.03) (0.06) (0.05) (0.06)
N 636 636 636 636 636
Robust standard errors in parentheses; * p < 0.1, ** p < 0.05, *** p < 0.01.

Resilience in Ethiopia and Somaliland: Impact evaluation of the reconstruction project ‘Development of Enabling
Conditions for Pastoralist and Agro-Pastoralist Communities’. Effectiveness Review series 2015–16 73
Part B
6 7 8 9 10
Ownership of
pack animal(s)
Livestock
vaccination
Access to
CAHW
Ability to sell
milk during
the dry
season
Ownership/
renting of land
OLS regression 0.08 0.15*** -0.05 0.10*** -0.04
(0.04) (0.04) (0.04) (0.03) (0.04)
N 675 675 675 675 675
OLS regression
with recalled
group
participation
0.05 0.15*** -0.06 0.03 -0.06
(0.05) (0.04) (0.04) (0.04) (0.05)
N 675 675 675 675 675
OLS with PS
weighting 0.05 0.15*** -0.02 0.10*** -0.04
(0.04) (0.04) (0.04) (0.04) (0.05)
N 636 636 636 636 636
Nearest
neighbour 0.04 0.12** 0.02 0.07* 0.00
(0.05) (0.05) (0.05) (0.04) (0.06)
N 636 636 636 636 636
Nearest
neighbour with
exact country
matching
0.08 0.08* 0.03 0.10** -0.05
(0.05) (0.05) (0.05) (0.04) (0.06)
N 636 636 636 636 636
Robust standard errors in parentheses; * p < 0.1, ** p < 0.05, *** p < 0.01.
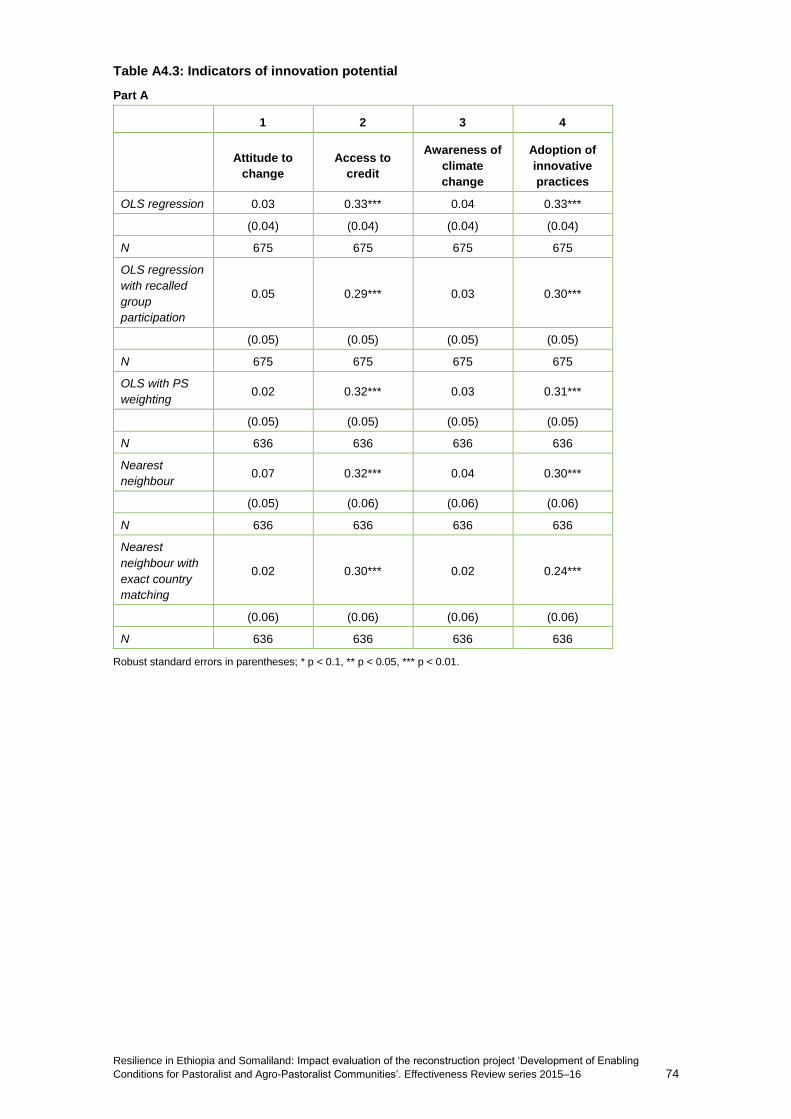
Resilience in Ethiopia and Somaliland: Impact evaluation of the reconstruction project ‘Development of Enabling
Conditions for Pastoralist and Agro-Pastoralist Communities’. Effectiveness Review series 2015–16 74
Table A4.3: Indicators of innovation potential
Part A
1 2 3 4
Attitude to
change
Access to
credit
Awareness of
climate
change
Adoption of
innovative
practices
OLS regression 0.03 0.33*** 0.04 0.33***
(0.04) (0.04) (0.04) (0.04)
N 675 675 675 675
OLS regression
with recalled
group
participation
0.05 0.29*** 0.03 0.30***
(0.05) (0.05) (0.05) (0.05)
N 675 675 675 675
OLS with PS
weighting 0.02 0.32*** 0.03 0.31***
(0.05) (0.05) (0.05) (0.05)
N 636 636 636 636
Nearest
neighbour 0.07 0.32*** 0.04 0.30***
(0.05) (0.06) (0.06) (0.06)
N 636 636 636 636
Nearest
neighbour with
exact country
matching
0.02 0.30*** 0.02 0.24***
(0.06) (0.06) (0.06) (0.06)
N 636 636 636 636
Robust standard errors in parentheses; * p < 0.1, ** p < 0.05, *** p < 0.01.

Resilience in Ethiopia and Somaliland: Impact evaluation of the reconstruction project ‘Development of Enabling
Conditions for Pastoralist and Agro-Pastoralist Communities’. Effectiveness Review series 2015–16 75
Part B
5 6 7
Access to
markets
Growing new
crop varieties
Sharing ideas
with other
villages
OLS regression 0.08** -0.09* 0.08**
(0.03) (0.04) (0.02)
N 675 675 675
OLS regression
with recalled group
participation
0.11*** -0.06 -0.02
(0.03) (0.05) (0.02)
N 675 675 675
OLS with PS
weighting 0.07** -0.07 0.10***
(0.03) (0.04) (0.02)
N 636 636 636
Nearest neighbour 0.06 -0.06 0.09***
(0.04) (0.06) (0.02)
N 636 636 636
Nearest neighbour
with exact country
matching
0.05 -0.10* 0.10***
(0.05) (0.06) (0.02)
N 636 636 636
Robust standard errors in parentheses; * p < 0.1, ** p < 0.05, *** p < 0.01.
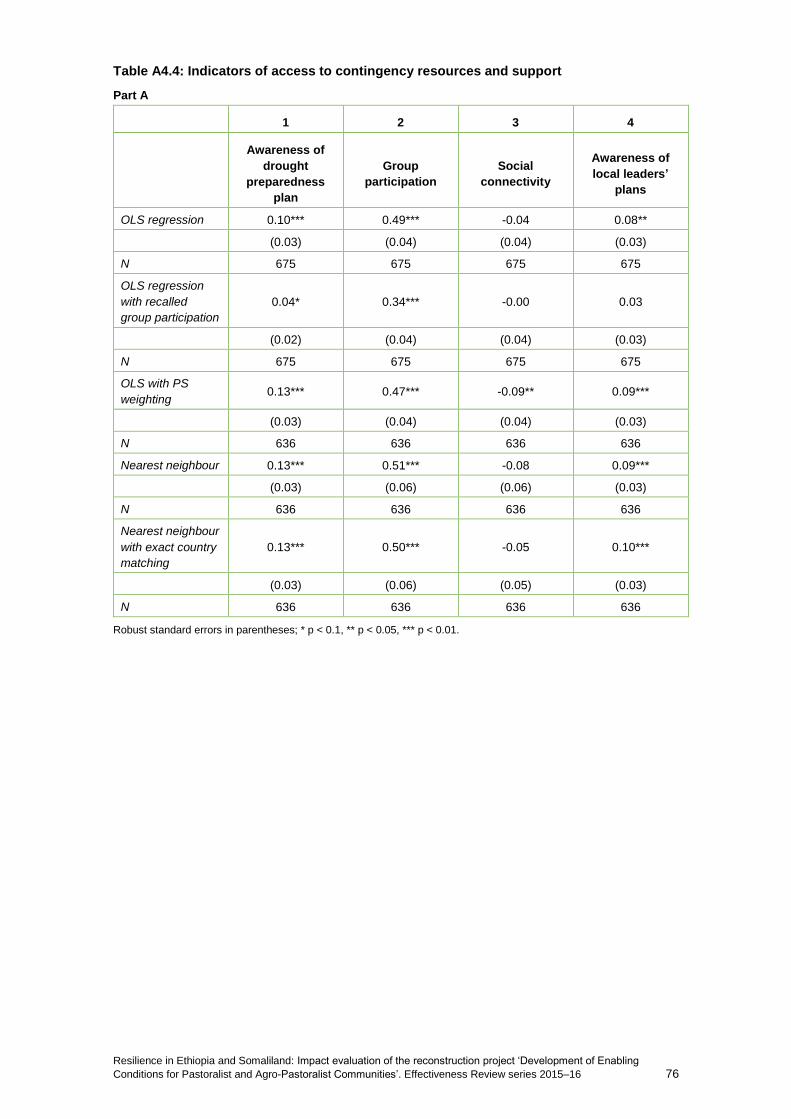
Resilience in Ethiopia and Somaliland: Impact evaluation of the reconstruction project ‘Development of Enabling
Conditions for Pastoralist and Agro-Pastoralist Communities’. Effectiveness Review series 2015–16 76
Table A4.4: Indicators of access to contingency resources and support
Part A
1 2 3 4
Awareness of
drought
preparedness
plan
Group
participation
Social
connectivity
Awareness of
local leaders’
plans
OLS regression 0.10*** 0.49*** -0.04 0.08**
(0.03) (0.04) (0.04) (0.03)
N 675 675 675 675
OLS regression
with recalled
group participation
0.04* 0.34*** -0.00 0.03
(0.02) (0.04) (0.04) (0.03)
N 675 675 675 675
OLS with PS
weighting 0.13*** 0.47*** -0.09** 0.09***
(0.03) (0.04) (0.04) (0.03)
N 636 636 636 636
Nearest neighbour 0.13*** 0.51*** -0.08 0.09***
(0.03) (0.06) (0.06) (0.03)
N 636 636 636 636
Nearest neighbour
with exact country
matching
0.13*** 0.50*** -0.05 0.10***
(0.03) (0.06) (0.05) (0.03)
N 636 636 636 636
Robust standard errors in parentheses; * p < 0.1, ** p < 0.05, *** p < 0.01.
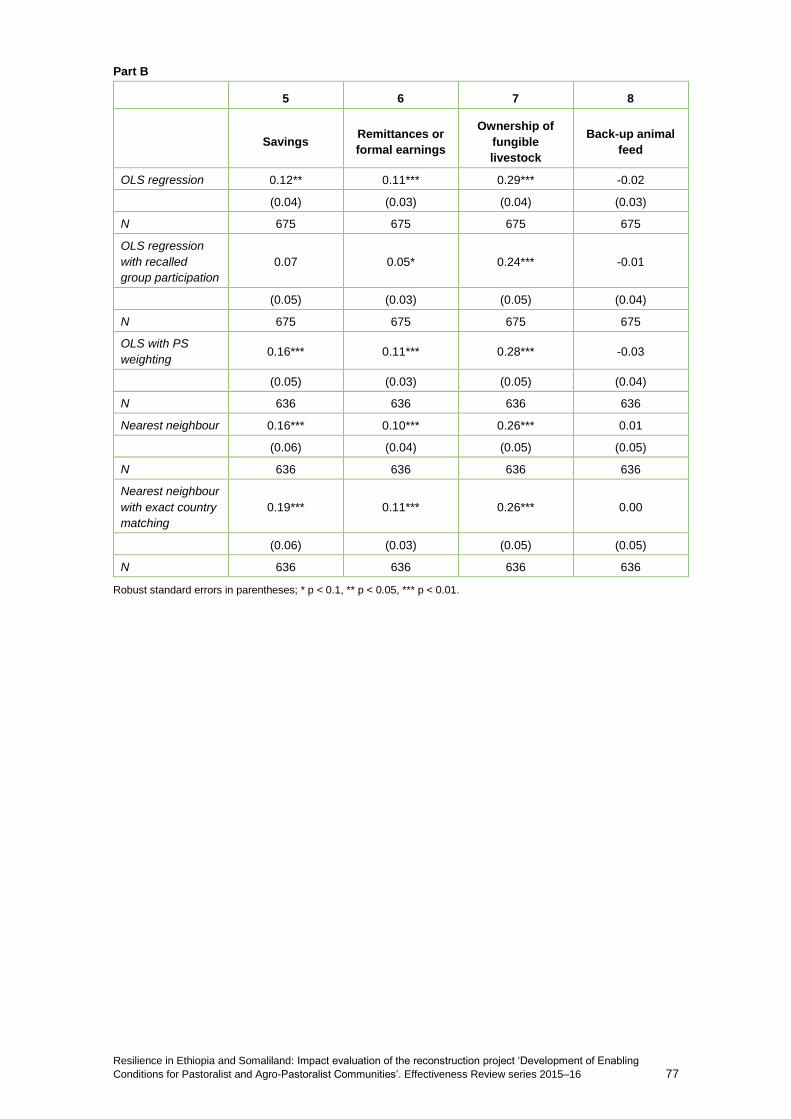
Resilience in Ethiopia and Somaliland: Impact evaluation of the reconstruction project ‘Development of Enabling
Conditions for Pastoralist and Agro-Pastoralist Communities’. Effectiveness Review series 2015–16 77
Part B
5 6 7 8
Savings Remittances or
formal earnings
Ownership of
fungible
livestock
Back-up animal
feed
OLS regression 0.12** 0.11*** 0.29*** -0.02
(0.04) (0.03) (0.04) (0.03)
N 675 675 675 675
OLS regression
with recalled
group participation
0.07 0.05* 0.24*** -0.01
(0.05) (0.03) (0.05) (0.04)
N 675 675 675 675
OLS with PS
weighting 0.16*** 0.11*** 0.28*** -0.03
(0.05) (0.03) (0.05) (0.04)
N 636 636 636 636
Nearest neighbour 0.16*** 0.10*** 0.26*** 0.01
(0.06) (0.04) (0.05) (0.05)
N 636 636 636 636
Nearest neighbour
with exact country
matching
0.19*** 0.11*** 0.26*** 0.00
(0.06) (0.03) (0.05) (0.05)
N 636 636 636 636
Robust standard errors in parentheses; * p < 0.1, ** p < 0.05, *** p < 0.01.
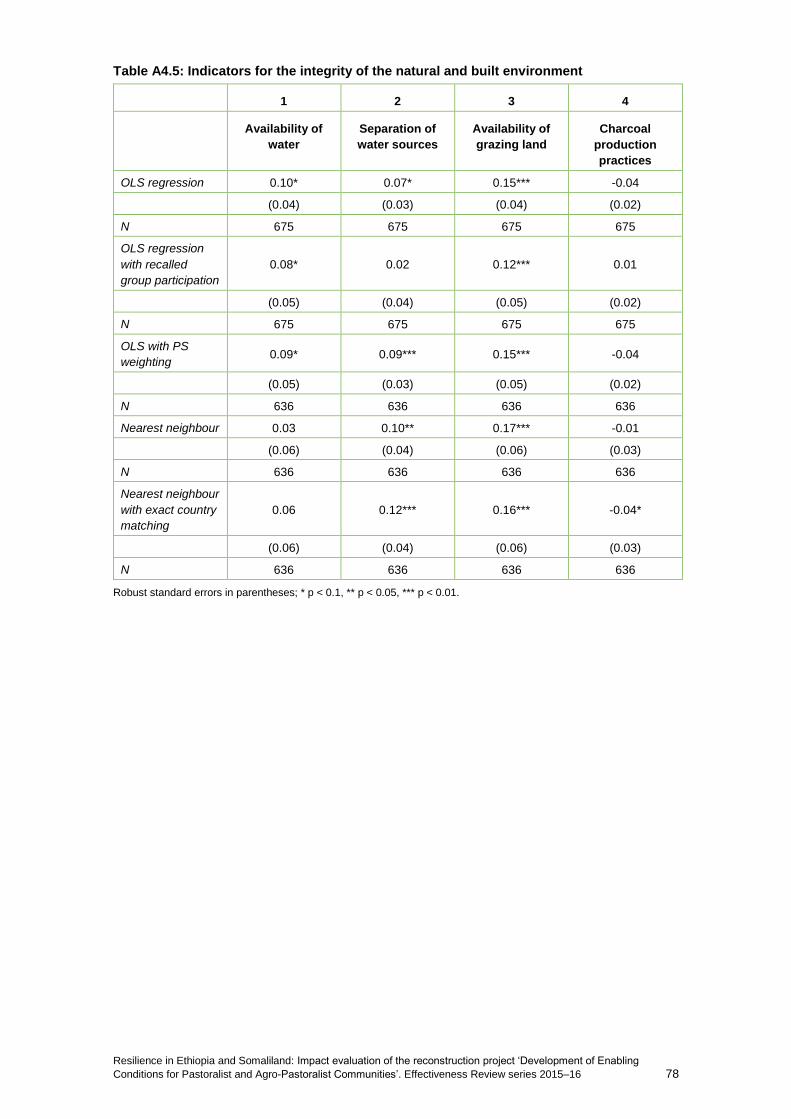
Resilience in Ethiopia and Somaliland: Impact evaluation of the reconstruction project ‘Development of Enabling
Conditions for Pastoralist and Agro-Pastoralist Communities’. Effectiveness Review series 2015–16 78
Table A4.5: Indicators for the integrity of the natural and built environment
1 2 3 4
Availability of
water
Separation of
water sources
Availability of
grazing land
Charcoal
production
practices
OLS regression 0.10* 0.07* 0.15*** -0.04
(0.04) (0.03) (0.04) (0.02)
N 675 675 675 675
OLS regression
with recalled
group participation
0.08* 0.02 0.12*** 0.01
(0.05) (0.04) (0.05) (0.02)
N 675 675 675 675
OLS with PS
weighting 0.09* 0.09*** 0.15*** -0.04
(0.05) (0.03) (0.05) (0.02)
N 636 636 636 636
Nearest neighbour 0.03 0.10** 0.17*** -0.01
(0.06) (0.04) (0.06) (0.03)
N 636 636 636 636
Nearest neighbour
with exact country
matching
0.06 0.12*** 0.16*** -0.04*
(0.06) (0.04) (0.06) (0.03)
N 636 636 636 636
Robust standard errors in parentheses; * p < 0.1, ** p < 0.05, *** p < 0.01.

Resilience in Ethiopia and Somaliland: Impact evaluation of the reconstruction project ‘Development of Enabling
Conditions for Pastoralist and Agro-Pastoralist Communities’. Effectiveness Review series 2015–16 79
Table A4.6: Indicators of social and institutional capability
Part A
1 2 3 4
Early-warning
system
Effectiveness of
local leaders
Support for
adaptation
Women and men
participate in
community
discussions/
gatherings
OLS regression 0.13*** 0.06 0.31*** 0.04
(0.04) (0.05) (0.04) (0.04)
N 675 675 675 675
OLS regression
with recalled
group participation
0.13*** 0.08* 0.22*** -0.01
(0.04) (0.05) (0.04) (0.04)
N 675 675 675 675
OLS with PS
weighting 0.16*** 0.09** 0.32*** 0.02
(0.04) (0.05) (0.04) (0.04)
N 636 636 636 636
Nearest neighbour 0.17*** 0.09 0.31*** 0.02
(0.04) (0.07) (0.04) (0.05)
N 636 636 636 636
Nearest neighbour
with exact country
matching
0.18*** 0.05 0.30*** 0.02
(0.04) (0.06) (0.04) (0.05)
N 636 636 636 636
Robust standard errors in parentheses; * p < 0.1, ** p < 0.05, *** p < 0.01.

Resilience in Ethiopia and Somaliland: Impact evaluation of the reconstruction project ‘Development of Enabling
Conditions for Pastoralist and Agro-Pastoralist Communities’. Effectiveness Review series 2015–16 80
Part B
5 6 7 8
Women have
influence over
household
decisions
Youth
participation in
community
decisions
Confidence in
selling livestock
across the
border
Experience of
disputes over
resources
OLS regression 0.04 0.09 0.00 -0.03
(0.04) (0.05) (0.04) (0.02)
N 675 675 675 675
OLS regression
with recalled
group participation
0.01 0.10* 0.00 0.01
(0.05) (0.05) (0.05) (0.02)
N 675 675 675 675
OLS with PS
weighting 0.03 0.05 -0.02 -0.04*
(0.05) (0.05) (0.05) (0.03)
N 636 636 636 636
Nearest neighbour -0.02 0.09 -0.02 -0.04
(0.06) (0.06) (0.06) (0.03)
N 636 636 636 636
Nearest neighbour
with exact country
matching
-0.04 0.03 -0.01 -0.04
(0.06) (0.06) (0.06) (0.03)
N 636 636 636 636
Robust standard errors in parentheses; * p < 0.1, ** p < 0.05, *** p < 0.01.
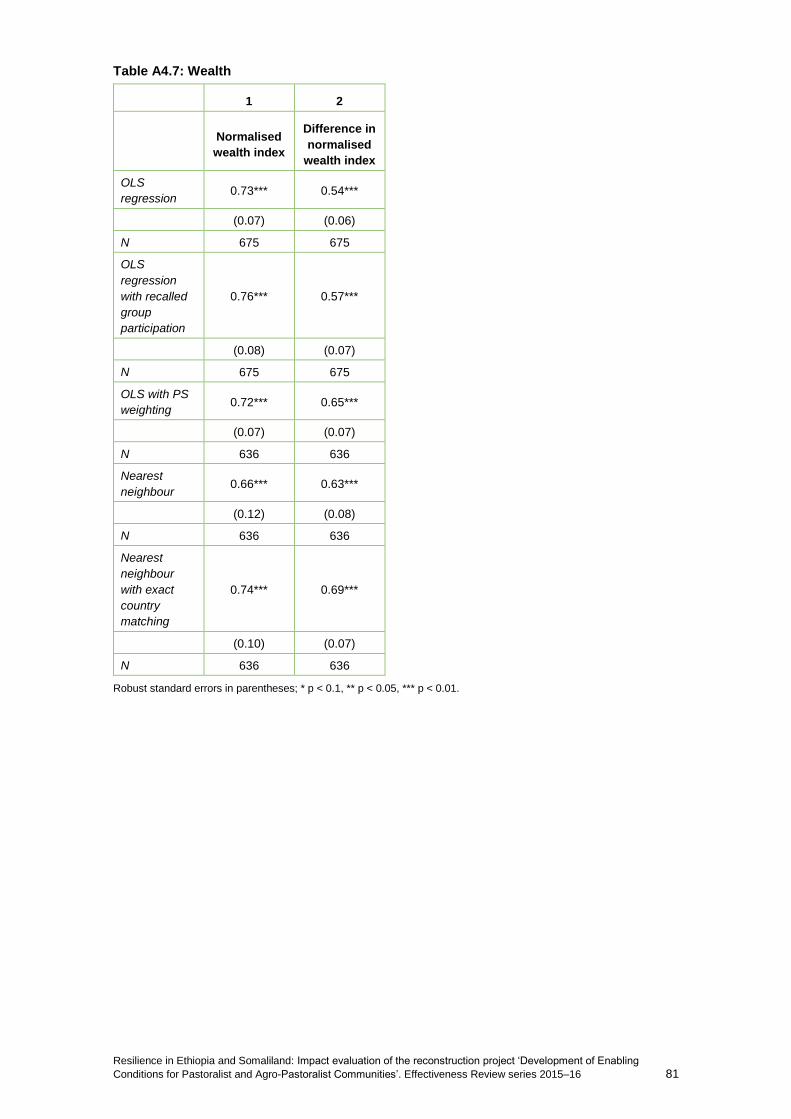
Resilience in Ethiopia and Somaliland: Impact evaluation of the reconstruction project ‘Development of Enabling
Conditions for Pastoralist and Agro-Pastoralist Communities’. Effectiveness Review series 2015–16 81
Table A4.7: Wealth
1 2
Normalised
wealth index
Difference in
normalised
wealth index
OLS
regression 0.73*** 0.54***
(0.07) (0.06)
N 675 675
OLS
regression
with recalled
group
participation
0.76*** 0.57***
(0.08) (0.07)
N 675 675
OLS with PS
weighting 0.72*** 0.65***
(0.07) (0.07)
N 636 636
Nearest
neighbour 0.66*** 0.63***
(0.12) (0.08)
N 636 636
Nearest
neighbour
with exact
country
matching
0.74*** 0.69***
(0.10) (0.07)
N 636 636
Robust standard errors in parentheses; * p < 0.1, ** p < 0.05, *** p < 0.01.
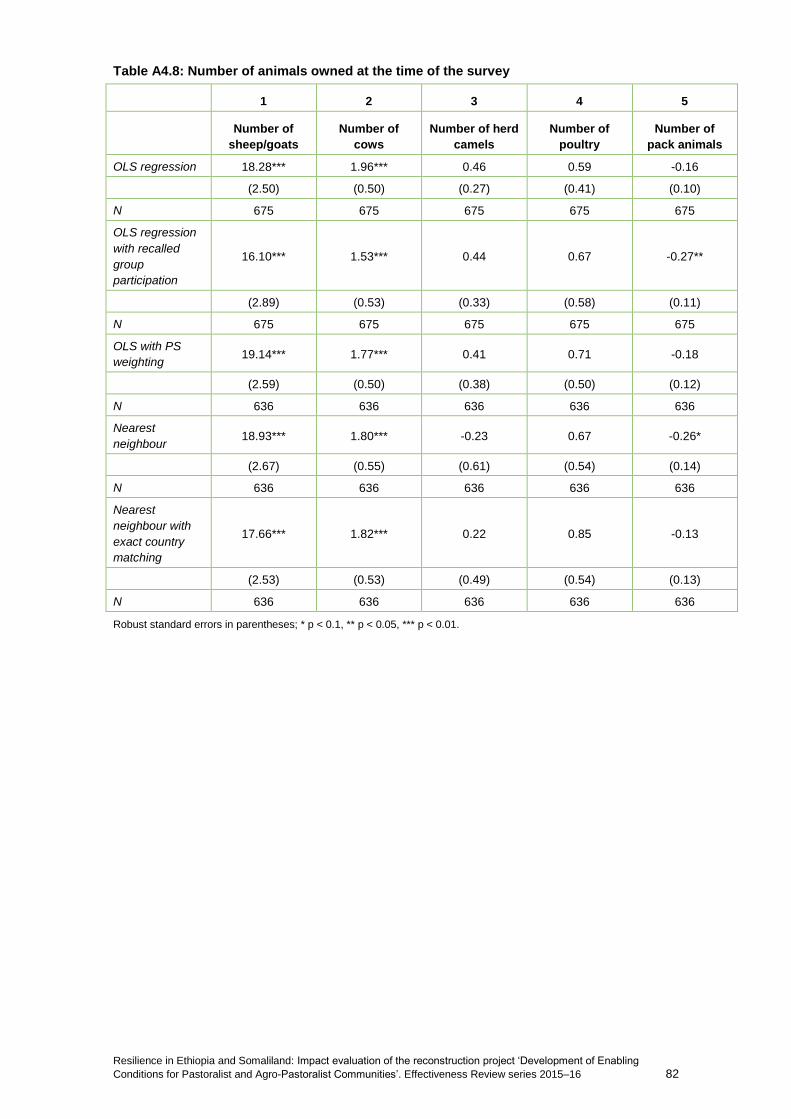
Resilience in Ethiopia and Somaliland: Impact evaluation of the reconstruction project ‘Development of Enabling
Conditions for Pastoralist and Agro-Pastoralist Communities’. Effectiveness Review series 2015–16 82
Table A4.8: Number of animals owned at the time of the survey
1 2 3 4 5
Number of
sheep/goats
Number of
cows
Number of herd
camels
Number of
poultry
Number of
pack animals
OLS regression 18.28*** 1.96*** 0.46 0.59 -0.16
(2.50) (0.50) (0.27) (0.41) (0.10)
N 675 675 675 675 675
OLS regression
with recalled
group
participation
16.10*** 1.53*** 0.44 0.67 -0.27**
(2.89) (0.53) (0.33) (0.58) (0.11)
N 675 675 675 675 675
OLS with PS
weighting 19.14*** 1.77*** 0.41 0.71 -0.18
(2.59) (0.50) (0.38) (0.50) (0.12)
N 636 636 636 636 636
Nearest
neighbour 18.93*** 1.80*** -0.23 0.67 -0.26*
(2.67) (0.55) (0.61) (0.54) (0.14)
N 636 636 636 636 636
Nearest
neighbour with
exact country
matching
17.66*** 1.82*** 0.22 0.85 -0.13
(2.53) (0.53) (0.49) (0.54) (0.13)
N 636 636 636 636 636
Robust standard errors in parentheses; * p < 0.1, ** p < 0.05, *** p < 0.01.
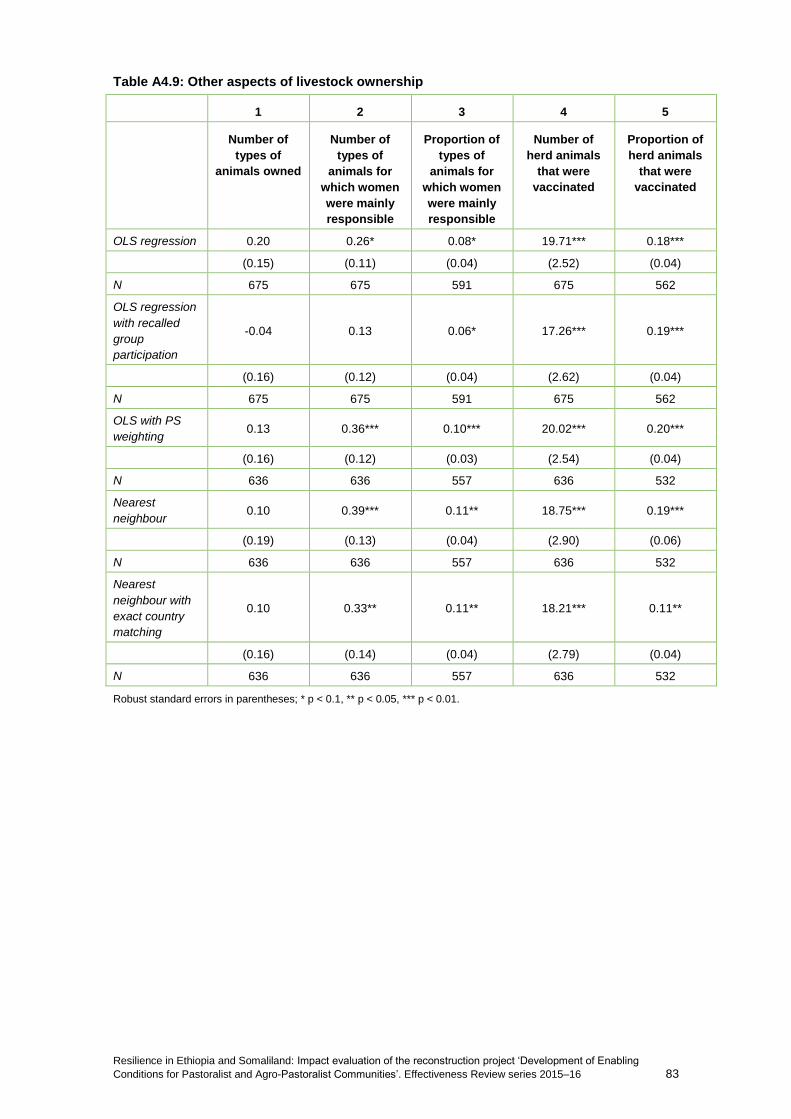
Resilience in Ethiopia and Somaliland: Impact evaluation of the reconstruction project ‘Development of Enabling
Conditions for Pastoralist and Agro-Pastoralist Communities’. Effectiveness Review series 2015–16 83
Table A4.9: Other aspects of livestock ownership
1 2 3 4 5
Number of
types of
animals owned
Number of
types of
animals for
which women
were mainly
responsible
Proportion of
types of
animals for
which women
were mainly
responsible
Number of
herd animals
that were
vaccinated
Proportion of
herd animals
that were
vaccinated
OLS regression 0.20 0.26* 0.08* 19.71*** 0.18***
(0.15) (0.11) (0.04) (2.52) (0.04)
N 675 675 591 675 562
OLS regression
with recalled
group
participation
-0.04 0.13 0.06* 17.26*** 0.19***
(0.16) (0.12) (0.04) (2.62) (0.04)
N 675 675 591 675 562
OLS with PS
weighting 0.13 0.36*** 0.10*** 20.02*** 0.20***
(0.16) (0.12) (0.03) (2.54) (0.04)
N 636 636 557 636 532
Nearest
neighbour 0.10 0.39*** 0.11** 18.75*** 0.19***
(0.19) (0.13) (0.04) (2.90) (0.06)
N 636 636 557 636 532
Nearest
neighbour with
exact country
matching
0.10 0.33** 0.11** 18.21*** 0.11**
(0.16) (0.14) (0.04) (2.79) (0.04)
N 636 636 557 636 532
Robust standard errors in parentheses; * p < 0.1, ** p < 0.05, *** p < 0.01.
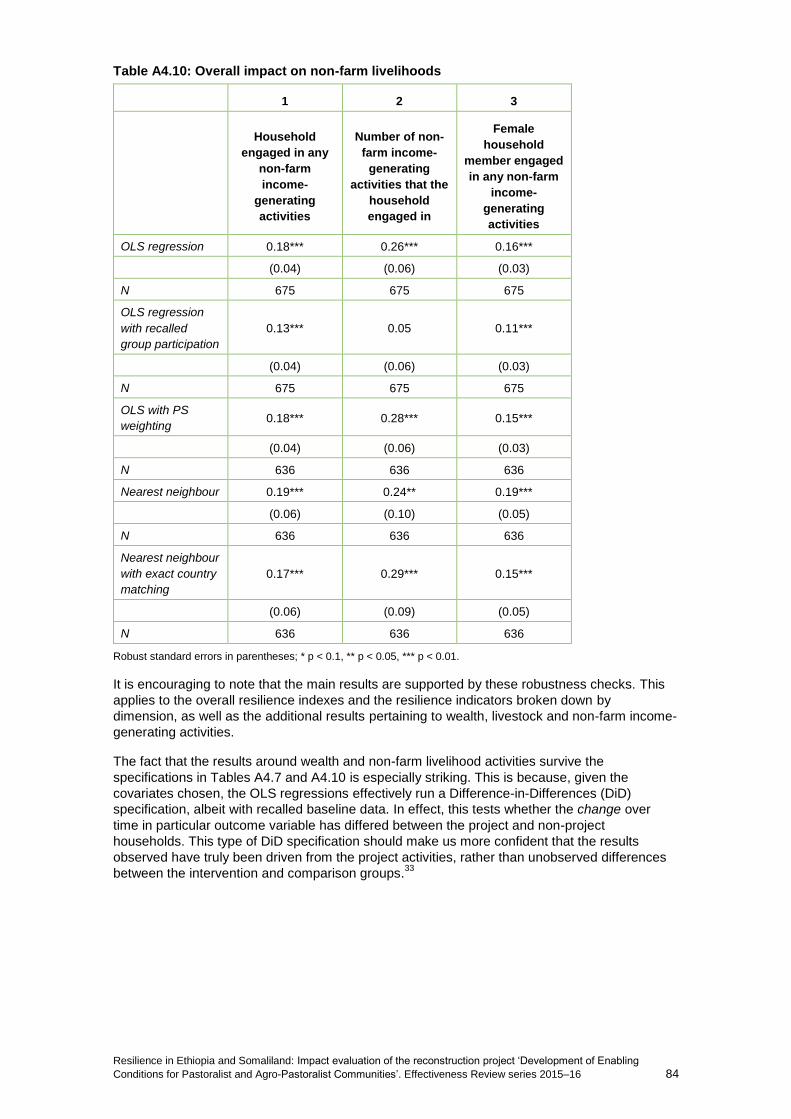
Resilience in Ethiopia and Somaliland: Impact evaluation of the reconstruction project ‘Development of Enabling
Conditions for Pastoralist and Agro-Pastoralist Communities’. Effectiveness Review series 2015–16 84
Table A4.10: Overall impact on non-farm livelihoods
1 2 3
Household
engaged in any
non-farm
income-
generating
activities
Number of non-
farm income-
generating
activities that the
household
engaged in
Female
household
member engaged
in any non-farm
income-
generating
activities
OLS regression 0.18*** 0.26*** 0.16***
(0.04) (0.06) (0.03)
N 675 675 675
OLS regression
with recalled
group participation
0.13*** 0.05 0.11***
(0.04) (0.06) (0.03)
N 675 675 675
OLS with PS
weighting 0.18*** 0.28*** 0.15***
(0.04) (0.06) (0.03)
N 636 636 636
Nearest neighbour 0.19*** 0.24** 0.19***
(0.06) (0.10) (0.05)
N 636 636 636
Nearest neighbour
with exact country
matching
0.17*** 0.29*** 0.15***
(0.06) (0.09) (0.05)
N 636 636 636
Robust standard errors in parentheses; * p < 0.1, ** p < 0.05, *** p < 0.01.
It is encouraging to note that the main results are supported by these robustness checks. This
applies to the overall resilience indexes and the resilience indicators broken down by
dimension, as well as the additional results pertaining to wealth, livestock and non-farm income-
generating activities.
The fact that the results around wealth and non-farm livelihood activities survive the
specifications in Tables A4.7 and A4.10 is especially striking. This is because, given the
covariates chosen, the OLS regressions effectively run a Difference-in-Differences (DiD)
specification, albeit with recalled baseline data. In effect, this tests whether the change over
time in particular outcome variable has differed between the project and non-project
households. This type of DiD specification should make us more confident that the results
observed have truly been driven from the project activities, rather than unobserved differences
between the intervention and comparison groups.33

Resilience in Ethiopia and Somaliland: Impact evaluation of the reconstruction project ‘Development of Enabling
Conditions for Pastoralist and Agro-Pastoralist Communities’. Effectiveness Review series 2015–16 85
APPENDIX 5: SUBGROUP ANALYSIS In this appendix, we consider whether project had differential effects, depending on the gender
of the household head and the country in which the household was situated. To do this, we ran
an OLS regression, similar to the robustness checks run in Appendix 4. However, we add a so-
called ‘interaction’ variable, to the equation, which is simply the intervention status ( ) multiplied
by a dummy variable for the subgroup that the household was in ( ). The regression model
also includes the matching variables as covariates ( ), to control for observable baseline
differences between the project and non-project households when estimating the effects of the
project. The regression equation estimated is shown in Equation 3.34
Equation 3
If the coefficient is statistically significant, this suggests that there have been differential
effects on the subgroups.
In this appendix, we consider only the main results pertaining to resilience, livelihoods, and
wealth that emerged from the Effectiveness Review.
Gender of the household head
We first consider whether the project had differential effects on households according to the
gender of the household head. For the results that follow, is a dummy variable, taking the
value 1 if the household head was male, and 0 if the household head was female. As we noted
in Section 4, the majority of the sampled households were female-headed because these types
of households were targeted by the project, and our sampling strategy, for both intervention and
comparison areas, was designed to echo this. However, given imperfections in the targeting of
the project and, by extension, the sampling, around 30 percent of sample was male-headed.
Table A5.1 shows the results for resilience and for wealth.
Table A5.1: Differential effects on resilience and wealth by gender of the household
head
1 2 3 4
Base
resilience
index
Sample dimensions
resilience index
Normalised wealth
index
Difference in
normalised wealth
index
Intervention 0.11*** 0.11*** 0.58*** 0.47***
(0.01) (0.01) (0.08) (0.07)
Intervention *
Gender of
Household Head
-0.02 -0.02 0.47*** 0.22
(0.02) (0.02) (0.13) (0.13)
Gender of
Household Head
(1=Male,
0=Female)
0.04*** 0.03** 0.44*** 0.36***
(0.01) (0.01) (0.06) (0.05)
Observations 675 675 675 675
Robust standard errors in parentheses; * p < 0.1, ** p < 0.05, *** p < 0.01.
Columns 1 and 2 show the project’s effect on the base resilience index and the sample
dimensions resilience index (see Section 5 for further details). It does not appear that the
project had differential effects on the resilience index, according to the gender of the household
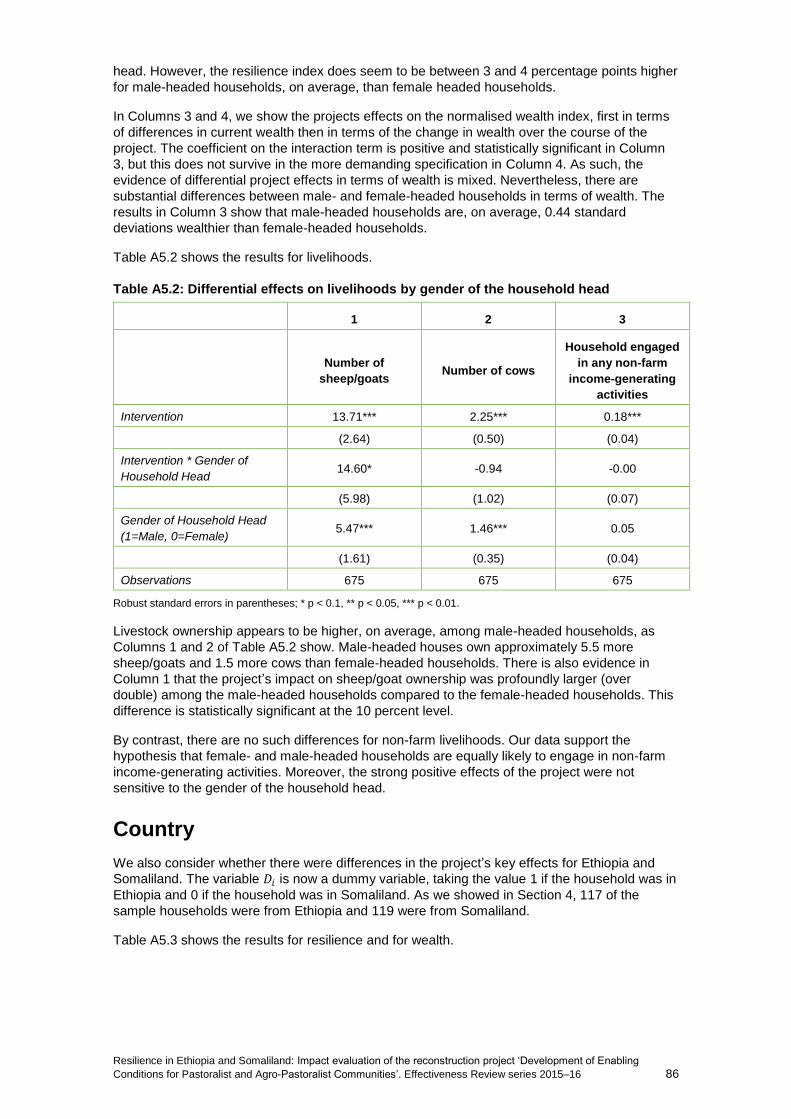
Resilience in Ethiopia and Somaliland: Impact evaluation of the reconstruction project ‘Development of Enabling
Conditions for Pastoralist and Agro-Pastoralist Communities’. Effectiveness Review series 2015–16 86
head. However, the resilience index does seem to be between 3 and 4 percentage points higher
for male-headed households, on average, than female headed households.
In Columns 3 and 4, we show the projects effects on the normalised wealth index, first in terms
of differences in current wealth then in terms of the change in wealth over the course of the
project. The coefficient on the interaction term is positive and statistically significant in Column
3, but this does not survive in the more demanding specification in Column 4. As such, the
evidence of differential project effects in terms of wealth is mixed. Nevertheless, there are
substantial differences between male- and female-headed households in terms of wealth. The
results in Column 3 show that male-headed households are, on average, 0.44 standard
deviations wealthier than female-headed households.
Table A5.2 shows the results for livelihoods.
Table A5.2: Differential effects on livelihoods by gender of the household head
1 2 3
Number of
sheep/goats Number of cows
Household engaged
in any non-farm
income-generating
activities
Intervention 13.71*** 2.25*** 0.18***
(2.64) (0.50) (0.04)
Intervention * Gender of
Household Head 14.60* -0.94 -0.00
(5.98) (1.02) (0.07)
Gender of Household Head
(1=Male, 0=Female) 5.47*** 1.46*** 0.05
(1.61) (0.35) (0.04)
Observations 675 675 675
Robust standard errors in parentheses; * p < 0.1, ** p < 0.05, *** p < 0.01.
Livestock ownership appears to be higher, on average, among male-headed households, as
Columns 1 and 2 of Table A5.2 show. Male-headed houses own approximately 5.5 more
sheep/goats and 1.5 more cows than female-headed households. There is also evidence in
Column 1 that the project’s impact on sheep/goat ownership was profoundly larger (over
double) among the male-headed households compared to the female-headed households. This
difference is statistically significant at the 10 percent level.
By contrast, there are no such differences for non-farm livelihoods. Our data support the
hypothesis that female- and male-headed households are equally likely to engage in non-farm
income-generating activities. Moreover, the strong positive effects of the project were not
sensitive to the gender of the household head.
Country
We also consider whether there were differences in the project’s key effects for Ethiopia and
Somaliland. The variable is now a dummy variable, taking the value 1 if the household was in
Ethiopia and 0 if the household was in Somaliland. As we showed in Section 4, 117 of the
sample households were from Ethiopia and 119 were from Somaliland.
Table A5.3 shows the results for resilience and for wealth.

Resilience in Ethiopia and Somaliland: Impact evaluation of the reconstruction project ‘Development of Enabling
Conditions for Pastoralist and Agro-Pastoralist Communities’. Effectiveness Review series 2015–16 87
Table A5.3: Differential effects on resilience and wealth by country
1 2 3 4
Base
resilience
index
Sample
dimensions
resilience index
Normalised wealth
index
Difference in
normalised wealth
index
Intervention 0.08*** 0.07*** 0.82*** 0.54***
(0.01) (0.01) (0.09) (0.08)
Intervention *
Ethiopia
0.05** 0.07*** -0.17 0.00
(0.02) (0.02) (0.12) (0.12)
Country is
Ethiopia? (1=Y,
0=N)
-0.05*** -0.04*** -0.09 -0.06
(0.01) (0.01) (0.06) (0.05)
Observations 675 675 675 675
Robust standard errors in parentheses; * p < 0.1, ** p < 0.05, *** p < 0.01.
As Columns 1 and 2 demonstrate, the picture for the overall resilience indexes was substantially
different between the two countries. Firstly, the base resilience index was lower in Ethiopia than
Somaliland in the sample as a whole by approximately 5 percentage points. However, in the
intervention had a more substantial effect on Ethiopian households, as the positive and
significant coefficient on the interaction term shows. This suggests that vulnerability to shocks
and stresses was initially more severe in Ethiopia, but that is where the effects of the project
have been most profound.
Finally, Table A5.4 shows the results for livelihoods.
Table A5.4: Differential effects on livelihoods by country
1 2 3
Number of sheep/goats Number of cows Household engaged
in any non-farm
income-generating
activities
Intervention 34.29*** 2.76** 0.22***
(4.13) (0.85) (0.05)
Intervention *
Ethiopia -29.85*** -1.38 -0.08
(4.43) (0.87) (0.07)
Country is Ethiopia?
(1=Y, 0=N) -12.75*** -2.72*** 0.06
(1.62) (0.34) (0.04)
Observations 675 675 675
Robust standard errors in parentheses; * p < 0.1, ** p < 0.05, *** p < 0.01.
The greater vulnerability among Ethiopian households is further reflected in the smaller herd
sizes on that side of the border, especially in terms of sheep/goats. On average, Ethiopian
households had nearly 13 fewer sheep/goats than Somalilander households, while the
difference for the intervention group alone was approximately 43 sheep/goats. This means the
project’s positive effects on herd size are mainly restricted to Somaliland.
Resilience in Ethiopia and Somaliland: Impact evaluation of the reconstruction project ‘Development of Enabling
Conditions for Pastoralist and Agro-Pastoralist Communities’. Effectiveness Review series 2015–16 88
However, this cross-border pattern is not true for non-farm livelihoods. In Column 3 the data
suggest that the project’s positive effects on non-farm income-generating activities were
enjoyed approximately equally by Ethiopian and Somalilander households.

Resilience in Ethiopia and Somaliland: Impact evaluation of the reconstruction project ‘Development of Enabling
Conditions for Pastoralist and Agro-Pastoralist Communities’. Effectiveness Review series 2015–16 89
APPENDIX 6: WEIGHTING EXERCISE During the questionnaire, respondents were asked to provide their perceptions of which
dimensions of resilience that they thought were most important. To do this, the enumerators
conducted a so-called ‘budget allocation game’ with each respondent. This involved showing
the respondent a special laminated sheet, on which five pictures were drawn, each representing
one of the five dimensions of resilience (see below). Next to each picture is a short description,
explaining what each picture represents. The enumerators read out these descriptions in the
local language to help the respondents understand what the pictured showed. The content of
each picture was developed through consultation with Oxfam staff and a local artist, based in
Jijiga. The pictures were not developed to provide a ‘complete’ picture of each of the five
dimensions. Rather they were designed to capture the main feature(s) of a particular dimension
in as simple and comprehensible way as possible.
After being shown the pictures and having heard the descriptions, respondents were asked
about how important they thought each dimension was for resilience. Specifically, they were
asked: ‘How important are the following things to you in making sure your household members
have everything they need, even in difficult times?’. To show this, respondents were given 15
stones, of approximately equal sizes, and asked to place the stones on each category to show
what they thought was most important for resilience. The stones were chosen to be of roughly
equal size to prevent confusion. Objects with more standard sizes – such as grains, buttons, or
counters – were not thought to be suitable for the contexts of Ethiopia and Somaliland.
The enumerator then recorded the number of stones on each dimension of resilience in the
mobile devices. This would then automatically check that the number of stones added up to 15,
to ensure data quality.
Figure A6.1: Sheet shown to respondents during the ‘budget allocation game’
Resilience in Ethiopia and Somaliland: Impact evaluation of the reconstruction project ‘Development of Enabling
Conditions for Pastoralist and Agro-Pastoralist Communities’. Effectiveness Review series 2015–16 90
BIBLIOGRAPHY A. Abadie and G. W. Imbens, On the failure of the bootstrap for matching estimators, Econometric, vol. 76 (2008), pages 1537–1557. Marco Caliendo and Sabine Kopeinig, Some Practical Guidance for the Implementation of Propensity Score Matching, Journal of Economic Surveys, vol. 22(1) (2008), pages 31–72. Martin Bland and Douglas G. Altman, Statistics notes: Cronbach’s alpha, British Medical Journal, (1997). Deon Filmer and Lant H. Pritchett, Estimating Wealth Effects Without Expenditure Data – Or Tears: An Application to Educational Enrollments in States of India, Demography, vol. 38(1) (2001), pages 115–132. James J. Heckman, Robert J. LaLonde and Jeffrey A. Smith, The Economics and Econometrics of Active Labor Market Programs, Handbook of Labor Economics, vol. 3, part A (1999), pages 1865–2097. Keisuke Hirano and Guido W. Imbens, Estimation of Causal Effects using Propensity Score Weighting: An Application to Data on Right Heart Catheterization, Health Services & Outcomes Research Methodology,
vol. 2 (2001), pages 259–278. Paul R. Rosenbaum and Donald B. Rubin, The Central Role of the Propensity Score in Observational Studies for Causal Effects, Biometrika, vol. 70(1) (1983), pages 41–55.
Donald B. Rubin, Using Propensity Scores to Help Design Observational Studies: Application to the Tobacco Litigation, Health Services & Outcomes Research Methodology, vol. 2(3) (2001), pages 169–188.
Resilience in Ethiopia and Somaliland: Impact evaluation of the reconstruction project ‘Development of Enabling
Conditions for Pastoralist and Agro-Pastoralist Communities’. Effectiveness Review series 2015–16 91
NOTES
1 The village elders took full responsibility for identifying the poor, female-headed households containing women who were willing to participate in non-farm income-generating activities for both the project and the comparison communities in our sample.
2 There were some ‘ceremonial’ districts in Somaliland, but these did not have clear borders, and therefore were not a suitable basis for sampling.
3 Alaybaday was also excluded from the sample, given the fact it straddled the two countries and contained a series of official checkpoints.
4 The definition of ‘poor’ was structured around the ownership of livestock as well as other productive equipment and household assets.
5 Given the matching methodology we used, this may result in us underestimating the full effects of the project on livelihoods and wealth.
6 Discontent within the comparison group may also affect respondents’ answers to questions about current wealth levels. This must be borne in mind when interpreting the results in Section 6.7.
7 This arises due to ‘classical measurement error’, which attenuates effect sizes – including for basic t-tests – towards zero.
8 This approach is described in ‘A Multidimensional Approach to Measuring Resilience’, Oxfam GB working paper, August 2013: http://policy-practice.oxfam.org.uk/publications/a-multidimensional-approach-to-measuring-resilience-302641.
9 Oxfam International’s recent programme guidelines have conceptualised resilience in terms of three capacities rather than five dimensions. The five dimensions used in this Effectiveness Review represent a specific Oxfam GB methodology for measuring resilience. Future Oxfam impact evaluations will make use of the three capacities framework instead.
10 Specifically, focus group discussions were carried out in Yosle, Jijiga woreda.
11 It should be noted that, if the dimensions are first weighted equally, each additional indicator added to a dimension is effectively down-weighted in the resulting resilience index.
12 The only statistically significant differences between the intervention and comparison groups emerged for the dimension of ‘social and institutional capability’.
13 Providing these types of biases – associated with interview fatigue – are not systematically different between the intervention and comparison groups, this should not bias our estimates of the effects of the project.
14 We would expect the data collected on community gatherings to over-estimate the incidence of such gatherings at the time of the survey or in the year prior to the survey.
15 In Table 6.5, we specifically mean cows – female animals – and not cattle more broadly.
16 Local Oxfam staff anticipated that the ownership of pack animals would be almost universal across households in the project area. The results are clearly at odds with this expectation. It may, therefore, be that there were some problems with the comprehension of this question in the survey, so we should exercise some caution when interpreting the results on pack animals.
17 For this diversification variable, sheep and goats were separated out.
18 One difficulty with interpreting this result is that it is not clear how the idea of ‘responsibility for caring for animals’ was interpreted. It may be that ‘responsibility’ refers to the work that women were doing to care for the animals or some notion of ownership or control.
19 We also considered livestock losses in our analysis. However, there were some technical problems with recording this data and there were no clear differences between the intervention and comparison groups in our results.
20 If anything, we may expect the differences in Column 1 of Table 6.9 to underestimate the true effects of the project. It is possible that project households overestimated engagement in farming crops at the start of 2012, because of difficulties in remembering back to a time before any project activities had been implemented. Since this variable is included in our matching procedure we may in fact be inadvertently controlling for differences between the intervention and comparison groups that resulted from the project – precisely the effect we are trying to estimate.
21 The results in Columns 3 and 4 of Table 6.12 are not sensitive to restricting the sample to livestock-owning households.
22 We ensure the item-rest correlation for each asset is greater than 0.1. We also ensure that Cronbach’s alpha is at least 0.7, following the BMJ guidance note (Bland and Altman, 1997). The resulting list of assets included in the wealth index is: (1) number of rooms of the hut/house, (2) a dummy for cement
Resilience in Ethiopia and Somaliland: Impact evaluation of the reconstruction project ‘Development of Enabling
Conditions for Pastoralist and Agro-Pastoralist Communities’. Effectiveness Review series 2015–16 92
walls, (3) a dummy for having an iron roof, (4) a dummy for typically using charcoal for cooking, (5) a dummy for having access to electricity, (6) jerry cans, (7) bladders, (8) metal milk containers, (9) plastic milk containers, (10) machetes, (11) rakes, (12) axes, (13) hoes, (14), wheelbarrows, (15) carts, (16) ploughs, (17) grinding mills, (18) private birkads, (19) plastic sheets for covering the house, (20) plastic sheets for other purposes, (21) boxes, (22) watches, (23) floor mats, (24) other mats, (25) stools, (26) chairs, (27) tables, (28) mattresses, (29) lamps, (30) cooking pots, (31) music players, (32) solar panels, (33) television sets, (34) generators, (35) motorcycles, (36) cows, (37) sheep, (38) goats, (39) herd camels, (40) pack camels.
23 This follows the guidance in Filmer and Pritchett (2001). The first principal component captures sufficient variation in the data.
24 To do this, we subtract the mean of the wealth index, and then divide by its standard deviation.
25 These results present something similar to difference-in-differences specification. However, the baseline data is recalled rather than measured at baseline.
26 The positive results in Table 6.13 are, if anything, stronger if livestock is omitted from the calculation of the wealth index.
27Our main list of matching variables does not directly include recalled data on whether or not the household received remittances at baseline. We may therefore be concerned that the positive effects we see in Column 6 of Table 6.17 are being driven by the baseline differences in the receipt of remittances seen in Appendix 2. However, we can assuage these concerns by directly adding recalled data on remittances into the matching function. The results in Column 6 of Table 6.17 are not sensitive to controlling for this. Therefore, we should be confident in the finding that the project had a positive effect on receipt of remittances, and that the existing matching variables are sufficient to control for any baseline differences in terms of remittance receipts between the intervention and comparison groups.
28 We elected not to cluster our standard errors at the community level because this would result in a small number of clusters and would be likely to bias our standard errors downwards.
29 It should be noted that we report robust standard errors for all these regression techniques. However, the standard errors are not bootstrapped as in the main results in Section 6.
30 We are able to test whether the covariates are distributed sufficiently similarly for the intervention and comparison group using Rubin’s (2001) tests. For the matching variables used in this report, with the kernel matching algorithm, Rubin’s B = 19.2, and Rubin’s R = 0.81. According to Rubin’s recommendations, this suggests that the covariates are sufficiently balanced for OLS regression methods to be valid.
31 Choosing whether to match with and without replacement involves a trade-off between bias and variance. If we allow replacement, the average quality of matching will increase and the bias will decrease, especially when the distribution of the propensity score is very different in the intervention and comparison group. However, allowing for replacement increases the variance of the estimates because, in effect, the number of distinct comparison observations is reduced (Caliendo and Kopeinig, 2008).
32 Following the guidance of Abadie and Imbens (2008), we calculate robust standard errors analytically using the teffects module in Stata. These standard errors are not bootstrapped.
33 The Difference-in-Differences method can control for time-invariant unobservables but time-variant unobservables may still bias our results.
34 We estimate Equation 1 without restricting the data to the area of common support. However, we also test whether our results are sensitive to re-estimating the regressions, with propensity score weighting. This makes little difference to the results shown in Appendix 5.

Resilience in Ethiopia and Somaliland: Impact evaluation of the reconstruction project ‘Development of Enabling
Conditions for Pastoralist and Agro-Pastoralist Communities’. Effectiveness Review series 2015–16 93

Resilience in Ethiopia and Somaliland: Impact evaluation of the reconstruction project ‘Development of Enabling
Conditions for Pastoralist and Agro-Pastoralist Communities’. Effectiveness Review series 2015–16 94
Oxfam Effectiveness Reviews
For more information, or to comment on this report, email [email protected].
© Oxfam GB June 2017
This publication is copyright but the text may be used free of charge for the purposes of advocacy,
campaigning, education, and research, provided that the source is acknowledged in full. The copyright
holder requests that all such use be registered with them for impact assessment purposes. For copying in
any other circumstances, or for re-use in other publications, or for translation or adaptation, permission
must be secured and a fee may be charged. E-mail [email protected].
The information in this publication is correct at the time of going to press.
Published by Oxfam GB under ISBN 978-1-78748-010-0 in June 2017.
Oxfam GB, Oxfam House, John Smith Drive, Cowley, Oxford, OX4 2JY, UK.
DOI: 10.21201/2017.0100
OXFAM
Oxfam is an international confederation of 20 organizations networked together in more than 90 countries,
as part of a global movement for change, to build a future free from the injustice of poverty. Please write to
any of the agencies for further information, or visit www.oxfam.org.
Oxfam America (www.oxfamamerica.org)
Oxfam Australia (www.oxfam.org.au)
Oxfam-in-Belgium (www.oxfamsol.be)
Oxfam Brasil (www.oxfam.org.br)
Oxfam Canada (www.oxfam.ca)
Oxfam France (www.oxfamfrance.org)
Oxfam Germany (www.oxfam.de)
Oxfam GB (www.oxfam.org.uk)
Oxfam Hong Kong (www.oxfam.org.hk)
Oxfam IBIS (Denmark) (http://oxfamibis.dk/)
Oxfam India (www.oxfamindia.org)
Oxfam Intermón (Spain) (www.intermonoxfam.org)
Oxfam Ireland (www.oxfamireland.org)
Oxfam Italy (www.oxfamitalia.org)
Oxfam Japan (www.oxfam.jp)
Oxfam Mexico (www.oxfammexico.org) Oxfam New Zealand (www.oxfam.org.nz) Oxfam Novib (Netherlands) (www.oxfamnovib.nl)
Oxfam Québec (www.oxfam.qc.ca)
Oxfam South Africa (www.oxfam.org.za)
www.oxfam.org.uk/effectiveness