Embed Size (px)
Citation preview

NBER WORKING PAPER SERIES
SOLVING SHORTAGE IN A PRICELESS MARKET:INSIGHTS FROM BLOOD DONATION
Tianshu SunSusan Feng LuGinger Zhe Jin
Working Paper 21312http://www.nber.org/papers/w21312
NATIONAL BUREAU OF ECONOMIC RESEARCH1050 Massachusetts Avenue
Cambridge, MA 02138July 2015
We thank Rena Conti, Jessica Goldberg, Tamara Konetzka, Soohyung Lee, Andrew Sfekas, FabriceSmieliauskas, Lesley Turner, and participants at International Industrial Organization Conference2015 as well as at seminars at University of Maryland and University of Chicago for constructive comments.Sun acknowledges the support of Doctoral Research Grant from CIBER at University of Maryland.We also thank the staff at the blood bank that provided the data for tirelessly explaining the institutionand answering our questions. This paper would not exist without their help. All errors are ours. Allrights reserved. The views expressed herein are those of the authors and do not necessarily reflectthe views of the National Bureau of Economic Research.
NBER working papers are circulated for discussion and comment purposes. They have not been peer-reviewed or been subject to the review by the NBER Board of Directors that accompanies officialNBER publications.
© 2015 by Tianshu Sun, Susan Feng Lu, and Ginger Zhe Jin. All rights reserved. Short sections oftext, not to exceed two paragraphs, may be quoted without explicit permission provided that full credit,including © notice, is given to the source.

Solving Shortage in a Priceless Market: Insights from Blood DonationTianshu Sun, Susan Feng Lu, and Ginger Zhe JinNBER Working Paper No. 21312July 2015JEL No. D47,D83,I18
ABSTRACT
Shortage is common in many markets, such as those for human organs or blood, but the problem isoften difficult to solve through price adjustment, given safety and ethical concerns. In this paper, weinvestigate whether market designers can use non-price methods to address shortage. Specifically,we study two methods that are used to alleviate shortage in the market for human blood. The first methodis informing existing donors of a current shortage via a mobile message and encouraging them to donatevoluntarily. The second method is asking the patient’s family or friends to donate in a family replacement(FR) program at the time of shortage. We are interested in both the short-run and long-run effects ofthese methods on blood supply. Using 447,357 individual donation records across 8 years from a largeChinese blood bank, we show that both methods are effective in addressing blood shortage in the shortrun but have different implications for total blood supply in the long run. Specifically, we find thata shortage message leads to significantly more donations among existing donors within the first sixmonths but has no effect afterwards. In comparison, a family replacement program has a small positiveeffect in encouraging existing donors (who donated before the FR) to donate more blood voluntarilyafter their FR donation, but discourages no-history donors (whose first donation is the FR) from donatingin the long run. We compare the effect and efficiency of these methods and discuss their applicationsunder different scenarios to alleviate shortage.
Tianshu SunRobert H. Smith School of Business3330 Van Munching HallCollege Park, MD [email protected]
Susan Feng LuKRA 441Krannert School of ManagementPurdue UniversityRochester, NY, [email protected]
Ginger Zhe JinUniversity of MarylandDepartment of Economics3115F Tydings HallCollege Park, MD 20742-7211and [email protected]

1
1. Introduction
When market supply falls short of market demand, economists often recommend price
adjustment to clear the market. However, due to safety and ethical concerns, many markets
prohibit price adjustments or do not allow a market price to exist at all (Roth 2007). Organ, tissue,
and blood donations are prominent examples. A stream of research has examined how matching
mechanisms can increase the number of kidney transplants conditional on a pool of people who
have already expressed an intent to donate (Roth et al. 2004, 2005). However, the number of
donors is still low relative to the increasing demand, which highlights the importance of
recruiting new donors (Kessler and Roth 2012, 2014). Economic incentive (Lacetera et al. 2012,
2013) and alternative allocation policies (Kessler and Roth 2012) have been proposed to increase
donations. While effective, much uncertainty and many restrictions still remain in implementing
these proposals (WHO 2009, Lacetera et al. 2013). Thus, recent research has called for studies on
alternative methods to induce donations (Lacetera et al. 2014, Goette et al. 2010).
To answer this call, we study the impact of non-price methods in addressing shortage.
Specifically, we are interested in three questions. First, can market designers utilize “shortage” as
a tool to increase the “warm glow” donors get from donation and therefore stimulate market
supply?1. Second, even if shortage-based methods lead to greater supply in the short run, will the
effect last in the long run? Third, in the short and long run, can shortage-based methods help
recruit and retain new donors? To address these questions, we study two shortage-based non-price
methods that practitioners often consider in a classic priceless market – blood donation – but our
findings may be generalized to other priceless markets with shortage, such as those for human
organs or tissue (Kessler and Roth 2014).
Shortage is common and frequent in the human blood market (Slonim et al. 2014). Figure
1 presents a World Health Organization (WHO) map of donation rate as of 2007. Countries that
have low donation rate per capita are often poor and suffer from long-lasting blood shortage. In
contrast, mid-to-high income countries have relatively high donation rates and are more likely to
experience seasonal or type-specific shortage due to unexpected attritions or emergency events.
Mostly driven by quality concerns, the WHO advocates for 100% unpaid voluntary donation for
1 Given the difficulty of distinguishing pure altruism from the warm feeling of doing good for others, we refer to
both as the “warm glow”. In the economics literature, altruistic individuals are assumed to gain utility from
increasing the welfare of others, while individuals motivated by the warm feeling of doing good receive utility
from their own contributions directly (Andreoni, 1989; 1990). Studies in the lab and the field have confirmed the
importance of warm feelings (Crumper and Grossman 2008, DellaVigna et al. 2012), and find that donations
connected with a greater sense of need or deservingness also create more warm feelings (Konow 2010). In our
context, it is difficult to distinguish altruism from warm feelings, so we refer to both as the warm glow.

2
all medical use of human blood.2 But this goal is hard to reach in many countries. As of 2012, 73
countries collected over 90% of their blood supply from voluntary unpaid blood donors; however,
72 countries collected more than 50% of their blood supply from family replacement or paid
donors (WHO 2014).
Facing shortage and a ban on monetary incentive, blood banks often resort to two
methods to meet their needs. First, they strive to recruit more unpaid voluntary donors by
conveying shortage information to past donors in order to induce a warm glow and increase
donation. However, if shortage is too severe or too frequent, donor recruitment via the shortage
message alone may not be sufficient to close the gap. Another method is implementing a family
replacement (FR) program. At the time of shortage, a patient in need of blood can be given the
option to recruit their family or friends to donate blood so that the patient can use the blood
immediately. In practice, because not all blood types can be transfused safely between
individuals, the blood bank swaps FR donation with the same amount of blood from the inventory
for the dedicated patient.
These two methods have different pros and cons. First, the blood bank can choose exactly
to whom and when to send the shortage message, but the FR depends on the random arrival rate
of patients and the patients’ ability to recruit potential donors. Second, if the FR program is able
to generate additional donations in the short run, they are proportional to the level of shortage. In
contrast, the donation amount from the shortage message is more uncertain. Third, the shortage
message targets existing donors only, but the FR program can motivate donations from
individuals who have never donated before or would never donate voluntarily in the future. By
specifying the immediate recipient of the donation (a friend/family member in need of blood), FR
treatment can generate even more of a warm glow from FR donors (Fong and Luttmer 2009, List
and Price 2009). Such a warm glow may last in the long run and expand beyond one’s close
social network. Finally, FR shifts the burden of donor recruitment from the blood bank to
individual patients, which could cut the cost of recruitment by 75 to 87 percent.3
Neither the shortage message nor FR donation is immune from the risk of reducing the
blood supply in the long run. Specifically, this downside risk may arise through two mechanisms.
First, theoretically and empirically, economists have shown that some individuals are conditional
2 WHO (2009) stated that “more than 30 years after the first World Health Assembly resolution (WHA28.72) ….
family replacement and paid donation continue in many countries even though there is convincing evidence that
they are both less safe and that their use can inhibit progress to a safer system based on 100% VNRBD.”
VNRBD stands for 100% voluntary non–remunerated blood donation. 3 As shown in Bates et al. (2007), the cost of getting blood from voluntary donors recruited and screened at
transfusion centers is four to eight times as much as the cost of obtaining blood from hospital-based FR donation.
It is usually the bank’s responsibility to find voluntary donors, whereas the burden of finding FR donors falls on
the patient’s family.
3
cooperators who are more willing to contribute to a public good when they learn that others do so
as well.4 In our context, both the shortage message and FR donation convey credible information
about others’ (insufficient) donation and therefore could reduce the incentive to donate among
those who value conditional cooperation. We refer to this effect as “distrust.” Moreover, the FR
program allows blood donations to be shared with family/friends rather than with the general
public. While this could reduce one’s incentive to free ride, it may also create an incentive to save
the blood for one’s small social circle and crowd out the incentive to donate for the society. We
refer to this substitution effect between the intrinsic motivation for the public and the private
incentive for one’s own friends and family as a “crowd-out.”
Second, the FR program also raises a concern about blood quality. The implementation of
the FR program could encourage desperate patients to hire professional donors as “friends” and
thus jeopardize blood quality. For this reason, the WHO recommends phasing out FR donation
and eliminating paid donation. Nevertheless, researchers have found mixed evidence regarding
the blood quality of FR donors: on one hand, Abdel Messih et al. (2014) use Egyptian data to
show that the prevalence of transfusion-transmissible infections is much higher among FR
donors than among voluntary donors; on the other hand, Allain et al. (2010) compare FR donors
with first-time voluntary donors in West Africa and find their blood quality to be similar.
From a policy maker’s point of view, it is essential to understand the tradeoff between these
downside risks and the positive benefits arising from the shortage message and the FR program in
both the short run and long run, before deciding when to pursue which method to alleviate
shortage. To answer this question, we employ a unique large dataset consisting of 447,357
individual donation records across 8 years.
Our data come from a large blood bank located in a major city in southeast China with a
population of over 8 million as of 2012. Since 2010, the city has faced an increasingly severe
blood shortage, partly due to increased demand. The bank has used both the mobile message and
the FR program to address the blood shortage.
For both methods, it is not easy to quantify the tradeoffs facing the blood bank because
individual motives are often unobservable. Fortunately, our data contain over 330,000 individual
donors and their donation history from 2005 to 2013, which allows us to find control individuals
that are closely matched with individuals who either received the shortage message or donated via
FR. As detailed below, the effect of the shortage message is cleanly identified because sometimes
4 See Andreoni (1988) and Fischbacher et al. (2001) for theoretical models on conditional cooperation and
reciprocity. See Fischbacher et al. (2001), Potters, Sefton and Vesterlund (2005), Frey and Meier (2004) for lab
evidence, and Shang and Croson (2008, 2009), Martin and Randal (2008), Allcott (2011), and Shang and
Cronson (2008) for evidence from field experiments.

4
the blood supply is short for only certain blood type(s), which gives us exogeneity in terms of
who received a shortage message specific to the blood type in short supply. The variation in FR
and non-FR donation is less clean, because individuals may self-select into FR donation through
unobserved process. We articulate the implication of such selection and find a way to separate the
causal effect of the FR program from potential selection.
Comparing treated and control individuals, we find that a shortage message leads to more
donations among existing donors within the first six months but no significant effect afterwards.
This effect is stronger for donors who donated more times before receiving the shortage message,
suggesting a greater warm glow effect for donors who are more pro-social. In comparison, FR
donation has a small long-run positive effect in encouraging existing donors (who donated before
the FR) to donate more blood voluntarily after their FR donation, but discourages no-history
donors (whose first donation is FR) from donating in the long run. This is consistent with findings
on the effect of shortage message and suggests that the warm glow dominates the crowd-out and
distrust effects for donors who are more pro-social5, while crowd-out and distrust effects are more
prevalent for donors who are less pro-social. In addition, we do not find evidence that FR
programs lead to worse blood quality. Overall, the increase in blood supply from both shortage
messages and FR is large and comparable to the effect of high-stake economic incentives reported
in recent literature (Lactera et al. 2014, Iajya et al. 2013, Goette and Stutzer 2008).
Because neither treatment worsens blood quality, the efficiency comparison between the
two methods is largely dependent on level of control, targeted audience, cost of implementation,
and the effects of treatment in the short and long runs. Back-of-envelope calculation suggests that
the shortage message can be used in places where the donor population is large and the shortage
is less severe and type-specific, while FR could be more useful in generating a significant blood
supply in the short run when the donor population is small and the shortage is severe and general.
However, in the long run, the distrust or crowd-out effects of FR may exacerbate the shortage
problem, especially in a society with a low donation rate (which may be the reason for a severe
shortage to begin with).
Our findings contribute to the existing literature in three ways. First, previous studies
have examined the effect of altruism, social image, social pressure, empathy and other non-price
methods on donation (Andreoni and Rao 2011, DellaVigna et al. 2012, Edwards and List 2014,
Lacetera and Macis 2010, Stutzer and Goette 2012), but those methods did not target shortage
specifically. We extend this literature stream and examine whether (and, if so, how) informing
5 By pro-social, we mean that either the donor is more altruistic or she derives more private benefits from
donation in terms of warm glow, social image, etc.

5
donors about shortage can help to induce more donations and alleviate shortage. Compared with
mobile messages sent by the same bank that do not mention a “shortage” (as documented by Sun
et al. 2015 in a field experiment), the “shortage-based” message studied in this paper is five times
more effective in terms of response rate. In addition, we are among the first social scientists to
study the FR program, which is based on shortage by definition.6 Second, while most studies have
focused on driving donations from existing donors (Lacetera et al. 2014), our study shows that an
FR program can be effective in reaching and recruiting new donors at a relatively low cost. Since
most such donors may otherwise never donate, their contribution represents a net increase in the
blood supply. Third, most studies of blood donation have focused on the short-run effect. The
only exceptions we are aware of are Lacetera et al. (2012, 2014), who found no significant long-
run effect of economic incentives. Our study, which uses a unique panel dataset across 8 years, is
among the first to identify a significant long-run impact of non-price interventions in blood
donation7. More interestingly, we find that the long-run effect differs across the two shortage-
based methods and varies from existing to new donors. The contrast between short-run and long-
run effects is important for market designers to evaluate non-price interventions.
2. Potential Effects and Econometric Identification
While the shortage message and the FR program are two commonly used methods to
alleviate blood shortage, they may vary by targeted audience. In principle, both the shortage
message and the FR program can be applied to existing donors and those that have never donated
before the invention time (referred to as no-history donors). In practice, blood banks, including
the one in our study, often target messages toward existing donors (see the discussion of such
practice in previous studies, Lacetera et al. 2014), and implement FR programs quietly for both
existing and no-history donors conditional on their families or friends needing blood in a hospital
and there being a blood shortage at the time.
2.1 Effects of shortage message
For existing donors, the shortage message can have a mixed effect on willingness to donate.
On the positive side, shortage implies that the donated blood can be used immediately on
someone that needs blood, which increases the donor’s perceived benefits from unpaid voluntary
6 Iajya et al. (2013) assessed the impact of information, social prestige and financial rewards on voluntary blood
donations in Argentina, where 88% of blood donations are emergency/replacement donations. However, their
study does not examine the effect of replacement donation on future voluntary donation. 7 Some interventions are found to have long run impact in other contexts. For example, Charness and Gneezy
(2009) found that temporary incentives can affect longer term behavior in physical exercise.

6
donation. The perceived benefits – which we refer to as the warm glow – may come from pure
altruism or a warm feeling of doing good for people in need, both of which may be more salient
in the case of a type-specific shortage. Note that the extra ‘warm glow’ from donating in response
to a shortage message is tied to that specific shortage and therefore is likely to be a short-run
effect. The warm glow effect of the shortage message may also differ by donor type, which could
be characterized by the number of voluntary donations a donor made before the intervention time
(N). Let us call donors with N>1 frequent donors and donors with N=1 infrequent donors. If
frequent donors donate more frequently because they derive more of a warm glow from voluntary
donation, the shortage message may generate more of a warm glow for them than for infrequent
donors.
On the negative side, shortage may change an existing donor’s belief regarding how the
rest of the community contributes to the public good. If the donor believes that shortage occurs
because the rest of the community contributes too little, she may become less motivated for future
donation (Frey and Meier 2004). This negative effect on conditional cooperation – referred to as
distrust – can occur in both the short and long runs. There could also be a crowd-out effect: if a
donor has planned to donate 10 months later but decides to donate early in response to the
shortage message, the message may simply substitute a future donation for a current donation.
Above all, if the data offer an exogenous variation in shortage message, and we can find
control donor(s) for every treated donor that receives this exogenous message, the sign of the
aggregate effect should be informative as to the competition between the above mentioned
effects. In particular, the effect will be positive in the short run and zero afterwards if the warm
glow dominates over distrust and there is no crowd-out. If distrust is the main effect, the
aggregate effect should be negative in both the short and long runs. If crowd-out exists (in
combination with the warm glow in the short run), we expect the aggregate effect to be positive in
the short run and negative in the long run.
The econometric model is straightforward. We first match a treated individual with
individual(s) that have the same demographics and donation history as but do not receive the
message, calling the pair group . As detailed below, because the studied shortage messages are
specific to certain blood types (A and B), we limit control individuals to other blood types (O and
AB). To the extent that type-specific shortage is exogenous and people of different blood types
are comparable conditional on the same demographics and donation history, we have a clean
comparison within each treated-control pair. We then run a typical difference-in-differences
regression, where denotes whether donates voluntarily at time , is a dummy for the

7
treated individuals, and is a set of dummies equal to one if is in a specific half year at or
after the time of the message:
One caveat of the above identification strategy is that we compare the effect of receiving a
shortage message and the effect of receiving no message. Strictly speaking, receiving a shortage
message entails two treatments: one is receiving a message that simply asks for voluntary
donation, and we refer to this as an “ask” treatment; the other is acquiring information about
ongoing blood shortage (specific to a blood type), and we refer to this as a “shortage” treatment.
The identified coefficient of captures both treatments. If the bank’s goal is to compare the
mobile message and the FR program, it does not need to distinguish between the two treatment
effects of the shortage message. However, for research purposes, distinguishing the two treatment
effects will highlight the extra effect of emphasizing “shortage” on top of the simple effect of
“ask.”
As documented in Sun et al. (2015), the same blood bank conducted a randomized field
experiment in 2014, in which the baseline treatment was sending a mobile message that asked for
voluntary donation without any mention of a shortage. Compared to the control group of no
message at all, this treatment generated a positive 0.27% effect on the probability of donation. To
the extent that this treatment effect captures the pure effect of “ask” and is comparable to the “ask
effect” of the shortage message studied here, the effect of the “shortage” treatment was -
0.27%.
2.2 Effects of FR
FR is more complicated than a shortage message. In addition to conveying shortage, a record
of FR donation implies another two pieces of information. First, the donor knows that her FR
donation benefits a family or friend rather than an unknown stranger. As suggested in previous
literature, individuals are typically more altruistic towards family and friends or derive greater
warm feelings from social ties (Fong and Luttmer 2009, List and Price 2009, Leider et.al. 2009).
By donating to one’s own friend or family member, the FR donor has an opportunity to closely
observe the benefit of donation for the blood recipient both before and after transfusion. Hence,
the warm glow effect of FR can be greater and more long lasting than that of a shortage message
alone. However, the same reason could generate a crowd-out effect in the future. If one knows
that she can dedicate her blood to family and friends when they need it, she may have an

8
incentive to save the blood for her own social circle in the future instead of donating it to the
general public. In this sense, the FR program may introduce the danger of reducing the pool of
risk sharing and undermining the efficiency of risk pooling.
The second piece of information conveyed by an FR donation record is selection. In
principle, the treatment we are interested in is being asked to make an FR donation for a specific
patient8. However, because FR donation will not occur unless the FR donor has agreed to donate
upon request, FR donation is subject to unobserved selection. The magnitude of selection is
crucial for the overall evaluation of an FR program. At one extreme, if FR donors are so pro-
social that they would have donated voluntarily to the blood bank even if they had not received
the FR request, the FR program does not increase the blood supply at all. At the other extreme, if
all FR donors are those that will not donate to the blood bank but will donate for their own family
and friends, these FR donations will sustain the demand from their family and friends and free up
same amount of blood for the rest of the community.
The econometric challenge is how to distinguish the selection effect from the warm glow,
distrust, and crowd-out effects.
For an FR donor that has donated via FR at time t (denoted as ), let us assume she
carried demographics Xi and a donation history (Hi) before t. There are Mi number of FR donors
that have exactly the same In our donation records, we find Ni individuals that had
the same Xi and Hi before t but did not donate FR. Among these Mi+Ni individuals, had the FR
not existed, a fraction (i) would have donated voluntarily at t, while the rest (1- i) would not
have donated at t. The first type (referred to as V type) might be more pro-social than the second
(referred to as N type). These two types of donors, if unaware of FR, will donate in the future
with probabilities and respectively. For simplicity, let denote :
Suppose the risk of having a family or friend in need of blood ( is the same for everyone, but
the likelihood of agreeing to donate FR is V for V type and N for N type. Thus, by selection, the
ratio of FR donors that have the same by t is
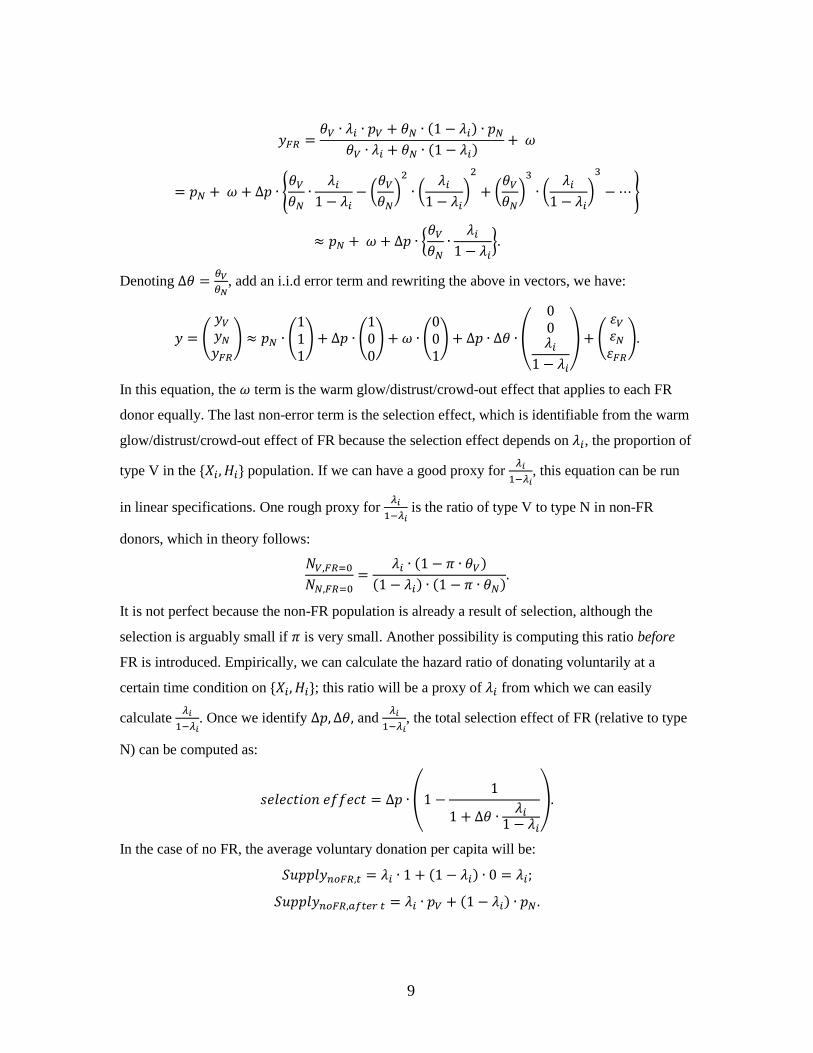
Conditional on being an FR donor, the probability of donating in the future is the sum of the
selection effect and a combination of warm glow, distrust and crowd-out effects ( ):
8 Because the blood bank runs the FR program quietly, we assume that potential donors are not aware of the
program until being asked to donate under the program.
9
Denoting
, add an i.i.d error term and rewriting the above in vectors, we have:
In this equation, the term is the warm glow/distrust/crowd-out effect that applies to each FR
donor equally. The last non-error term is the selection effect, which is identifiable from the warm
glow/distrust/crowd-out effect of FR because the selection effect depends on , the proportion of
type V in the population. If we can have a good proxy for
, this equation can be run
in linear specifications. One rough proxy for
is the ratio of type V to type N in non-FR
donors, which in theory follows:
It is not perfect because the non-FR population is already a result of selection, although the
selection is arguably small if is very small. Another possibility is computing this ratio before
FR is introduced. Empirically, we can calculate the hazard ratio of donating voluntarily at a
certain time condition on ; this ratio will be a proxy of from which we can easily
calculate
. Once we identify and
, the total selection effect of FR (relative to type
N) can be computed as:
In the case of no FR, the average voluntary donation per capita will be:

10
By definition, type V will donate voluntarily at t for sure and type N will not donate voluntarily at
t. This explains why is just the proportion of type V, which is
If FR is introduced for all donors with at t conditional on their family or friends
being in need of blood (the probability of this event is ), the average supply per capita at t and
after t will be:
Because type V will denote voluntarily without FR anyway, we will assume type V will always
donate upon an FR request, i.e. =1. Under this assumption, the extra supply due to FR can be
written as:
In words, the ability of FR to increase blood supply at t depends on the extent to which FR can hit
on type N donors and the rate of converting this hit into donations. After the FR donation, the
extra supply due to FR is solely dependent on the warm glow/distrust/crowd-out effect ( )
because selection alone changes no behavior. This effect applies to all FR donors, including the
type V donors that would have donated voluntarily had there been no FR.
In sum, if we compare just the future donation behavior of an FR donor and the donation
behavior of seemingly identical donors that do not donate FR at t, the empirical effect will
capture both the true warm glow/distrust/crowd-out effect ( ) and a selection effect. It is
important to distinguish the two, as only the former term ( ) reflects the causal effect of FR on
blood supply at time t, while the latter reveals the portion of blood supply from no-history donors,
most of whom would not donate otherwise.
The sign of the warm glow/distrust/crowd-out effect ( ) can tell us whether the positive
warm glow effect dominates the negative distrust and crowd-out effect. It is helpful to know
whether persists in the long run, as it may indicate whether such a non-price method can
increase blood supply in a sustainable way in the long run. Equally important, we are interested in
the magnitude of the selection effect, as it may suggest how many new donors the FR program
can reach. Most of these new donors would not donate voluntarily and thus are essentially free
riders.
11
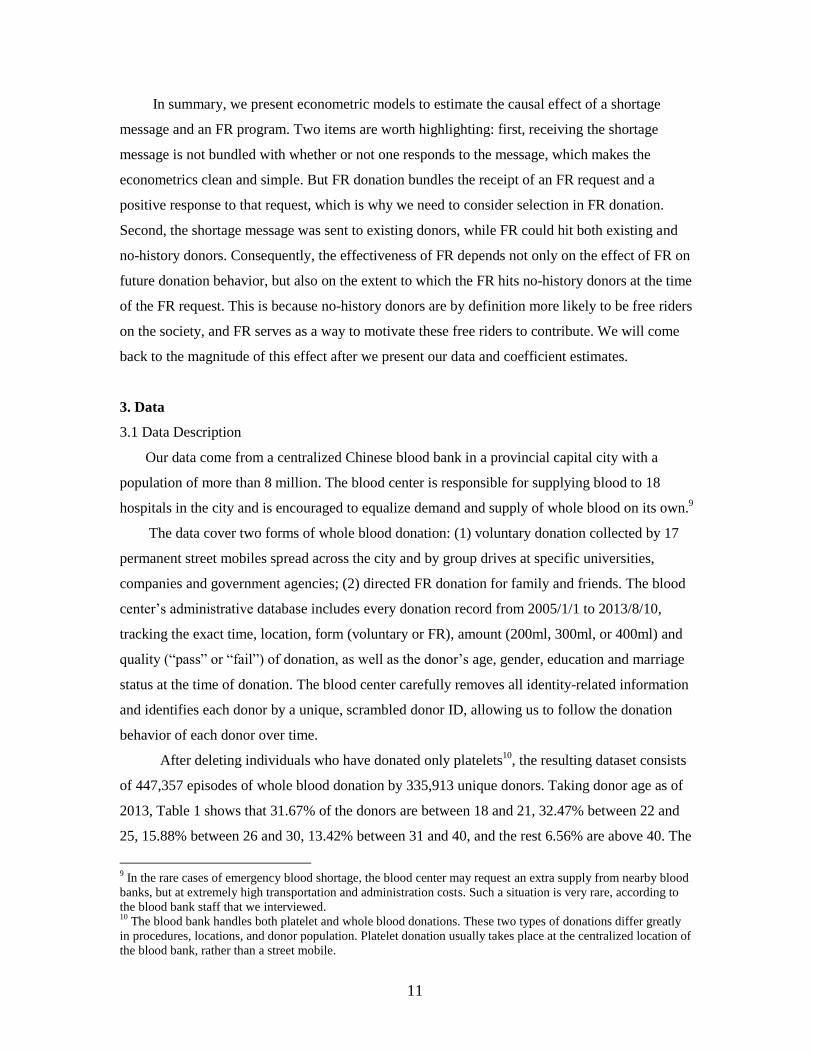
In summary, we present econometric models to estimate the causal effect of a shortage
message and an FR program. Two items are worth highlighting: first, receiving the shortage
message is not bundled with whether or not one responds to the message, which makes the
econometrics clean and simple. But FR donation bundles the receipt of an FR request and a
positive response to that request, which is why we need to consider selection in FR donation.
Second, the shortage message was sent to existing donors, while FR could hit both existing and
no-history donors. Consequently, the effectiveness of FR depends not only on the effect of FR on
future donation behavior, but also on the extent to which the FR hits no-history donors at the time
of the FR request. This is because no-history donors are by definition more likely to be free riders
on the society, and FR serves as a way to motivate these free riders to contribute. We will come
back to the magnitude of this effect after we present our data and coefficient estimates.
3. Data
3.1 Data Description
Our data come from a centralized Chinese blood bank in a provincial capital city with a
population of more than 8 million. The blood center is responsible for supplying blood to 18
hospitals in the city and is encouraged to equalize demand and supply of whole blood on its own.9
The data cover two forms of whole blood donation: (1) voluntary donation collected by 17
permanent street mobiles spread across the city and by group drives at specific universities,
companies and government agencies; (2) directed FR donation for family and friends. The blood
center’s administrative database includes every donation record from 2005/1/1 to 2013/8/10,
tracking the exact time, location, form (voluntary or FR), amount (200ml, 300ml, or 400ml) and
quality (“pass” or “fail”) of donation, as well as the donor’s age, gender, education and marriage
status at the time of donation. The blood center carefully removes all identity-related information
and identifies each donor by a unique, scrambled donor ID, allowing us to follow the donation
behavior of each donor over time.
After deleting individuals who have donated only platelets10
, the resulting dataset consists
of 447,357 episodes of whole blood donation by 335,913 unique donors. Taking donor age as of
2013, Table 1 shows that 31.67% of the donors are between 18 and 21, 32.47% between 22 and
25, 15.88% between 26 and 30, 13.42% between 31 and 40, and the rest 6.56% are above 40. The
9 In the rare cases of emergency blood shortage, the blood center may request an extra supply from nearby blood
banks, but at extremely high transportation and administration costs. Such a situation is very rare, according to
the blood bank staff that we interviewed. 10
The blood bank handles both platelet and whole blood donations. These two types of donations differ greatly
in procedures, locations, and donor population. Platelet donation usually takes place at the centralized location of
the blood bank, rather than a street mobile.

12
majority of the donors (60.85%) are male. As for other demographics, 80.22% do not have
college degree, 68.33% are single, 19.35% have a residential permit (hukou) from the city,
37.54% have hukou from elsewhere in the same province, 29.69% have hukou from other
provinces, and the remaining 13.41% have unknown hukou status. The dispersed distribution of
hukou status is driven by the fact that this is a capital city of a province with a dense population,
and one is allowed to study, work, and carry out military duty in the city even if his/her hukou is
from elsewhere.
Table 2 summarizes the data by donation episodes instead of donor identity. Of the total
447,357 donation episodes, 57.48% are voluntary donations at street mobiles, 38.38% are
voluntary donations at group drives, and the remaining 4.14% are FR donations. Figure 2 shows
the variation over time between voluntary and FR donations. Perceived as the last resort, FR
donation was not used until the second quarter of 2010, when increasing medical demand and a
few idiosyncratic shocks lead to a blood shortage. In comparison, mobile message calling for
existing donors to donate whole blood at a time of shortage has been used throughout our data
period, dating back to as early as September 3, 2010. There are two blood type-specific shortage
messages for whole blood: one was specific to type B (2012/10/8), one was specific for blood
types A and B (2010/9/3). The two messages specific to blood type(s) allows us to construct
control individuals who were omitted from some messages but have the same demographics as
those receiving these messages.
The bottom of Table 2 shows the distribution of donation amount and blood quality:
donation amount is dispersedly distributed between 200 and 400ml, with greater density for 301-
400ml (42.70%) and 201-300ml (33.57%) than at or below 200ml (23.73%). Blood quality is
generally good: 95.69% passed a battery of blood tests for HIV, hepatitis, syphilis, and other
diseases.
The rest of Table 1 and Table 2 summarizes the data according to whether a donor
received any treatment message and whether a donor made any FR donation. By headcount,
10,960 donors received at least one of the two shortage messages specific to blood type and never
donated FR throughout. Compared to the full sample of donors, they are slightly more likely to be
young, female, single, local and without a college degree. By definition, shortage messages were
only sent to existing donors. Among the 10,960 message recipients during the sample period,
7,457 have donated once before getting the message, 1,887 have donated twice, and 1,616 have
donated three or more times donated three or more times.
Turning to the 18,324 donors that had ever made FR donation, the majority of them
(17,276) never donated anything before their FR donation. We refer to them as no-history FR

13
donors. The rest of the FR donors (1,048) are all existing donors, among whom 654 donated once
before making the FR donation, 200 donated twice, and 194 donated three or more times.
Compared to all donors or those receiving the shortage message, FR donors, especially the no-
history FR donors, are older and more likely to be local and married. This suggests that FR
attracts very different types of populations compared to the shortage message or voluntary
donation in general.
Consistent with the literature (Goette and Stuzer 2008, Lacetera et al. 2012), we did not
find negative evidence on blood safety. The blood quality is comparable between FR and
voluntary donors (96.08% vs 95.67%), although the quality of no-history FR donations (95.74%)
is slightly lower than that of existing FR donations (97.97%). Those who received a shortage
message also donate blood of similar quality (97.68%), compared to other donors. Both FR
donors and the treatment message recipients donate a greater amount per episode than the rest of
the sample, probably because they know some of their donations target an immediate shortage.
We do not often observe the same individual receiving two treatment messages (501), making
more than one FR donation (87), or receiving any of the two treatment messages and donating FR
anytime throughout the sample (89). We delete these donors from analysis.
3.2 Matching
3.2.1 Matching for message recipients
Donor motives are hard to observe. A large part of unobserved donation motives may be
captured by donation history, in additional to age, gender, or other observable attributes. Thus, we
match treated and control individuals by both demographics and donation history. By donation
history, we mean the timing and channel of past donations, where timing is defined by a calendar
half year, and donation channel is defined by whether a voluntary donation took place at a street
mobile (so-called individual donation) or at a dedicated blood drive at the donor’s work place (so-
called group drive).
For a shortage message, we define treated and control individuals as follows. The two
shortage messages we focus on are specific to types A and B (2010/9) and type B (2012/10),
hence we define the treated as those that received one of the messages. We exclude those
receiving both messages from the analysis, to ensure that we identify the effect of receiving one
message. For clean comparison, we search for controls only in the pool of donors whose blood
type is either AB or O. To avoid any cross effect between shortage message and FR donation,
both treated and controls are conditional on not making any FR donation throughout our sample
period. We treat the recipient of the two treatment messages as exogenous conditional on

14
observables, because the blood bank uses an automated marketing software to choose message
recipients and the software only allows selection on a few observable variables including blood
type, total number of past donations, the timing of last donation, and previous test result.
More specifically, to search for all controls that have the same demographics and
donation history as a treated donor, we perform the matching algorithm in two steps. First, for
individual in a calendar half year , we define a variable equal to 1 if he/she made an
individual donation at , 2 if he/she made a group donation, and 0 if he/she did not donate. Then
for an individual in the pool of potential controls, we define the Euclidean distance between i
and as
where is the start of our sample period and r is the half year in which the treated individual
received a treatment message. To be conservative, we focus on the pool of controls with zero
distance to the treated ( ). In the second step, among those with zero distance, we search
for donors that share the same gender, age (18-21, 22-25, 26-30, 31-40, and 40+), education
(bachelor degree or not), marital status (married or not) and hukou location (in the city, elsewhere
in the same province, other province, or unknown) with the treated donor.
For the second treatment message (specific to type B), it is possible that a treated donor
received other non-blood-type-specific shortage message(s) in January 2010 before this
treatment. Therefore, for donors subject to this treatment, we also match the controls by whether
they received the same non-treatment shortage message(s) in January 2010. It turns out that any
treated donors that also received non-treatment message(s) in January 2010 cannot find a zero-
distance match at all, which implies that they are excluded from the message-analysis sample.
The first two rows of Table 3 summarize the count of treated and control donors for the
two message treatments. Specifically, 3,102 donors received the message specific to blood types
A and B, and we can find at least one zero-distance controls for 1,749 of them. Another 7,858
donors received the B-specific message, of which 6,291 have zero-distance controls. On average,
each treated donor receiving a shortage message has 4 to 5 control donors.
3.2.2 Matching for FR donors
A similar matching algorithm applies to the FR treatment. Any individual that made one
FR donation throughout our sample period is defined as a treated donor. Those who donated FR
more than once, or donated FR once and received any of the two shortage messages are excluded
from the analysis. A treated donor may be an existing FR donor or a no-history FR donor.
15
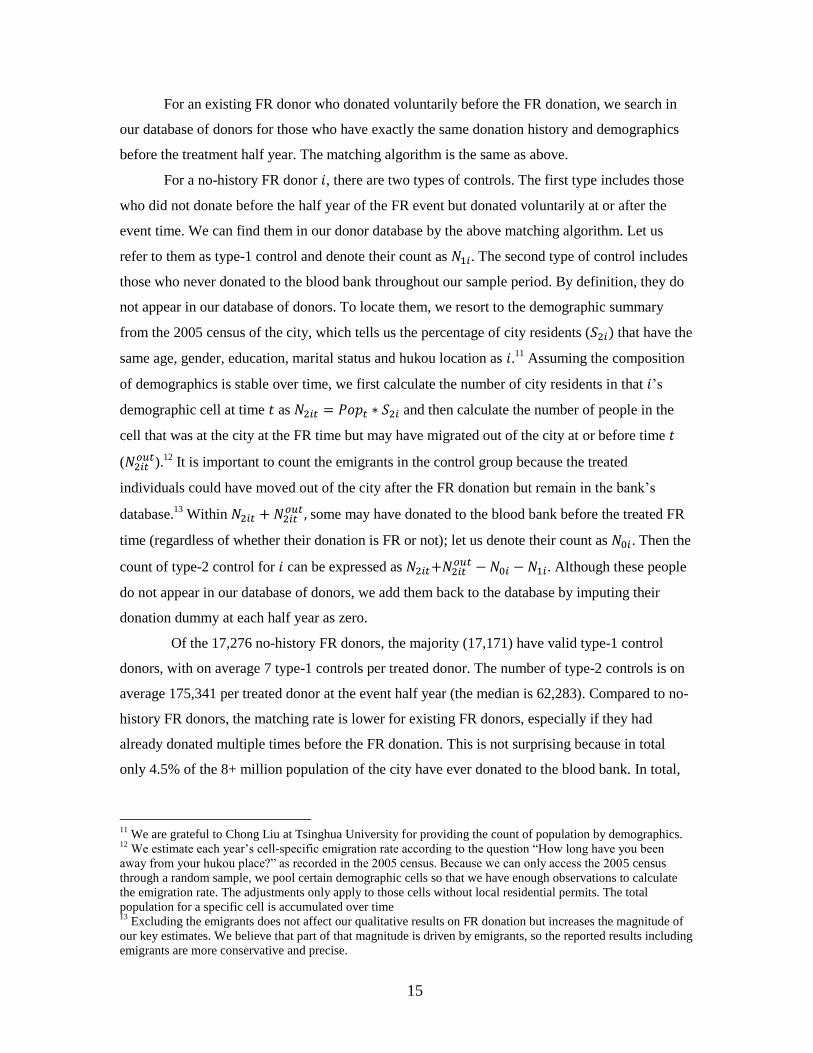
For an existing FR donor who donated voluntarily before the FR donation, we search in
our database of donors for those who have exactly the same donation history and demographics
before the treatment half year. The matching algorithm is the same as above.
For a no-history FR donor , there are two types of controls. The first type includes those
who did not donate before the half year of the FR event but donated voluntarily at or after the
event time. We can find them in our donor database by the above matching algorithm. Let us
refer to them as type-1 control and denote their count as . The second type of control includes
those who never donated to the blood bank throughout our sample period. By definition, they do
not appear in our database of donors. To locate them, we resort to the demographic summary
from the 2005 census of the city, which tells us the percentage of city residents ( that have the
same age, gender, education, marital status and hukou location as .11 Assuming the composition
of demographics is stable over time, we first calculate the number of city residents in that ’s
demographic cell at time as and then calculate the number of people in the
cell that was at the city at the FR time but may have migrated out of the city at or before time
( ).
12 It is important to count the emigrants in the control group because the treated
individuals could have moved out of the city after the FR donation but remain in the bank’s
database.13
Within some may have donated to the blood bank before the treated FR
time (regardless of whether their donation is FR or not); let us denote their count as . Then the
count of type-2 control for can be expressed as . Although these people
do not appear in our database of donors, we add them back to the database by imputing their
donation dummy at each half year as zero.
Of the 17,276 no-history FR donors, the majority (17,171) have valid type-1 control
donors, with on average 7 type-1 controls per treated donor. The number of type-2 controls is on
average 175,341 per treated donor at the event half year (the median is 62,283). Compared to no-
history FR donors, the matching rate is lower for existing FR donors, especially if they had
already donated multiple times before the FR donation. This is not surprising because in total
only 4.5% of the 8+ million population of the city have ever donated to the blood bank. In total,
11
We are grateful to Chong Liu at Tsinghua University for providing the count of population by demographics. 12
We estimate each year’s cell-specific emigration rate according to the question “How long have you been
away from your hukou place?” as recorded in the 2005 census. Because we can only access the 2005 census
through a random sample, we pool certain demographic cells so that we have enough observations to calculate
the emigration rate. The adjustments only apply to those cells without local residential permits. The total
population for a specific cell is accumulated over time 13
Excluding the emigrants does not affect our qualitative results on FR donation but increases the magnitude of
our key estimates. We believe that part of that magnitude is driven by emigrants, so the reported results including
emigrants are more conservative and precise.

16
out of 1,048 existing FR donors, we are able to find controls for 827 of them, with an average of
102 controls per treated donor.
In terms of demographics, no-history FR donors are different from both message
recipients and existing FR donors. In particular, no-history FR donors are more likely to be
middle-aged, married, and male. People with different donation history before the message or FR
treatment are also different in demographics: typically, those who had a longer donation history
before treatment are younger and more likely male, college-educated and with hukou within the
same province. Given these differences in observable demographics, we believe donors with
different donation history may differ in unobservable attributes as well, some of which (e.g. the
warm feeling from donation) could trigger different responses to our message or FR treatment.
4. Estimation Results
In this section, we present the regression results regarding the effects of the two treatments.
The first two subsections focus on donation rate and donation amount in response to shortage
message and FR donations separately. Given the WHO concerns about blood quality, results
related to blood quality are presented at the end of this section.
4.1 Effects of shortage messages on donation rate and donation amount
Figure 3 contrasts the donation rate of message recipients and their controls, by every half
calendar year. Time 0 is defined as the half year in which the message was sent. Because different
message recipients may end up having a different number of controls in our analysis sample, we
weight each control equally within each treatment-control pair and ensure that the total weight is
one for the controls as a whole (as opposed to one for the treated donor). By definition, treated
and control donors follow an identical path of donation before time 0, which declines before time
0 partly because of natural attrition (e.g. some donors may have left the city permanently), partly
because one is not eligible to donate until the last donation time is at least six months ago. At time
0, treated donors have a slightly higher donation rate than the controls but the two become
identical since time 1. This suggests that some treated donors responded to the shortage message
almost immediately, and this positive effect exists only in the short run (dropping to zero soon
after receiving the message).
Table 4 presents the same finding in a regression form. Starting with our matched sample
of treated and controls, we collapse the controls of each donor into one observation every half-
year so that the final regression sample is grouped by one treated and one (average) control per

17
pair per half-year.14
The unit of observation is donor by half-year, the dependent variables are the
dummy of donating or not in Columns 1-3 and the amount of donation (zero if not donate) in
Columns 4-6. Both regressions are OLS with donor fixed effects and half-year fixed effects.
Throughout the whole matched sample, shortage message motivates a 1.8 percentage point
increase in donation rate at t=0 and nothing afterwards. This amounts to 5.9ml more blood per
treated donor at t=0 and insignificant change of donation rate at t>0.
The effect of a shortage message can represent a combination of ‘ask’ effect ( including
social pressure and emphathy, see DellaVigna et al. 2012 and Andreoni and Rao 2011) and a
shortage-induced warm glow. However, we believe the positive increase is mostly explained by
shortage awareness for three reasons. First, as discussed in the literature (DellaVigna et al. 2012),
messages and mail solicitation are in general considered low-pressure approaches, compared to
high-pressure approaches such as door-to-door fundraising, phone calls, and charity banquets.
Second, previous studies have examined the effect of a mailed flyer with information only about
blood donation but find no significant increase in voluntary donation (Iajya et al. 2013). Third, in
a separate study, the same blood bank conducted a large randomized field experiment in 2014
involving 80,000 participants. One treatment in that experiment was sending existing donors a
simple reminder message that requests donation but does not mention a shortage. Compared to a
control group with no message, Sun, Gao and Jin (2015) find that sending out a simple reminder
message leads to only a 0.275 percentage point increase in donation rate. To the extent that the
effect of “asking” is comparable between that experiment and the shortage messages studied here,
the much larger effect we found in the shortage messages (1.8% versus 0.275%) is likely driven
by the emphasis on the shortage. This suggests that informing donors of a shortage is an
important tool to induce a warm glow and increase donations.
The rest of Table 4 shows the heterogeneous effect of shortage messages. If we split the
sample by whether the treated donor donated once (infrequent) or more than once (repeat) before
receiving a shortage message, the message has a much bigger effect on repeat donors (4.2%
increase in donation rate, roughly 15.64ml) than on infrequent donors (1.3%, 3.88ml). As
discussed in the literature (Lacetera et al. 2014), the fact that frequent donors donate more even
before the message suggests they might derive more of a warm glow from donation and/or face a
lower donation cost. Since shortage information does not change donation cost, one likely
explanation is that shortage generates more of a warm glow for frequent donors. Consistently,
because a shortage is specific to the message time, we find no long-run effect of the shortage
14
We take the average during the collapse operation. Results are identical if we weight individual controls rather
than collapse the controls. In particular, in that weighted regression, if a treated donor has M controls, each
control donor receives 1/M weight so that each treatment-control pair receives the same weight in the regression.

18
message either on repeat donors or infrequent donors. In other words, the shortage message does
not generate a long-lasting warm glow, nor does it crowd out donations in the future. In an
unreported table, we also rerun Table 4 for the two shortage messages separately. Both shortage
messages motivate an increase in donation rate at t=0 and nothing afterwards. The magnitude of
the increase in donation rate is 1.2% (p=0.156) for the first message and 1.9% (p<0.001) for the
second one. The estimates are similar in magnitude, but only statistically significant for the
second message, probably because that message involves many more treated donors in our after-
match sample (6,291 versus 1,749).
Finally, it is interesting to compare the effects of a shortage message with that of
economic incentives (Lacetera et al. 2014, Sun et al. 2015). The positive effect of a shortage
message at the aggregate level is sizable (1.8%), compared to the reported increase (0.8%) for a
$15 dollar gift in Lacetera et al. 2014. Consistent with the literature, we also find a larger increase
for individuals who donated more often; such a differential effect is expected since experienced
donors can gain more warm glow from donating at the time of shortage and may have lower cost
of time (Lacetera et al. 2014).
4.2 Effects of FR on donation rate and donation amount
As articulated in Section 2, it is more challenging to evaluate the causal effect of FR
donation on an FR donor’s future donation incentives and the blood bank’s total blood supply. In
particular, because FR donors might be a selected group, as discussed in section 2. Our model can
help tease out such a selection effect.
Figure 4 compares the donation rate of FR donors and their controls in the raw data. As in
Figure 3, controls are weighted so that we give the same weight to each treated donor and all of
his/her controls combined. Time zero denotes the time of each FR donation, and the unit of time
is defined as a half calendar year. At time zero, the FR donation rate is one by definition, but the
donation rate of the control donors is much lower. Given the demographic difference between no-
history and existing donors, we present Figure 4 for no-history and existing FR donors separately.
The donation rate of no-history donors jumps back to nearly zero right after the FR donation,
which is below the donation rate of their corresponding controls at t=1 but comparable to the
controls at t>=2. One possible explanation is that the experience of FR donation triggered distrust
or crowd-out effects among no-history FR donors.
The picture for the existing FR donors presents quite a contrast. By construction, these
FR donors and their controls have the same donation history before time 0. Both groups had a dip
at t=-1, because donors are not allowed to donate again until six months after the last donation. At

19
time 0, the FR donors donated 100% (by definition), while less than 10% of their controls
donated voluntarily. After time 0, the FR donors continue to have a slightly higher donate rate
than their controls, and this difference seems to persist from t=1 to t=5 (i.e. more than two years
and half). One potential explanation is selection: the existing donors that agree to donate FR may
donate anyway even without the FR program. If this is the case, FR donations from these donors
have little effect on the bank’s current and future blood supply. Another explanation is that the
warm glow generated by the FR experience dominates the potential negative effects (distrust and
crowd-out) in the long run, encouraging the existing FR donors to donate even more in the future.
This could have a beneficial effect on future blood supply, even if the FR donors are a selected
group.
Regression results are presented in Tables 5 and 6. Table 5 presents the differences-in-
differences results for no-history and existing FR donors separately, without controlling for
potential selection in the acceptance of FR request. Table 6 controls for selection. In all tables, we
use ordinary least square regressions and the dependent variable is whether a donor donates in a
particular half calendar year15
.
The first three columns of Table 5 focus on no-history FR donors. Recall that we have
two types of controls for them: type-1 control donors did not donate before t=0, but donated at or
after t=0; type-2 control donors are the part of the city population that have the same
demographics as a no-history FR donor but never donated whole blood throughout our data
period. To include both types of controls, we first collapse controls per treated donor into one
observation per half-year and then run the OLS regression with donor fixed effects and half-year
fixed effects. Column 1 shows that FR generated close to one donation at t=0 (0.729, driven by
definition of FR donors) and 0.055 fewer donations per half year after t=0. Column 2 further
breaks down the post-FR period into t=1, t=2 and t>=3. The negative effect at t=1 is bigger than
the other two periods (-8.8% versus -4.5% and -3.3%), which is understandable as there is a
natural attrition after a donation, and even regular donors may prefer to donate once a year rather
than twice a year. Translating the effect on donation rate into donation amount, Column 3 shows
that the FR treatment generates 245.6ml more blood supply per donor at t=0, and 17.8ml less per
donor per half-year after t=0.
The last three columns of Table 5 report the parallel regression results for existing FR
donors. Column 4 shows a large positive coefficient for existing FR donors at t=0 (0.958, driven
by definition). Contrary to the case for no-history FR donors, the coefficient for existing FR
15
We did not use a duration model for estimation because a duration model does not allow us to control for time-
invariant unobserved factors across donors. Moreover, it is sensitive to the choice of the distribution for a
survival model to fit.

20
donors after t=0 is positive (2.9%). Column 5 decomposes the post-event period into t=1, t=2 and
t>=3. It shows that the positive effect on FR donors is 2.1% at t=1, becomes stronger at t=2
(4.7%) and then comes back to 2.2% at t>=3. The stronger effect at t=2 than t=1 can be explained
by the fact that many repeat donors donate once a year and therefore there is a natural attrition
half a year after the last donation. The positive effect at t>=3 suggests a long-lasting effect of FR
encouraging existing FR donors to donate more in the future. The last column of Table 6 shows
that the positive effect of FR on existing FR donors creates 332.2ml blood supply per donor at
t=0 and 10.3ml extra blood supply per half-year per donor after t=0.
The positive long-run effect of FR on existing donors is an interesting contrast to the lack
of long-run effect from shortage messages. This is possible because giving blood to a close social
connection may create an extra warm glow (Fong and Luttmer 2009) and the close tie with the
patient during and after patient recovery could reinforce that warm glow in the long run. This
strong warm glow can also dominate distrust and crowd-out in the long run.
To distinguish selection from the true FR effect on future blood supply, Table 6 follows
the econometric structure presented in Section 2. The first two columns look at donation rate and
donation amount for no-history FR donors; the last two columns look at the same dependent
variables for existing FR donors. As we expect, there is a significant selection effect among
existing FR donors, while the selection effect for no-history FR donors is close to non-existent.
This is probably because we have more variations in the fraction of donors donating voluntarily at
time zero () among the controls of existing FR donors than among the controls of no-history FR
donors. In particular, the selection coefficient (
), which is defined as the ratio between
the likelihood of type V donors accepting the FR request versus the likelihood of type N
accepting, turns out to be 0.111/0.063=1.76 for existing FR donors, with a p-value between 5%
and 10%. If we assume (because type V donors are defined to be willing to donate at time
0 even without an FR request), this number implies that type N donors will donate with a
likelihood upon an FR request. We will use this number to conduct a back-of-
envelope calculation of the effect of FR on the total blood supply. In comparison, for no-history
FR donors, Table 6 shows a slightly negative but statistically zero difference in the voluntary
donation rate of type-V and type-N people ( ), which suggests little selection and makes it
meaningless to calculate from the estimates of and . In light of this, our back-of-
envelope calculation will assume different values of (hence different as we assume
) for robustness check.

21
After isolating the selection effect, the rest of Table 6 shows that the causal effect of FR
on future donation rate, or , is negative for no-history FR donors (-0.036) but positive for
existing FR donors (0.029), which translates into -11.53ml less per half-year per no-history FR
donor and 10.15ml more per half-year per existing FR donor. Our study is among the first to
identify a significant post-intervention effect for blood donation (Lactera et al. 2013). Very
interestingly, we find that there is a motivation loss for those donors who are less pro-social,
while there is an increase in voluntary donation for donors who are overall more pro-social.
4.3 Effect of shortage message and FR donation on blood quality
Defining a quality dummy equal to one if the donated blood passes the standard battery
of blood tests, Table 7 regresses this dummy on the treatment status by t=0 and t>0 separately for
each treatment group (message treatment, no-history FR donors, and existing FR donors). We
choose to run the regression for t=0 and t>0 separately because blood quality information is not
available until a blood donation exists; hence, any regression on blood quality must be
conditional on a subsample of donation dummy equal to one. This subsample may differ by time,
which makes the across-time comparison hard to interpret. In light of this, for each particular time
period (t=0 or t>0), the regression gives us a straightforward quality comparison between the
treated and control donors, conditional on both donating at the time. Again, we collapse the
controls so that each treated and control pair gets the same weight.
Results in Table 7 do not support the WHO’s concern about blood quality: for both
message recipients and FR donors, there is no significant quality difference between treated and
control donors at both t=0 and t>0.
5. Discussion and Future Research
In this paper we have shown that both a shortage message and an FR program can mitigate
blood shortages in the short run with little compromise of blood quality. However, these methods
target different audiences, have different effects in the long run, and affect different donors
differently.
From the blood bank’s point of view, what are the key tradeoffs between a shortage
message and an FR program? We identify four potential tradeoffs for consideration when
implementing non-price methods to address shortage. The first tradeoff lies in the extent of
control. A blood bank can fully control who receives a shortage message and how many receive
it, but the recruitment of FR donors is outsourced to patients. This implies that a shortage
message may be more effective if the bank is short of a specific type of blood and the bank has a

22
large pool of existing donors to choose from. That being said, a direct message allows less control
over timing, as the blood bank cannot force donors to donate at a specific time. In contrast, FR
may be more helpful in mitigating the shortage facing a particular patient at a particular time.
The second tradeoff between a shortage message and an FR program relates to their
targeted audiences. While a mobile message can easily reach existing donors, it is difficult to
reach those who have not donated to the bank already. In theory, the bank could announce a
blood shortage on TV, radio, newspaper, or the Internet, but such broadcasting is less targeted
and may be crowded out by other information, which introduces more uncertainty and is likely
less effective than sending mobile messages to individual donors. In comparison, an FR program
relies on individual patients to reach out to their own social connections, which could bring in a
large number of donors who may otherwise never donate voluntarily. These no-history
individuals may be more willing to donate to their friends or family than to a stranger. As shown
in our data, the FR approach indeed brings an additional source of blood supply, which could be
more effective in increasing a blood supply quickly when the population of voluntary donors is
small and decreasing.
The third tradeoff concerns the differential effects in the short run and long run. Similar
to economic incentives, a shortage message is highly effective in the short run but does not
increase donation in the long run. Interestingly, an FR program can increase the donation from
existing donors in the long run but at the same time lead to a small motivation loss for new
donors in the long term. Fortunately, such a decrease for new donors is very small and can be
well justified by the selection effect, i.e. additional (one-time) donation from those no-history
donors.
Finally, blood banks also need to compare the implementation costs of both programs. As
discussed before, FR shifts the burden of donor recruitment from the blood bank to individual
patients, which could cut the cost of recruitment by 75 to 87 percent. In contrast, sending a
shortage message has a small cost (about 1.2 US dollar/100 messages).
Table 8 summarizes these four tradeoffs in a back-of-envelope calculation. There are
three blocks here. The first block follows our data: consider a city with a population of 4 million,
of whom 4.5% are existing donors; each person faces the same chance of needing a blood
transfusion in a random half year. If we rely on voluntary donation without any intervention,
suppose there is a 1% shortage rate, where shortage rate is defined as the rate of needing blood
transfusion minus the rate of donation. If the bank sends out a shortage message to all existing
donors, our estimates suggest that the blood supply can be boosted by 3,240 extra donations
within six months of the message delivery but zero effect afterwards. In comparison, if the bank

23
requires half of the sick patients facing a shortage to find one FR donation by themselves, the FR
program will affect 19,100 individuals who have no donation history at the bank, and 900
individuals who have a donation history at the bank. For existing FR donors, our data suggest
If we are willing to assume , our estimates suggest For no-
history FR donors, there are almost no voluntary donors at the particular time of FR. So we
assume . Because our estimation does not yield a reasonable estimate for the of no-
hisotry FR donors, we assume they have the same as existing donors (56.76%) in Table 8.
Later we will try different for no-history FR donors.
Under these assumptions, the FR program at t=0 can generate 10841.2 FR donations
from no-history donors and 490.4 donations from existing donors. However, based on our
estimates of in Table 6, the no-history donors will reduce 390.3 donations per half-year after
FR and the existing FR donors will bring 15.3 more donations per half-year after FR. Summing
over the effect for five years (from t=0 to t=9), introducing FR to half of the patients is much
more effective in increasing blood supply than sending out a shortage messages to all existing
donors (7956.4 vs 3,240 donations). In other words, in order to generate the same effect on the
overall blood supply within the next five years, sending out shortage messages to all existing
donors is equivalent to introducing the FR to 20.36% of the sick patients facing a shortage. If the
goal is to generate the same blood supply in the short run (t=0 only), then sending out shortage
messages to all existing donors is equivalent to introducing the FR to 14.3% of the sick patients.
In the second block of Table 8, we change the percent of the donating population to 10%,
which reduces the gap between the two methods. If we increase it further to 15%, the shortage
message becomes more effective than the FR program in increasing blood supply over five years
(the third block of Table 8).
In Table 9, we redo the back-of-envelope calculation for the first block of Table 8 but
change the probability of a no-history potential donor taking up the FR request ( ) from 56.76%
to 100% and 30%. This parameter is important, because it determines the number of donations
one could expect from no-history FR donors at t=0. As expected, if every FR request presented to
a no-history potential donor can be turned into a FR donation ( =100%), FR is more effective
than a shortage message in generating a new blood supply for all three scenarios, no matter
whether the voluntary donation rate is as low as 4.5% or as high as 15%. In comparison, when
is only 30% (roughly 1 of 3 FR requests will be accepted by no-history FR donors), the
effectiveness of FR is reduced, and a shortage message can generate more blood supply when the
voluntary donation rate is 10% or 15%.

24
Overall, the back-of-envelope calculation suggests that a shortage message can be used in
places where the donor population is large and the shortage is small. In comparison, FR could be
more useful when the voluntary donation rate is low, the shortage is severe, and the FR-takeup
rate is relatively high among those who never donated before. In this sense, our data suggests a
more optimistic picture for FR than the WHO recommendation. However, in a society with a low
donation rate (which could be the reason for a severe shortage to begin with), most FR donors
will be no-history FR donors, and the FR treatment may discourage voluntary donation in the
long run by generating either distrust or crowd-out. Although a broader introduction of FR can
generate more blood supply in the short run, it may exacerbate a shortage problem in the long
run. Like the WHO, we reach a cautious conclusion about FR programs but for a reason other
than quality concerns.
Future research may take several different directions. First, the shortage messages
studied in this paper target donors that have donated before. Previous studies have found that an
emergency appeal (such as after a disaster) is also effective in driving new donors (Reich et al.
2006, Ryzhov et al. forthcoming). Future studies can extend our work to study the impact of a
shortage message on non-donors.
Second, we empirically show that shortage information can have a large and positive
effect on blood donation in the short run. This finding has immediate managerial implications for
blood banks that wish to alleviate shortages. However, theoretically we cannot differentiate the
importance of two potential mechanisms: pure altruism and the warm feeling of doing good for
others. Future studies can employ theory-driven lab experiments (Crumpler and Grossman 2008)
or field experiments (DellaVigna et al. 2012) to test the underlying mechanisms behind this
effect.
Similarly, we identify a significant long-run effect of FR on blood donation; such a
long-run effect differs for existing donors and new donors. We believe this interesting evidence
can be explained by FR generating a long-lasting warm glow for existing FR donors but distrust
or an incentive to save blood for friends and family among no-history FR donors. More studies
are needed to confirm this explanation.

25
References
Allain, J. P., Sarkodie, F., Asenso‐ Mensah, K., & Owusu‐ Ofori, S. (2010). Relative safety of
first‐ time volunteer and replacement donors in West Africa. Transfusion, 50(2), 340-343.
Messih, I. Y. A., Ismail, M. A., Saad, A. A., & Azer, M. R. (2014). The degree of safety of family
replacement donors versus voluntary non-remunerated donors in an Egyptian population: a
comparative study. Blood Transfusion, 12(2), 159.
Allcott, H. (2011). Social norms and energy conservation. Journal of Public Economics, 95(9),
1082-1095.
Andreoni, J. 1988. “Privately provided public goods in a large economy: the limits of altruism.”
Journal of Public Economics, 35(1), 57–73.
Andreoni, J., 1989. “Giving with Impure Altruism: Applications to Charity and Ricardian
Equivalence.” Journal of Political Economy 97 (6), 1447-1458.
Andreoni, J., 1990. “Impure Altruism and Donations to Public Goods: A Theory of Warm-Glow
Giving.” The Economic Journal 100 (401), 464-477.
Andreoni, J., & Rao, J. M. (2011). The power of asking: How communication affects selfishness,
empathy, and altruism. Journal of Public Economics, 95(7), 513-520.
Bates I.; Manyasi G.; Medina Lara A. “Reducing replacement donors in Sub-Saharan Africa:
challenges and affordability”, Transfusion Medicine. 2007 Dec. 17(6): 434-42.
Charness, G., & Gneezy, U. (2009). Incentives to exercise. Econometrica,77(3), 909-931.
Crumpler,H. and Grossman, P. J. (2008). “An experimental test of warm glow giving.” Journal of
Public Economics, 92, 1011–1021.
DellaVigna, S. List, J. A., & Malmendier, U. 2012. “Testing for altruism, and social pressure in
charitable giving.” Quarterly Journal of Economics, 127(1), 1–56.
Edwards, J. T., & List, J. A. (2014). Toward an understanding of why suggestions work in
charitable fundraising: Theory and evidence from a natural field experiment. Journal of
Public Economics, 114, 1-13.
Frey, B. S., & Meier, S. (2004). Social comparisons and pro-social behavior: Testing" conditional
cooperation" in a field experiment. American Economic Review, 1717-1722.
Fischbacher, U., Gächter, S., & Fehr, E. (2001). Are people conditionally cooperative? Evidence
from a public goods experiment. Economics Letters, 71(3), 397-404.
Fong, C. M., & Luttmer, E. F. (2009). What determines giving to Hurricane Katrina victims?
Experimental evidence on racial group loyalty. American Economic Journal: Applied
Economics, 1(2), 64.
Goette, L., Stutzer A. (2009) Blood donations and incentives: evidence from a field experiment.
IZA Working Paper No. 3580. Available at SSRN: http://ssrn.com/abstract=1158977
Goette, L., Stutzer, A., & Frey, B. M. (2010). Prosocial motivation and blood donations: a survey
of the empirical literature. Transfusion Medicine and Hemotherapy, 37(3), 149-154.
Kessler, J. B., & Roth, A. E. (2012). Organ Allocation Policy and the Decision to Donate. The
American Economic Review, 2018-2047.
Kessler, J. B., & Roth, A. E. (2014). Getting more organs for transplantation. The American
Economic Review, 104(5), 425-430.
Konow, J. (2010). Mixed feelings: Theories of and evidence on giving. Journal of Public
Economics, 94(3), 279-297.
Iajya, V., Lacetera, N., Macis, M., & Slonim, R. (2013). The effects of information, social and
financial incentives on voluntary undirected blood donations: Evidence from a field
experiment in Argentina. Social Science & Medicine, 98, 214-223.

26
Lacetera, N., & Macis, M. (2010). “Social image concerns and prosocial behavior: Field evidence
from a nonlinear incentive scheme.” Journal of Economic Behavior & Organization, 76(2),
225-237.
Lacetera, N., Macis, M., & Slonim, R. (2012). Will there be blood? Incentives and displacement
effects in pro-social behavior. American Economic Journal: Economic Policy, 186-223.
Lacetera, N., Macis, M., & Slonim, R. (2013). Economic rewards to motivate blood donations.
Science, 340(6135), 927-928.
Lacetera, N., Macis, M., & Slonim, R. (2014). Rewarding volunteers: a field experiment.
Management Science, 60(5), 1107-1129.
Leider, S., Möbius, M. M., Rosenblat, T., & Do, Q. A. (2009). Directed altruism and enforced
reciprocity in social networks. The Quarterly Journal of Economics, 124(4), 1815-1851.
Leider, S., & Roth, A. E. (2010). Kidneys for sale: Who disapproves, and why?. American
Journal of Transplantation, 10(5), 1221-1227.
List, J. A., & Price, M. K. (2009). The role of social connections in charitable fundraising:
Evidence from a natural field experiment. Journal of Economic Behavior & Organization,
69(2), 160-169.
Martin, R., & Randal, J. (2008). How is donation behaviour affected by the donations of others?.
Journal of Economic Behavior & Organization, 67(1), 228-238.
Potters, J., Sefton, M., & Vesterlund, L. (2005). After you—endogenous sequencing in voluntary
contribution games. Journal of public Economics, 89(8), 1399-1419.
Reich, P., Roberts, P., Laabs, N., Chinn, A., McEvoy, P., Hirschler, N., & Murphy, E. L. (2006).
A randomized trial of blood donor recruitment strategies. Transfusion, 46(7), 1090-1096.
Roth, A. E., Sönmez, T., & Ünver, M. U. (2004). Kidney Exchange. The Quarterly Journal of
Economics, 457-488.
Roth, A. E., Sönmez, T., & Ünver, M. U. (2005). A kidney exchange clearinghouse in New
England. American Economic Review, 376-380.
Roth, A. E. (2007). Repugnance as a Constraint on Markets. The Journal of Economic
Perspectives, 21(3), 37-58.
Ryzhov, I. O., Han, B., Bradic, J., & Bradic, A. forthcoming. Cultivating disaster donors: A case
application of scalable analytics on massive data. Management Science.
Shang, J. and Croson, R. (2008). “The impact of downward social information on contribution
decisions”, Experimental Economics, vol. 11(3), pp. 221–33.
Shang, J.,& Croson, R. (2009). “A field experiment in charitable contribution: The impact of
social information on the voluntary provision of public goods.” The Economic Journal,
119(540), 1422–1439.
Slonim, R., Wang, C., & Garbarino, E. (2014). The Market for Blood. The Journal of Economic
Perspectives, 177-196
Sun, T.; Gao, G., & Jin, G. Z. (2015): Motivating Group Donation: Evidence from a Large Field
Experiment, Working Paper.
Stutzer, A., Goette, L., & Zehnder, M. (2011). Active Decisions and Prosocial Behaviour: a Field
Experiment on Blood Donation. The Economic Journal, 121(556), F476-F493.
World Health Assembly (WHA 1975) 28.72 “Utilization and supply of human blood and blood
products” Twenty-Eighth World Health Assembly, Geneva 13-30 May 1975, Accessed at
http://www.who.int/bloodsafety/en/WHA28.72.pdf?ua=1on January 29, 2015.
World Health Organization (WHO 2014) “Blood Safety and Availability”, fact sheet #279,
updated June 2014, http://www.who.int/mediacentre/factsheets/fs279/en/.
World Health Organization (WHO 2009) “Global consultation: 100% voluntary non-remunerated
donation of blood and blood components”, Melbourne, 9-11 June 2009. Accessed at
http://www.who.int/bloodsafety/ReportGlobalConsultation2009onVNRBD.pdf?ua=1 on
January 29, 2015.

27
Figure 1: World map of donation rate
Figure 2:
Wenchuan Earthquake, 05/2008
Shortage on A & B, 09/2010
Shortage on B, 10/2012
0
5000
10000
15000
20000
Num
ber
of D
onations
2005Q1 2006Q1 2007Q1 2008Q1 2009Q1 2010Q1 2011Q1 2012Q1 2013Q1Quarter
Voluntary Donation Family Replacement
Trends in the Number of Blood Donations by Donation Type

28
Figure 3: Donation rate by treated and control donors, upon receiving a shortage message
(t=0 refers to the time of receiving a treatment message.)
Figure 4: Donation rate by treated and control donors, upon FR donation
(t=0 refers to the timing of making an FR donation.)
0.2
.4.6
.81
Donation R
ate
-6 -5 -4 -3 -2 -1 0 1 2 3 4 5 6Event Half Year
Treated Donors Control Donors
Donors who received messages on blood shortage0
.2.4
.6.8
1
Do
na
tio
n R
ate
-6 -5 -4 -3 -2 -1 0 1 2 3 4 5 6Event Half Year
Treated Donors Control Donors
Donors who voluntarily donated before being affected by family replacement
0.2
.4.6
.81
Do
na
tio
n R
ate
-6 -5 -4 -3 -2 -1 0 1 2 3 4 5 6Event Half Year
Treated Donors Control Donors
Donors whose first donation is affected by family replacement

29
Table 1: Headcount
Total Counts of Donors Received Messages Have ever donated FR
Count % in sample % in
population
Never affected
by FR
Have donated
before FR
Never donated
before FR
Count % in sample Count % in sample Count % in sample
Total 335,913 10,960 1,049 17,276
Not Married 106,300 31.67% 16.76% 3,976 36.28% 282 26.88% 2,863 16.57%
Married 229,533 68.33% 83.24% 6,984 63.72% 767 73.12% 14,413 83.43%
Male 204,406 60.85% 49.05% 6,293 57.42% 657 62.63% 11,640 67.38%
Female 131,507 39.15% 50.95% 4,667 42.58% 392 37.37% 5,636 32.62%
College Degree 66,443 19.78% 22.78% 1,392 12.75% 187 17.83% 1,979 11.46%
No College Degree 269,470 80.22% 77.22% 9,563 87.25%
862 82.17% 15,297 88.54%
Local Hukou 65,004 19.35% 78.66% 2,689 24.53% 428 40.80% 4,989 28.88%
Same-province Hukou 126,106 37.54% 13.46% 3,889 35.48%
338 32.22% 5,593 32.37%
Other-Province Hukou 99,747 29.69% 7.88% 4,252 38.80%
274 26.12% 4,090 23.67%
Unknown 45,056 13.41% 0.00% 130 1.19% 9 0.86% 2,604 15.07%
[18, 21] 106,380 31.67% 7.41% 3,976 36.28% 282 26.88% 2863 16.57%
[21, 25] 109,509 32.47% 8.73% 2,496 22.77% 259 24.69% 2,431 14.07%
(25, 30] 53,333 15.88% 10.01% 1,613 14.72% 190 18.11% 2,947 17.06%
(30, 40] 45,095 13.42% 24.99% 1,948 17.77% 192 17.80% 5,381 31.15%
Above 40 yrs 22,046 6.56% 48.86% 927 8.46% 126 11.70% 3,654 21.15%

30
Table 2: Summary of donation episodes
Total Counts
Have ever donated FR
Received Messages Have donated Never donate
Never affected by FR before FR before FR
Total 447,357 100(%) 20,548 100(%) 3,147 100(%) 17,642 100(%)
Blood donation type
Individual voluntary 257,150 57.48 18,742 91.21 1,699 53.99 317 1.80
Group voluntary 171,706 38.38 1,806 8.79 399 12.69 49 0.28
FR 18,501 4.14 0 0.00 1,049 33.33 17,276 97.93
Donation amount
<=200ml 106,159 23.73 1,634 7.95 389 12.36 3,010 17.06
>200ml and <=300ml 150,185 33.57 5,408 26.32 904 28.73 5,305 30.07
>300ml and <=400ml 191,013 42.70 13,506 65.73 1,854 58.91 9,327 52.87
Blood Quality
Passed quality test 428,075 95.69 20,072 97.68 3,082 97.97 16,890 95.74

31
Table 3: Summary of treated and control
Before
Matching After Matching
Treated Treated Control Married Male College Age Local
Same
Prov
Other
Prov
Shortage on A and B 3,102 1,749 8,474 0.56 0.55 0.15 25.33 0.24 0.38 0.36
Shortage on B 7,858 6,291 29,670 0.59 0.59 0.10 25.73 0.20 0.35 0.44
First Donation as FR 17,276 17,171 92,423 0.84 0.67 0.11 31.84 0.29 0.32 0.24
Second Donation as FR 654 654 82,770 0.70 0.63 0.19 26.90 0.39 0.32 0.27
Third Donation as FR 200 151 1,673 0.64 0.62 0.12 27.05 0.32 0.38 0.30
Fourth Donation as FR 97 21 41 0.59 0.66 0.12 28.17 0.22 0.56 0.22
4+ Donation as FR 97 1 1 0.00 1.00 0.00 19.00 0.00 0.00 1.00
Total of Ever Donated as FR 18,324 17,998 176,908 0.68 0.63 0.17 26.96 0.38 0.34 0.28
Note: * For those whose first donation is FR, the number of controls refer to type 1 control. The average type 2 control is 175,341 at the time of FR, the
median is 62283.

32
Table 4: Effects of shortage message on donation rate and donation amount
FR donors with prior donation history
Dependent Variable Donate=1 if a donor contributes his/her blood Donate Volume
Model OLS with raw data OLS with matching Duration model (0 if not donate)
(1) (3) (4) (2) (5)
Treated*Post (t=0) 0.828*** 0.958*** 0.958*** 332.226***
(0.008) (0.004) (0.004) (2.851)
Treated*Post (t>=1) -0.049*** 0.029*** 0.123 10.308***
(0.008) (0.005) (0.232) (1.953)
Treated*Post (t=1) 0.021**
(0.008)
Treated*Post (t=2) 0.047***
(0.010)
Treated*Post (t>=3) 0.022***
(0.006)
Donor Fixed Effects Y Y Y N Y
Half Year Dummies Y Y Y Y Y
Donor Random Effects N N N Y N
Donor Time-invariant Characteristics N N N Y N
Observations 3,343,461 16,484 16,484 1,654 16,484
R-squared 0.281 0.440 0.441 0.444
Note: Robust standard errors in parentheses, *** p<0.01, ** p<0.05, * p<0.1.

33
Table 5: Effects of FR donation on FR donors without control for selection
Dependent variable =1 if donate voluntarily in a half calendar year
All use ordinary least square regression
FP Donors without prior donation history FP donors with prior donation history
OLS with matching Donate Volume
(0 if not donate)
OLS with matching Donate Volume
Static Dynamic Static Dynamic (0 if not donate)
(1) (2) (3) (4) (5) (6)
Treated*Post (t=0) 0.729*** 0.730*** 245.562*** 0.958*** 0.958*** 332.226***
(0.003) (0.003) (1.292) (0.004) (0.004) (2.851)
Treated*Post (t>=1) -0.055*** -17.845*** 0.029*** 10.308***
(0.001) (0.320) (0.005) (1.953)
Treated*Post (t=1) -0.088*** 0.021**
(0.001)
(0.008)
Treated*Post (t=2) -0.045***
0.047***
(0.001)
(0.010)
Treated*Post (t>=3) -0.033***
0.022***
(0.001) (0.006)
Donor Fixed Effects Y Y Y Y Y Y
Half Year Dummies Y Y Y Y Y Y
Observations 309,078 309,078 309,078 16,484 16,484 16,484
R-squared 0.847 0.85 0.817 0.440 0.441 0.444
Note: Robust standard errors in parentheses, *** p<0.01, ** p<0.05, * p<0.1.

34
Table 6: Effect of FR, accounting for selection
FR Donors without prior donation history FR donors with prior donation history
Dependent Variable Donate or Not Donate Volume
(0 if not donate)
Donate or Not Donate Volume
(0 if not donate)
(1) (2) (3) (4)
PN 0.081*** 26.719*** 0.033** 11.476***
(0.002) (0.818) (0.014) (5.666)
∆P -0.00002 -0.006 0.063*** 22.693***
(0.00002) (0.006) (0.005) (2.145)
0.029*** 10.149***
(0.001) (0.307) (0.005) (1.889)
∆P*∆ 0.00007*** 0.021*** 0.111* 46.405*
(0.000005) (0.002) (0.060) (24.510)
∆ 1.769* 2.045*
(0.944) (1.049)
Group Fixed Effects Y Y Y Y
Half Year Dummies Y Y Y Y
Observations 158,635 158,637 6,826 6,826
R-squared 0.369 0.295 0.218 0.221
Note: Robust standard errors in parentheses, *** p<0.01, ** p<0.05, * p<0.1.

35
Table 7: Effect of shortage message and FR donation on blood quality
Dependent Variable Blood Quality (pass or not)
Donors who received messages
FR Donors
without prior donation history
FR donors
with prior donation history
(1) (2) (3) (4) (5) (6)
Treated*Post (t=0) -0.007 0.002 -0.005
(0.023) (0.002) (0.013)
Treated*Post (t>=1) -0.003 0.011 0.008
(0.009) (0.009) (0.005)
Donor Fixed Effects Y Y Y Y Y Y
Half Year Dummies Y Y Y Y Y Y
Observations 4,456 9,789 34,340 55,356 958 924
R-squared 0.649 0.371 0.508 0.504 0.495 0.639
Note: Robust standard errors in parentheses, *** p<0.01, ** p<0.05, * p<0.1.
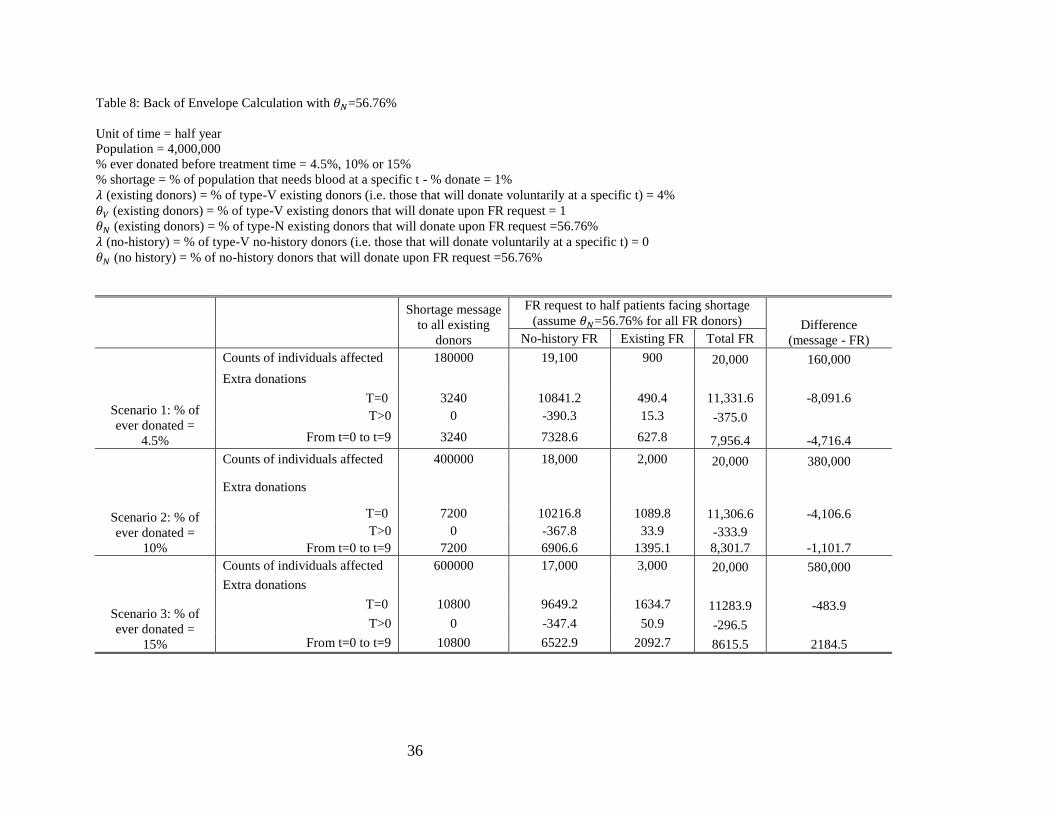
36
Table 8: Back of Envelope Calculation with =56.76%
Unit of time = half year
Population = 4,000,000
% ever donated before treatment time = 4.5%, 10% or 15%
% shortage = % of population that needs blood at a specific t - % donate = 1%
(existing donors) = % of type-V existing donors (i.e. those that will donate voluntarily at a specific t) = 4%
(existing donors) = % of type-V existing donors that will donate upon FR request = 1
(existing donors) = % of type-N existing donors that will donate upon FR request =56.76%
(no-history) = % of type-V no-history donors (i.e. those that will donate voluntarily at a specific t) = 0
(no history) = % of no-history donors that will donate upon FR request =56.76%
Shortage message
to all existing
donors
FR request to half patients facing shortage
(assume =56.76% for all FR donors) Difference
(message - FR) No-history FR Existing FR Total FR
Scenario 1: % of
ever donated =
4.5%
Counts of individuals affected 180000 19,100 900 20,000 160,000
Extra donations
T=0 3240 10841.2 490.4 11,331.6 -8,091.6
T>0 0 -390.3 15.3 -375.0
From t=0 to t=9 3240 7328.6 627.8 7,956.4 -4,716.4
Scenario 2: % of
ever donated =
10%
Counts of individuals affected 400000 18,000 2,000 20,000 380,000
Extra donations
T=0 7200 10216.8 1089.8 11,306.6 -4,106.6
T>0 0 -367.8 33.9 -333.9
From t=0 to t=9 7200 6906.6 1395.1 8,301.7 -1,101.7
Scenario 3: % of
ever donated =
15%
Counts of individuals affected 600000 17,000 3,000 20,000 580,000
Extra donations
T=0 10800 9649.2 1634.7 11283.9 -483.9
T>0 0 -347.4 50.9 -296.5
From t=0 to t=9 10800 6522.9 2092.7 8615.5 2184.5

37
Table 9: Back of Envelope with different for no-history FR donors
Unit of time = half year
Population = 4,000,000
% ever donated before treatment time = 4.5%, 10% or 15%
% shortage = % of population that needs blood at a specific t - % donate = 1%
(existing donors) = % of type-V existing donors (i.e. those that will donate voluntarily at a specific t) = 4%
(existing donors) = % of type-V existing donors that will donate upon FR request = 1
(existing donors) = % of type-N existing donors that will donate upon FR request =56.76%
(no-history) = % of type-V no-history donors (i.e. those that will donate voluntarily at a specific t) = 0
(no history) = % of no-history donors that will donate upon FR request =56.76%, 100%, or 30%
Shortage
message to
all existing
donors
FR request to half patients facing shortage
(no history) = 56.76% (no history) = 100% (no history) = 30%
Total FR
Difference
(message - FR) Total FR
Difference
(message - FR) Total FR
Difference
(message - FR)
Scenario 1: % donated = 4.5%
Counts of individuals affected 180000 20,000 160,000 20000 160000 20000 160000
Extra donations
T=0 3240 11331.6 -8091.6 19590.4 -16350.4 6220.4 -2980.4
T>0 0 -375.0
-672.3
-191.0
From t=0 to t=9 3240 7956.4 -4716.4 13539.4 -10299.4 4501.3 -1261.3
Scenario 2: % donated = 10%
Counts of individuals affected 400000 20,000 380,000 20000 380000 20000 380000
Extra donations
T=0 7200 11306.6 -4106.6 19089.8 -11889.8 6489.8 710.2
T>0 0 -333.9
-614.1
-160.5
From t=0 to t=9 7200 8301.7 -1101.7 13563.1 -6363.1 5045.5 2154.5
Scenario 3: % donated = 15%
Counts of individuals affected 600000 20,000 580,000 20000 580000 20000 580000
Extra donations
T=0 10800 11283.9 -483.9 18634.7 -7834.7 6734.7 4065.3
T>0 0 -296.5
-561.1
-132.7
From t=0 to t=9 10800 8615.5 2184.5 13584.7 -2784.7 5540.3 5259.7