Embed Size (px)
Citation preview
H Unit guideSolutions
© Harcourt Education Ltd 2003 Catalyst 1 This worksheet may have been altered from the original on the CD-ROM. Sheet 1 of 1
Where this unit fits in Prior learningThis unit builds on:units 5D, 6C, 6D Solids, liquids and gases and unit 4D Separating mixtures.
The concepts in this unit are: explaining familiar and new aspects of dissolving and separating mixtures using the particle model.
This unit leads onto:explaining other contexts in terms of particles, e.g. unit 8I Heating and cooling, unit 8A Food anddigestion, unit 8H The rock cycle and unit 9L Pressure and moments.
Framework yearly teaching objectives – ParticlesUse the simple particle model to explain: • why mass is conserved when substances dissolve to form solutions• why temperature increases are likely to result in substances dissolving more quickly• the formation of a saturated solution.
Expectations from the QCA Scheme of WorkAt the end of this unit …
… most pupils will … … some pupils will not have madeso much progress and will …
… some pupils will haveprogressed further and will …
in terms of scientific enquiry NC Programme of Study Sc1 2c, d, e, f, g, i, j, k, m
• make measurements of temperature and mass• present experimental results as line graphs, pointing out patterns• describe observations and explain these• identify patterns in data about solubility, and make predictions
from these• interpret data from chromatograms• use scientific knowledge and understanding to plan how to
separate pure salt from rock salt.
• make measurements of temperatureand mass
• produce simple line graphs of resultsand point out patterns in these
• separate a sample of salt from rocksalt.
• make measurements oftemperature and mass
• interpret and explain thesignificance of data fromchromatograms
• evaluate their method forobtaining pure salt in terms ofthe mass obtained.
in terms of materials and their properties NC Programme of Study Sc3 1b, g, h, 2a, b
• classify some solids as soluble or insoluble and explain themeaning of the term ‘saturated solution’
• describe how mixtures can be separated by distillation andchromatography
• begin to use the particle model to explain what happens when asolid dissolves in water, explaining why mass is conserved.
• name some soluble and insolublesolids
• describe how pure water can beobtained from sea water and howdifferent colours can be separatedfrom some inks.
• use the particle model to explaina range of phenomena.
Suggested lesson allocation (see individual lesson planning guides)Direct route
H1Pure salt
H2Distillation
H3Chromatography
H4Crime and colours:Think aboutanalysing results
H5Solubility
Extra lessons (not included in pupil book)
H1 Pure saltExtra lesson needed ifpupils write theiraccount in class
H5 Investigate: Howsoluble is it?Extra lesson may beneeded
Review and assessprogress (distributedappropriately)
MisconceptionsPupils do not distinguish between melting and dissolving and think that all liquids tend to be made of water or be watery. Pupils think solutions areone substance because they cannot see a boundary between solute and solvent and so do not accept them as mixtures that can easily be separatedout again. Conservation of mass: when liquid water becomes steam, although pupils may accept that the same amount of steam is generated as theliquid water they began with, they may think that the steam is lighter than the water.
Health and safety (see activity notes to inform risk assessment)Many of the materials encountered in this unit are clear, colourless liquids or salt-like solids. Pupils must be taught never to taste materials in thelaboratory, however familiar they may seem. Hazcards should be consulted and risk assessments made for all materials used.
To make good progress, pupils starting this unitneed to understand: • separation of mixtures by filtering and
evaporation• the terms dissolved, undissolved, solution,
mixture, pure, evaporate and filter• evaporation and condensation• the particle model as studied in unit 7G is a
prerequisite for studying this unit.➞ Transition quiz for unit H

H1Lesson planning
guidePure salt
© Harcourt Education Ltd 2003 Catalyst 1 This worksheet may have been altered from the original on the CD-ROM. Sheet 1 of 1
Learning outcomes
Most pupils will … Some pupils, making less progress will … Some pupils, making more progress will …
• use their knowledge of filtering andevaporating to plan the separation ofrock salt
• also clarify their understanding of keyscientific terms and learn the meaningof insoluble, soluble, solute andsolvent.
• plan the separation of rock salt once remindedof filtering and evaporation
• when reminded, they will use some of thescientific terms encountered in KS2.
• also, with direction, calculate the percentagepurity of the rock salt and write an evaluation oftheir separation.
Learning objectivesi Pure salt can be separated from rock salt by filtering and evaporating.ii Review of the terms dissolved, undissolved, solution, mixture, pure, evaporate and filter.iii The meaning of the terms soluble, insoluble, solute and solvent.
Scientific enquiryiv Select equipment for a procedure. (Framework YTO Sc1 7d)v Write an account of a practical procedure. (Framework YTO Sc1 7g)vi Evaluate the method of separating pure salt from rock salt. (red only) (Framework YTO Sc1 7h)
Suggested alternative starter activities (5–10 minutes)
Introduce the unit Share learning objectives Problem solving Capture interest (1) Capture interest (2)
Unit map for Solutions. • Find out the meaning of thewords soluble, insoluble,solute and solvent.
• Be able to suggest ways thatmixtures can be separated.
• Be able to separate pure saltfrom rock salt. (Sc1)
Quiz based on KS2 words. Pupils decide whichmethod is best forseparating differentmixtures.
Show a video clip of saltmines. Catalyst InteractivePresentations 1
Suggested alternative main activitiesActivity Learning
objectivessee above
Description Approx.timing
Target group
C H E S
Textbook H1 i, ii and iii Teacher-led explanation and questioning OR pupils work individually,in pairs or in small groups through the in-text questions and thenonto the end-of-spread questions if time allows.
20 min R/G G R S
Activity H1aPractical
i, iv, v and vi Pure salt from rock salt Pupils plan a way of obtaining a sample ofpure salt and show the plan to their teacher for checking. Pupils thencarry out their plan.Extension only: pupils find out how much of the rock salt is pure salt.Pupils should try to use the keywords in their plan.
35 min ✓ ✓
Activity H1bCatalyst InteractivePresentations 1
ii Support animation with immediate feedback to review termsintroduced at KS2, to include dissolved, undissolved, solution,mixture, pure, evaporate and filter.
10 min ✓
Suggested alternative plenary activities (5–10 minutes)Review learning Sharing responses Group feedback Word game Looking aheadPupils imagine they are a single crystalof salt. They describe their journeyfrom the rock salt to the evaporatingdish.
Pupils share their accountsabout how pure salt can beobtained from a sample ofrock salt in Activity H1a.
Groups share their data onthe percentage purity ofsalt obtained in ActivityH1a.
Pupils discussword pairs.
Pupils suggest how theywould separate thesolvent from a solution.
Key wordspure, solution, soluble, insoluble, evaporates, solvent, solute, red only:sodium chloride
Out-of-lesson learningHomework H1Textbook H1 end-of-spread questionsResearch the uses of salt
H2Lesson planning
guideDistillation
© Harcourt Education Ltd 2003 Catalyst 1 This worksheet may have been altered from the original on the CD-ROM. Sheet 1 of 1
Learning outcomes
Most pupils will … Some pupils, making less progress will … Some pupils, making more progress will …
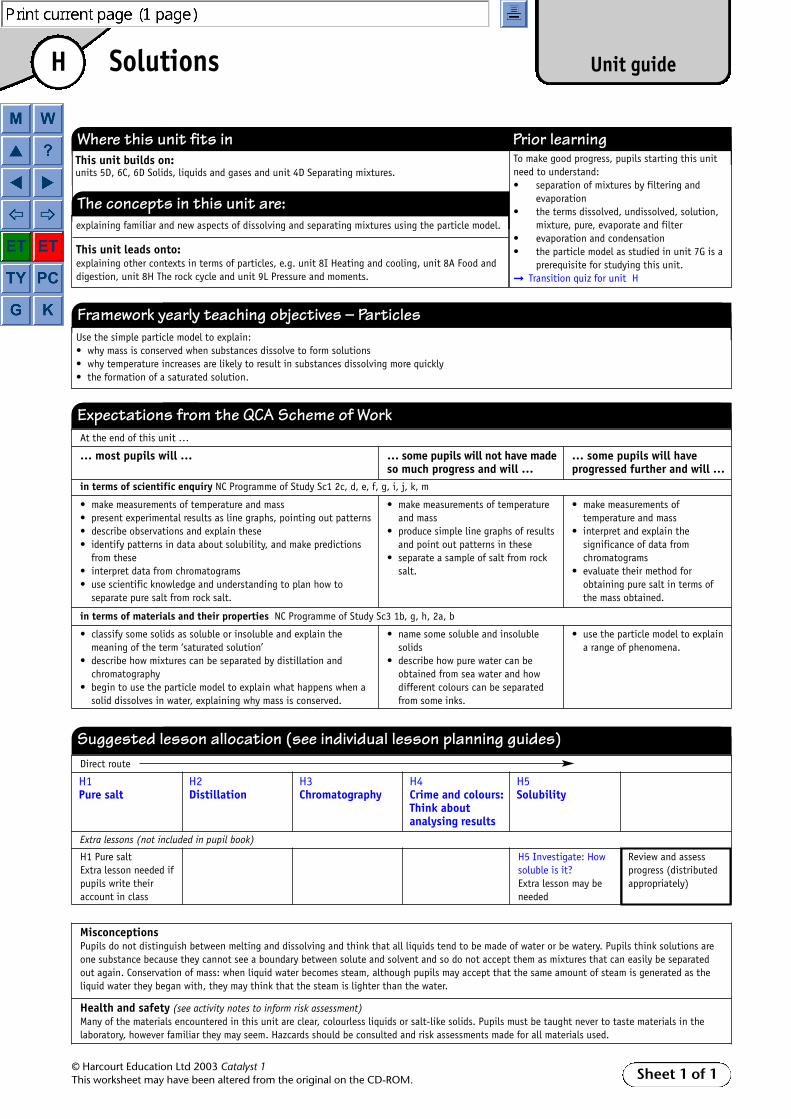
• be able to describe distillation asevaporation of the solvent from asolution, followed by condensation andcollection.
• be able to describe distillation as anevaporation step followed by a condensationstep.
• be able to relate distillation, withoutprompting, to their knowledge andunderstanding of particles.
Learning objectivesi Changes in state, evaporation and condensation.ii Distillation as a separation technique to obtain a solvent from a solution.iii Distillation is used to separate two liquids with different boiling points. (red only)
Scientific enquiryiv Explaining observation using an accepted theory. (Framework YTO Sc1 7g)
Suggested alternative starter activities (5–10 minutes)
Recap last lesson Share learning objectives Word game Capture interest (1) Capture interest (2)
Pupils givedefinitions of keywords.
• Find out about distillation.• Be able to separate a solvent from a
solution by distillation. (Sc1)
Wordsearch on KS2 words todo with dissolving andseparating.
Demonstrate boilingwater to show howevaporation andcondensation occur.
Show a photo or videoclip of salty sea water. Catalyst InteractivePresentations 1
Suggested alternative main activitiesActivity Learning
objectivessee above
Description Approx.timing
Target group
C H E S
Textbook H2 i, ii, iii andiv
Teacher-led explanation and questioning OR pupils work individually, inpairs or in small groups through the in-text questions and then ontothe end-of-spread questions if time allows.
20 min R/G G R S
Activity H2aPractical
i, ii and iv Pure water from sea water Pupils carry out small-scale distillation ofsalt water using simple tube as the condenser.
15 min ✓
Activity H2bPractical
i and ii Pure water from inky water Large-scale demonstration of ink andwater using a Liebig condenser with a thermometer to show that thesteam is at 100 °C.
15 min ✓ ✓
Suggested alternative plenary activities (5–10 minutes)Review learning Sharing responses Group feedback Word game Looking aheadPupils (in pairs) explainthe main stages of theprocess of distillation,using a flow chart.
Pupils share their choice ofparticle diagrams torepresent the distillation ofsalt water from ActivityH2a.
Groups of pupils discussthe demonstration of theLiebig condenser inActivity H2b.
Card sort activity on solute,solvent and solution.
Pupils compare their ideasfor obtaining pure waterfrom salty water with theindustrial process ofdesalination.
Key wordsdistillation, water vapour, distilled water, condenses
Out-of-lesson learningHomework H2Textbook H2 end-of-spread questionsIf possible, groups of pupils can be taken to see the school still for making distilled water

H3Lesson planning
guideChromatography
© Harcourt Education Ltd 2003 Catalyst 1 This worksheet may have been altered from the original on the CD-ROM. Sheet 1 of 1
Learning outcomes
Most pupils will … Some pupils, making less progress will … Some pupils, making more progress will …
• know that chromatography is a methodof separating solutes dissolved in asolvent
• understand that the more solublesubstances travel further up the paper.
• know that chromatography can be used toseparate coloured substances.
• also understand that how far a solute travelsdepends on how soluble it is in the solvent ascompared to how well the particles of solutestick to the paper.
Learning objectivesi Chromatography is a method of separating a mixture of solutes that are soluble in the same solvent.ii Carry out simple paper chromatography.iii Some of the uses of chromatography. iv Explain separation by chromatography in terms of the solutes being more or less soluble in the solvent. (red only)
Scientific enquiryv Use appropriate equipment and make observations. (Framework YTO Sc1 7d part)vi Relate observations to scientific knowledge and understanding. (Framework YTO Sc1 7g)vii Describe and explain what their results show. (Framework YTO Sc1 7h part)
Suggested alternative starter activities (5–10 minutes)
Recap last lesson Share learning objectives Word game Capture interest (1) Capture interest (2)
Question and answersession on separatingsolutions.
• Find out how chromatographyworks and what it can be used for.
• Be able to carry out paperchromatography. (Sc1)
Pupils match solutesand solvents.
Demonstratechromatography.
Show a video clip of aforensic case/lab.Catalyst InteractivePresentations 1
Suggested alternative main activitiesActivity Learning
objectivessee above
Description Approx. timing Target group
C H E S
Textbook H3 i, iii and iv Teacher-led explanation and questioning OR pupils workindividually, in pairs or in small groups through the in-textquestions and then onto the end-of-spread questions if time allows.
20 min R/G G R S
Activity H3aPractical
ii, iv, v, viand vii
What dyes are used in felt tip pens? Pupils carry out verticalpaper chromatography using ink from water-soluble felt tips.
10 min + runningtime + drying time
✓ (✓ )
Suggested alternative plenary activities (5–10 minutes)Review learning Sharing responses Group feedback Word game Looking aheadProvide pupils with threechromatograms and askthem to match these withdescriptive statements.
Teacher-led review ofchromatography and theparticle model.
In groups, pupils comparetheir annotatedchromatograms fromActivity H3a.
To check progress pupilsplay dominoes aboutseparation techniques.
Pupils suggest what mixturesmay be separated bychromatography in newcontexts.
Key wordsdyes, chromatography
Out-of-lesson learningHomework H3Textbook H3 end-of-spread questions
H4Lesson planning
guideCrime and colours – Think aboutanalysing results
© Harcourt Education Ltd 2003 Catalyst 1 This worksheet may have been altered from the original on the CD-ROM. Sheet 1 of 1
Learning outcomes
Most pupils will … Some pupils, making less progress will … Some pupils, making more progress will …
• discuss how evidence is used to drawconclusions.
• understand that conclusions are based onevidence.
• also appreciate that evidence often supports aconclusion without proving it.
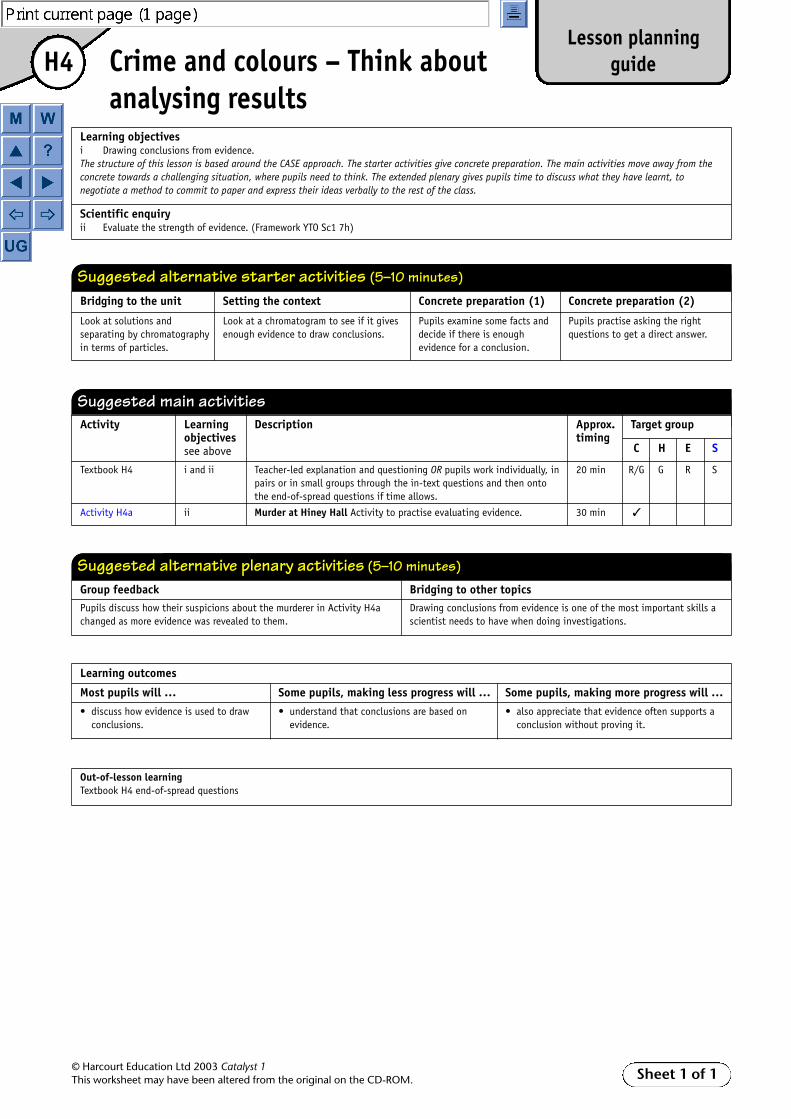
Learning objectivesi Drawing conclusions from evidence.The structure of this lesson is based around the CASE approach. The starter activities give concrete preparation. The main activities move away from theconcrete towards a challenging situation, where pupils need to think. The extended plenary gives pupils time to discuss what they have learnt, tonegotiate a method to commit to paper and express their ideas verbally to the rest of the class.
Scientific enquiryii Evaluate the strength of evidence. (Framework YTO Sc1 7h)
Suggested alternative starter activities (5–10 minutes)
Bridging to the unit Setting the context Concrete preparation (1) Concrete preparation (2)
Look at solutions andseparating by chromatographyin terms of particles.
Look at a chromatogram to see if it givesenough evidence to draw conclusions.
Pupils examine some facts anddecide if there is enoughevidence for a conclusion.
Pupils practise asking the rightquestions to get a direct answer.
Suggested main activitiesActivity Learning
objectivessee above
Description Approx.timing
Target group
C H E S
Textbook H4 i and ii Teacher-led explanation and questioning OR pupils work individually, inpairs or in small groups through the in-text questions and then ontothe end-of-spread questions if time allows.
20 min R/G G R S
Activity H4a ii Murder at Hiney Hall Activity to practise evaluating evidence. 30 min ✓
Suggested alternative plenary activities (5–10 minutes)Group feedback Bridging to other topicsPupils discuss how their suspicions about the murderer in Activity H4achanged as more evidence was revealed to them.
Drawing conclusions from evidence is one of the most important skills ascientist needs to have when doing investigations.
Out-of-lesson learningTextbook H4 end-of-spread questions

H5Lesson planning
guideSolubility
© Harcourt Education Ltd 2003 Catalyst 1 This worksheet may have been altered from the original on the CD-ROM. Sheet 1 of 1
Learning outcomes
Most pupils will … Some pupils, making less progress will … Some pupils, making more progress will …
• know the meaning of solubility andsaturated solution.
• understand the meaning of solubility andsaturated solution when they are explained.
• be able to apply the particle model to solutions.
Learning objectivesi Mass is conserved during dissolving.ii There is a limit to the amount of solute that will dissolve in a given amount of solvent at a given temperature and when this maximum is reached
the solution is saturated.iii The particle model can be applied to solutions.
Scientific enquiryiv Pupils carry out a short investigation into solubility. (Framework YTO Sc1 7b, c, e, g)
Suggested alternative starter activities (5–10 minutes)
Recap last lesson Share learning objectives Brainstorming Capture interest (1) Capture interest (2)
Key words anddefinitions exercise.
• Find out the meaning of the terms solubilityand saturated solution.
• Find out what happens to the mass of soluteand solvent during dissolving.
• Be able to show how solubility changes withtype of solvent. (Sc1)
Pupils discuss whataffects solubility ofsugar in a cup of tea.
Demonstrate thesolubility of differentcompounds.
Show a photo or videoclip of stalactites andstalagmites.Catalyst InteractivePresentations 1
Suggested alternative main activitiesActivity Learning
objectivessee above
Description Approx.timing
Target group
C H E S
Textbook H5 i, ii and iii Teacher-led explanation and questioning OR pupils work individually, inpairs or in small groups through the in-text questions and then ontothe end-of-spread questions if time allows.
20 min R/G G R S
Activity H5aPractical
ii and iv How much solid will dissolve? Pupils carry out an investigation tofind out how potassium chloride will dissolve in 10 cm3 of water.
25 min ✓ (✓ )
Activity H5bPaper
i and iii Poster challenge Pupils work in pairs or trios, using theirunderstanding of the particle model to make a series of large,annotated diagrams (like a cartoon strip) to explain one or morestatements. A challenge card is available for each example.
25 min ✓ ✓ ✓
Suggested alternative plenary activities (5–10 minutes)Review learning Sharing responses Group feedback Word games Looking backWorking in pairs pupilsdraw diagrams and write asentence to express theirunderstanding of asaturated solution.
Whole-class discussion offindings from Activity H5a.
Each group compares theirseries of annotateddiagrams from ActivityH5b.
Check progress by playing aloop game on key wordsfrom the unit.
Pupils revise andconsolidate knowledgefrom the unit.
Key wordssaturated, solubility, conserved
Out-of-lesson learningHomework H5Textbook H5 end-of-spread questionsActivity H5b

H5Lesson planning
guideInvestigate: How soluble is it?
© Harcourt Education Ltd 2003 Catalyst 1 This worksheet may have been altered from the original on the CD-ROM. Sheet 1 of 1
Learning outcomes
Most pupils will … Some pupils, making less progress will … Some pupils, making more progress will …
• plan a fair test without assistance• record their results clearly in a table• draw a bar chart or line graph as
appropriate and write a simpleevaluation of their investigation.
• need help making decisions as they progressthrough their investigation.
• also spontaneously use the particle model whenwriting a scientific explanation of theirprediction or conclusion
• also choose to repeat their measurements toincrease reliability.
Learning objectivesi There is a limit to the amount of solute that will dissolve in a given amount of solvent at a given temperature and when this maximum is reached
the solution is saturated.
Scientific enquiryii Make predictions of possible outcomes. (Framework YTO Sc1 7b)iii Identify and control the key factors that are relevant to the investigation. (Framework YTO Sc1 7c) iv Select and use appropriate equipment and make observations. (Framework YTO Sc1 7d)v Present and interpret experimental results. (Framework YTO Sc1 7f)vi Describe and explain what their results show. (Framework YTO Sc1 7g, 7h)
Suggested alternative starter activities (5–10 minutes)
Setting the context Introduce the apparatus Safety Brainstorming (1) Brainstorming (2)
Pupils answer questionsabout solubility.
Demonstrate how to determinethe solubility of sodiumchloride.
Discuss the hazards in thisinvestigation and how theycan be minimised.
What things might affect theamount of solute thatdissolves in a solvent?
How can we get themost reliable results?
InvestigationActivity Learning
objectivessee above
Description Approx.timing
Target group
C H E S
Activity H5cPractical
ii–vi How soluble is it? (1) Pupils investigate whether changing the soluteaffects how much will dissolve in a solvent. You will use water as yoursolvent.
25 min ✓ ✓
Activity H5dPractical
ii–vi How soluble is it? (2) Pupils investigate how much solute dissolveswhen different solvents are used.
25 min ✓ ✓
Activity H5ePractical
ii–vi How soluble is it? (3) Pupils investigate whether changing thetemperature affects how much solute dissolves in a solvent.
20 min ✓ ✓
Suggested alternative plenary activities (5–10 minutes)Review learning Group feedback Analysing EvaluatingTeacher-led review of planningprocedure.
Group discussions of evidence collectedfrom each of the three investigations.
Teacher-led discussion of datacollected from different groups.
Teacher-led evaluation of strengthof evidence.
Key wordssolubility, saturated solution

H1
© Harcourt Education Ltd 2003 Catalyst 1This worksheet may have been altered from the original on the CD-ROM.
StartersPure salt
Sheet 1 of 1
Introduce the unit● Either draw the outline of the unit map on the board then
ask pupils to give you words to add, saying where to addthem. Suggest some yourself when necessary to keep pupilson the right track.
● Or give out the unit map and ask pupils to work in groupsdeciding how to add the listed words to the diagram. Thengo through it on the board as each group gives suggestions.
Share learning objectives● Ask pupils to write a list of FAQs they would put on a
website telling people about dissolving, and separatingmixtures by filtering and evaporation. Collect suggestions asa whole-class activity, steering pupils towards those relatedto the objectives. Conclude by highlighting the questionsyou want them to be able to answer at the end of the lesson.
Problem solving● Ask pupils to stand. Ask each, in turn, to explain the
meaning of a word from the list opposite.
● Pupils who give a correct explanation can sit down.
● Differentiate the words so that all pupils sit down after thesecond or third attempt. This can also be achieved by usingsome words more than once.
Capture interest (1)● Pupils work in pairs on the task given on the pupil sheet.
Each pair in turn gives their answer to the rest of the class.Correct errors and discuss the answers.
Capture interest (2)● Show a video clip of salt mines (e.g. in Cheshire) with lorries
driving into the tunnels and being loaded with rock salt.Explain what is being mined and where the rock salt isdeposited.
Suggested alternative starter activities (5–10 minutes)
Unit map for Solutions. ● Find out the meaning ofthe words soluble,insoluble, solute andsolvent.
● Be able to suggest waysthat mixtures can beseparated.
● Be able to separate puresalt from rock salt.(Sc1)
Quiz based on KS2 words. Pupils decide whichmethod is best forseparating differentmixtures.
Show a video clip of saltmines. Catalyst InteractivePresentations 1
Introduce the unit Share learning Problem solving Capture interest (1) Capture interest (2)objectives
➔ Unit map
➔ Pupil sheet
Wordssolid dissolve filterliquid solution evaporategas separatemixture sieve
➔ Catalyst Interactive Presentations 1
© Harcourt Education Ltd 2003 Catalyst 1This worksheet may have been altered from the original on the CD-ROM. Sheet 1 of 1
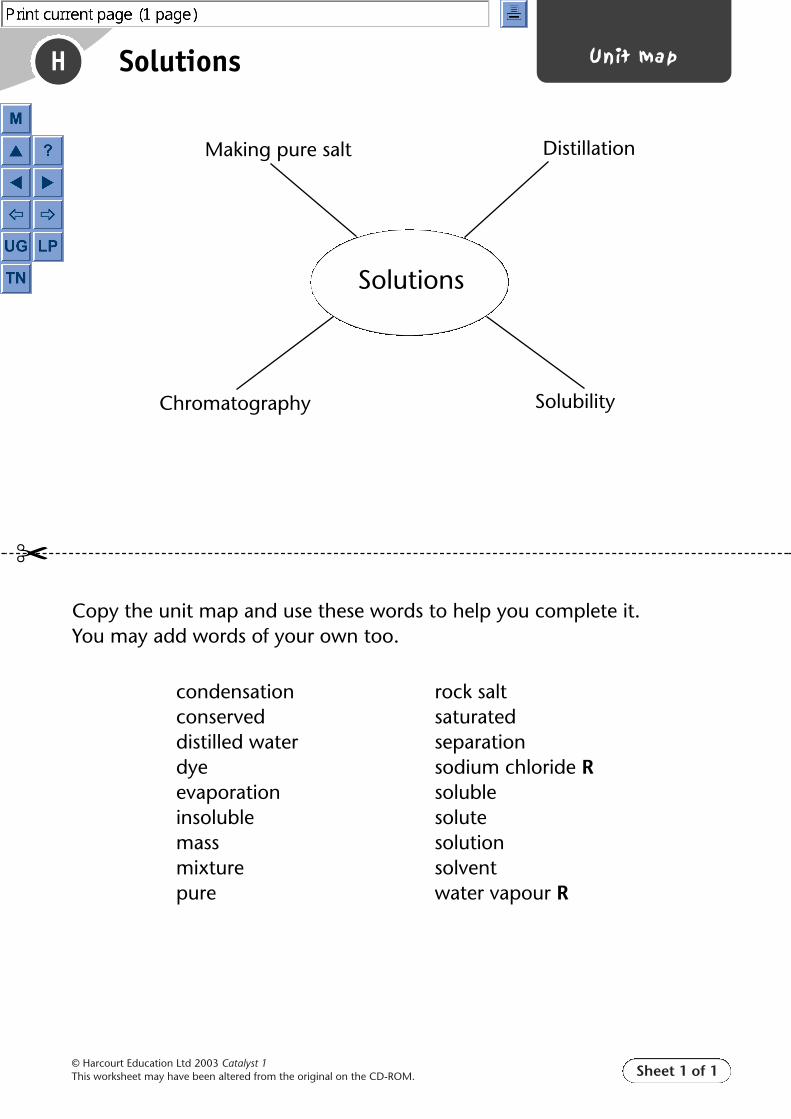
H Unit mapSolutions
condensationconserveddistilled waterdyeevaporationinsolublemassmixturepure
rock saltsaturatedseparationsodium chloride Rsolublesolutesolutionsolventwater vapour R
Copy the unit map and use these words to help you complete it. You may add words of your own too.
�
Solutions
Making pure salt Distillation
Chromatography Solubility

© Harcourt Education Ltd 2003 Catalyst 1This worksheet may have been altered from the original on the CD-ROM. Sheet 1 of 1
Capture interest (1)Here are some mixtures of different substances.
Below are some methods used to separate mixtures.
Decide which method (A, B or C) is best for separating the substances in each mixture.
H2 StartersDistillation
mixture
filter paper
A B
filtering
sieving
C
evaporating
funnel
filtrate
heat
evaporating dish
solution
mixture
sieve
sand and gravelsand and water salt and water
chalk and water chalk and sandsugar and water

H2
© Harcourt Education Ltd 2003 Catalyst 1This worksheet may have been altered from the original on the CD-ROM.
StartersDistillation
Sheet 1 of 1
Recap last lesson● Divide the class into pairs and hand out the pupil
sheets.
● Pupils take it in turns to explain the meanings of wordsin their list.
● As a class, ask pupils to define one of the words on theirpartner’s list, to check how well they listened.
Share learning objectives● Ask pupils to write a list of FAQs they would put on a
website telling people about separating mixtures bydistillation. Collect suggestions as a whole-classactivity, steering pupils towards those related to theobjectives. Conclude by highlighting the questions youwant them to be able to answer at the end of thelesson.
Word game● Give pupils 5 minutes to do the wordseach on the pupil
sheet.
● Use the OHT for pupils to check their answers.
Capture interest (1)● Demonstrate boiling water and let pupils observe the
liquid water turning into a gas (water vapour).
● Then place a sheet of glass clamped at an angle aboveso that pupils can observe condensation.
● Develop a question and answer session aboutevaporation and condensation, and the nature of theliquid that has evaporated and the liquid left behind.
Capture interest (2)● Show a photo or video clip of salt being obtained by
evaporation of sea water in shallow pools.
● Ask pupils:Why is the sea salty?Where in the world would it be easy to get salt by thismethod?
Suggested alternative starter activities (5–10 minutes)
Pupils give definitions ofkey words.
● Find out aboutdistillation.
● Be able to separate asolvent from a solutionby distillation. (Sc1)
Wordsearch on KS2 wordsto do with dissolving andseparating.
Demonstrate boiling waterto show how evaporationand condensation occur.
Show a photo or video clipof salty sea water. Catalyst Interactive Presentations 1
Recap last lesson Share learning Word game Capture interest (1) Capture interest (2)objectives
➔ Pupil sheet
➔ Pupil sheet
➔ Technician sheet
➔ Teacher sheet
➔ Catalyst Interactive Presentations 1

© Harcourt Education Ltd 2003 Catalyst 1This worksheet may have been altered from the original on the CD-ROM. Sheet 1 of 1
Recap last lessonWork in pairs. Explain to your partner the meanings of the words inyour list.
Pupil 1 Pupil 2
soluble insoluble
solute solvent
solution dissolve
filter evaporate
Listen carefully because your teacher will ask you to tell the class themeaning of one word in your partner’s list.
H2 StartersDistillation
H2 Starters
�
© Harcourt Education Ltd 2003 Catalyst 1This worksheet may have been altered from the original on the CD-ROM. Sheet 1 of 1
Distillation
Recap last lessonWork in pairs. Explain to your partner the meanings of the words inyour list.
Pupil 1 Pupil 2
soluble insoluble
solute solvent
solution dissolve
filter evaporate
Listen carefully because your teacher will ask you to tell the class themeaning of one word in your partner’s list.

© Harcourt Education Ltd 2003 Catalyst 1This worksheet may have been altered from the original on the CD-ROM. Sheet 1 of 1
Word gameHere are some words to do with dissolving and separating.
See how many of them you can find in the wordsearch.
soluble
insoluble
solute
solvent
solution
dissolve
filter
evaporate
H2 StartersDistillation
H2 Starters
�
© Harcourt Education Ltd 2003 Catalyst 1This worksheet may have been altered from the original on the CD-ROM. Sheet 1 of 1
S O L U T E B E C Q
A T D S N S R L G I
L A I D E O J B E M
F Y S X V L H U J D
I N S O L U B L E O
L E O K O T F O B H
T N L C S I P S F G
E E V A P O R A T E
R Z E M U N W K I V
Word gameHere are some words to do with dissolving and separating.
See how many of them you can find in the wordsearch.
soluble
insoluble
solute
solvent
solution
dissolve
filter
evaporate
Distillation
S O L U T E B E C Q
A T D S N S R L G I
L A I D E O J B E M
F Y S X V L H U J D
I N S O L U B L E O
L E O K O T F O B H
T N L C S I P S F G
E E V A P O R A T E
R Z E M U N W K I V

© Harcourt Education Ltd 2003 Catalyst 1This worksheet may have been altered from the original on the CD-ROM. Sheet 1 of 1
H2 StartersDistillation
Word game
S O L U T E B E C Q
A T D S N S R L G I
L A I D E O J B E M
F Y S X V L H U J D
I N S O L U B L E O
L E O K O T F O B H
T N L C S I P S F G
E E V A P O R A T E
R Z E M U N W K I V

© Harcourt Education Ltd 2003 Catalyst 1This worksheet may have been altered from the original on the CD-ROM. Sheet 1 of 1
Capture interest (1)
Technician sheetSupply the following for a demonstration:
● 400 cm3 beaker
● Bunsen burner
● tripod
● gauze
● sheet of plate glass approx. 20 cm square
● stand and clamp.
H2 StartersDistillation

H3
© Harcourt Education Ltd 2003 Catalyst 1This worksheet may have been altered from the original on the CD-ROM.
StartersChromatography
Sheet 1 of 1
Recap last lesson● Make a set of cards for each pupil: True, False and Unsure.
(You could use a different colour card for each word.)
● Read out the statements on the separate teacher sheet.Pupils hold up the card for their answer simultaneously.
● Explain the answers. If many pupils get an answer wrong,repeat the statement later.
Share learning objectives● Ask pupils to write a list of FAQs they would put on a
website telling people about chromatography. Collectsuggestions as a whole class activity, steering pupils towardsthose related to the objectives. Conclude by highlightingthe questions you want them to be able to answer at theend of the lesson.
Word game● Show the OHT of common solutes and solvents. Ask pupils
to match each solute with a suitable solvent. Pupils reportback their answers during a class discussion.
● Emphasise these ideas: water is the most common solventbut not all things dissolve in it; and solutes that do notdissolve in water will dissolve in another solvent.
Capture interest (1)● Set up a demonstration for pupils to watch gathered round
or, if available, shown via a camera on a TV screen orprojected onto a white screen.
● Place a piece of filter paper on top of a 400 cm3 beaker.Place a brown Smartie or spot from a felt-tip pen in thecentre of the filter paper. Brown is likely to have severalcomponent dyes.)
● Use a dropping pipette to drip water on the top of theSmartie or spot, one drop at a time.
● As rings of different colours from the dye move outwards,ask pupils to think what is happening.
Capture interest (2)● Show the video clip and explain that chromatography is
one technique that forensic scientists use.
Suggested alternative starter activities (5–10 minutes)
Question and answersession on separatingsolutions.
● Find out howchromatography worksand what it can be usedfor.
● Be able to carry outpaper chromatography.(Sc1)
Pupils match solutes andsolvents.
Demonstratechromatography.
Show a video clip of aforensic case/lab.Catalyst InteractivePresentations 1
Recap last lesson Share learning Word game Capture interest (1) Capture interest (2)objectives
➔ Pupil sheets➔ Teacher sheetEquipmentLiebig condenser
➔ Pupil sheet
EquipmentSmarties or water-soluble felt-tip pens,filter paper, dropping pipette, 400 cm3
beaker(If using felt-tips, check this works beforeyou do the demonstration!)
➔ Catalyst Interactive Presentations 1
© Harcourt Education Ltd 2003 Catalyst 1This worksheet may have been altered from the original on the CD-ROM. Sheet 1 of 3
Recap last lesson
H3 StartersChromatography
True
True
True
True
�
�
True
True
True
True

© Harcourt Education Ltd 2003 Catalyst 1This worksheet may have been altered from the original on the CD-ROM. Sheet 2 of 3
H3 StartersChromatography
Recap last lesson
False
False
False
False
�
�
False
False
False
False
© Harcourt Education Ltd 2003 Catalyst 1This worksheet may have been altered from the original on the CD-ROM. Sheet 3 of 3
H3 StartersChromatography
Recap last lesson
Unsure
Unsure
Unsure
Unsure
�
�
Unsure
Unsure
Unsure
Unsure

© Harcourt Education Ltd 2003 Catalyst 1This worksheet may have been altered from the original on the CD-ROM. Sheet 1 of 1
Recap last lesson
Teacher sheet1 Salt and water can be separated by filtration.
2 Distillation is used to separate a solvent from a solution.
3 Changing from a gas to a liquid is called condensation.
4 This piece of apparatus is called a funnel. (Hold up a Liebig condenser.)
5 Distillation can be used to separate a mixture of sand and salt.
6 In some hot countries salt is obtained from sea water byevaporation.
7 In salt solution the salt is the solvent.
8 When a gas is cooled it condenses.
9 Distillation can be used to separate a mixture of several differentliquids.
H3 StartersChromatography
© Harcourt Education Ltd 2003 Catalyst 1This worksheet may have been altered from the original on the CD-ROM. Sheet 1 of 1
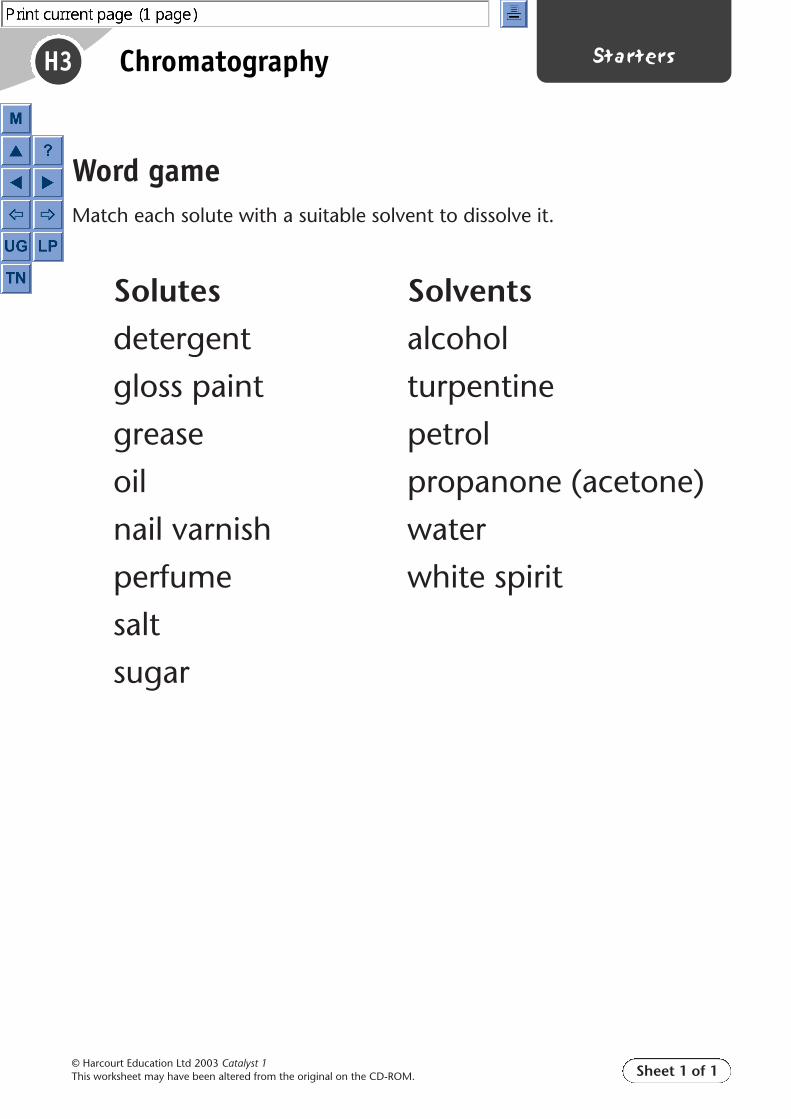
Word gameMatch each solute with a suitable solvent to dissolve it.
Solutes Solvents
detergent alcohol
gloss paint turpentine
grease petrol
oil propanone (acetone)
nail varnish water
perfume white spirit
salt
sugar
H3 StartersChromatography

H4
© Harcourt Education Ltd 2003 Catalyst 1This worksheet may have been altered from the original on the CD-ROM.
StartersCrime and colours – Think about
Sheet 1 of 1
Bridging to the unit● Ask pupils to discuss, in pairs, the answers to these
questions. Share answers in a class discussion.
● Explain that solute particles go between solvent particles,so dissolved salt cannot be seen but can be tasted.
● Explain how the different dye particles in the brownmixture move at different speeds up the paper, so theytravel different distances.
Setting the context● Show the OHT of a chromatogram and ask pupils to
decide whether there is enough evidence for police tocharge the manufacturers for using an illegal dye.
● Lead a class discussion on the reliability of scientificevidence and the importance of repeating results.
● Pupils may suggest that not all of the orange drinkbottles contained the illegal dye. However, the presenceof illegal dye in two bottles would be enough evidenceto charge the manufacturer.
Concrete preparation (1)● Pupils work in groups to discuss the information on the
pupil sheet and report back their ideas to the class.
● Suggest that there is not enough evidence – the greenand red paint could be from other cars.
● Introduce the idea of analysing the red and green paint(e.g. by chromatography) to see if they containmatching mixtures of dyes.
● Pupils may suggest looking to see if the damage‘matches’ (i.e. which part of one car hit which part ofthe other). Sometimes large flakes of paint may bescraped off cars and their shapes can be matched backto the area of missing paint like a jigsaw puzzle.
Concrete preparation (2)● Ask pupils to work in pairs. One decides on an object in
their pencil case. The other can ask three questions tofind out what it is. Two answers must be true but onecan be a lie. Pupils then swap roles.
● When both pupils in each pair have had a go, ask forcomments in a class discussion.
● Lead this on to the idea that asking the right questionsis very important if you want to find out something.This applies to scientific investigations.
Bridging to the unit Setting the context Concrete preparation (1) Concrete preparation (2)
Suggested alternative starter activities (5–10 minutes)
Look at solutions and separatingby chromatography in terms ofparticles.
Look at a chromatogram to see ifit gives enough evidence to drawconclusions.
Pupils examine some facts anddecide if there is enoughevidence for a conclusion.
Pupils practise asking the rightquestions to get a direct answer.
QuestionsWhen salt dissolves in water, where doesthe salt go? How can we taste it even though we cannotsee it?
When we carry out chromatography onbrown dyes, why do we see spots ofseparate colours? Why do we not see just a brown spot?
➔ Pupil sheet
➔ Pupil sheet

© Harcourt Education Ltd 2003 Catalyst 1This worksheet may have been altered from the original on the CD-ROM. Sheet 1 of 1
Setting the contextSome forensic scientists carried out chromatography on several bottles oforange drink to see if the manufacturer is using an illegal dye.
H4 StartersCrime and colours
bottle 1 bottle 2 bottle 3 bottle 4 illegaldye
© Harcourt Education Ltd 2003 Catalyst 1This worksheet may have been altered from the original on the CD-ROM. Sheet 1 of 1
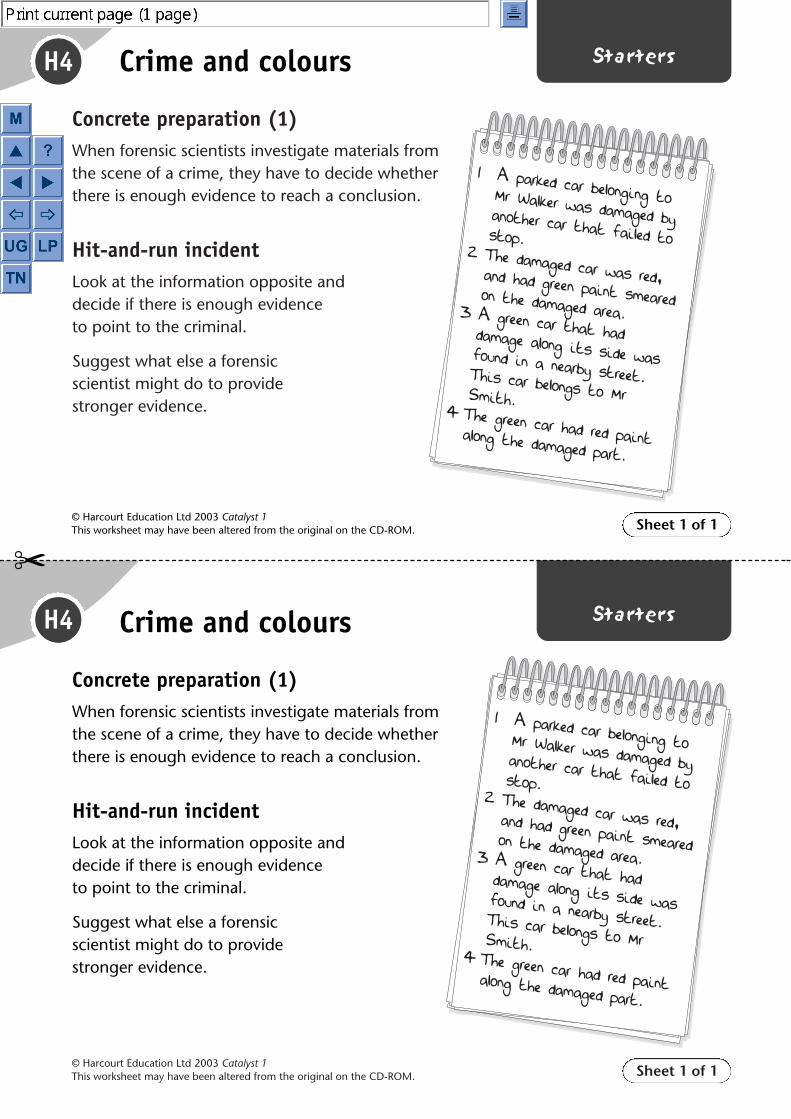
Concrete preparation (1)When forensic scientists investigate materials from the scene of a crime, they have to decide whether there is enough evidence to reach a conclusion.
Hit-and-run incidentLook at the information opposite and decide if there is enough evidence to point to the criminal.
Suggest what else a forensic scientist might do to provide stronger evidence.
H4 StartersCrime and colours
H4 Starters
�
© Harcourt Education Ltd 2003 Catalyst 1This worksheet may have been altered from the original on the CD-ROM. Sheet 1 of 1
1 A parked car belonging to Mr Walker was damaged by another car that failed to stop.2 The damaged car was red, and had green paint smeared on the damaged area.3 A green car that had damage along its side was found in a nearby street. This car belongs to Mr Smith.
4 The green car had red paint along the damaged part.
Concrete preparation (1)When forensic scientists investigate materials from the scene of a crime, they have to decide whether there is enough evidence to reach a conclusion.
Hit-and-run incidentLook at the information opposite and decide if there is enough evidence to point to the criminal.
Suggest what else a forensic scientist might do to provide stronger evidence.
Crime and colours
1 A parked car belonging to Mr Walker was damaged by another car that failed to stop.2 The damaged car was red, and had green paint smeared on the damaged area.3 A green car that had damage along its side was found in a nearby street. This car belongs to Mr Smith.
4 The green car had red paint along the damaged part.
H5
© Harcourt Education Ltd 2003 Catalyst 1This worksheet may have been altered from the original on the CD-ROM.
StartersSolubility
Sheet 1 of 1
Recap last lesson● Ask pupils to work in pairs to put together a list of key
words about dissolving and a definition for each word.
● Ask pupils to report their words and definitions to theclass. Correct and add to the results to present acomplete picture of the process.
Share learning objectives● Ask pupils to write a list of FAQs they would put on a
website telling people about solubility. Collectsuggestions as a whole class activity, steering pupilstowards those related to the objectives. Conclude byhighlighting the questions you want them to be able toanswer at the end of the lesson.
Brainstorming● Arrange pupils into groups of three or four, to
brainstorm the question on the right.
● Ask a member of each group to report back theirfindings. Lead the discussion into ideas of type ofsolute, type of solvent, mass of solvent, temperature.
Capture interest (1) ● Show the class a measuring cylinder with 100 cm3 of
water and a selection of different solutes measured outin the quantites shown (see right).
● Explain that the mass of each sample is the exact amountthat will dissolve in the water to form a saturatedsolution. Some solutes will dissolve more than others.
Capture interest (2)● Show a slide or video clip of a cave with stalactites and
stalagmites.
● Explain that magnesium and calcium salts have a verylow solubility, so water contains only a little of thesesolutes. When the water runs down a stalactite or dripsonto a stalagmite a little evaporates, releasing a tinyamount of the dissolved salts from solution. Overmillions of years this process builds up the releasedsolid to make stalactites and stalagmites.
Suggested alternative starter activities (5–10 minutes)
Key words anddefinitions exercise.
● Find out the meaning ofthe terms solubility andsaturated solution.
● Find out what happensto the mass of soluteand solvent duringdissolving.
● Be able to show howsolubility changes withtype of solvent. (Sc1)
Pupils discuss what affectsthe solubility of sugar in acup of tea.
Demonstrate the solubilityof different compounds.
Show a photo or video clipof stalactites andstalagmites.Catalyst InteractivePresentations 1
Recap last lesson Share learning Brainstorming Capture interest (1) Capture interest (2)objectives
Wordssolvent, solute, dissolve, solution, particle,random
QuestionWhat may have an effect on the amount ofsugar that will dissolve in a cup of tea?
Equipment100 cm3 water in measuring cylinder; 30 gpotassium nitrate, 20 g copper(II) sulphateand 38 g sodium chloride on separatewatchglasses
➔ Catalyst Interactive Presentations 1

H5
© Harcourt Education Ltd 2003 Catalyst 1This worksheet may have been altered from the original on the CD-ROM.
StartersInvestigate: How soluble is it?
Sheet 1 of 1
Setting the context● Ask pupils to work in pairs to discuss the answers to
these questions (see right).
● Pupils report back their ideas in a class discussion. Leadthe discussion of the following:There are many different solutes.There are many different solvents.Solutes dissolve in different amounts in differentsolvents.
● Introduce the idea of solubility as the mass in grams of asolute that will dissolve in 100 g of solvent at aparticular temperature.
Introduce the apparatus● Carry out a demonstration to measure the mass of
sodium chloride that will dissolve in 20 cm3 of water.
● Measure 20 cm3 of water into a 100 cm3 beaker. Add onespatula measure of sodium chloride. Stir until all hasdissolved.
● Repeat until crystals of sodium chloride remainundissolved after a few minutes’ stirring. Note thenumber of spatula measures added.
● Ask pupils to suggest how this method could be improved.
Safety● Ask pupils to list the hazards involved in this
investigation.
● Pupils then decide how to minimise these hazards.
● They report back their ideas in a class discussion.
● Use their ideas to help list the safety issues on the board.
Brainstorming (1)● Arrange pupils in groups to consider this question:
● Ask one member of each group to report back their ideas.
● Use pupils’ ideas or add your own to cover a discussionof the type of solute, type of solvent and temperature.
Brainstorming (2)● Ask pupils to work in pairs to suggest how to make the
results more reliable.
● Pupils report back ideas to a class discussion. Emphasisethe concepts of repeating results and fair testing.
Suggested alternative starter activities (5–10 minutes)
Pupils answer questionsabout solubility.
Demonstrate how todetermine the solubility ofsodium chloride.
Discuss the hazards in thisinvestigation and howthey can be minimised.
What things might affectthe amount of solute thatdissolves in a solvent?
How can we get the mostreliable results?
Setting the context Introduce the Safety Brainstorming (1) Brainstorming (2)apparatus
QuestionsHow well will salt, sugar, flour and cookingoil dissolve in water?How well will each substance dissolve inwhite spirit or petrol?
QuestionWhat might affect the amount of a solutethat will dissolve in a solvent?

Sheet 1 of 2© Harcourt Education Ltd 2003 Catalyst 1This worksheet may have been altered from the original on the CD-ROM.
Running the activityPupils will need to have read the pupil book spread H1 ‘Pure salt’ before startingto plan this activity.
Show pupils the apparatus and hold a class discussion first, to cover the key ideasthat:
● salt dissolves in water● grit and sand do not dissolve in water● salt can be extracted from its solution by evaporation.
The rock salt can be pre-weighed to save time. 10 g of rock salt should dissolve in50 cm3 of water at room temperature.
Pupils then plan their experiments. Stress to pupils that:
● plans must be checked before they are carried out● no tasting allowed!● eye protection must be worn during heating● Bunsens must be turned off as soon as (or preferably before!) the salt starts
‘spitting’.
The pupils may need to leave their salt to finish evaporating for next lesson. It isvery important that the sand and grit and the pure salt are thoroughly dry beforeweighing. Any residual water will inflate the measured masses. They should be leftfor a couple of days. If possible, one set should be put in a dessicator, and theresults for this sample be used for class discussion.
Core: Pupils plan their own experiments. They are asked to work out thepercentage of pure salt they separate from the rock salt. If they subtract the massof rock residue from the mass of rock salt at the start they will be able to work outhow much pure salt they should have recovered (this assumes 100% recovery ofrock salt residue). Pupils also carry out a percentage calculation using their results,and evaluate their experiment.
Help: Pupils are shown the equipment set up rather than as separate items. Theyhave a writing frame to help them plan their experiment.
Other relevant materialSkill sheet 9: Safety in the labSkill sheet 12: Lighting a Bunsen burnerSkill sheet 33: Heating substances
ICT opportunitiesIt would be possible to set up a spreadsheet for the results and subsequentcalculations. Scatter graphs could then be produced to show the range of yields,allowing for a discussion of reasons for variation in yield/how to maximise yield.
Expected outcomesPupils gain practical experience of separation processes, and practice at planningtheir own experiments.
H1aTeacher
activity notesPure salt from rock salt
Practical Pupils plan and carry out their own experiment to extract pure salt from rock salt. Core, Help
Type Purpose Differentiation

Sheet 2 of 2© Harcourt Education Ltd 2003 Catalyst 1This worksheet may have been altered from the original on the CD-ROM.
PitfallsSpitting salt during evaporation – pupils should stop heating when crystals appearand leave the salt to finish evaporating for next lesson. If large numbers of pupilsare doing this experiment it can tie all the evaporating basins up!
Help: pupils can transfer their wet crystals into another container (Petri dish, if cold).
Core: pupils need to keep their salt on the evaporating basin for weighing later.
Safety notesEye protection should be worn. Usual precautions for heating. Spitting salt!
Answers Core:
(Mass of rock salt) – (mass of rock) is the theoretical maximum of pure saltthat could be recovered.
Pupil’s own result.
For example: washing residue out of the beaker; washing the residue in thefunnel; preventing spitting from evaporation.
a For example: use hot water to dissolve salt; more/longer stirring; morewater; washing sand and grit; repeating experiment with ‘waste’ sand andgrit.
b Do not have to pay for fuel to heat the salty water.
Help: Missing words are as follows:
a solvent; b soluble; c insoluble; d solute
H1aTeacher
activity notesPure salt from rock salt (continued)
3
1
2
4
1

Sheet 1 of 2© Harcourt Education Ltd 2003 Catalyst 1This worksheet may have been altered from the original on the CD-ROM.
Other relevant materialSkill sheet 9: Safety in the lab
Skill sheet 12: Lighting a Bunsen burner
Skill sheet 33: Heating substances
Equipment For each pupil/pair/group: ● rock salt● a beaker (250 ml or larger)● a stirrer● access to water● a filter funnel and paper● a flask● a Bunsen burner, mat, tripod and gauze● an evaporating basin● a measuring cylinder (50 ml or larger)● access to a balance
For your information Running the activityPupils will need to have read the pupil book spread H1 ‘Pure salt’ before starting toplan this activity.
Show pupils the apparatus and hold a class discussion first, to cover the key ideas that:
● salt dissolves in water● grit and sand do not dissolve in water● salt can be extracted from its solution by evaporation.
The rock salt can be pre-weighed to save time. 10 g of rock salt should dissolve in50 cm3 of water at room temperature.
Pupils then plan their experiments. Stress to pupils that:
● plans must be checked before they are carried out● no tasting allowed!● eye protection must be worn during heating● Bunsens must be turned off as soon as (or preferably before!) the salt starts ‘spitting’.
The pupils may need to leave their salt to finish evaporating for next lesson. It is veryimportant that the sand and grit and the pure salt are thoroughly dry before weighing.Any residual water will inflate the measured masses. They should be left for a couple ofdays. If possible, one set should be put in a dessicator, and the results for this samplebe used for class discussion.
Core: Pupils plan their own experiments. They are asked to work out the percentage ofpure salt they separate from the rock salt. If they subtract the mass of rock residuefrom the mass of rock salt at the start they will be able to work out how much puresalt they should have recovered (this assumes 100% recovery of rock salt residue).Pupils also carry out a percentage calculation using their results, and evaluate theirexperiment.
Help: Pupils are shown the equipment set up rather than as separate items. They havea writing frame to help them plan their experiment.
H1aTechnician
activity notesPure salt from rock salt
Practical Pupils plan and carry out their own experiment to extract pure salt from rock salt. Core, Help
Type Purpose Differentiation

Sheet 2 of 2© Harcourt Education Ltd 2003 Catalyst 1This worksheet may have been altered from the original on the CD-ROM.
Expected outcomesPupils gain practical experience of separation processes, and practice at planningtheir own experiments.
PitfallsSpitting salt during evaporation – pupils should stop heating when crystals appearand leave the salt to finish evaporating for next lesson. If large numbers of pupilsare doing this experiment it can tie all the evaporating basins up!
Help: pupils can transfer their wet crystals into another container (Petri dish, ifcold).
Core: pupils need to keep their salt on the evaporating basin for weighing later.
Safety notesEye protection should be worn. Usual precautions for heating. Spitting salt!
H1aTechnician
activity notesPure salt from rock salt (continued)

Sheet 1 of 2
H1a
© Harcourt Education Ltd 2003 Catalyst 1This worksheet may have been altered from the original on the CD-ROM.
ActivityCore
You can get pure salt from rock salt. We use pure salt on our food and for making medicines. If someone in your family wears contact lenses they probably keep them in saline solution, which is mainly salt and water!
Rock salt is dug out of the ground. It contains sand and grit mixed with the salt. You are going to plan an experiment to get the pure salt out of some rock salt.
EquipmentThis is the equipment you can use:
Planning Remember that salt dissolves in water. Sand and grit do not dissolve in water. You can get solid salt from salty water by evaporating the water away.
1 Write a set of instructions to show what you are going to do. You will need to weighout about 10 g of rock salt for the experiment. (Record the weight accurately.)You need to get as much pure salt as possible from the crushed rock salt.
Make it clear how you will:● dissolve the salt (what quantities of materials will you use?)● separate and dry the grit and sand (you will need to weigh this)● get the solid salt back at the end (you will need to weigh this).
Some of the pure salt can get lost if left in or on your equipment. To getthe maximum amount of pure salt you must lose as little as possible. As you write your plan, work out how you can improve it so you lose aslittle salt as possible.
2 Show your work to your teacher before you start your experiment.
Pure salt from rock salt
Take care whenevaporatingthe water.
!
Wear eye protection.
beaker andstirrer
filter funneland paper
balance
measuringcylinder
heatingapparatusflaskrock salt
evaporatingdish

Sheet 2 of 2
H1a
© Harcourt Education Ltd 2003 Catalyst 1This worksheet may have been altered from the original on the CD-ROM.
ActivityCore
Obtaining evidence 3 Carry out your plan.
Presenting the results4 Write down your results like this:
Mass of rock salt at the start � gMass of rock (sand and grit) removed � gMass of pure salt � g
Considering the evidence Use these results to work out how much salt it is possible to makeif you do not ‘lose’ any pure salt.
Mass of pure salt actually made � gCompare your answer to question 1 with the amount of pure saltyou actually made. What reasons can you give for the differencesyou see?Work out the percentage of salt in your rock salt like this:
Percentage of salt � � 100 %
EvaluatingHow could you improve your plan to get even more pure salt?Salt manufacturers use this process on a very big scale to makesalt for sale. The manufacturers have to get as much salt aspossible from the rock salt. They would aim to get a greaterpercentage of salt than you have extracted from your sample.a How could you adapt your experiment to get more salt from
the rock salt you started with?b In hot countries, salty water is left to evaporate in big salt pans
in the sun. Why is this way of making pure salt cheaper thangetting it from rock salt?
mass of saltmass of rock salt
Pure salt from rock salt (continued)
3
4
5
2
1

Sheet 1 of 2
H1a
© Harcourt Education Ltd 2003 Catalyst 1This worksheet may have been altered from the original on the CD-ROM.
ActivityHelp
You can get pure salt from rock salt. We use pure salt on our food and for making medicines.
Rock salt is dug out of the ground. It contains sand and grit mixed with the salt. You are going to plan an experiment to get the pure salt out of some rock salt.
EquipmentThis is the equipment you can use:
Planning 1 Write a set of instructions to show what you are going to do.
Use the Planning writing frame to help you.2 Show your work to your teacher before you start your experiment.
Obtaining evidence3 Carry out your plan.4 When your salt is dry, you can stick some onto black paper
using sticky tape.
Considering the evidenceCopy and complete the sentences using these words.
a Water is a good ...................................... because it can dissolve many solids.
b When water is mixed with rock salt, the salt dissolves because
it is .......................................
c The grit and sand do not dissolve. They are .......................................
d In this experiment, salt is called the ...................................... because it has dissolved in water.
Pure salt from rock salt
Take care whenevaporatingthe water.
!
Wear eye protection.
heatingapparatus
beaker
water
stirringrod
flask
rocksalt
evaporatingdish
filter funneland paper
soluteinsoluble soluble solvent
Never eatanything you havemade in the lab!
1
Sheet 2 of 2
H1a
© Harcourt Education Ltd 2003 Catalyst 1This worksheet may have been altered from the original on the CD-ROM.
ActivityHelp
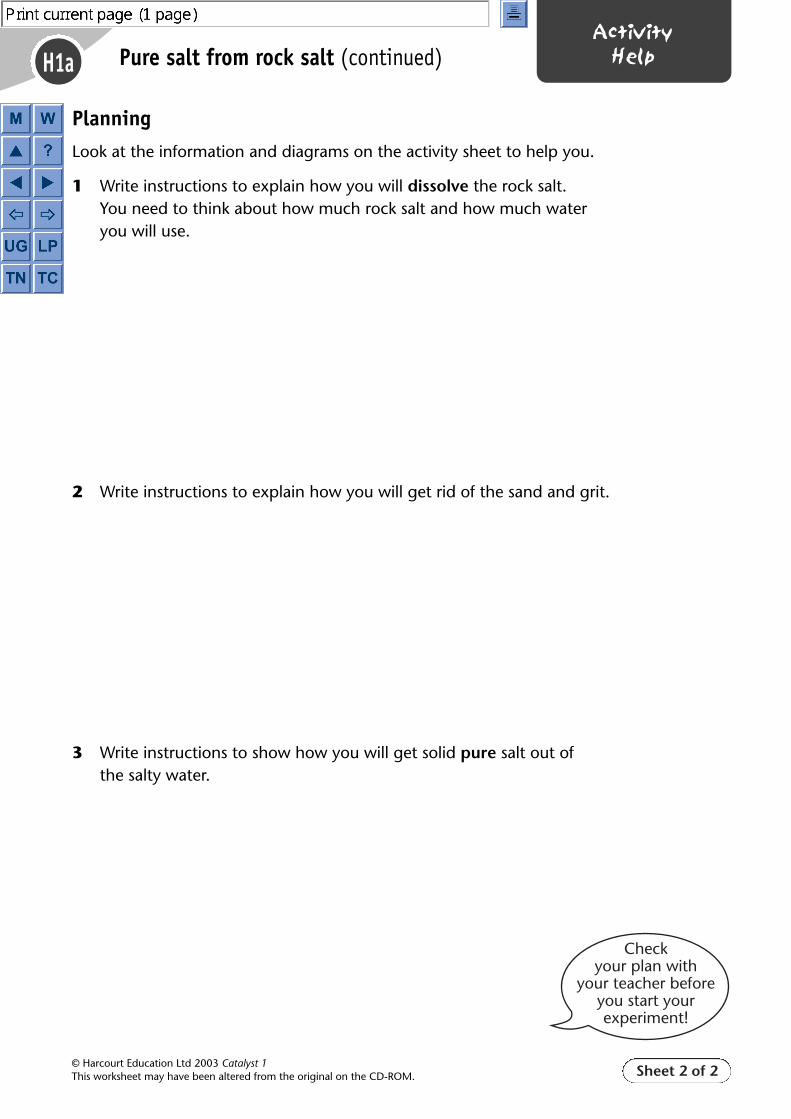
PlanningLook at the information and diagrams on the activity sheet to help you.
1 Write instructions to explain how you will dissolve the rock salt. You need to think about how much rock salt and how much water you will use.
2 Write instructions to explain how you will get rid of the sand and grit.
3 Write instructions to show how you will get solid pure salt out of the salty water.
Pure salt from rock salt (continued)
Checkyour plan with
your teacher beforeyou start yourexperiment!

Sheet 1 of 1© Harcourt Education Ltd 2003 Catalyst 1This worksheet may have been altered from the original on the CD-ROM.
Running the activityRemind pupils of the key terms: solution, evaporation, condensation, solute,solvent.
Pupils can follow the instructions, but care needs to be taken to:
● check apparatus before heating to make sure the flame will not heat the clampor the bung – the boiling tube needs to be angled to stop this
● ensure pupils wear eye protection during heating● ensure pupils turn off heat as soon as the sea water has evaporated, to avoid
cracking the boiling tube.
Other relevant materialSkill sheet 9: Safety in the lab
Skill sheet 12: Lighting a Bunsen burner
Skill sheet 33: Heating substances
Expected outcomesUnderstanding of the cycle of evaporation and condensation used in distillation.
PitfallsThe boiling tube must be angled to prevent the flame heating the clamp or thebung. The boiling tube may crack if pupils don’t turn off the heat when there isstill some sea water left.
Safety notesEye protection should be worn. Avoid heating an empty boiling tube and ensurethe bung and clamp are out of the flame.
Answers It is more important here that pupils make an estimate, than that they get the‘right’ answer. However, they should justify their estimate to explain whythey think it is reasonable.
a Water escapes from apparatus as steam from the end of the tube; somewater is left in the equipment. The inefficiency of the apparatus leads inwell to Activity H2b. Wrong answers regarding the salt having a volumemay be common and could form the basis for discussion with extensionpupils.
b Pupil’s diagram.
For example: Sea water contains a solution of salt dissolved in water. Whensea water boils pure water evaporates to make steam and the salt is leftbehind. When steam cools down it condenses and turns back into water.
a A b C c D d B
H2aTeacher
activity notesPure water from sea water
Practical Pupils carry out a small-scale distillation of salt water using a simple tube as the Corecondenser.
Type Purpose Differentiation
3
1
2
4

Sheet 1 of 1© Harcourt Education Ltd 2003 Catalyst 1This worksheet may have been altered from the original on the CD-ROM.
Other relevant materialSkill sheet 9: Safety in the lab
Skill sheet 12: Lighting a Bunsen burner
Skill sheet 33: Heating substances
Equipment
For each group:
● sea water (salt solution is fine – about three tablespoons in a litre)● a boiling tube● a bung and delivery tube (as in the diagram)● a test tube● a beaker● a clamp and stand● a Bunsen and mat
For your information Running the activityRemind pupils of the key terms: solution, evaporation, condensation, solute, solvent.
Pupils can follow the instructions, but care needs to be taken to:
● check apparatus before heating to make sure the flame will not heat the clampor the bung – the boiling tube needs to be angled to stop this
● ensure pupils wear eye protection during heating● ensure pupils turn off heat as soon as the sea water has evaporated, to avoid
cracking the boiling tube.
Expected outcomesUnderstanding of the cycle of evaporation and condensation used in distillation.
PitfallsThe boiling tube must be angled to prevent the flame heating the clamp or thebung. The boiling tube may crack if pupils don’t turn off the heat when there isstill some sea water left.
Safety notesEye protection should be worn. Avoid heating an empty boiling tube and ensurethe bung and clamp are out of the flame.
H2aTechnician
activity notesPure water from sea water
Practical Pupils carry out a small-scale distillation of salt water using a simple tube as the Corecondenser.
Type Purpose Differentiation
boiling tube
beaker tapwater
testtube
tripod
seawater
delivery tube
heat
fit one-hole stopperto fit boiling tubes
7 cm
6 cm15 cm
~115°
Sheet 1 of 2
H2a
© Harcourt Education Ltd 2003 Catalyst 1This worksheet may have been altered from the original on the CD-ROM.
ActivityCore
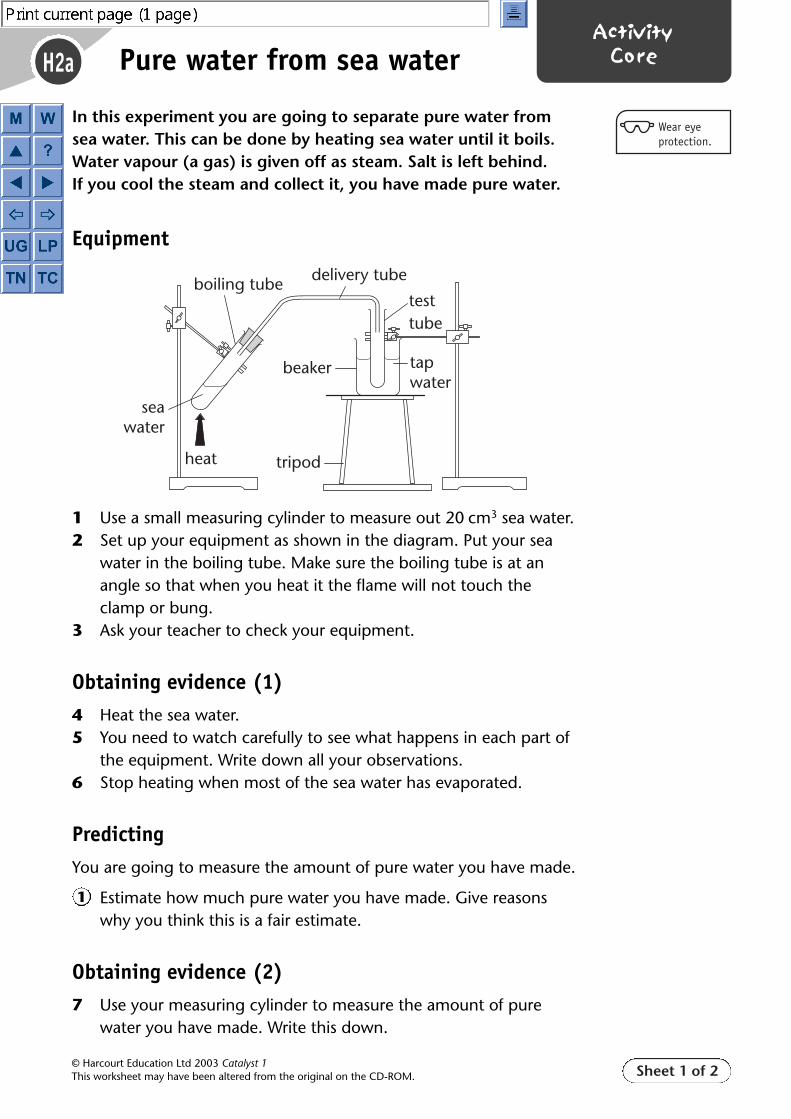
In this experiment you are going to separate pure water fromsea water. This can be done by heating sea water until it boils.Water vapour (a gas) is given off as steam. Salt is left behind. If you cool the steam and collect it, you have made pure water.
Equipment
1 Use a small measuring cylinder to measure out 20 cm3 sea water.2 Set up your equipment as shown in the diagram. Put your sea
water in the boiling tube. Make sure the boiling tube is at anangle so that when you heat it the flame will not touch theclamp or bung.
3 Ask your teacher to check your equipment.
Obtaining evidence (1)4 Heat the sea water.5 You need to watch carefully to see what happens in each part of
the equipment. Write down all your observations.6 Stop heating when most of the sea water has evaporated.
Predicting You are going to measure the amount of pure water you have made.
Estimate how much pure water you have made. Give reasonswhy you think this is a fair estimate.
Obtaining evidence (2)7 Use your measuring cylinder to measure the amount of pure
water you have made. Write this down.
Pure water from sea water
Wear eye protection.
boiling tube
beaker tapwater
testtube
tripod
seawater
delivery tube
heat
1

Sheet 2 of 2
H2a
© Harcourt Education Ltd 2003 Catalyst 1This worksheet may have been altered from the original on the CD-ROM.
ActivityCore
Considering the evidence You started with 10 cm3 of sea water. a Make a list of reasons why there is not 10 cm3 of pure water
collected at the end. b Use ideas from your observations to draw a diagram to show
where water has been lost during your experiment.Write a few sentences to explain how your experiment works.Use these words in your answer.
Which diagram shows the particles in:a salt solutionb pure saltc pure waterd steam?
Pure water from sea water (continued)
2
3
4
evaporatescoolscondenses heat
solution steam
A B C D
Sheet 1 of 1© Harcourt Education Ltd 2003 Catalyst 1This worksheet may have been altered from the original on the CD-ROM.
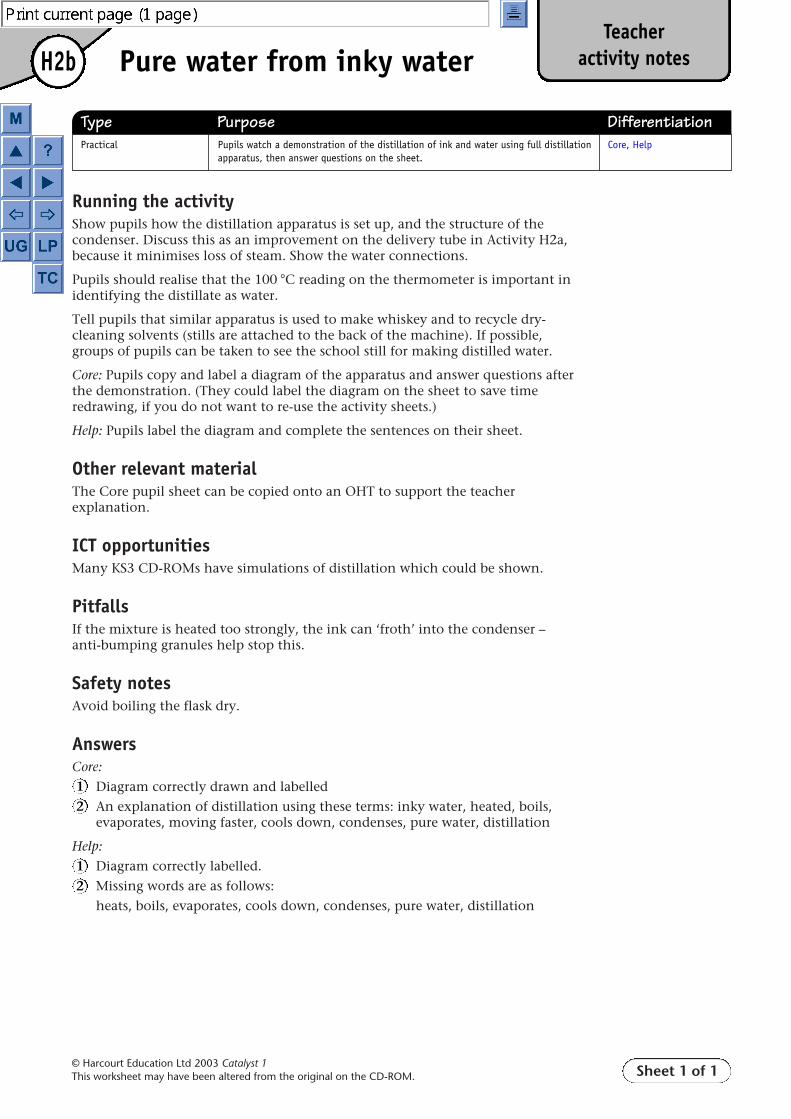
Running the activityShow pupils how the distillation apparatus is set up, and the structure of thecondenser. Discuss this as an improvement on the delivery tube in Activity H2a,because it minimises loss of steam. Show the water connections.
Pupils should realise that the 100 °C reading on the thermometer is important inidentifying the distillate as water.
Tell pupils that similar apparatus is used to make whiskey and to recycle dry-cleaning solvents (stills are attached to the back of the machine). If possible,groups of pupils can be taken to see the school still for making distilled water.
Core: Pupils copy and label a diagram of the apparatus and answer questions afterthe demonstration. (They could label the diagram on the sheet to save timeredrawing, if you do not want to re-use the activity sheets.)
Help: Pupils label the diagram and complete the sentences on their sheet.
Other relevant materialThe Core pupil sheet can be copied onto an OHT to support the teacherexplanation.
ICT opportunitiesMany KS3 CD-ROMs have simulations of distillation which could be shown.
PitfallsIf the mixture is heated too strongly, the ink can ‘froth’ into the condenser – anti-bumping granules help stop this.
Safety notesAvoid boiling the flask dry.
Answers Core:
Diagram correctly drawn and labelled
An explanation of distillation using these terms: inky water, heated, boils,evaporates, moving faster, cools down, condenses, pure water, distillation
Help:
Diagram correctly labelled.
Missing words are as follows:
heats, boils, evaporates, cools down, condenses, pure water, distillation
H2bTeacher
activity notesPure water from inky water
Practical Pupils watch a demonstration of the distillation of ink and water using full distillation Core, Helpapparatus, then answer questions on the sheet.
Type Purpose Differentiation
1
2
1
2

Sheet 1 of 1© Harcourt Education Ltd 2003 Catalyst 1This worksheet may have been altered from the original on the CD-ROM.
Other relevant materialThe Core pupil sheet can be copied onto an OHT to support the teacherexplanation.
Equipment needed
● full distillation apparatus with thermometer, condenser and vessel forcollecting water
● clamps and stands ● ink and water (dilute, but enough ink for definite colour)● tripod, gauze, Bunsen and mat
For your information Running the activityShow pupils how the distillation apparatus is set up, and the structure of thecondenser. Discuss this as an improvement on the delivery tube in Activity H2a,because it minimises loss of steam. Show the water connections.
Pupils should realise that the 100 °C reading on the thermometer is important inidentifying the distillate as water.
Tell pupils that similar apparatus is used to make whiskey and to recycle dry-cleaning solvents (stills are attached to the back of the machine). If possible,groups of pupils can be taken to see the school still for making distilled water.
Core: Pupils copy and label a diagram of the apparatus and answer questions afterthe demonstration. (They could label the diagram on the sheet to save timeredrawing, if you do not want to re-use the activity sheets.)
Help: Pupils label the diagram and complete the sentences on their sheet.
PitfallsIf the mixture is heated too strongly, the ink can ‘froth’ into the condenser – anti-bumping granules help stop this.
Safety notesAvoid boiling the flask dry.
H2bTechnician
activity notesPure water from inky water
Practical Pupils watch a demonstration of the distillation of ink and water using full distillation Core, Helpapparatus, then answer questions on the sheet.
Type Purpose Differentiation
Sheet 1 of 1
H2b
© Harcourt Education Ltd 2003 Catalyst 1This worksheet may have been altered from the original on the CD-ROM.
ActivityCore
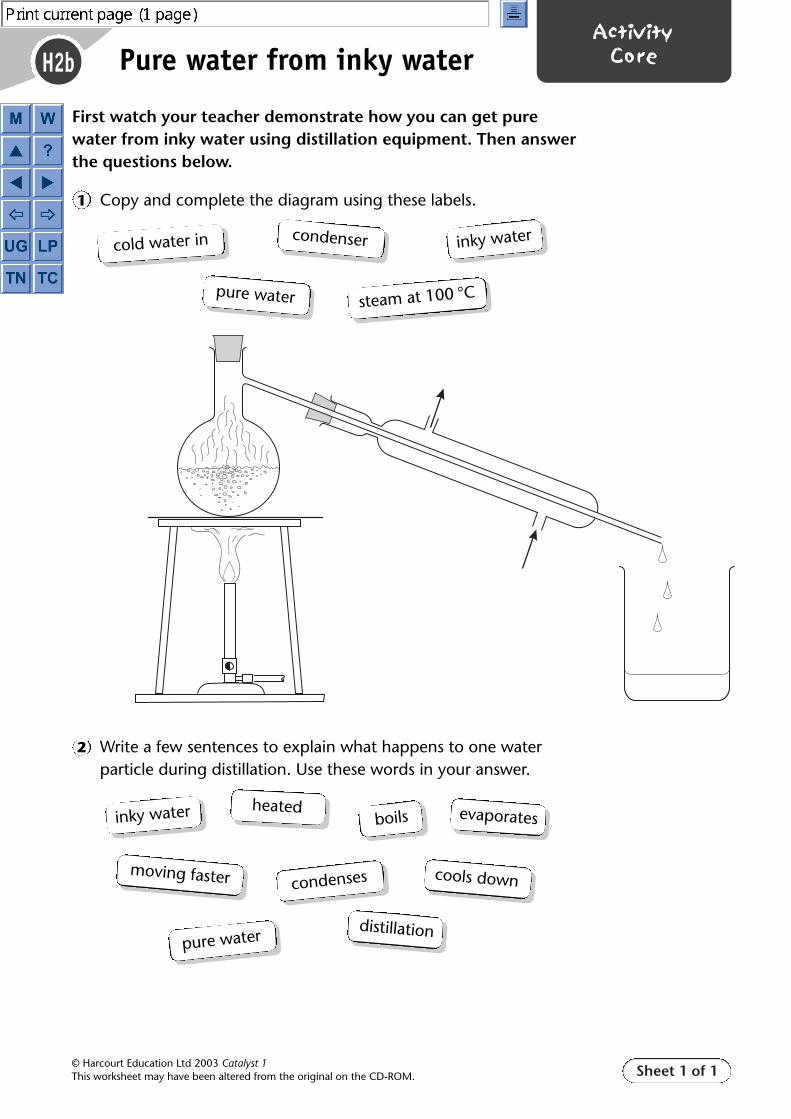
First watch your teacher demonstrate how you can get purewater from inky water using distillation equipment. Then answerthe questions below.
Copy and complete the diagram using these labels.
Write a few sentences to explain what happens to one waterparticle during distillation. Use these words in your answer.
Pure water from inky water
condenser inky watercold water in
pure water steam at 100 °C
condenses
heated
pure water
inky water
distillation
boils evaporates
moving faster cools down
2
1

Sheet 1 of 1
H2b
© Harcourt Education Ltd 2003 Catalyst 1This worksheet may have been altered from the original on the CD-ROM.
ActivityHelp
First watch your teacher demonstrate how you can get pure water from inky water using distillation equipment. Then answer the questions below.
Write these labels on the diagram below.
Complete the sentences using the words below.
The teacher .................................................. the inky water until it .................................................. .
The water .................................................. to make steam but the ink gets left behind.
The steam .................................................. in the condenser and ..................................................
to make .................................................. . This is called .................................................. .
Pure water from inky water
condenser inky watercold water in
pure water steam at 100 °C
condenses pure water
distillation
boilsevaporates
cools down
2
1
heats

Sheet 1 of 1© Harcourt Education Ltd 2003 Catalyst 1This worksheet may have been altered from the original on the CD-ROM.
Running the activityFirst demonstrate how to set up the chromatogram. The pupils can then set uptheir own using the instructions on the sheet.The felt-tip pens need to have water-soluble ink, but it is interesting if onechromatogram is run using permanent ink. The teacher can do this, or eachworking group can use permanent ink for one ‘dot’ – this will make a discussionpoint as to why this dot did not move.
Expected outcomesPupils know how to set up and interpret chromatograms.
PitfallsPupils need to be warned not to let their dots go into the solvent!
Answers Core:
From pupils’ results. A clear table with number of dyes listed.
From pupils’ results. Pupils need to realise that the same dye will travel up thepaper the same distance.
Labelled sketch of chromatogram to show:a the ink that contains most different dyesb the dye that has travelled furthestc the dye that has travelled least.
Extension:
An explanation that links the distance a spot travelled to its solubility inwater, using the terms solute, solvent, more soluble and less soluble.
H3aTeacher
activity notesWhat dyes are used in felt-tip pens?
Practical Pupils use chromatography to separate dyes in felt-tip pens. Core (Extension)
Type Purpose Differentiation
3
12
4

Sheet 1 of 1© Harcourt Education Ltd 2003 Catalyst 1This worksheet may have been altered from the original on the CD-ROM.
Equipment needed For each group:
● a beaker (to fit filter paper)● a splint (to fit across top of beaker)● paper clips● filter paper cut so that it reaches the bottom of the beaker and can be folded
over and clipped to the splint● water● pencil and ruler● felt-tip pens (water-soluble type) – a range of dark colours work best, e.g. black,
brown, dark blue ● a permanent ink pen
For your information Running the activityFirst demonstrate how to set up the chromatogram. The pupils can then set uptheir own using the instructions on the sheet.
The felt-tip pens need to have water-soluble ink, but it is interesting if onechromatogram is run using permanent ink. The teacher can do this, or eachworking group can use permanent ink for one ‘dot’ – this will make a discussionpoint as to why this dot did not move.
Expected outcomesPupils know how to set up and interpret chromatograms.
PitfallsPupils need to be warned not to let their dots go into the solvent!
H3aTechnician
activity notesWhat dyes are used in felt-tip pens?
Practical Pupils use chromatography to separate dyes in felt-tip pens. Core (Extension)
Type Purpose Differentiation

Sheet 1 of 2
H3a
© Harcourt Education Ltd 2003 Catalyst 1This worksheet may have been altered from the original on the CD-ROM.
ActivityCore
You are going to use chromatography to find out what dyes havebeen used in some felt-tip pens. A felt-tip pen ink can containseveral coloured dyes. For example, a green ink felt-tip pen cancontain blue dye and yellow dye.
Your teacher will first demonstrate what you are going to do. Thenyou can follow these steps.
1 Draw a pencil line 1.5 cm from the bottom of your filter paper.Draw pencil crosses on the line, one for each colour felt-tip penyou will test.
2 Make clear dots with different felt-tip pens on the pencil crosses –you will probably have room for about four colours (darkercolours like brown, black and dark blue work best).
3 Label each colour in pencil below the line.
4 Set up your chromatogram so that the paper just touches thebottom of the beaker. Fold the paper over a splint and make surethe top is held firmly in the paper clip. If there is too much paper folded over, you can cut it off using scissors.
5 Take your paper out of the beaker again.
6 Pour water in the beaker until it is 1 cm deep.
7 Carefully put your paper back into the beaker so that the bottomis in the water, but the ink dots are above it (see the diagram).
8 Watch the water as it travels up the paper. Take your paper outwhen the water is about 1 cm from the top. Leave it flat to dry.
Presenting the evidence9 When your chromatogram is dry you can stick it in your book.
What dyes are used in felt-tip pens?
dots of felt tip pen
1.5 cm
pencil line
filter paper
paper clip
filter paper
water belowdots
splint
Donot put any
water in yourbeaker yet!
Makesure your ink dotsdo not go in thewater when you
do this!

H3a
Sheet 2 of 2© Harcourt Education Ltd 2003 Catalyst 1This worksheet may have been altered from the original on the CD-ROM.
ActivityCore
Considering the evidenceMake a table to show how many different coloured dyes were ineach felt-tip pen ink.Did different felt-tip pens contain the same dyes? How can youtell?Make a sketch of your finished chromatogram. Draw labels onthe chromatogram to show:a the felt-tip pen ink that contains most different dyesb the dye that is most soluble in waterc the dye that is least soluble in water.
What dyes are used in felt-tip pens?(continued)
Write a few sentences to explain why the dyes have moveddifferent distances up the paper. Use these words in your answer:
2
3
4
1
solute solvent more soluble less soluble
�Extension

Sheet 1 of 1© Harcourt Education Ltd 2003 Catalyst 1This worksheet may have been altered from the original on the CD-ROM.
Running the activityPrepare a set of cards (possibly laminated) for each group, using the activitysheets. These cards give the evidence of ten people in some way connected withthe murder enquiry. Groups need to make notes, so you could also provideprepared worksheets to record evidence, theories and justification.
1 Introduce the activity: Scientific investigation is like detective work – theanswer is not always clear, so look for evidence, form a theory and see if it fitsall the evidence. If more evidence comes along, check the theory still works.
2 Give out the evidence cards 1–6 for pupils to consider.3 Pupils write down their accusation and reasons.4 Discuss, then give out card 7.5 When requested, give out cards 8 and 9.6 Discuss, then give out card 10.7 Discuss possible scenarios and the pupils’ conclusions: see sample results,
questions and answers below.8 Follow up the activity with a plenary (see below).
Sample resultsThis is the premise the story was based on: Alfred Dunnet is fed up with his lifeand wants to run away and start again. He meets a tramp whilst out shooting,murders him, removes (and buries) the head, keeps some blood in a bottle to pouron the carpet and then sets the whole thing up. He leaves through the window.
This can be written down and sealed in an envelope. If the pupils get it, one ofthem could read it out and the group be congratulated!
The trouble with (and the strength of) this exercise is that there are many otherexplanations – just like real life. Where pupils want to know more about aparticular avenue of investigation, encourage them to clarify exactly what theywant to find out and what they need to do to answer their question. Drawparallels between this process and planning for further investigative work. Sadly,the bases are not all covered, and although many unexpected queries might besatisfied by ad-libbing, take care to avoid contradictions with other evidence.
Questions and answers1 What happened when you got extra evidence? (Theory changed.)2 Why was your first suspicion wrong? (Didn’t have all the evidence.)3 Why was your second suspicion wrong? (The evidence was misleading.)4 How certain are you now that the culprit has been caught? (Hopefully, unsure.
There are still unanswered questions.)
PlenaryHow does this relate to the way scientific theories are developed (e.g. the particletheory)? The Greeks had a theory that everything was made of earth/air/fire/water, but they didn’t have good evidence for it. As more and more peopleaccepted the idea, it became harder to challenge the theory (link to Galileo vs.Church here). When incontrovertible evidence was presented, people had to(reluctantly in many cases) change their ideas.
Expected outcomesPupils consider evidence and commit themselves to a prediction based onreasons. On presentation of further evidence, pupils revise their reasoning andpredictions. Pupils consider the reliability of their conclusions.
H4aTeacher
activity notesMurder at Hiney Hall
Paper Pupils use evidence to work out who committed the crime. Core
Type Purpose Differentiation

Sheet 1 of 2
H4a
© Harcourt Education Ltd 2003 Catalyst 1This worksheet may have been altered from the original on the CD-ROM.
ActivityCoreMurder at Hiney Hall
1 Sergeant Perry, officer in charge at the scene. I was summoned to the house and arrived at 10.30 p.m. Mr Alfred Dunnet was dead on the floor of the study. He had been shot in the back and his head had been chopped off. There was a great deal of blood on the carpet, but no sign of the head. The lock on the door of the study showed signs of having been forced in. The window was open.
2 Mr Roger Hare, the butler. I have been with the family for three years. I had been reading a murder mystery novel in my room since eight o'clock when I heard a shot at about nine fifteen. I immediately came downstairs and found the study door open with Mr James standing over Mr Alfred's body. He had a smile on his face. I suggested that we should telephone for the police, and he did so. The window was open. As Mr James finished on the telephone, Mr Toby walked in, covered in blood. I went and called for Miss Virginia and sent the maid for Mrs Dunnet, who had gone to bed early.
5 Mr Toby Dunnet, son of Mr and Mrs Alfred Dunnet. I had had a rattling row with father at tea time, all about which university he wants me to go to. Aberdeen simply won't do, just because he went there. I went out hunting to get some space, brought down a stag but it was a poor shot, didn't kill the beast outright. I had to put the poor beast out of its misery with a shot to the head, which is why I'm covered in all this blood. Poor old father, eh? What bad luck.
4 Mrs Alice Dunnet, wife of Alfred Dunnet. I was in bed asleep at the time it all happened. I must confess that I had gone to bed with a headache after the steaming great row that Alfred and Toby had this evening. When Hare came and woke me up I came down to the study. I saw Alfred in his favourite waistcoat that was only washed the other day, horribly mutilated on the floor, the poor man. You must catch the fiend that did this!
3 Mr James Dunnet, brother of Mr Alfred Dunnet. I was in the stables a bit after nine o’clock when I heard a single shot from the house. I rushed back inside and went to the study to find out from Alfred what was going on – the study is where Alfred keeps – I mean kept – his guns. There he was, stone dead on the floor. I was still standing there thinking that someone had done me a whacking great favour a few minutes later when Hare rushes in, takes one look and starts blathering about calling the police, so I did. At least with him gone I won't always be going begging for a few pounds – he inherited everything you know so I have to ask him whenever I need a few bob.
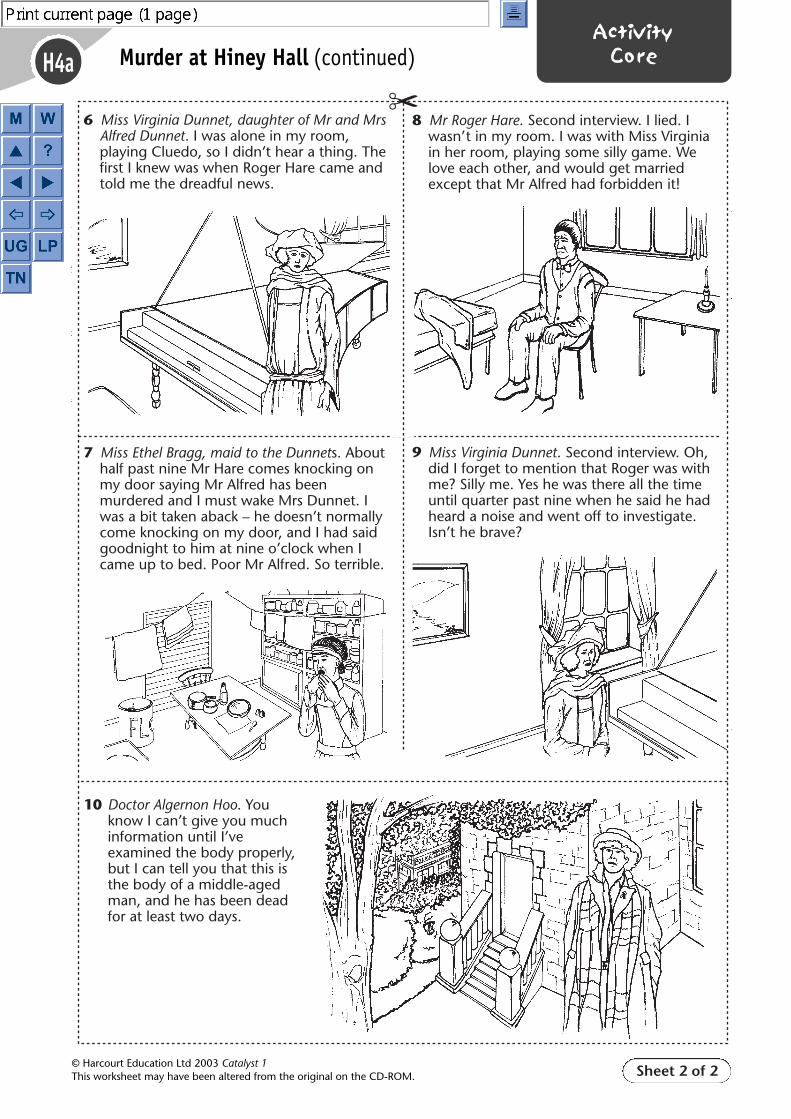
Sheet 2 of 2
H4a
© Harcourt Education Ltd 2003 Catalyst 1This worksheet may have been altered from the original on the CD-ROM.
ActivityCoreMurder at Hiney Hall (continued)
6 Miss Virginia Dunnet, daughter of Mr and Mrs Alfred Dunnet. I was alone in my room, playing Cluedo, so I didn’t hear a thing. The first I knew was when Roger Hare came and told me the dreadful news.
7 Miss Ethel Bragg, maid to the Dunnets. About half past nine Mr Hare comes knocking on my door saying Mr Alfred has been murdered and I must wake Mrs Dunnet. I was a bit taken aback – he doesn’t normally come knocking on my door, and I had said goodnight to him at nine o’clock when I came up to bed. Poor Mr Alfred. So terrible.
10 Doctor Algernon Hoo. You know I can’t give you much information until I’ve examined the body properly, but I can tell you that this is the body of a middle-aged man, and he has been dead for at least two days.
9 Miss Virginia Dunnet. Second interview. Oh, did I forget to mention that Roger was with me? Silly me. Yes he was there all the time until quarter past nine when he said he had heard a noise and went off to investigate. Isn’t he brave?
8 Mr Roger Hare. Second interview. I lied. I wasn’t in my room. I was with Miss Virginia in her room, playing some silly game. We love each other, and would get married except that Mr Alfred had forbidden it!

Sheet 1 of 1© Harcourt Education Ltd 2003 Catalyst 1This worksheet may have been altered from the original on the CD-ROM.
Running the activityFirst demonstrate the technique of making a saturated solution, reinforcing thekey terms solute, solvent and saturated.
Remind pupils that, as they are weighing their solute, it is very important they donot spill any during the experiment.
The value for the solubility of potassium chloride is 35 g in 100 cm3 of water.
Expected outcomesPupils understand saturated solutions.
AnswersCore:
Pupils’ diagrams should show that in B some particles of potassium chlorideare drawn in ‘spaces’ between water particles, and in C all the spaces are fullwith particles.
Ideas include: take averages, more repeats.
Extension:
a and b Pupils’ own results.
c Reasons include: The potassium chloride may not be pure, it may be damp(data book values use anhydrous salts), the experimental technique makesit difficult to add exactly the right amount.
H5aTeacher
activity notesHow much solid will dissolve?
Practical Pupils find out how much potassium chloride dissolves in 10 cm3 of water. Core (Extension)
Type Purpose Differentiation
3
1
2

Sheet 1 of 1© Harcourt Education Ltd 2003 Catalyst 1This worksheet may have been altered from the original on the CD-ROM.
Equipment For each pair/group:● a boiling tube with fitting bung● a rack● potassium chloride and tablespoon● a spatula● water● a 10 ml measuring cylinder● filter paper/paper to weigh out solid● a balance
For your information Running the activityFirst demonstrate the technique of making a saturated solution, reinforcing thekey terms solute, solvent and saturated.
Remind pupils that, as they are weighing their solute, it is very important they donot spill any during the experiment.
The value for the solubility of potassium chloride is 35 g in 100 cm3 of water.
Expected outcomesPupils understand saturated solutions.
H5aTechnician
activity notesHow much solid will dissolve?
Practical Pupils find out how much potassium chloride dissolves in 10 cm3 of water. Core (Extension)
Type Purpose Differentiation
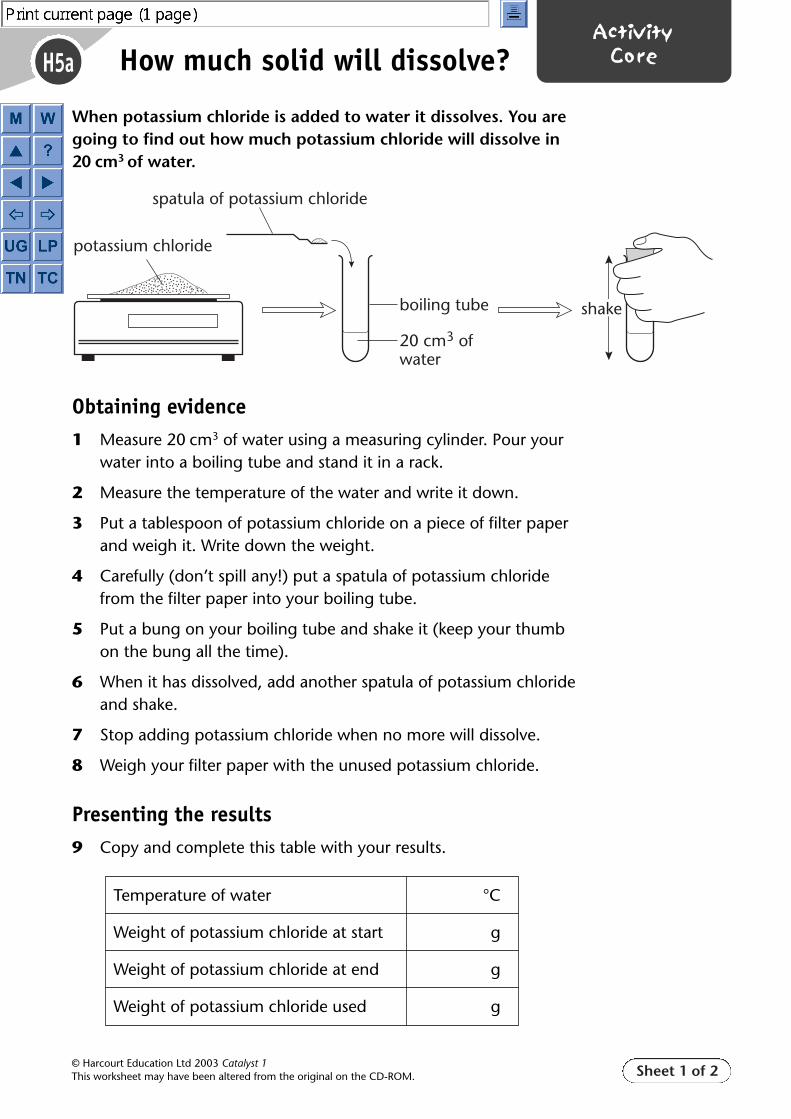
Sheet 1 of 2
H5a
© Harcourt Education Ltd 2003 Catalyst 1This worksheet may have been altered from the original on the CD-ROM.
ActivityCore
When potassium chloride is added to water it dissolves. You aregoing to find out how much potassium chloride will dissolve in20 cm3 of water.
Obtaining evidence1 Measure 20 cm3 of water using a measuring cylinder. Pour your
water into a boiling tube and stand it in a rack.
2 Measure the temperature of the water and write it down.
3 Put a tablespoon of potassium chloride on a piece of filter paperand weigh it. Write down the weight.
4 Carefully (don’t spill any!) put a spatula of potassium chloridefrom the filter paper into your boiling tube.
5 Put a bung on your boiling tube and shake it (keep your thumbon the bung all the time).
6 When it has dissolved, add another spatula of potassium chlorideand shake.
7 Stop adding potassium chloride when no more will dissolve.
8 Weigh your filter paper with the unused potassium chloride.
Presenting the results 9 Copy and complete this table with your results.
How much solid will dissolve?
potassium chloride
boiling tube
spatula of potassium chloride
20 cm3 ofwater
shake
Temperature of water °C
Weight of potassium chloride at start g
Weight of potassium chloride at end g
Weight of potassium chloride used g

Sheet 2 of 2
H5a
© Harcourt Education Ltd 2003 Catalyst 1This worksheet may have been altered from the original on the CD-ROM.
ActivityCore
Considering the evidence When no more potassium chloride will dissolve in the water, thesolution is saturated.
Which of these diagrams best shows how the particles arearranged in a saturated solution?
Evaluating10 Compare your results with other pupils who have carried out the
same experiment.
What could you do to get a more reliable value for how muchpotassium chloride dissolves?
How much solid will dissolve? (continued)
A B C D
Solubilities (how much solid dissolves) are usually given ing/100 cm3 (grams in 100 cm3 of water).a How much potassium chloride dissolved in how much water
in your experiment?b Work out how much potassium chloride would dissolve in
100 cm3.c Your teacher will tell you the ‘book value’. How does your
value compare? Give some reasons why you think the twovalues are different.
3
1
2
�Extension

Sheet 1 of 1© Harcourt Education Ltd 2003 Catalyst 1This worksheet may have been altered from the original on the CD-ROM.
Running the activityDiscuss with pupils the style of poster to be produced. The aim is to produce anexplanation using ideas about particles for each challenge. A strip-cartoon issuggested as the best way of getting the information across.
Pupils could work individually or in ability pairs. Hand out the appropriatechallenge cards (Core, Help and Extension). Pupils need to plan in rough whatthey are going to include on their posters. They may need some support to helpclarify their ideas, but try to avoid ‘telling them the answers’ early on – the idea isthat they think the challenges through themselves.
The posters can be produced as paper collages using coloured circles for particles –this is easier for the pupils than trying to draw them. A template is provided forthis on the Resource sheet.
Two challenges (1 and 7) mention materials that the pupils may not havehandled before. Have some marble chips and some clay and water available sothat pupils can handle them if they want to. In particular, pupils following theclay suspension activity will need to see what a clay suspension looks like.
ICT opportunitiesPupils can produce word processed speech bubbles or explanations to cut andstick on their posters.
H5bTeacher
activity notesPoster challenge
Paper Pupils are given ‘challenge cards’ which they use to produce strip-cartoon posters to Core, Help, Extension explain their challenges in terms of particles. Resource
Type Purpose Differentiation

Sheet 1 of 1© Harcourt Education Ltd 2003 Catalyst 1This worksheet may have been altered from the original on the CD-ROM.
Equipment Materials for making posters: ● sugar paper or similar● white paper● pens, scissors, glue sticks● circles cut from templates in at least four colours (several sheets can be cut at
once)
Materials for pupils to handle:● marble chips● a small piece of clay ● beakers of water
For your information Running the activityDiscuss with pupils the style of poster to be produced. The aim is to produce anexplanation using ideas about particles for each challenge. A strip-cartoon issuggested as the best way of getting the information across.
Pupils could work individually or in ability pairs. Hand out the appropriatechallenge cards (Core, Help and Extension). Pupils need to plan in rough whatthey are going to include on their posters. They may need some support to helpclarify their ideas, but try to avoid ‘telling them the answers’ early on – the idea isthat they think the challenges through themselves.
The posters can be produced as paper collages using coloured circles for particles –this is easier for the pupils than trying to draw them. A template is provided forthis on the Resource sheet.
Two challenges (1 and 7) mention materials that the pupils may not havehandled before. Have some marble chips and some clay and water available sothat pupils can handle them if they want to. In particular, pupils following theclay suspension activity will need to see what a clay suspension looks like.
H5bTechnician
activity notesPoster challenge
Paper Pupils are given ‘challenge cards’ which they use to produce strip-cartoon posters Core, Help, Extensionto explain their challenges in terms of particles. Resource
Type Purpose Differentiation
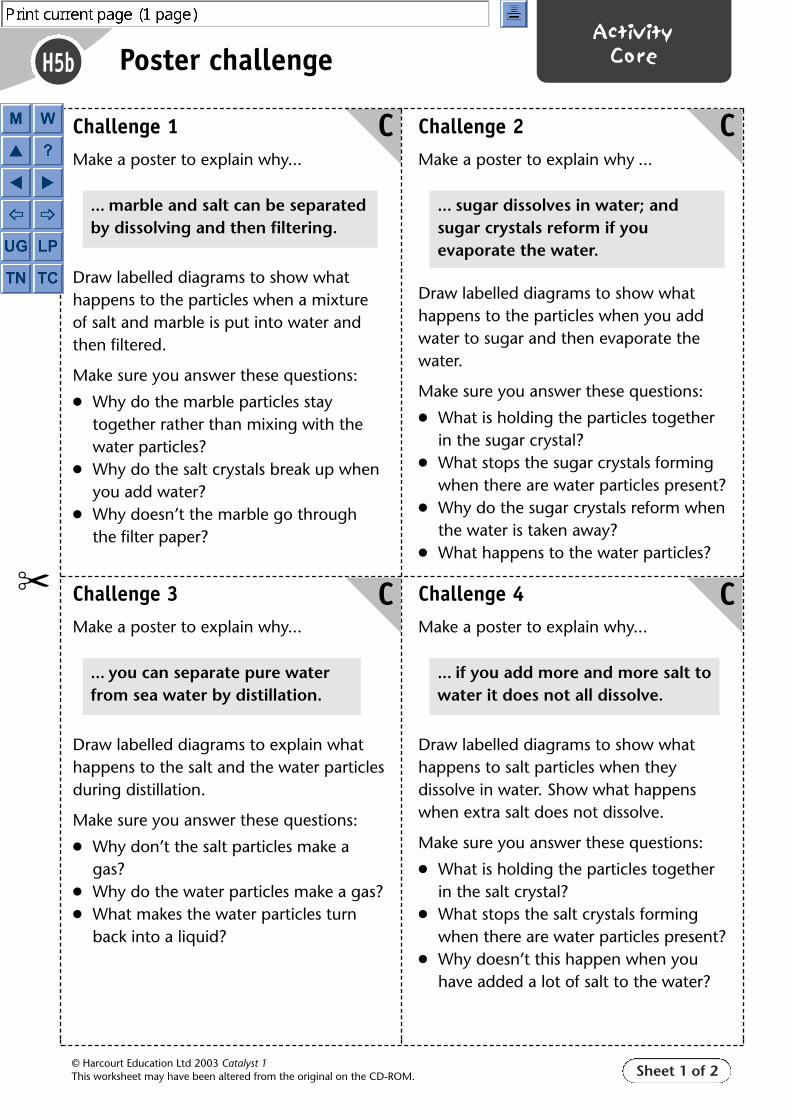
Sheet 1 of 2
H5b
© Harcourt Education Ltd 2003 Catalyst 1This worksheet may have been altered from the original on the CD-ROM.
ActivityCore
Challenge 1Make a poster to explain why...
Draw labelled diagrams to show whathappens to the particles when a mixtureof salt and marble is put into water andthen filtered.
Make sure you answer these questions:
● Why do the marble particles staytogether rather than mixing with thewater particles?
● Why do the salt crystals break up whenyou add water?
● Why doesn’t the marble go throughthe filter paper?
Poster challenge
... marble and salt can be separatedby dissolving and then filtering.
C
�
�
Challenge 2Make a poster to explain why ...
Draw labelled diagrams to show whathappens to the particles when you addwater to sugar and then evaporate thewater.
Make sure you answer these questions:
● What is holding the particles togetherin the sugar crystal?
● What stops the sugar crystals formingwhen there are water particles present?
● Why do the sugar crystals reform whenthe water is taken away?
● What happens to the water particles?
... sugar dissolves in water; andsugar crystals reform if youevaporate the water.
C
Challenge 3Make a poster to explain why...
Draw labelled diagrams to explain whathappens to the salt and the water particlesduring distillation.
Make sure you answer these questions:
● Why don’t the salt particles make agas?
● Why do the water particles make a gas? ● What makes the water particles turn
back into a liquid?
... you can separate pure waterfrom sea water by distillation.
C Challenge 4Make a poster to explain why...
Draw labelled diagrams to show whathappens to salt particles when theydissolve in water. Show what happenswhen extra salt does not dissolve.
Make sure you answer these questions:
● What is holding the particles togetherin the salt crystal?
● What stops the salt crystals formingwhen there are water particles present?
● Why doesn’t this happen when youhave added a lot of salt to the water?
C
... if you add more and more salt towater it does not all dissolve.

Sheet 2 of 2
H5b
© Harcourt Education Ltd 2003 Catalyst 1This worksheet may have been altered from the original on the CD-ROM.
ActivityHelp/ExtensionPoster challenge (continued)
Challenge 5Make a poster to explain why...
Draw labelled diagrams of the sugarparticles and the water particles beforeand after dissolving.
Make sure you answer these questions:
● How are the sugar particles arranged inthe sugar crystal?
● How are the water particles arranged inpure water?
● How are the sugar and the waterparticles arranged in the sugarsolution?
H
�
�
Challenge 6Make a poster to explain why ...
Draw labelled diagrams of the waterparticles and the salt particles before andafter evaporation.
Make sure you answer these questions:
● How are the salt and the water particlesarranged in the sea water?
● How are the salt particles arranged inthe salt crystal?
● Where do the water particles go?
H
Challenge 7Make a poster to explain why...
A suspension is when there are tinyparticles of solid in the liquid. They are notdissolved but they do not settle.Suspensions look cloudy.
Draw labelled diagrams to explain whathappens to the particles when clay forms asuspension.
Make sure you answer these questions:● What keeps the clay particles together? ● What stops the bits of clay dissolving? ● What stops the bits of clay from settling
out?
E Challenge 8Make a poster to explain why ...
Draw labelled diagrams to show whathappens the four types of particle (red ink,yellow ink, paper and water) duringchromatography.
Make sure you think about the attractionsbetween the different types of particles.
● Which are stronger? ● Which are weaker?
Don’t forget the paper!
E
... sugar dissolves in water. ... water evaporates from sea water,leaving salt crystals.
... clay forms a suspensionin water.
... red ink and yellow ink can beseparated by chromatographyusing water as the solvent. The redink travels further up the paper.

Sheet 1 of 1
H5b
© Harcourt Education Ltd 2003 Catalyst 1This worksheet may have been altered from the original on the CD-ROM.
ActivityResourcePoster challenge

Sheet 1 of 1© Harcourt Education Ltd 2003 Catalyst 1This worksheet may have been altered from the original on the CD-ROM.
Running the activitiesPupils will have carried out Activity H5a, so will know the steps they should take whendissolving a solute in a solvent. Pupils plan their own investigation into either type ofsolute (Core and Help), type of solvent (Core and Help) and temperature (Core andExtension). Direct different groups of pupils to the activity most appropriate for their level.
Check all pupils’ plans for safety and viability before they continue.
Other relevant materialSkill sheet 7: Good results Skill sheet 33: Heating substancesSkill sheet 8: Variables Skill sheet 20: Planning an investigationSkill sheet 9: Safety in the lab Skill sheet 21: Reporting an investigationSkill sheet 12: Lighting a Bunsen burner
ICT opportunitiesIt would be possible to set up a spreadsheet for the results and subsequent calculations and graphs.
Expected outcomesPupils understand the factors that affect solubility and gain understanding of the development of scientific enquiry skills.
Safety notesEye protection should be worn throughout.
Propanone and ethanol are highly flammable – it is strongly suggested that these aredispensed in 10 cm3 amounts by the teacher. For this reason the hot water for thetemperature experiment should come from a kettle, rather than being heated by Bunsen.
Copper sulphate is harmful.
Care needs to be taken with boiling water.
Answers
Teacheractivity notesInvestigate: How soluble is it? (1) (2) (3)
Practical Pupils investigate one of three variables: solute, solvent and temperature. They find Core, Help, Extensionout how much solute dissolves in different solvents at different temperatures.
Type Purpose Differentiation
3
1
2
1
2
1
H5cde
H5c Core and Help:
Dependent on pupils’ own results, but order ofsolubility are probably the same, actual valuesmay differ.
Dependent on pupils’ own results.
Taking averages, more repeats.
H5d Core and Help:
Dependent on pupils’ own results, but order ofsolubility are probably the same, actual valuesmay differ.
Taking averages, more repeats.
H5e Core and Extension:
Dependent on pupils’ own results, but order ofsolubility are probably the same, actual valuesmay differ.
Taking averages, more repeats.
Dependent on pupils’ own results.
The higher the temperature, the more solutedissolves.
Extension:
Diagrams show that more movement andslightly more space between particles are in theliquid arrangement.
Possible ideas include: more space for particlesto fit into; more movement allows moreparticles to fit into spaces.
32
4
5
6
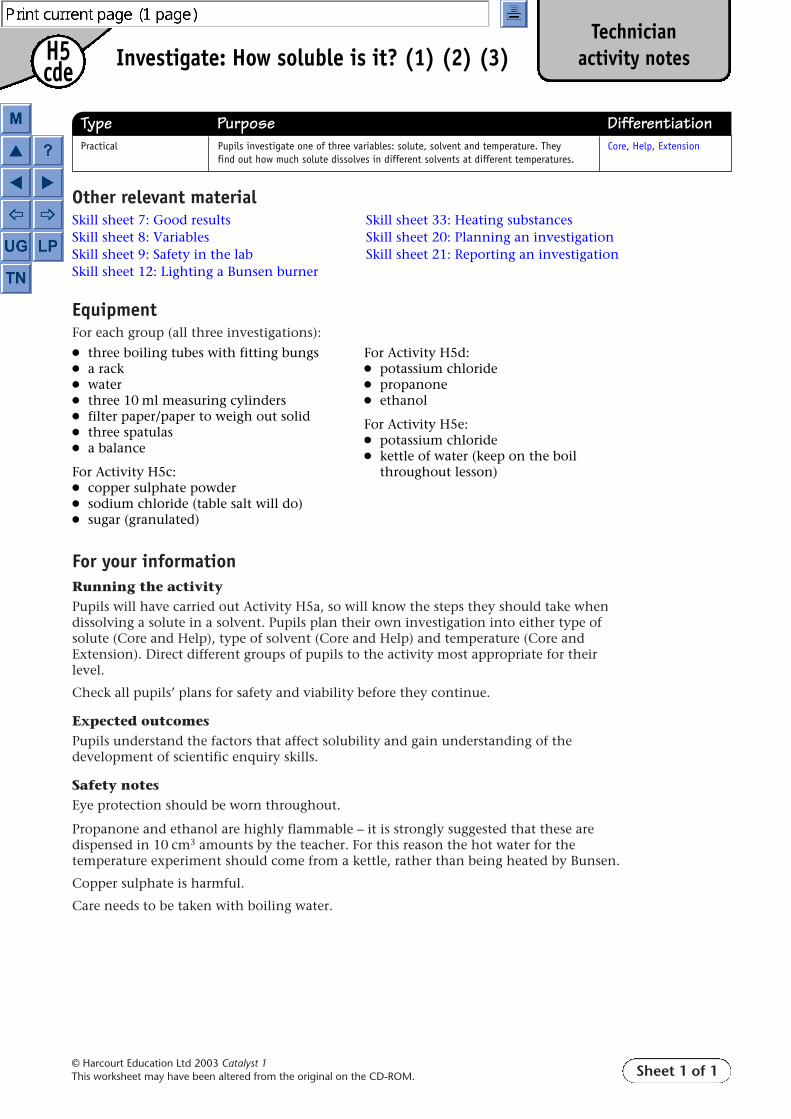
Sheet 1 of 1© Harcourt Education Ltd 2003 Catalyst 1This worksheet may have been altered from the original on the CD-ROM.
Other relevant materialSkill sheet 7: Good results Skill sheet 33: Heating substancesSkill sheet 8: Variables Skill sheet 20: Planning an investigationSkill sheet 9: Safety in the lab Skill sheet 21: Reporting an investigationSkill sheet 12: Lighting a Bunsen burner
Equipment For each group (all three investigations):
For your information Running the activityPupils will have carried out Activity H5a, so will know the steps they should take whendissolving a solute in a solvent. Pupils plan their own investigation into either type ofsolute (Core and Help), type of solvent (Core and Help) and temperature (Core andExtension). Direct different groups of pupils to the activity most appropriate for theirlevel.
Check all pupils’ plans for safety and viability before they continue.
Expected outcomesPupils understand the factors that affect solubility and gain understanding of thedevelopment of scientific enquiry skills.
Safety notesEye protection should be worn throughout.
Propanone and ethanol are highly flammable – it is strongly suggested that these aredispensed in 10 cm3 amounts by the teacher. For this reason the hot water for thetemperature experiment should come from a kettle, rather than being heated by Bunsen.
Copper sulphate is harmful.
Care needs to be taken with boiling water.
Technicianactivity notes
Practical Pupils investigate one of three variables: solute, solvent and temperature. They Core, Help, Extensionfind out how much solute dissolves in different solvents at different temperatures.
Type Purpose Differentiation
Investigate: How soluble is it? (1) (2) (3)H5cde
● three boiling tubes with fitting bungs● a rack● water● three 10 ml measuring cylinders● filter paper/paper to weigh out solid● three spatulas● a balance
For Activity H5c:● copper sulphate powder● sodium chloride (table salt will do)● sugar (granulated)
For Activity H5d:● potassium chloride ● propanone● ethanol
For Activity H5e:● potassium chloride● kettle of water (keep on the boil
throughout lesson)

Sheet 1 of 1
H5c
© Harcourt Education Ltd 2003 Catalyst 1This worksheet may have been altered from the original on the CD-ROM.
ActivityCore
You are going to investigate whether changing the solute affects how much will dissolve. You will use water as your solvent. You are going to test three different solutes: sodium chloride, copper sulphate and sugar.
EquipmentThe following equipment is available:● boiling tubes with fitting bungs ● spatulas● racks ● a balance● water ● copper sulphate powder● 10 cm3 measuring cylinders ● sodium chloride ● filter paper/paper to weigh out solid ● sugar
Predicting and planning1 Write down whether or not you think changing the solute will
affect how much dissolves.
2 Write a plan for your experiment. Make sure you include:
a what you are going to investigate
b what you will change (the input variable)
c what you will keep the same to make it a fair test
d what measurements you will make (the outcome variable).
3 Design a table to record your measurements.
4 Check your plan with your teacher before you start.
Obtaining evidence and presenting the results5 Carry out your plan and write down your measurements.
6 Draw a bar chart of your results. You can include the value for potassium chloride that you measured in the last experiment. Use this sketch to help you draw a bar chart on graph paper.
Considering evidence and evaluating7 Compare your bar chart with other pupils.
How are they similar? How are they different?Was your prediction correct?How could you improve your experiment to make your values more accurate and reliable?
Investigate: How soluble is it? (1)
Take care whenhandling coppersulphate – it is poisonous.
!
Wear eye protection.
Title:
What youmeasured(outcome)
What you changed(input)
2
3
1

Sheet 1 of 2
H5c
© Harcourt Education Ltd 2003 Catalyst 1This worksheet may have been altered from the original on the CD-ROM.
ActivityHelp
You are going to investigate whether changing the solute affects how much will dissolve. You will use water as your solvent. You are going to test three different solutes: sodium chloride, copper sulphate and sugar.
EquipmentThe following equipment is available:● boiling tubes with fitting bungs ● spatulas● racks ● a balance● water ● copper sulphate powder● 10 cm3 measuring cylinders ● sodium chloride● filter paper/paper to weigh out solid ● sugar
Predicting and planning1 Complete this sentence:
I think that changing the solute ............................... affect how much dissolves.
2 Discuss each point below in your group. You need to think about how much water and how much solute (solid) you will use. Fill in the gaps as you go.
a Aim: The question we want to answer is …
......................................................................................................................................................................................................
b What we will change (input variable): We will change the solid (solute). We will change it by …
......................................................................................................................................................................................................
c What we will measure (outcome variable): We will measure/observe …
......................................................................................................................................................................................................
d Fair test: We will keep these variables the same (make a list) …
......................................................................................................................................................................................................
e Equipment: We will need …
......................................................................................................................................................................................................
......................................................................................................................................................................................................
3 Check your plan with your teacher before you start.
Investigate: How soluble is it? (1)
Take care whenhandling coppersulphate – it is poisonous.
!
Wear eye protection.

Sheet 2 of 2
H5c
© Harcourt Education Ltd 2003 Catalyst 1This worksheet may have been altered from the original on the CD-ROM.
ActivityHelp
Obtaining evidence4 Carry out your plan and write your results in the table.
Presenting the results5 Draw a bar chart of your results.
● You can include the value for potassium chloride from your last experiment.
● You need to make sure you put a title on your bar chart and label each bar.
● The variable which you change always goes along the x-axis.
● The variable which you measure always goes up the y-axis.
Considering the evidence and evaluating6 Compare your bar chart with other pupils.
How are they similar?
.............................................................................................................................................................................................................
How are they different?
.............................................................................................................................................................................................................
Do your results match your prediction in step 1? ..........................
How could you improve your experiment to make your values more accurate and reliable? (Hint: you need to think about taking averages.)
.............................................................................................................................................................................................................
Investigate: How soluble is it? (1) (continued)
Name of solute
Amount of water used (in cm3)
Weight of solute at start (in g)
Weight of solute at end (in g)
Weight used (in g)
Title:
What youmeasured(outcome)
What you changed(input)
1
2
3

Sheet 1 of 1
H5d
© Harcourt Education Ltd 2003 Catalyst 1This worksheet may have been altered from the original on the CD-ROM.
ActivityCore
You are going to investigate how much solute (solid) dissolves when different solvents are used. The solute you will use is potassium chloride. The solvents you are going to test are: water, propanone and ethanol.
EquipmentThe following equipment is available:● boiling tubes with fitting bungs ● a balance● racks ● water● 10 cm3 measuring cylinders ● potassium chloride● filter paper/paper to weigh out solid ● propanone● spatulas ● ethanol
Planning 1 Write a plan for your experiment. Make sure you include:
a what you are going to investigate
b what you will change (the input variable)
c what you will keep the same to make it a fair test
d what measurements you will make (the outcome variable).
2 Design a table to record your measurements.
3 Check your plan with your teacher before you start.
Obtaining the evidence4 Carry out your plan and write down your measurements.
Presenting the results5 Draw a bar chart of your results on
graph paper. Use this sketch to help.
Considering evidence and evaluating6 Compare your bar chart with other pupils.
How are they similar? How are they different?How could you improve your experiment to make your values more accurate and reliable?
Investigate: How soluble is it? (2)
Wash your hands afterwards
!
Wear eye protection.
2
1
Title:
What youmeasured(outcome)
What you changed(input)

Sheet 1 of 2
H5d
© Harcourt Education Ltd 2003 Catalyst 1This worksheet may have been altered from the original on the CD-ROM.
ActivityHelp
You are going to investigate how much solute (solid) dissolves when different solvents are used. The solute you will use is potassium chloride. The solvents you are going to test are: water, propanone and ethanol.
EquipmentThe following equipment is available:● boiling tubes with fitting bungs ● a balance● racks ● water● 10 cm3 measuring cylinders ● potassium chloride● filter paper/paper to weigh out solid ● propanone● spatulas ● ethanol
Planning1 Discuss each point below in your group. You need to think about
how much water and how much solute (solid) you will use. Fill in the gaps as you go.
a Aim: The question we want to answer is...
........................................................................................................................................................................................................
b What we will change (input variable): We will change the solid (solute). We will change it by …
........................................................................................................................................................................................................
c What we will measure (outcome variable): We will measure/observe …
........................................................................................................................................................................................................
d Fair test: We will keep these variables the same (make a list) …
........................................................................................................................................................................................................
e Equipment: We will need:
........................................................................................................................................................................................................
........................................................................................................................................................................................................
2 Check your plan with your teacher before you start.
Investigate: How soluble is it? (2)
Wash your hands afterwards
!
Wear eye protection.
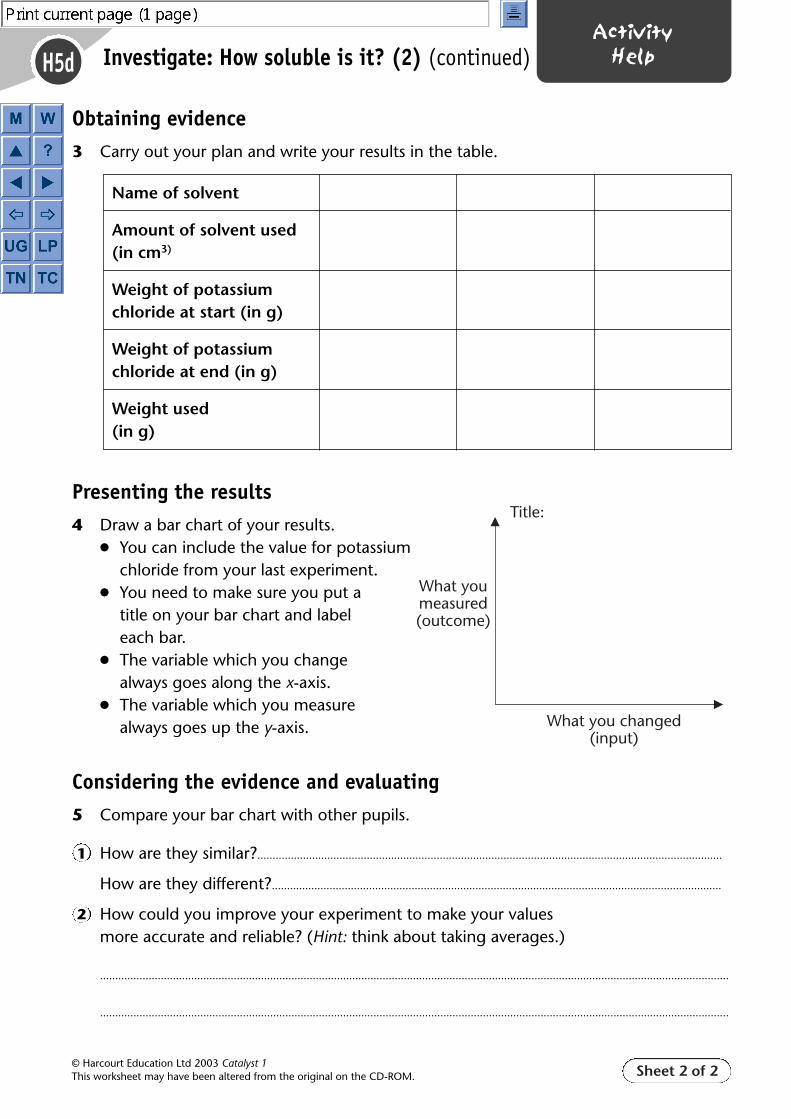
Sheet 2 of 2
H5d
© Harcourt Education Ltd 2003 Catalyst 1This worksheet may have been altered from the original on the CD-ROM.
ActivityHelp
Obtaining evidence3 Carry out your plan and write your results in the table.
Presenting the results4 Draw a bar chart of your results.
● You can include the value for potassium chloride from your last experiment.
● You need to make sure you put a title on your bar chart and label each bar.
● The variable which you change always goes along the x-axis.
● The variable which you measure always goes up the y-axis.
Considering the evidence and evaluating5 Compare your bar chart with other pupils.
How are they similar?.........................................................................................................................................................
How are they different?....................................................................................................................................................
How could you improve your experiment to make your values more accurate and reliable? (Hint: think about taking averages.)
...............................................................................................................................................................................................................
...............................................................................................................................................................................................................
Investigate: How soluble is it? (2) (continued)
Name of solvent
Amount of solvent used(in cm3)
Weight of potassiumchloride at start (in g)
Weight of potassium chloride at end (in g)
Weight used(in g)
Title:
What youmeasured(outcome)
What you changed(input)
2
1

Sheet 1 of 1
H5e
© Harcourt Education Ltd 2003 Catalyst 1This worksheet may have been altered from the original on the CD-ROM.
ActivityCore
You are going to investigate how much solute (solid) dissolves when different temperatures are used. You will use potassium chloride as your solute and water as your solvent. You need to plan to test at least three different temperatures.
EquipmentThe following equipment is available:● boiling tubes with fitting bungs ● potassium chloride ● racks● 10 cm3 measuring cylinders ● boiling water ● water● filter paper/paper to weigh out solid ● a balance ● spatulas
Predicting and planning 1 Write down what effect you think changing the temperature will
have on the amount of solute that dissolves.2 Write a plan for your experiment. Make sure you include:
a what you are going to investigate
b what you will change (how you will get your water samples at different temperatures)
c what you will keep the same
d what measurements you will make.3 Design a table to record your measurements.4 Check your plan with your teacher before you start.
Obtaining evidence and presenting the results5 Carry out your plan and write down your measurements.6 Draw a line graph of your results. You can include the
value for room temperature that you measured in the last experiment. Use this graph to help you draw a graph on graph paper.
Considering evidence and evaluating7 Compare your line graph with other pupils.
How are they similar? How are they different?How could you improve your experiment to make your values more accurate and reliable?Did your results match your prediction?Write a sentence to say how temperature affects how much solid dissolves.
Investigate: How soluble is it? (3)
Take care with boiling water
!
Wear eye protection.
Title:
What youmeasured(outcome)
What you changed(input)
2
34
1

Sheet 1 of 1
H5e
© Harcourt Education Ltd 2003 Catalyst 1This worksheet may have been altered from the original on the CD-ROM.
ActivityExtension
You are going to investigate how much solute (solid) dissolves when different temperatures are used. You will use potassium chloride as your solute and water as your solvent. You need to plan to test at least three different temperatures.
EquipmentThe following equipment is available:● boiling tubes with fitting bungs ● potassium chloride ● racks● 10 cm3 measuring cylinders ● boiling water ● water● filter paper/paper to weigh out solid ● a balance ● spatulas
Predicting and planning 1 Predict what effect you think temperature will have on how much
solute dissolves.2 Write a plan for your experiment. Make sure you include:
a what you are going to investigateb what you will change (how you will get your water samples
at different temperatures)c what you will keep the samed what measurements you will make.
3 Design a table to record your measurements.4 Check your plan with your teacher before you start.
Obtaining evidence and presenting the results5 Carry out your plan and write down your measurements.6 Draw a line graph of your results. You can include the value for
room temperature that you measured in the last experiment.
Considering evidence and evaluating7 Compare your line graph with other pupils.
How are they similar? How are they different?How could you improve your experiment to make your values more accurate and reliable?Did your results match your prediction?Write a sentence to say how temperature affects how much solid dissolves.Draw particle diagrams to show how particles are arranged, and how they move, in hot and cold water.Use your diagrams to suggest reasons for your findings.
Investigate: How soluble is it? (3)
Take care with boiling water
!
Wear eye protection.
2
34
5
6
1

H1
© Harcourt Education Ltd 2003 Catalyst 1This worksheet may have been altered from the original on the CD-ROM.
PlenariesPure salt
Sheet 1 of 1
Review learning● The class discuss and identify the key stages in the journey
in terms of the physical processes/stages the salt crystal goesthrough, i.e. crushing, dissolving, filtering, evaporating.
● Divide the class into pairs and give each pair a stage ofthe journey to describe in terms of what happens to thecrystals of salt in that section of the journey.
● Pairs then meet up together to produce a poster or aPowerPoint presentation to summarise all the stages ofthe journey. (This is very important as it establishes thatthe solute does not disappear.)
● Then they discuss the same sequence of stages but nowthey describe it referring to the particle model so theydescribe themselves in terms of what other particles theyare mixed up with, what effect the stages have on theirmovement, i.e. are they moving slow, slower, fast, gettingfaster, and on their arrangement, i.e. tightly packed,loosely packed.
Sharing responses● Pupils read out their set of instructions from the planning
phase about how pure salt can be obtained from a sampleof rock salt.
● They identify which stages in the process were difficultand why. What did they do to maximise the amount ofsalt they could obtain? Do they think it is possible toretrieve every last scrap of salt?
Group feedback● Pupils compare data for the percentage of salt obtained.
They discuss reasons why the results are not all the same.Use the questions on the right.
Word game● Pupils discuss in pairs the word pairs on the right.
Looking ahead● Explain or recap with pupils that in the rock salt
experiment they wanted to separate the solute from thesolution. Then they discuss what they would need to doif it was the solvent they wanted to keep, thinking aboutwhat they would have to do the same or differently.
● The question can be set for individuals to consider andsuggest answers to. They then share responses with otherpupils. Make it clear that they may not know the answerand need to suggest their ideas and predictions.
● Suggestions can be summarised and recorded in pupils’books to reconsider after further lessons.
Review learning Sharing responses Group feedback Word game Looking ahead
Suggested alternative plenary activities (5–10 minutes)
Pupils imagine they are asingle crystal of salt. Theydescribe their journey fromthe rock salt to theevaporating dish.
Pupils share their accountsabout how pure salt can beobtained from a sample ofrock salt in Activity H1a.
Groups share their data onthe percentage purity ofsalt obtained in ActivityH1a.
Pupils discuss word pairs. Pupils suggest how theywould separate the solventfrom a solution.
QuestionsIs 100% purity possible?What could they do to obtain 100% yieldor at least improve their own yield?What has happened to the missing salt?
Word pairsMixture and purePure and impureDissolving and meltingSoluble and dissolvingSoluble and insolubleSolvent and solution
QuestionHow would you separate the parts of asolution so that you were able to retrievethe solvent from a solution?

H2
© Harcourt Education Ltd 2003 Catalyst 1This worksheet may have been altered from the original on the CD-ROM.
PlenariesDistillation
Sheet 1 of 1
Review learning● Ask pupils to name and describe the main stages
involved in distillation in a flow chart. Lower attainersmay need additional support from the Pupil sheet,which lists the key stages randomly for them tosequence.
Sharing responses● Ask pupils to say which particle diagrams they matched
to the substances and to give reasons to justify thepattern given.
● Ask pupils to describe the rate of movement of thewater particles in terms of moving slowly, morequickly, very quickly etc. and to link the movement toheat being transferred to or away from the water.
Group feedback● In their groups, pupils read to each other their
descriptions of what happens to a water particle duringdistillation.
● Ask them to comment on each other’s descriptions andto say if they agree with them or not.
Word game● Pupils match up cards showing a solute, a solvent and
the appropriate solution formed.
Looking ahead● Show pupils the OHT slide that summarises a
desalination plant and its processes. Pupils comparetheir distillation process with that used in industrialdesalination. Ask them to write down the similaritiesand differences.
Review learning Sharing responses Group feedback Word game Looking ahead
Suggested alternative plenary activities (5–10 minutes)
Pupils (in pairs) explainthe main stages of theprocess of distillation,using a flow chart.
Pupils share their choiceof particle diagrams torepresent the distillationof salt water fromActivity H2a.
Groups of pupils discussthe demonstration of theLiebig condenser inActivity H2b.
Card sort activity onsolute, solvent andsolution.
Pupils compare their ideasfor obtaining pure waterfrom salty water with theindustrial process ofdesalination.
➔ Pupil sheet
➔ Pupil sheet
➔ Pupil sheet

© Harcourt Education Ltd 2003 Catalyst 1This worksheet may have been altered from the original on the CD-ROM. Sheet 1 of 1
Review learningPut the following steps in the correct order to describe how distillation is carried out.
H2 PlenariesDistillation
1 Pure liquid water is collected in the beaker.
2 Steam passes through the cold Liebigcondenser.
3 A blue/black solid is left behind in the flask.
4 Water in ink solution evaporates changingfrom a liquid to steam (a gas).
5 Steam rises to the top of the flask and thethermometer registers a temperature of100 °C.
6 Solution of ink placed in flask and heated.
7 Steam cools and condenses back into water(it changes from a gas back into a liquid).
✂

© Harcourt Education Ltd 2003 Catalyst 1This worksheet may have been altered from the original on the CD-ROM. Sheet 1 of 1
Word gameFrom the lists below pick a solute, a solvent and the solution theymake when mixed together. Write out your three choices like this:
................................ mixed with ................................ forms ................................ solution.
Make as many solutions as you can from the lists below.
H2 PlenariesDistillation
Solute Solvent Solution
Copper sulphate crystals Water Dissolved nail varnish
Dried nail varnish Acetone Sugary tea
Dried paint Liquid tea Dissolved aspirin
Salt crystals White spirit Salt water
Soluble aspirin Dissolved paint
Sugar crystals Dissolved copper sulphate
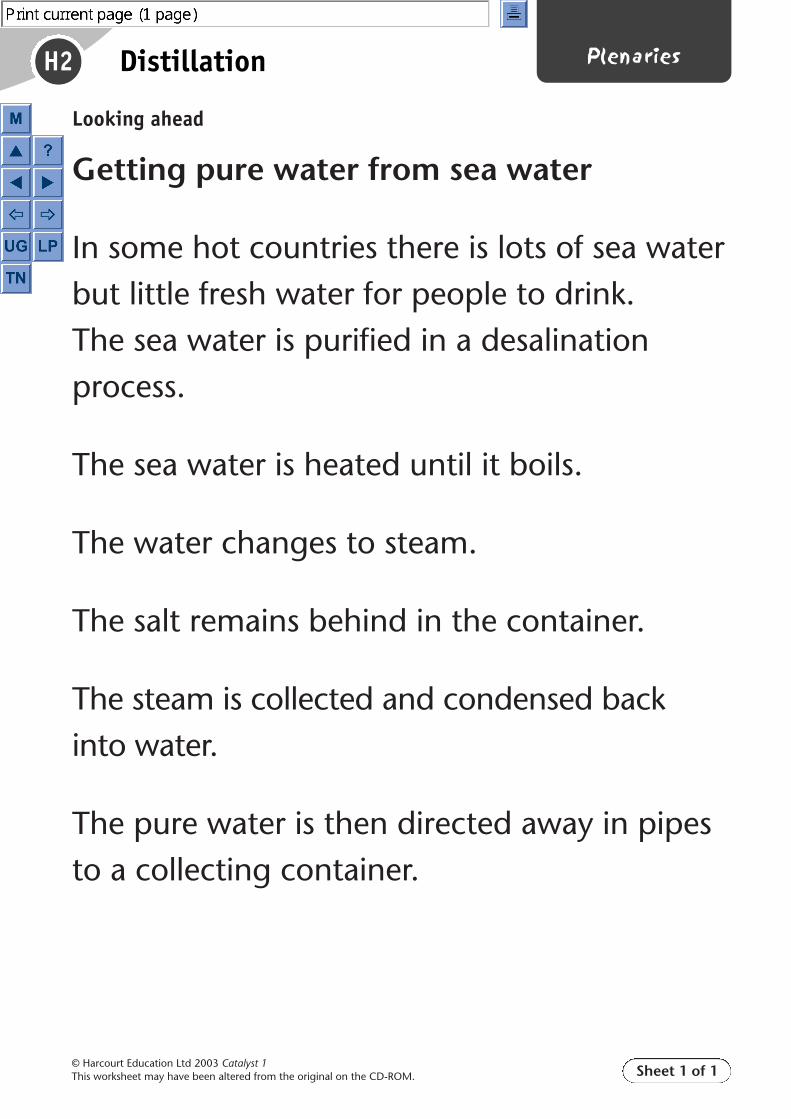
© Harcourt Education Ltd 2003 Catalyst 1This worksheet may have been altered from the original on the CD-ROM. Sheet 1 of 1
Looking ahead
Getting pure water from sea water
In some hot countries there is lots of sea waterbut little fresh water for people to drink.The sea water is purified in a desalinationprocess.
The sea water is heated until it boils.
The water changes to steam.
The salt remains behind in the container.
The steam is collected and condensed back into water.
The pure water is then directed away in pipesto a collecting container.
H2 PlenariesDistillation

H3
© Harcourt Education Ltd 2003 Catalyst 1This worksheet may have been altered from the original on the CD-ROM.
PlenariesChromatography
Sheet 1 of 1
Review learning● Pupils match each chromatogram with one descriptive
statement from the Pupil sheet and justify their choice.
● Ask other pupils to compare their choice and reasons.
● Ask pupils to summarise the key information theywould tell another pupil to look for in order to carryout a similar task.
Sharing responses● Discuss how the particle model can explain
chromatography.
● It is really important that pupils recognise theimportance of relative solubility rather than focusingon colour.
Group feedback● Ask pupils to describe their chromatogram in terms of
the number of colours identified and which colourmoved furthest/least.
● Pupils compare patterns obtained. Do they have similarfindings? What do the findings suggest?
Word game● Pupils play dominoes using the dominoes from the
Pupil sheet.
● Two players draw five cards each. The rest are left in apile face downwards. The top card is turned over andplaced on the desk to start the game. Player onematches one of their cards to either end of the startingdomino. Then player two takes their go. If either playercannot go then they must take an additional card fromthe pile. The game is over when one player has got ridof all their cards.
Looking ahead● Chromatography is a technique that is used extensively
in many situations to analyse substances.
● Ask pupils to suggest what mixtures chromatographymight separate in each situation. Some examples aregiven on the Teacher sheet.
Review learning Sharing responses Group feedback Word game Looking ahead
Suggested alternative plenary activities (5–10 minutes)
Provide pupils with threechromatograms and askthem to match these withdescriptive statements.
Teacher-led review ofchromatography and theparticle model.
In groups, pupils comparetheir annotatedchromatograms fromActivity H3a.
To check progress pupilsplay dominoes aboutseparation techniques.
Pupils suggest whatmixtures may be separatedby chromatography in newcontexts.
➔ Pupil sheet
QuestionsWhat must have happened for the spotsof colour to be in a different place nowfrom where they started?(Prompt: How does the solvent help?)
Why do the spots not all move at thesame rate? (Prompt: Think about doingpiggyback races with different sizedpeople being carried on your back.)
What would happen if we changed thesolvent? (Prompt: What would happen ifan adult took your place in the samepiggyback races? What would happen if ayounger person took your place?)
➔ Pupil sheet
SituationsHospitals, the police, the sportsauthorities, the food standards agency,the environment agency
➔ Teacher sheet

© Harcourt Education Ltd 2003 Catalyst 1This worksheet may have been altered from the original on the CD-ROM. Sheet 1 of 1
© Harcourt Education Ltd 2003 Catalyst 1This worksheet may have been altered from the original on the CD-ROM. Sheet 1 of 1
Review learningMatch each diagram of a chromatogram with a statement that describes it well.
Statements1 This chromatogram shows a paint containing three pigments.2 This chromatogram shows a paint containing two pigments.3 This chromatogram shows this paint sample is a mixture of the two other paint samples.
H3 PlenariesChromatography
A B C
Review learningMatch each diagram of a chromatogram with a statement that describes it well.
Statements1 This chromatogram shows a paint containing three pigments.2 This chromatogram shows a paint containing two pigments.3 This chromatogram shows this paint sample is a mixture of the two other paint samples.
A B C
H3 PlenariesChromatography
✂

© Harcourt Education Ltd 2003 Catalyst 1This worksheet may have been altered from the original on the CD-ROM. Sheet 1 of 1
H3 PlenariesChromatography
Boili
ng
This
subs
tanc
ebo
ils a
t10
0 °C
Mel
ting
Evap
orat
ion
tech
niqu
e
Evap
orat
ing
Con
dens
ing
This
tech
niqu
eca
n se
para
tew
ater
from
ink
Free
zing
Chr
omat
ogra
phy
tech
niqu
e
Filtr
atio
nap
para
tus
Liqu
id ➔
gas
Sim
ple
dist
illat
ion
appa
ratu
s
Evap
orat
ion
appa
ratu
s
Sodi
umch
lorid
e (s
alt)
diss
olve
d in
wat
er
Filtr
atio
nte
chni
que
Pure
wat
er
Solid
➔ li
quid
Liqu
id ➔
gas
This
tech
niqu
ese
para
tes
copp
ersu
lpha
te fr
omw
ater
This
tech
niqu
ese
para
tes
salt
from
iron
filin
gs
Inso
lubl
e
Solu
ble
Solv
ent
Solu
tion
Pure
wat
er
Iron
filin
gsin
wat
er
Suga
r in
tea
Acet
one
acts
as o
ne fo
rna
il va
rnish
Solv
ent
�
solu
te
This
subs
tanc
efre
ezes
at
0 °C
Gas
➔ li
quid
Sim
ple
dist
illat
ion
tech
niqu
e
Liqu
id ➔
sol
id
This
tech
niqu
eid
entif
ies
colo
urs
inpa
int
Chr
omat
ogra
phy
appa
ratu
s
This
is an
exam
ple
ofa
solu
tion
pap
ercl
ips
colo
urs
from
the
Smar
tie
wire
han
ger
rect
angl
eof
filte
rp
aper
whe
re t
heso
lven
tso
aked
up t
o
blob
of
colo
urfr
omSm
artie
solv
ent
beak
er
Wor
d ga
me

H3
© Harcourt Education Ltd 2003 Catalyst 1This worksheet may have been altered from the original on the CD-ROM.
PlenariesChromatography
Sheet 1 of 1
Looking aheadNotes for teachers
Sport authorities: urine samples from sports people areanalysed using a chromatography technique to detect ifanyone is using banned drugs to enhance theirperformance.
Environment agency: Chromatography is used to measurepollutants in the air from car exhausts or from waste gasesemitted by certain factories.
Environment agency: Chromatography is also used tocheck for contamination of river water by chemicals suchas pesticides.
Food standards agency: Chromatography can be used todetect different brands of wine, perfume and margarine.
Medicine, environmental science and industrial science:gas chromatography is widely used in these fields.
If the components are colourless the components may bestained so that the sample can be identified.
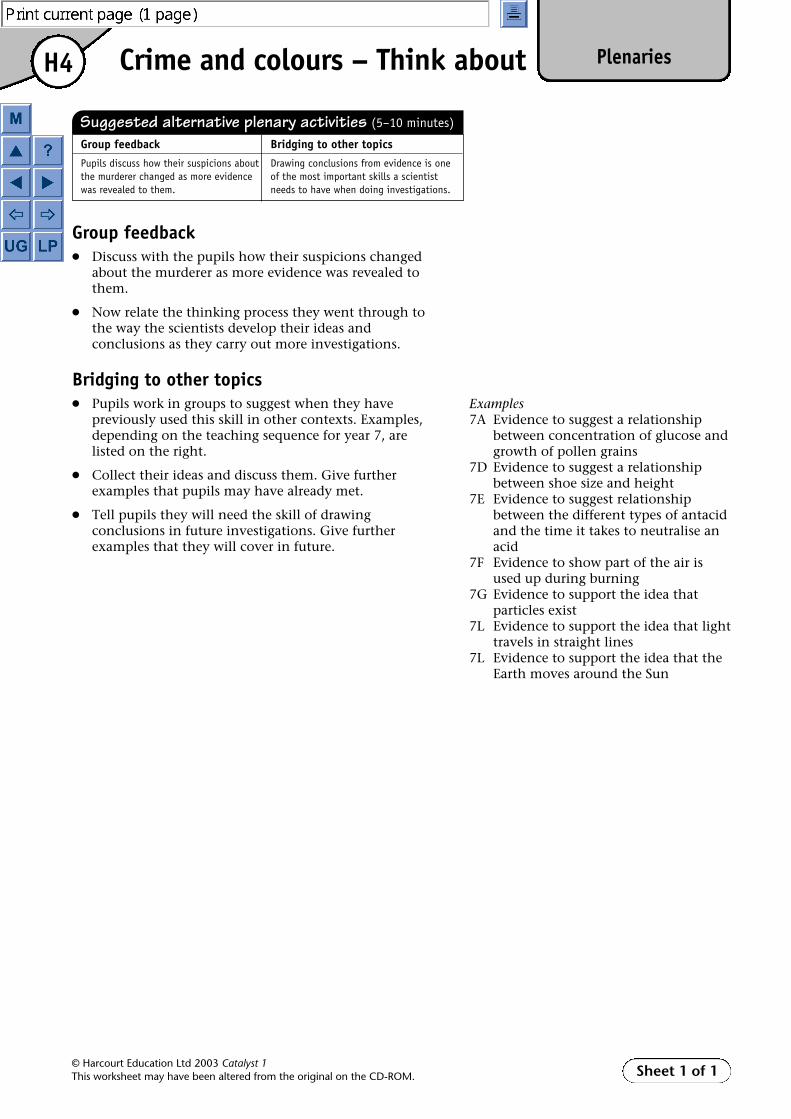
H4
© Harcourt Education Ltd 2003 Catalyst 1This worksheet may have been altered from the original on the CD-ROM.
PlenariesCrime and colours – Think about
Sheet 1 of 1
Group feedback● Discuss with the pupils how their suspicions changed
about the murderer as more evidence was revealed tothem.
● Now relate the thinking process they went through tothe way the scientists develop their ideas andconclusions as they carry out more investigations.
Bridging to other topics● Pupils work in groups to suggest when they have
previously used this skill in other contexts. Examples,depending on the teaching sequence for year 7, arelisted on the right.
● Collect their ideas and discuss them. Give furtherexamples that pupils may have already met.
● Tell pupils they will need the skill of drawingconclusions in future investigations. Give furtherexamples that they will cover in future.
Group feedback Bridging to other topics
Pupils discuss how their suspicions about Drawing conclusions from evidence is onethe murderer changed as more evidence of the most important skills a scientistwas revealed to them. needs to have when doing investigations.
Suggested alternative plenary activities (5–10 minutes)
Examples7A Evidence to suggest a relationship
between concentration of glucose andgrowth of pollen grains
7D Evidence to suggest a relationshipbetween shoe size and height
7E Evidence to suggest relationshipbetween the different types of antacidand the time it takes to neutralise anacid
7F Evidence to show part of the air isused up during burning
7G Evidence to support the idea thatparticles exist
7L Evidence to support the idea that lighttravels in straight lines
7L Evidence to support the idea that theEarth moves around the Sun
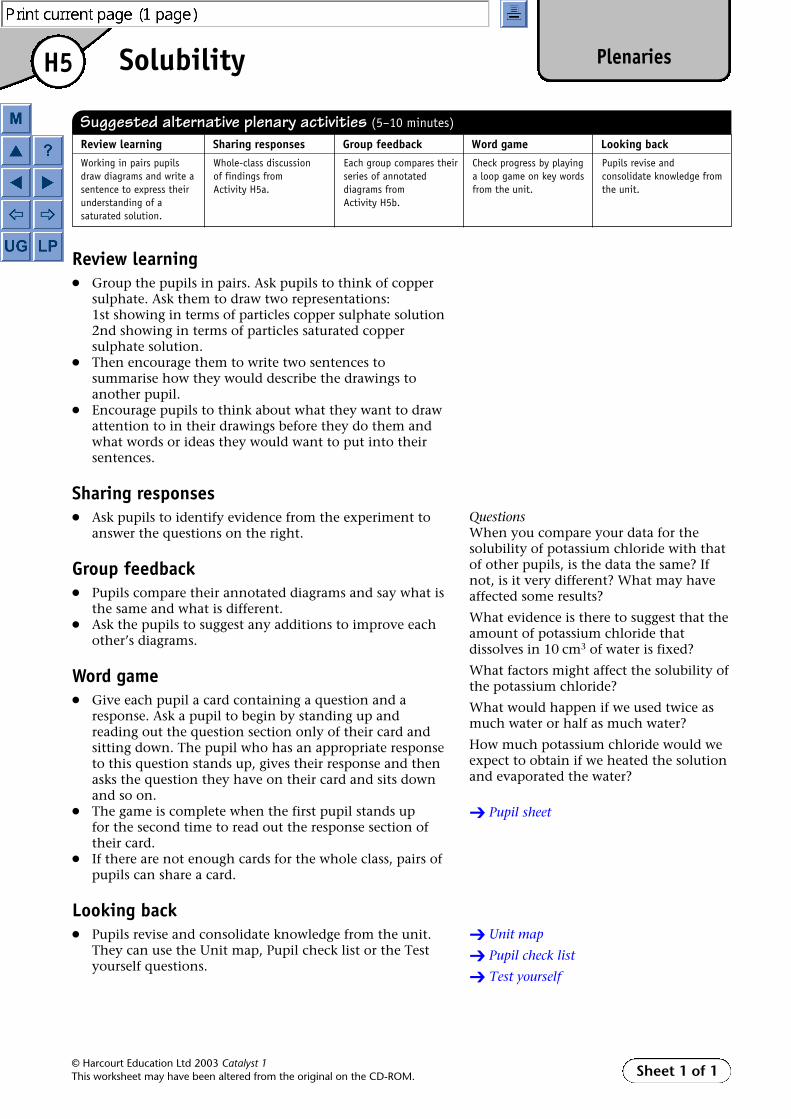
H5
© Harcourt Education Ltd 2003 Catalyst 1This worksheet may have been altered from the original on the CD-ROM.
PlenariesSolubility
Sheet 1 of 1
Review learning● Group the pupils in pairs. Ask pupils to think of copper
sulphate. Ask them to draw two representations:1st showing in terms of particles copper sulphate solution2nd showing in terms of particles saturated coppersulphate solution.
● Then encourage them to write two sentences tosummarise how they would describe the drawings toanother pupil.
● Encourage pupils to think about what they want to drawattention to in their drawings before they do them andwhat words or ideas they would want to put into theirsentences.
Sharing responses● Ask pupils to identify evidence from the experiment to
answer the questions on the right.
Group feedback● Pupils compare their annotated diagrams and say what is
the same and what is different.● Ask the pupils to suggest any additions to improve each
other’s diagrams.
Word game● Give each pupil a card containing a question and a
response. Ask a pupil to begin by standing up andreading out the question section only of their card andsitting down. The pupil who has an appropriate responseto this question stands up, gives their response and thenasks the question they have on their card and sits downand so on.
● The game is complete when the first pupil stands up for the second time to read out the response section oftheir card.
● If there are not enough cards for the whole class, pairs ofpupils can share a card.
Looking back● Pupils revise and consolidate knowledge from the unit.
They can use the Unit map, Pupil check list or the Testyourself questions.
Review learning Sharing responses Group feedback Word game Looking back
Suggested alternative plenary activities (5–10 minutes)
Working in pairs pupilsdraw diagrams and write asentence to express theirunderstanding of asaturated solution.
Whole-class discussion of findings from Activity H5a.
Each group compares theirseries of annotateddiagrams from Activity H5b.
Check progress by playinga loop game on key wordsfrom the unit.
Pupils revise andconsolidate knowledge fromthe unit.
QuestionsWhen you compare your data for thesolubility of potassium chloride with thatof other pupils, is the data the same? Ifnot, is it very different? What may haveaffected some results?
What evidence is there to suggest that theamount of potassium chloride thatdissolves in 10 cm3 of water is fixed?
What factors might affect the solubility ofthe potassium chloride?
What would happen if we used twice asmuch water or half as much water?
How much potassium chloride would weexpect to obtain if we heated the solutionand evaporated the water?
➔ Pupil sheet
➔ Unit map
➔ Pupil check list
➔ Test yourself

© Harcourt Education Ltd 2003 Catalyst 1This worksheet may have been altered from the original on the CD-ROM. Sheet 1 of 2
H5 PlenariesSolubility
Word game
�
�
QSource of pure salt
ADistillation
QPiece of apparatusused to condensesteam
ARock salt
QProcess forseparating pigmentsin paint
ALiebig condenser
QWhat are the unitsof solubility?
AChromatography
QA liquid that candissolve anothersubstance
Ag/cm3
QA substance thatcannot dissolve, e.g. iron filingscannot dissolve in water
ASolvent
QThe ability todissolve
AInsoluble
QA substance thatcontains onlyparticles of itself
ASoluble
QWhen a solvent candissolve no more ofthe solute it forms a......................................
APure
QA variable thataffects solubility
ASaturatedsolution

© Harcourt Education Ltd 2003 Catalyst 1This worksheet may have been altered from the original on the CD-ROM. Sheet 2 of 2
H5 PlenariesSolubility (continued)
Word game
�
�
QProduced when asolute is added to asolvent
ATemperature
QA substance thatdissolves in a solvent
ASolution
QWhat isevaporation?
ASolute
QWhat iscondensing?
AWhen a liquidchanges to gas
QA solvent that is notwater
AWhen a gaschanges to aliquid
QPiece of apparatusused to separatesand from water
AEthanol
QName given to thepart of the mixturewhich passesthrough the filterpaper
AFilter funnel
QTwo or moredifferent substancesjumbled uptogether
AFiltrate
QSomething youchange or keep thesame in aninvestigation
AMixture
QProcess used toseparate and collectthe solvent
AVariable
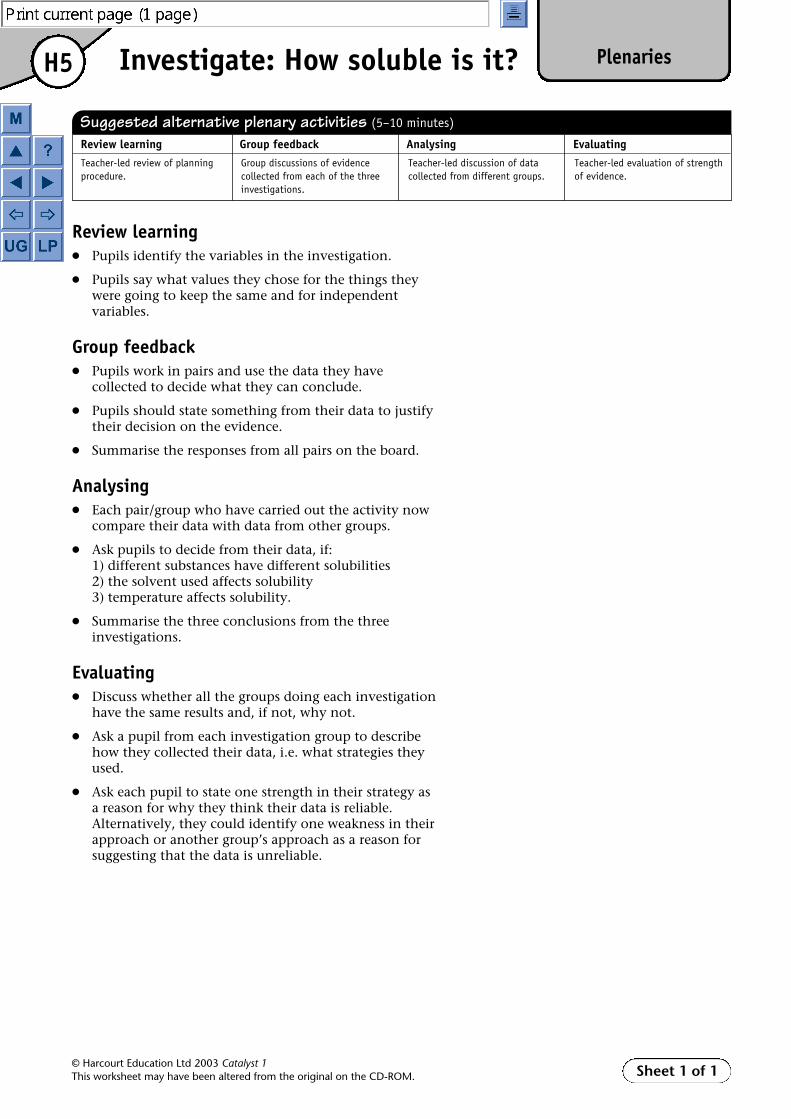
H5
© Harcourt Education Ltd 2003 Catalyst 1This worksheet may have been altered from the original on the CD-ROM.
PlenariesInvestigate: How soluble is it?
Sheet 1 of 1
Review learning● Pupils identify the variables in the investigation.
● Pupils say what values they chose for the things theywere going to keep the same and for independentvariables.
Group feedback● Pupils work in pairs and use the data they have
collected to decide what they can conclude.
● Pupils should state something from their data to justifytheir decision on the evidence.
● Summarise the responses from all pairs on the board.
Analysing● Each pair/group who have carried out the activity now
compare their data with data from other groups.
● Ask pupils to decide from their data, if:1) different substances have different solubilities2) the solvent used affects solubility3) temperature affects solubility.
● Summarise the three conclusions from the threeinvestigations.
Evaluating● Discuss whether all the groups doing each investigation
have the same results and, if not, why not.
● Ask a pupil from each investigation group to describehow they collected their data, i.e. what strategies theyused.
● Ask each pupil to state one strength in their strategy asa reason for why they think their data is reliable.Alternatively, they could identify one weakness in theirapproach or another group’s approach as a reason forsuggesting that the data is unreliable.
Review learning Group feedback Analysing Evaluating
Suggested alternative plenary activities (5–10 minutes)
Teacher-led review of planningprocedure.
Group discussions of evidencecollected from each of the threeinvestigations.
Teacher-led discussion of datacollected from different groups.
Teacher-led evaluation of strengthof evidence.

H1
© Harcourt Education Ltd 2003 Catalyst 1This worksheet may have been altered from the original on the CD-ROM.
SpecialsPure salt
1 Match the descriptions to the words.
Sheet 1 of 2
Substance What it contains Pure substance or mixture?
lemonade water, sugar, lemon juice, carbon dioxide
sugar sugar
distilled water water
tap water water, minerals, air, chlorine
2 Fill in this table.
soluble
insoluble
solute
solvent
solution
A solid that does not dissolve in water is ...
This is made by dissolving a solid in water.
The water in a solution is called the ...
A solid that does dissolve in water is ...
The solid dissolved in water is called the ...

H1
© Harcourt Education Ltd 2003 Catalyst 1This worksheet may have been altered from the original on the CD-ROM.
SpecialsPure salt (continued)
3 Rock salt is a mixture of salt and grit. Pure salt is made from rock salt in a series of steps. Here are the steps. They’re all mixed up!
a Look at the diagrams and instructions.Write numbers in the boxes to put them in order.
Use the diagrams to help you answer these questions.
b Which dissolves in water, grit or salt? ..........................
c What gets stuck in the filter paper? ..........................
d What goes through the filter paper? ..........................
e What gets left in the evaporating basin? ..........................
f What piece of apparatus is used to heat the evaporating basin? ............................................................................
Sheet 2 of 2
Evaporate the waterfrom the salty water.Pure salt crystals areleft behind.
Add water. Stir todissolve the salt. Thegrit does not dissolve.
Filter the mixture.The grit gets trappedin the filter paper.The salty water goesthrough the filterpaper.
heat

H2
© Harcourt Education Ltd 2003 Catalyst 1This worksheet may have been altered from the original on the CD-ROM.
SpecialsDistillation
1 You can get pure water from a solution by distillation. For example, you can get water from sea water using this apparatus.
a Use these words to complete the diagram.
b Use red to colour where evaporation takes place.Use blue to colour where condensation takes place.
2 Read these sentences about how to get pure water from salty water.They’re all mixed up!
Write numbers in the boxes to put the sentences in order.
Sheet 1 of 1
condenserthermometer
flask
The water vapour Cool the water condenses. vapour down.
The water evaporates The pure water dripsin the flask. into a beaker.It leaves the salt behind.
Heat the salty water.
cold water insea waterpure water
water out

H3
© Harcourt Education Ltd 2003 Catalyst 1This worksheet may have been altered from the original on the CD-ROM.
SpecialsChromatography
1 Chromatography can be used to find out if sweets have the food colouring tartrazine in them. The diagrams show how.
a Match the instructions to the diagrams.
b Which sweet had tartrazine in it, A or B? .............
Sheet 1 of 2
1
2
3
4
✗T
✗A
✗B
✗T
✗A
✗B
✗T
✗A
✗B
Tartrazine
✗T
✗A
✗B
The different coloursseparate out.
Put a dot of tartrazine on the cross marked T.
Put a dot of the colour from sweet A on cross A.
Put a dot of the colour from sweet B on cross B.
Draw a pencil line on the chromatography paperand mark three crosseson it. Label the crossesT, A and B.
Hang the paper in somesolvent. Let the solventsoak up the paper.
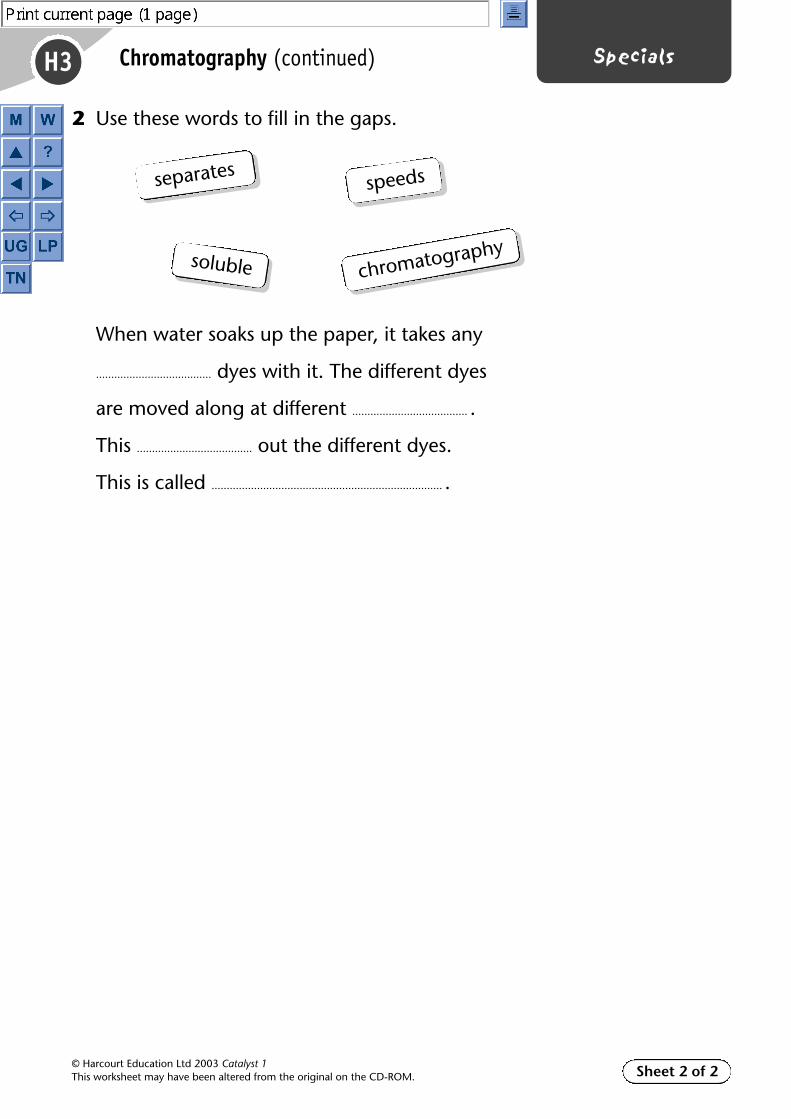
H3
© Harcourt Education Ltd 2003 Catalyst 1This worksheet may have been altered from the original on the CD-ROM.
SpecialsChromatography (continued)
2 Use these words to fill in the gaps.
When water soaks up the paper, it takes any
...................................... dyes with it. The different dyes
are moved along at different ...................................... .
This ...................................... out the different dyes.
This is called ............................................................................ .
Sheet 2 of 2
chromatography
separatesspeeds
soluble
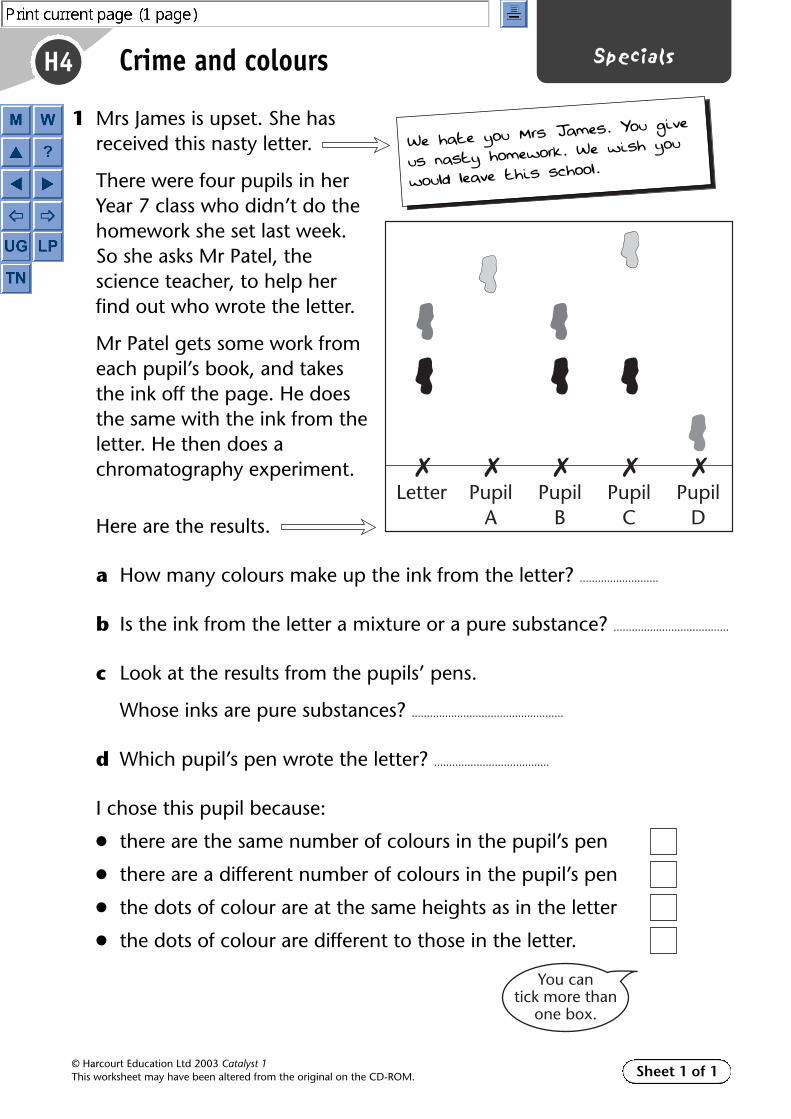
We hate you Mrs James. You give
us nasty homework. We wish you
would leave this school.
H4
© Harcourt Education Ltd 2003 Catalyst 1This worksheet may have been altered from the original on the CD-ROM.
SpecialsCrime and colours
1 Mrs James is upset. She has received this nasty letter.
There were four pupils in herYear 7 class who didn’t do thehomework she set last week.So she asks Mr Patel, thescience teacher, to help herfind out who wrote the letter.
Mr Patel gets some work fromeach pupil’s book, and takesthe ink off the page. He doesthe same with the ink from theletter. He then does achromatography experiment.
Here are the results.
a How many colours make up the ink from the letter? ..........................
b Is the ink from the letter a mixture or a pure substance? ......................................
c Look at the results from the pupils’ pens.
Whose inks are pure substances? ..................................................
d Which pupil’s pen wrote the letter? ......................................
I chose this pupil because:
● there are the same number of colours in the pupil’s pen
● there are a different number of colours in the pupil’s pen
● the dots of colour are at the same heights as in the letter
● the dots of colour are different to those in the letter.
Sheet 1 of 1
✗Letter
✗Pupil
A
✗Pupil
B
✗Pupil
C
✗Pupil
D
We hate you Mrs James. You give
us nasty homework. We wish you
would leave this school.
You cantick more than
one box.
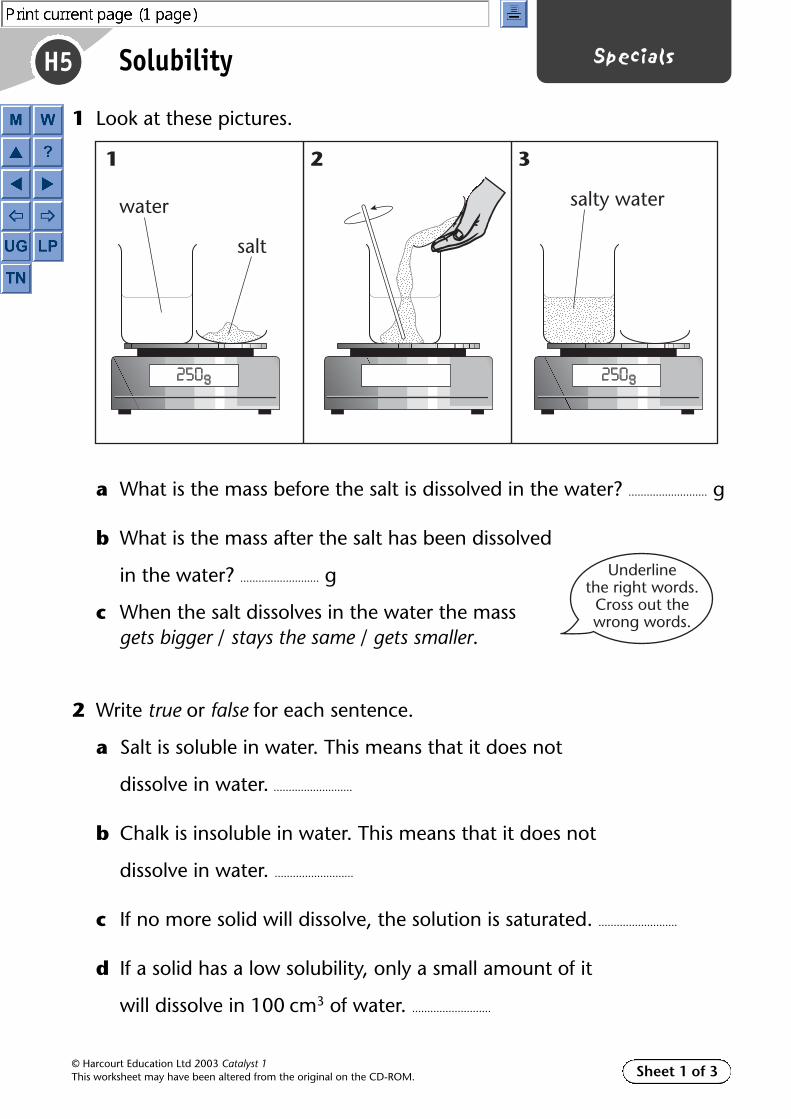
H5
© Harcourt Education Ltd 2003 Catalyst 1This worksheet may have been altered from the original on the CD-ROM.
SpecialsSolubility
1 Look at these pictures.
a What is the mass before the salt is dissolved in the water? .......................... g
b What is the mass after the salt has been dissolved
in the water? .......................... g
c When the salt dissolves in the water the mass gets bigger / stays the same / gets smaller.
2 Write true or false for each sentence.
a Salt is soluble in water. This means that it does not
dissolve in water. ..........................
b Chalk is insoluble in water. This means that it does not
dissolve in water. ..........................
c If no more solid will dissolve, the solution is saturated. ..........................
d If a solid has a low solubility, only a small amount of it
will dissolve in 100 cm3 of water. ..........................
Sheet 1 of 3
1
water
salt
2 3
salty water
Underlinethe right words.
Cross out thewrong words.
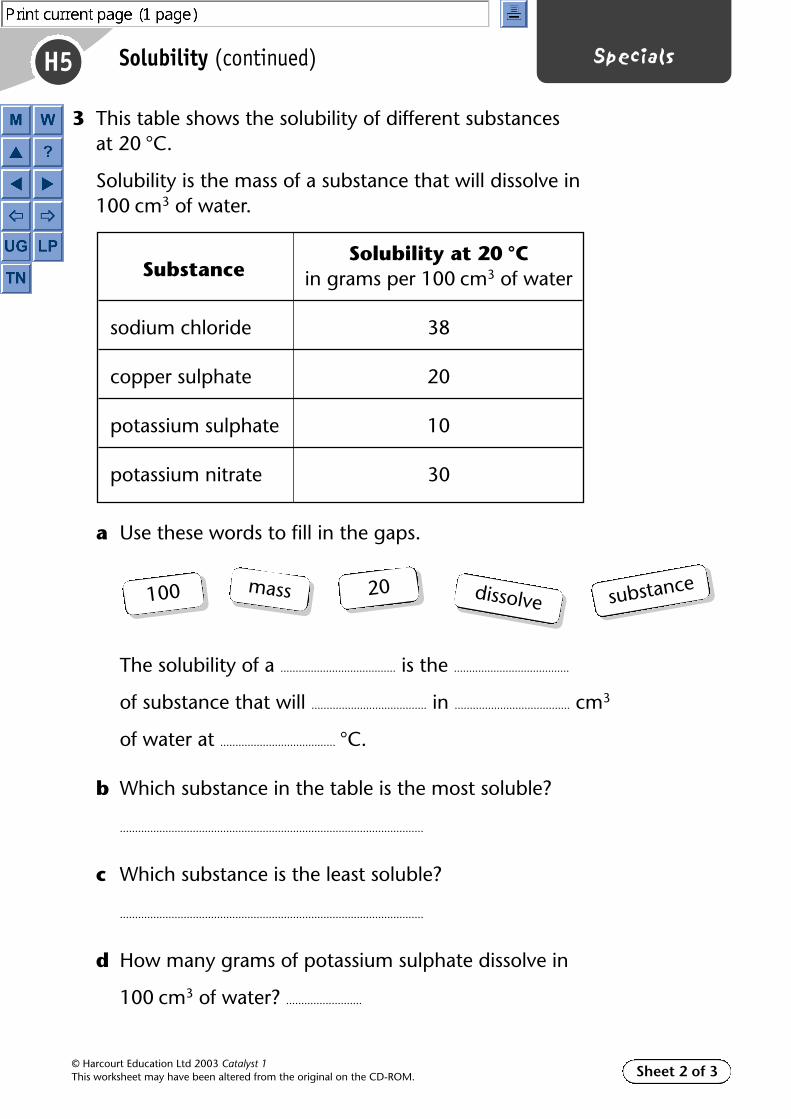
H5
© Harcourt Education Ltd 2003 Catalyst 1This worksheet may have been altered from the original on the CD-ROM.
SpecialsSolubility (continued)
3 This table shows the solubility of different substances at 20 °C.
Solubility is the mass of a substance that will dissolve in100 cm3 of water.
a Use these words to fill in the gaps.
The solubility of a ...................................... is the ......................................
of substance that will ...................................... in ...................................... cm3
of water at ...................................... °C.
b Which substance in the table is the most soluble?
....................................................................................................
c Which substance is the least soluble?
....................................................................................................
d How many grams of potassium sulphate dissolve in
100 cm3 of water? .........................
Sheet 2 of 3
SubstanceSolubility at 20 °C
in grams per 100 cm3 of water
sodium chloride 38
copper sulphate 20
potassium sulphate 10
potassium nitrate 30
substance100 mass 20 dissolve

H5
© Harcourt Education Ltd 2003 Catalyst 1This worksheet may have been altered from the original on the CD-ROM.
SpecialsSolubility (continued)
4 The table shows how the solubility of potassium nitratechanges with the temperature of the water.
a Use the table to draw a line graph.
Use the graph to answer these questions.
b As the temperature increases, the graph curves upwards / downwards.
c As the temperature increases, more / less potassium nitrate dissolves in the water.
d As the temperature of the water increases, the solubility of the potassium nitrate increases / decreases.
Sheet 3 of 3
Temperature in °C 10 20 30 40 50 60 70
Solubility in grams per 100 cm3 20 30 44 60 80 104 152 of water
0 10 20 30 40 50 60
Temperature (°C)70 80
0
20
40
60
80
100
120
140
160
Solubility (g per100 cm3 water)
Underlinethe right words.
Cross out thewrong words.

H1 Pure salt1 A solid that does not dissolve in water is …
insoluble.This is made by dissolving a solid in water …solution.The water in a solution is called the … solvent.A solid that does dissolve in water is … soluble.The solid dissolved in water is called the …solute.
2 mixture, pure substance, pure substance,mixture
3 a 3, 1, 2 b salt c sandd salty water e salt f Bunsen burner
H2 Distillation1 a Clockwise from top right – water out, cold
water in, pure water, sea water.b Flask coloured red, condenser coloured blue.
2 Numbers 3, 2, 1 down first column and 4, 5down second column.
H3 Chromatography1 a 1 – Draw a pencil line on the
chromatography paper and mark threecrosses on it. Label the crosses T, A and B.2 – Put a dot of tartrazine on the crossmarked T. Put a dot of the colour fromsweet A on cross A. Put a dot of the colourfrom sweet B on cross B.3 – Hang the paper in some solvent. Let thesolvent soak up the paper.4 – The different colours separate out.
b sweet B2 soluble, speeds, separates, chromatography
H4 Crime and colours1 a 2
b mixturec pupils A and Dd Pupil B because there are the same number
of colours in the pupil’s pen and the dots ofcolour are at the same heights as in theletter.
H5 Solubility1 a 250 g b 250 g c stays the same2 a false b true c true d true3 a substance, mass, dissolve, 100 cm3, 20 ºC
b sodium chloridec potassium sulphated 10 g
4 a
b upwardsc mored increases
H Specials answersSolutions
Sheet 1 of 1© Harcourt Education Ltd 2003 Catalyst 1This worksheet may have been altered from the original on the CD-ROM.
0 10 20 30 40 50 60Temperature (°C)
70 800
20
40
60
80
100
120
140
160
Solubility(g per
100 cm3
water)

H1
© Harcourt Education Ltd 2003 Catalyst 1This worksheet may have been altered from the original on the CD-ROM.
HomeworkPure salt
HELP1 These three diagrams show the steps needed to get pure salt from
rock salt. They are in the wrong order.
a Put the diagrams in the correct order, using letters A to C.
b Complete these sentences to explain what happens in eachstep. i First you …ii When the salt has had time to dissolve, you …iii To get the pure salt back, you …
c Copy diagram C. Label your diagram.
2 Copy and complete these sentences using the words below.
a If a substance is soluble in water, this means that it will
...................................... in the water.
b When sugar has dissolved in tea we say that the sugar is the
...................................... and the tea is the ...................................... .
Sheet 1 of 2
CBA
heat
solvent dissolve solute

H1
© Harcourt Education Ltd 2003 Catalyst 1This worksheet may have been altered from the original on the CD-ROM.
HomeworkPure salt (continued)
CORE3
Each of these words describes one or more of the substancesmentioned above.
a insoluble b soluble c solvent
d solute e solution
For each of these words:i write down the word and say which substance or substances
the word describesii explain why.
EXTENSION4 When the Cupro-copper Company analysed their copper
extracting process they obtained the following results:
● Mass of rock added to the crown ether � 1 kg
● Mass of dried rock left behind after filtering � 990 g
a How much copper mineral had actually been extracted from1 kg of rock? Show your working.
b The Cupro-copper Company know that they should have beenable to extract 50 g of copper mineral from 1 kg of rock.i What is the percentage of copper mineral in 1 kg of rock?ii What is the percentage of mineral they managed to extract
from 1 kg of rock?
c Suggest a reason why the company might not have managedto extract all the copper mineral from the rock.
Sheet 2 of 2
The Cupro-copper Company discovered a newsupply of copper mineral, deep underground.They had a problem extracting the coppermineral because it is mixed with several otherdifferent sorts of rock. Cupro-copper scientistssaid they would have to dissolve out the coppermineral, filter the mixture and then evaporatethe filtrate.
The scientists tried to dissolve the coppermineral using different liquids. The mineral
would not dissolve in water or in petrol.However, an unusual liquid called crown etherseemed to be ideal. All the copper mineraldissolved in it quite quickly, giving a blueliquid containing copper mineral dissolved incrown ether. Even better, the crown ether couldbe evaporated easily to leave pure, solid copper.
Now the Cupro-copper Company could extractcopper metal from the mineral and make somemoney.

H2
© Harcourt Education Ltd 2003 Catalyst 1This worksheet may have been altered from the original on the CD-ROM.
HomeworkDistillation
This diagram shows apparatus used for distillation.
HELP1 Look at the diagram above. Copy and complete these sentences by
choosing words from the list below.
a In the diagram, the part labelled C is called a ...................................... .
b Arrow A is pointing to the place where ...................................... happens.
c At point B the hot vapour is cooling back to a liquid.
This process is called ...................................... .
CORE2 Look at the diagram above.
a What substance goes into the distillation apparatus at point X andcomes out again at point Y?
b Why is this substance necessary?
c Why would distillation not work if you forgot to have thissubstance running through the apparatus?
Sheet 1 of 2
A
YB
X
thermometer
heat
C
beaker flaskcondenser condensation
boiling evaporationcooling

H2
© Harcourt Education Ltd 2003 Catalyst 1This worksheet may have been altered from the original on the CD-ROM.
HomeworkDistillation (continued)
EXTENSION3 Crude oil can be separated into its different parts or ‘fractions’ by
fractional distillation. As the crude oil is heated, the liquids in it gethotter. Each evaporates off at a different temperature.
The table below shows some of the liquids that can be extractedfrom crude oil, together with data about their boiling points.
a Which liquid will reach its boiling point first?
b Which liquid will be the most difficult to evaporate?
c Why is it easier to turn kerosene into a gas than diesel?
d All four liquids are used as fuels. What is probably the mainhazard when separating them by distillation?
Sheet 2 of 2
Liquid found Boiling point ofin crude oil the liquid in °C
petrol 60
kerosene 200
diesel 240
road tar 350
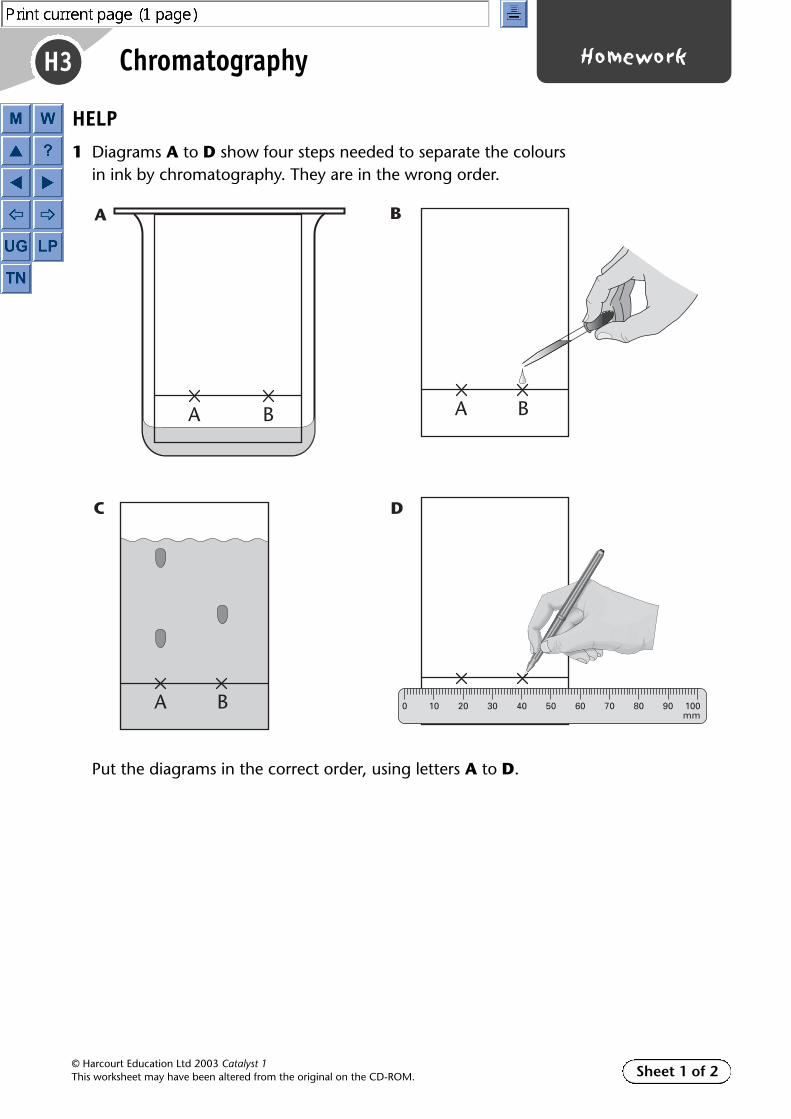
H3
© Harcourt Education Ltd 2003 Catalyst 1This worksheet may have been altered from the original on the CD-ROM.
HomeworkChromatography
HELP1 Diagrams A to D show four steps needed to separate the colours
in ink by chromatography. They are in the wrong order.
Put the diagrams in the correct order, using letters A to D.
Sheet 1 of 2
A B
C D
A B
A BA B
A B
10 20 30 40 50 60 70 80 90 100mm
0
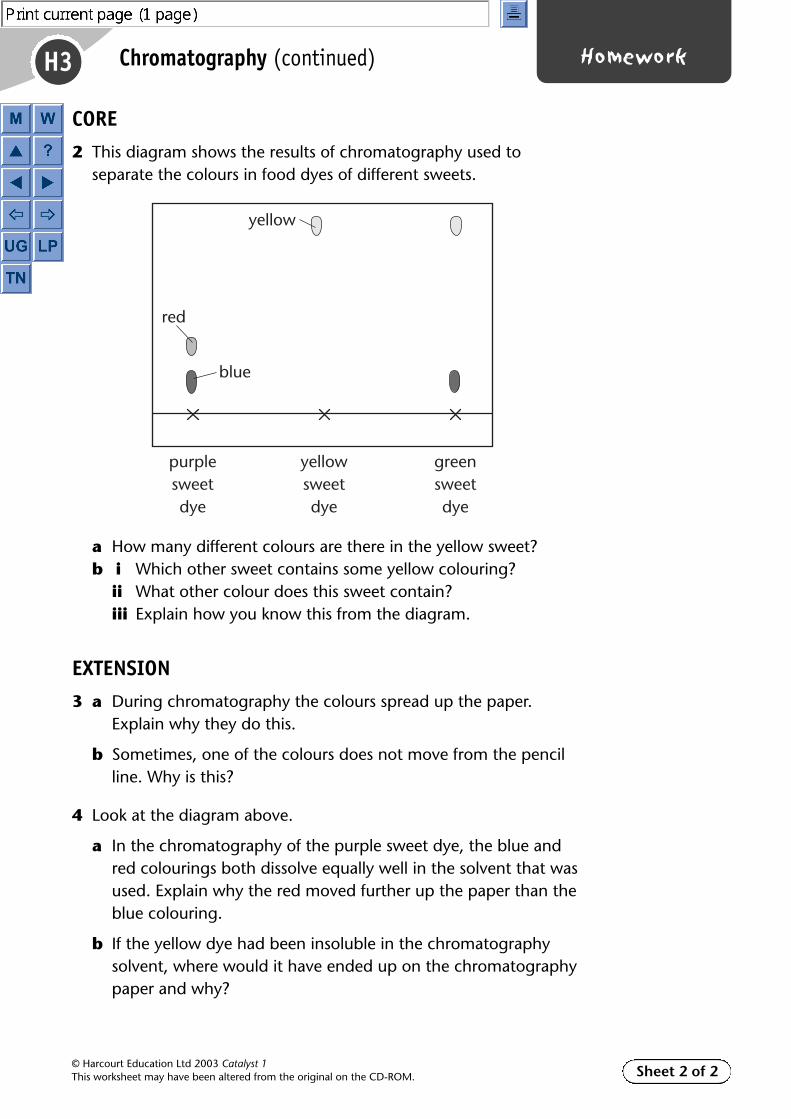
H3
© Harcourt Education Ltd 2003 Catalyst 1This worksheet may have been altered from the original on the CD-ROM.
HomeworkChromatography (continued)
CORE2 This diagram shows the results of chromatography used to
separate the colours in food dyes of different sweets.
a How many different colours are there in the yellow sweet?b i Which other sweet contains some yellow colouring?
ii What other colour does this sweet contain?iii Explain how you know this from the diagram.
EXTENSION3 a During chromatography the colours spread up the paper.
Explain why they do this.
b Sometimes, one of the colours does not move from the pencilline. Why is this?
4 Look at the diagram above.
a In the chromatography of the purple sweet dye, the blue andred colourings both dissolve equally well in the solvent that wasused. Explain why the red moved further up the paper than theblue colouring.
b If the yellow dye had been insoluble in the chromatographysolvent, where would it have ended up on the chromatographypaper and why?
Sheet 2 of 2
purplesweetdye
yellowsweetdye
red
blue
greensweetdye
yellow

H5
© Harcourt Education Ltd 2003 Catalyst 1This worksheet may have been altered from the original on the CD-ROM.
HomeworkSolubility
HELP1 This table shows the solubilities of some substances in water.
a Which substance is the most soluble in water?
b Which substance is almost insoluble in water?
c Peter added 45 g of potassium chloride to 100 cm3 of water.What sort of solution did he make – a saturated solution or anunsaturated solution?
d Peter heated the solution of potassium nitrate. Would this meanhe could dissolve more or less of the solid in the solution?
e What could Peter do to speed up dissolving?
CORE2 Parminder likes to wear nail varnish. When she washes her hands
with soap and water the nail varnish is not affected. When sherubs her nails with propanone the varnish is removed.
a Explain why propanone will remove Parminder’s nail varnishbut water will not.
b When Parminder spilt some propanone onto some salt, the saltdid not seem to be affected. Explain why propanone has noeffect on salt.
Sheet 1 of 3
Substance Solubility in 100 cm3 of water
potassium nitrate 75 g
potassium chloride 45 g
magnesium chloride 53 g
calcium chloride 0.01 g

H5
© Harcourt Education Ltd 2003 Catalyst 1This worksheet may have been altered from the original on the CD-ROM.
HomeworkSolubility (continued)
3 This graph is a solubility curve for potassium nitrate. It shows thesolubility of potassium nitrate in water, at different temperatures.
a Describe what happens to the solubility of potassium nitrate asthe temperature of the water increases.
b How much potassium nitrate will dissolve in 100 cm3 of waterat 25 °C?
c At what temperature will 60 g of potassium nitrate just form asaturated solution in 100 cm3 of water?
EXTENSION4 Look at the graph for potassium nitrate above.
a How much potassium nitrate would crystallise out if you cooledthe saturated solution at 40 °C down to 10 °C?
b Explain why the potassium nitrate would crystallise out whenyou cooled the saturated solution.
Sheet 2 of 3
0 10 20 30Temperature of water in °C
40 500
10
20
30
40
50
60
70
80
90
100
Solu
bilit
y in
g p
er 1
00 c
m3 o
f wat
er

H5
© Harcourt Education Ltd 2003 Catalyst 1This worksheet may have been altered from the original on the CD-ROM.
HomeworkSolubility (continued)
5 a Jonathan has made a solution of copper sulphate that still hassome crystals left in the bottom of the beaker. Explain how youknow that his solution must be saturated.
b Describe two things that Jonathan could do to get the last fewcrystals to dissolve. For each one, explain why it would work.
c Jonathan thought that alcohol might dissolve copper sulphate,so he tried to make a saturated solution using alcohol instead ofwater. He used the same volume of alcohol as he had water,but found that a lot more copper sulphate crystals were left atthe bottom of the beaker.i What does this tell you about the solubility of copper
sulphate in alcohol compared with water? Explain youranswer.
ii Why did Jonathan use the same volume of alcohol as he hadwater?
Sheet 3 of 3

H1
© Harcourt Education Ltd 2003 Catalyst 1This worksheet may have been altered from the original on the CD-ROM.
Homeworkmark schemePure salt
Sheet 1 of 5
Question Answer Mark
1 a B, C, AB before C, one mark; C before A, one mark. 2
b i First you stir the rock salt in water. 1ii When the salt has had time to dissolve, you filter the mixture and collect
the salt solution / filtrate. 1iii To get the pure salt back, you evaporate the water / heat until it is dry /
boil off the water. 1Underscores show answers; other text copied by pupils. Accept equivalent answers.
c
One mark for each correct label. 5
2 a If a substance is soluble in water, this means that it will dissolve in the water. 1
b When sugar has dissolved in tea we say that the sugar is the solute and the 1 tea is the solvent. 1Underscores show answers; other text copied by pupils.
Total for Help 13
HELP
Question Answer Mark
3 a i Insoluble – copper mineral 1ii It will not dissolve in water or petrol. 1
b i Soluble – copper mineral 1ii It will dissolve in crown ether. 1
c i Solvent – crown ether 1ii It is a liquid that dissolves copper mineral. 1
d i Solute – the copper mineral in the crown ether solution 1ii It is the solid that has been dissolved. 1
e i Solution – the result of dissolving copper mineral in crown ether/the blue liquid 1ii It contains a solute dissolved in a solution. 1
Total for Core 10
CORE
filter paper filter funnel
residue/solid
beaker
salt solutionfiltrate
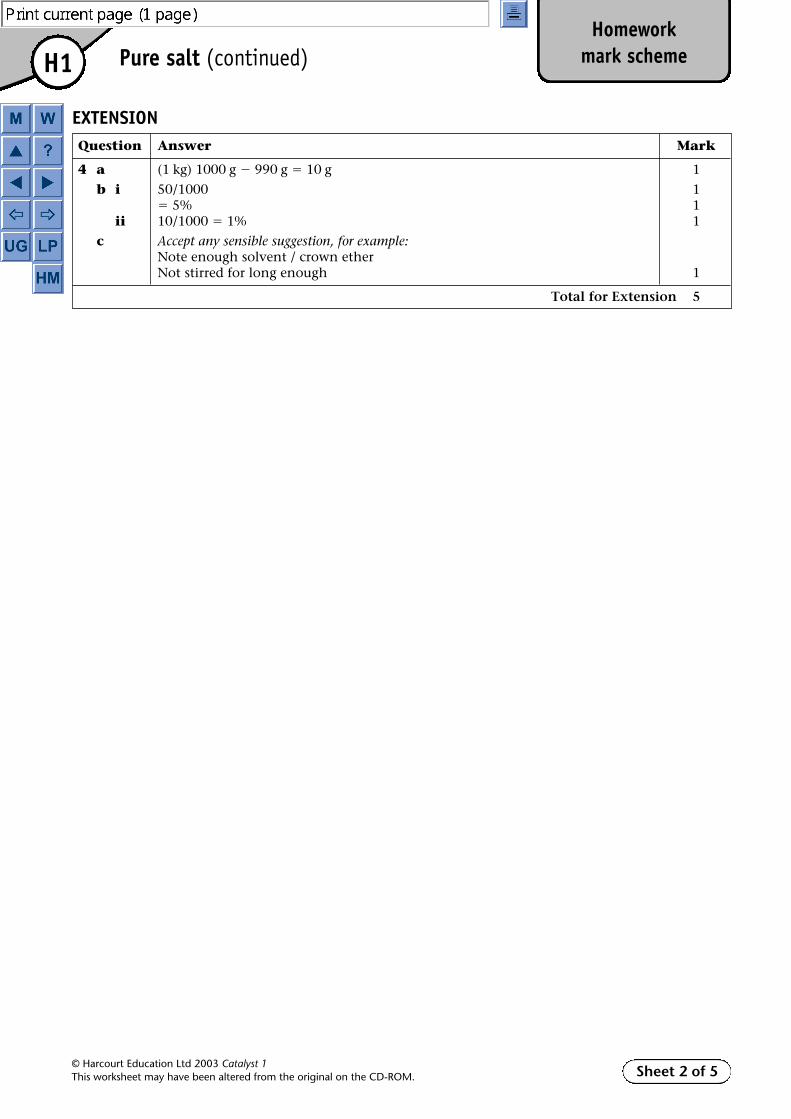
H1
© Harcourt Education Ltd 2003 Catalyst 1This worksheet may have been altered from the original on the CD-ROM.
Homeworkmark schemePure salt (continued)
Sheet 2 of 5
Question Answer Mark
4 a (1 kg) 1000 g � 990 g � 10 g 1
b i 50/1000 1� 5% 1
ii 10/1000 � 1% 1
c Accept any sensible suggestion, for example:Note enough solvent / crown etherNot stirred for long enough 1
Total for Extension 5
EXTENSION

H2
© Harcourt Education Ltd 2003 Catalyst 1This worksheet may have been altered from the original on the CD-ROM.
Homeworkmark schemeDistillation
Sheet 3 of 5
Question Answer Mark
1 a In the diagram, the part labelled C is called a condenser. 1
b Arrow A is pointing to the place where evaporation happens. 1
c At point B the hot vapour is cooling back to a liquid. This process is called condensation. 1Underscores show answers; other text copied by pupils.
Total for Help 3
HELP
Question Answer Mark
2 a Cold water 1
b To cool the vapour so it condenses. 1Accept equivalent answers.
c There would be nothing to cool down the hot vapour. 1Accept equivalent answers
Total for Core 3
CORE
Question Answer Mark
3 a Petrol 1
b Road tar 1
c It has a lower boiling point. 1
d They might catch fire. 1
Total for Extension 4
EXTENSION

H3
© Harcourt Education Ltd 2003 Catalyst 1This worksheet may have been altered from the original on the CD-ROM.
Homeworkmark schemeChromatography
Sheet 4 of 5
Question Answer Mark
1 D, B, A, CD somewhere before B, one mark; B somewhere before A, one mark; A somewhere before C, one mark. 3
Total for Help 3
HELP
Question Answer Mark
2 a One 1b i Green 1
ii Blue 1iii The two spots are in the same position as the yellow and blue spots marked on
the diagram. 1Accept equivalent answers.
Total for Core 4
CORE
Question Answer Mark
3 a The solvent moves up the paper 1taking with it the colours that are dissolved in it. 1Accept equivalent answers that are based on solubility.
b It is insoluble in the solvent. 1
4 a The blue colouring sticks to the paper better than the red colouring 1so the solvent cannot drag it up the paper so easily. 1Accept equivalent answers.
b It would remain on the baseline / would not move 1because it is insoluble in the solvent. 1Accept equivalent answers.
Total for Extension 7
EXTENSION
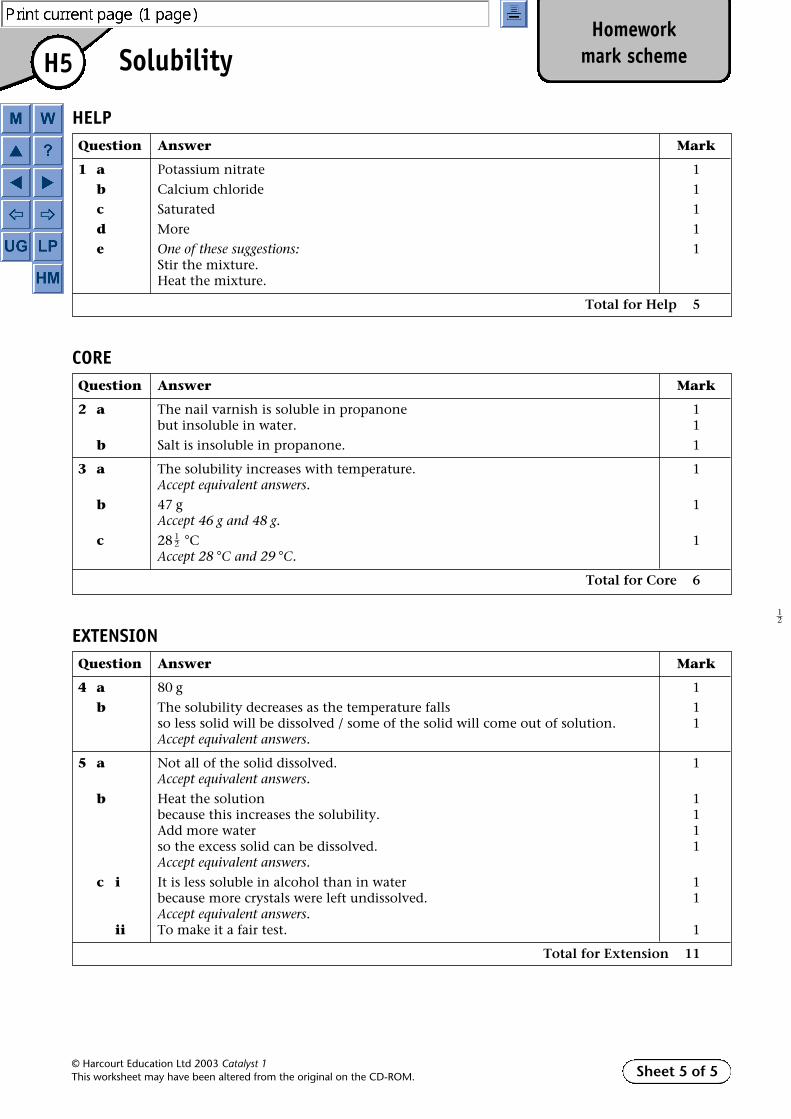
H5
© Harcourt Education Ltd 2003 Catalyst 1This worksheet may have been altered from the original on the CD-ROM.
Homeworkmark schemeSolubility
Sheet 5 of 5
Question Answer Mark
1 a Potassium nitrate 1
b Calcium chloride 1
c Saturated 1
d More 1
e One of these suggestions: 1Stir the mixture.Heat the mixture.
Total for Help 5
HELP
Question Answer Mark
2 a The nail varnish is soluble in propanone 1but insoluble in water. 1
b Salt is insoluble in propanone. 1
3 a The solubility increases with temperature. 1Accept equivalent answers.
b 47 g 1Accept 46 g and 48 g.
c 28 °C 1Accept 28 °C and 29 °C.
Total for Core 6
12
CORE
Question Answer Mark
4 a 80 g 1
b The solubility decreases as the temperature falls 1so less solid will be dissolved / some of the solid will come out of solution. 1Accept equivalent answers.
5 a Not all of the solid dissolved. 1Accept equivalent answers.
b Heat the solution 1because this increases the solubility. 1Add more water 1so the excess solid can be dissolved. 1Accept equivalent answers.
c i It is less soluble in alcohol than in water 1because more crystals were left undissolved. 1Accept equivalent answers.
ii To make it a fair test. 1
Total for Extension 11
EXTENSION12

Sheet 1 of 1
H
© Harcourt Education Ltd 2003 Catalyst 1This worksheet may have been altered from the original on the CD-ROM.
Transition quiz
1 These sentences describe either a solution or a mixture. Cross outthe wrong words.a A solution/mixture contains several substances that have been
combined and that can be separated easily.b A solution/mixture is formed when sugar dissolves in tea.
2 Complete these sentences using the words below.
a When steam turns back to water, we say it has ...................................... .
b When flour is added to water it does not dissolve, we say that
it is ...................................... .
c When water turns to steam, we say that it has ...................................... .
d When salt is mixed in water it ‘disappears’, we say it has
...................................... .
Solutions
dissolved condensed evaporated insoluble
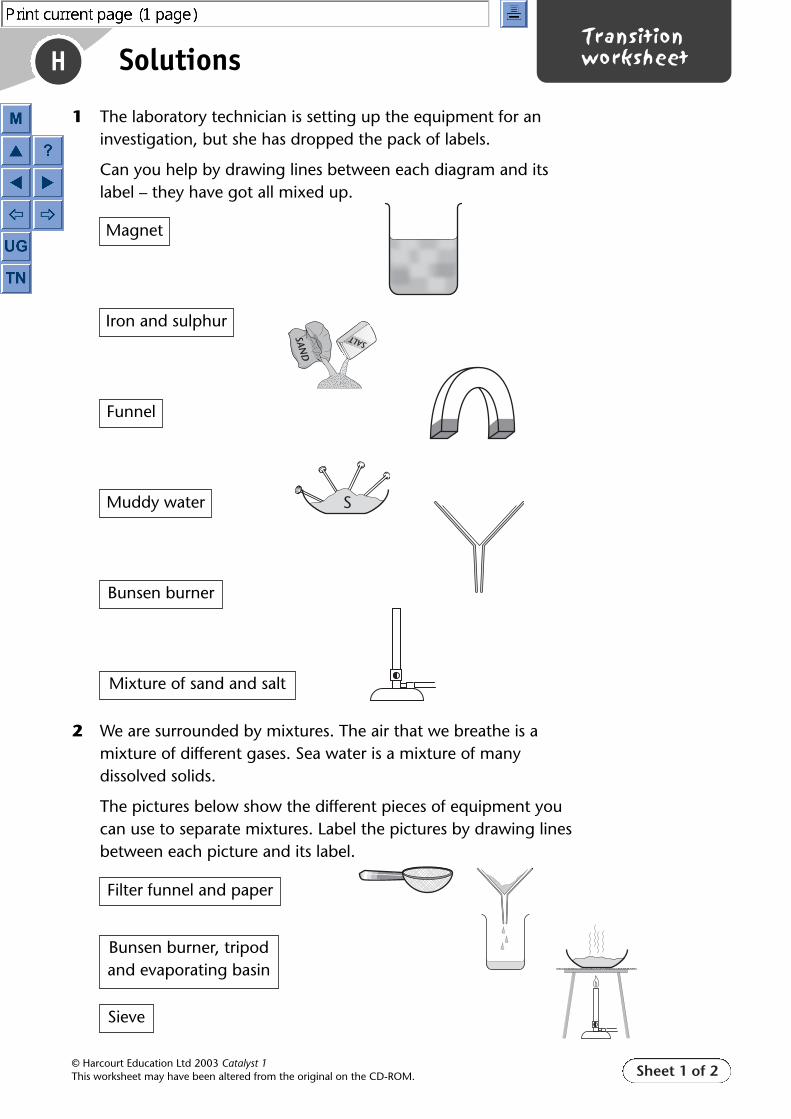
Sheet 1 of 2
H
© Harcourt Education Ltd 2003 Catalyst 1This worksheet may have been altered from the original on the CD-ROM.
Transitionworksheet
1 The laboratory technician is setting up the equipment for aninvestigation, but she has dropped the pack of labels.
Can you help by drawing lines between each diagram and itslabel – they have got all mixed up.
2 We are surrounded by mixtures. The air that we breathe is amixture of different gases. Sea water is a mixture of manydissolved solids.
The pictures below show the different pieces of equipment youcan use to separate mixtures. Label the pictures by drawing linesbetween each picture and its label.
Solutions
SALTSAND
S
Magnet
Iron and sulphur
Funnel
Muddy water
Bunsen burner
Mixture of sand and salt
Filter funnel and paper
Bunsen burner, tripodand evaporating basin
Sieve
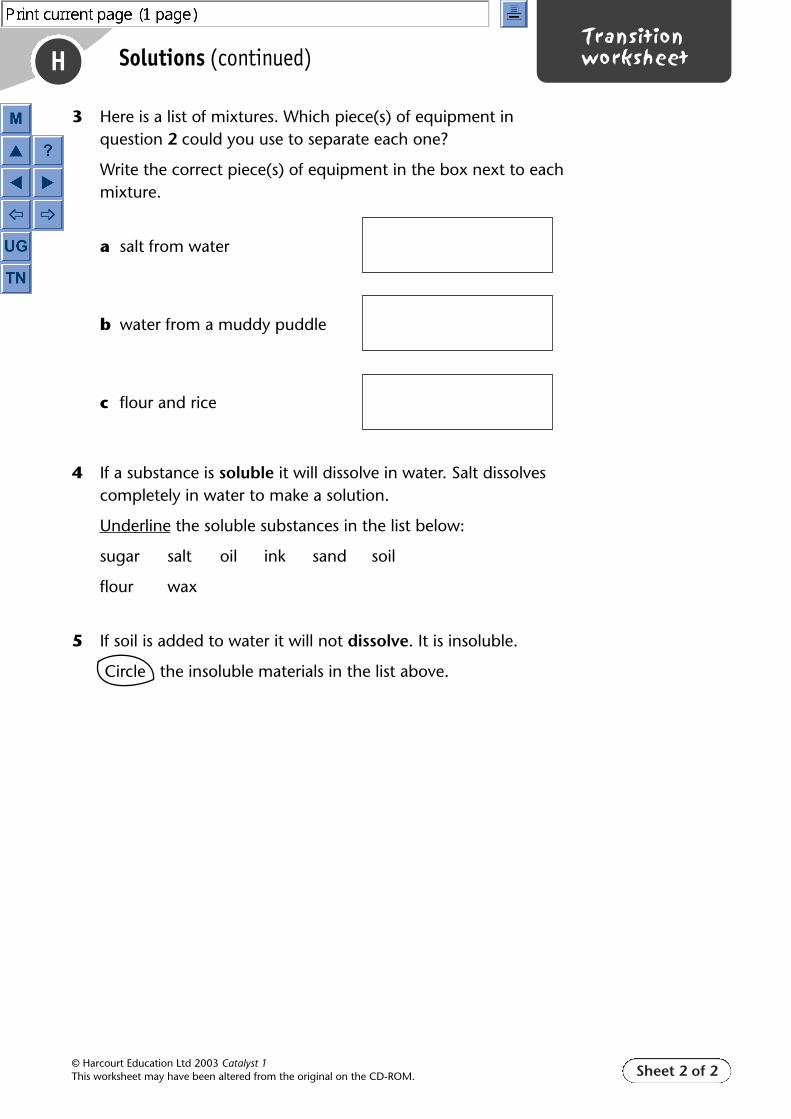
Sheet 2 of 2
H
© Harcourt Education Ltd 2003 Catalyst 1This worksheet may have been altered from the original on the CD-ROM.
Transitionworksheet
3 Here is a list of mixtures. Which piece(s) of equipment in question 2 could you use to separate each one?
Write the correct piece(s) of equipment in the box next to each mixture.
a salt from water
b water from a muddy puddle
c flour and rice
4 If a substance is soluble it will dissolve in water. Salt dissolves completely in water to make a solution.
Underline the soluble substances in the list below:
sugar salt oil ink sand soil
flour wax
5 If soil is added to water it will not dissolve. It is insoluble.
Circle the insoluble materials in the list above.
Solutions (continued)

H
© Harcourt Education Ltd 2003 Catalyst 1This worksheet may have been altered from the original on the CD-ROM.
Test yourselfSolutions
1 After each of these substances, write whether it is soluble orinsoluble.
a sand ......................................
b salt ......................................
c sugar ......................................
2 After each of these observations, write whether the substancedescribed is a pure substance or a mixture.
a Tap water leaves a white substance behind when it evaporates. ......................................
b When wet sand is filtered, the sand stays in the filter paper andthe water goes through. ......................................
c Distilled water leaves nothing behind when it evaporates. ......................................
3 Draw lines to match each mixture to the method or methods thatcould be used to separate the substances.
Mixture Separation method
sand and water ● ● evaporation
food dyes ● ● distillation
sea water ● ● filtering
copper sulphate solution ● ● chromatography
4 Which of these statements explains what happens to particles of asolute when they dissolve? Circle the correct letter.
A Solute particles fit into gaps between solvent particles.
B Solute particles disappear when they dissolve.
C Solute particles are surrounded by solvent particles.
D Solute particles don’t take up any space at all when theydissolve.
Sheet 1 of 3

H
© Harcourt Education Ltd 2003 Catalyst 1This worksheet may have been altered from the original on the CD-ROM.
Test yourselfSolutions (continued)
5 Phillip says that if you dissolve 5 g of salt in 25 g of water, the mass of thesolution will be 25 g, but Anita says it will be 30 g.
a Who is right? ................................
b Explain your answer. ......................................................................................................
6 How does distillation separate a mixture of a liquid and a solid? Join theboxes with arrows to show the correct sequence.
7 Look at the results of chromatography on substances A to D.
Underline the statements that are true.
a A is a mixture of three different substances.
b B contains the same mixture of substances as D.
c C contains the same mixture of substances as D.
d B contains a different mixture of substances from C.
8 Tash wants to make a saturated solution but the instructions are mixed up.Write numbers 1 to 5 in the boxes to put the steps in the correct order.
The solution is now saturated.
Add a spatula of solute.
Keep adding more solute and stirring it until no more will dissolve.
Put some water in a beaker.
Stir until the solute has dissolved.
Sheet 2 of 3
The vapour is cooled.
The mixture is heated.
The liquid evaporates.
The vapour condenses.
The pure liquid is collected.
A B C D
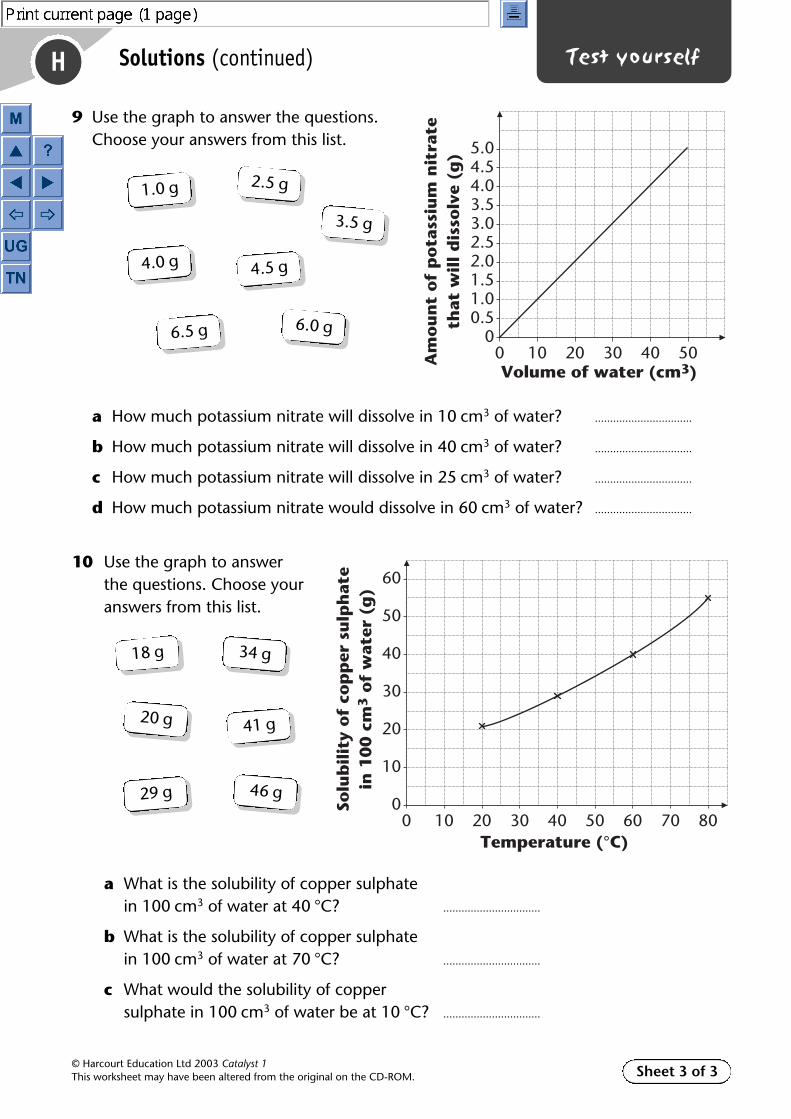
H
© Harcourt Education Ltd 2003 Catalyst 1This worksheet may have been altered from the original on the CD-ROM.
Test yourselfSolutions (continued)
9 Use the graph to answer the questions. Choose your answers from this list.
a How much potassium nitrate will dissolve in 10 cm3 of water? ................................
b How much potassium nitrate will dissolve in 40 cm3 of water? ................................
c How much potassium nitrate will dissolve in 25 cm3 of water? ................................
d How much potassium nitrate would dissolve in 60 cm3 of water? ................................
10 Use the graph to answer the questions. Choose your answers from this list.
a What is the solubility of copper sulphate in 100 cm3 of water at 40 °C? ................................
b What is the solubility of copper sulphate in 100 cm3 of water at 70 °C? ................................
c What would the solubility of copper sulphate in 100 cm3 of water be at 10 °C? ................................
Sheet 3 of 3
Am
ou
nt
of
po
tass
ium
nit
rate
that
wil
l d
isso
lve
(g)
00Volume of water (cm3)
10 20 30 40 50
0.51.01.52.02.53.03.54.04.55.0
Solu
bil
ity
of
cop
per
su
lph
ate
in 1
00 c
m3 o
f w
ater
(g
)
00
Temperature (°C)10 20 30 40 50 60 70 80
10
20
30
40
50
60
18 g
20 g
29 g
34 g
41 g
46 g
1.0 g
3.5 g
4.5 g
2.5 g
4.0 g
6.0 g6.5 g

H
© Harcourt Education Ltd 2003 Catalyst 1This worksheet may have been altered from the original on the CD-ROM.
Test yourselfAnswersSolutions
1 After each of these substances, write whether it is soluble orinsoluble.
a sand ......................................
b salt ......................................
c sugar ......................................
2 After each of these observations, write whether the substancedescribed is a pure substance or a mixture.
a Tap water leaves a white substance behind when it evaporates. ......................................
b When wet sand is filtered, the sand stays in the filter paper andthe water goes through. ......................................
c Distilled water leaves nothing behind when it evaporates. ......................................
3 Draw lines to match each mixture to the method or methods thatcould be used to separate the substances.
Mixture Separation method
sand and water ● ● evaporation
food dyes ● ● distillation
sea water ● ● filtering
copper sulphate solution ● ● chromatography
4 Which of these statements explains what happens to particles of asolute when they dissolve? Circle the correct letter.
A Solute particles fit into gaps between solvent particles.
B Solute particles disappear when they dissolve.
C Solute particles are surrounded by solvent particles.
D Solute particles don’t take up any space at all when theydissolve.
Sheet 1 of 3
insoluble
soluble
soluble
mixture
mixture
pure

H
© Harcourt Education Ltd 2003 Catalyst 1This worksheet may have been altered from the original on the CD-ROM.
Test yourselfAnswersSolutions (continued)
5 Phillip says that if you dissolve 5 g of salt in 25 g of water, the mass of thesolution will be 25 g, but Anita says it will be 30 g.
a Who is right? ................................
b Explain your answer. ................................................................................................................................
6 How does distillation separate a mixture of a liquid and a solid? Join theboxes with arrows to show the correct sequence.
7 Look at the results of chromatography on substances A to D.
Underline the statements that are true.
a A is a mixture of three different substances.
b B contains the same mixture of substances as D.
c C contains the same mixture of substances as D.
d B contains a different mixture of substances from C.
8 Tash wants to make a saturated solution but the instructions are mixed up.Write numbers 1 to 5 in the boxes to put the steps in the correct order.
The solution is now saturated.
Add a spatula of solute.
Keep adding more solute and stirring it until no more will dissolve.
Put some water in a beaker.
Stir until the solute has dissolved. 3
1
4
2
5
Sheet 2 of 3
A B C D
Anita
mass was conserved. 25g + 5g = 30g
The vapour is cooled.
The mixture is heated.
The liquid evaporates.
The vapour condenses.
The pure liquid is collected.
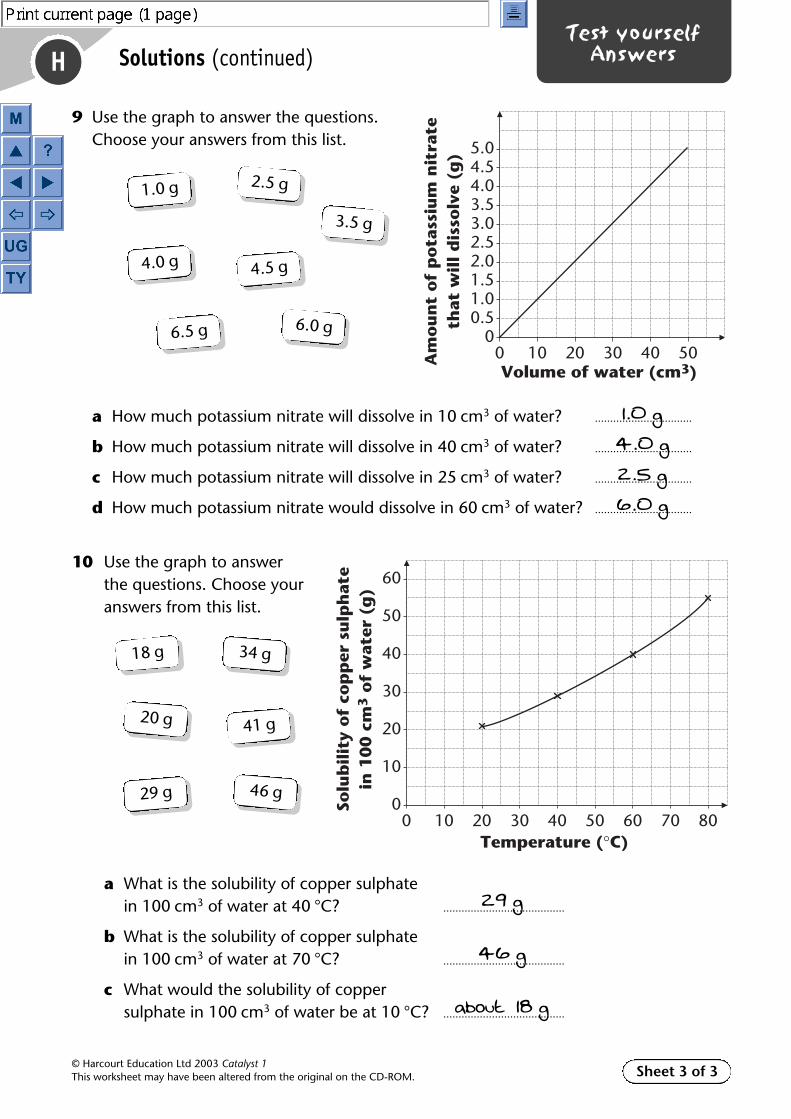
H
© Harcourt Education Ltd 2003 Catalyst 1This worksheet may have been altered from the original on the CD-ROM.
Test yourselfAnswersSolutions (continued)
9 Use the graph to answer the questions. Choose your answers from this list.
a How much potassium nitrate will dissolve in 10 cm3 of water? ................................
b How much potassium nitrate will dissolve in 40 cm3 of water? ................................
c How much potassium nitrate will dissolve in 25 cm3 of water? ................................
d How much potassium nitrate would dissolve in 60 cm3 of water? ................................
10 Use the graph to answer the questions. Choose your answers from this list.
a What is the solubility of copper sulphate in 100 cm3 of water at 40 °C? ........................................
b What is the solubility of copper sulphate in 100 cm3 of water at 70 °C? ........................................
c What would the solubility of copper sulphate in 100 cm3 of water be at 10 °C? ........................................
Sheet 3 of 3
Am
ou
nt
of
po
tass
ium
nit
rate
that
wil
l d
isso
lve
(g)
00Volume of water (cm3)
10 20 30 40 50
0.51.01.52.02.53.03.54.04.55.0
Solu
bil
ity
of
cop
per
su
lph
ate
in 1
00 c
m3 o
f w
ater
(g
)
00
Temperature (°C)10 20 30 40 50 60 70 80
10
20
30
40
50
60
18 g
20 g
29 g
34 g
41 g
46 g
1.0 g
3.5 g
4.5 g
2.5 g
4.0 g
6.0 g6.5 g
1.0 g
4.0 g
2.5 g
6.0 g
29 g
46 g
about 18 g

H
© Harcourt Education Ltd 2003 Catalyst 1This worksheet may have been altered from the original on the CD-ROM.
End of unit testGreenSolutions
1 Write down if each of these substances is soluble or insoluble.
a sand b salt c copper sulphate d gold 2 marks
2 You can get pure water from sea water. Write down the missing word from each of these stages.
a Sea water is ................... to evaporate the water. 1 mark
b The water vapour is ................... to condense back to water. 1 mark
c The pure ................... is collected in a test tube. 1 mark
d Stages a, b and c together are called .................... 1 mark
3 Tanya wanted to separate a mixture of solutes using filter paper and a solvent, but the instructions below are in the wrong order.
Write down letters A to D in the correct order. 2 marks
A Let the solvent move across the paper.
B Put dots of the mixture on the paper and let them dry.
C When the substances have split up, remove the paper from the solvent.
D Make a solution of the mixture.
4 a Dara is having trouble understanding what happens to copper sulphate when it dissolves in water. Which diagram shows best how the particles of solute and solvent might be arranged in copper sulphate solution? 2 marks
b Dara added 50 g of sugar to 200 g of water and found the mass of the solution was 250 g. Explain why that is the mass of the solution. 1 mark
Sheet 1 of 3
A B
solventparticle
solventparticle
soluteparticlesolute
particleC

H
© Harcourt Education Ltd 2003 Catalyst 1This worksheet may have been altered from the original on the CD-ROM.
End of unit testGreenSolutions (continued)
5 Cathy stirred salt into water at room temperature until no more would dissolve.
a What could Cathy see that told her that no more salt would dissolve? 1 mark
b What is this type of solution called? 1 mark
c Cathy was disappointed that so little salt would dissolve. Explain to Cathy what she could do to dissolve more salt in the same amount of water. 1 mark
6 Harry and Chris obtained these results from the chromatography of brown ink.
a Is brown ink a pure substance? 1 mark
b How many substances are there in brown ink? 1 mark
c Explain your answer to b. 1 mark
7 Alice was shipwrecked on a desert island that had no fresh water at all. She salvaged some plastic sheet and a can from the wreck and arranged it as shown in the diagram. She set it up in a position where it would be in the hot sun all day, then left it. Drops of water collected on the underside of the plastic sheet and fell into the can.
a What happens to the water in the hole? 1 mark
b What happens to the salt in the sea water? 1 mark
c Explain why the drops of water collect on the underside of the plastic sheet. 1 mark
Sheet 2 of 3
pencilline
sunlight
sea water
can
plastic sheet

H
© Harcourt Education Ltd 2003 Catalyst 1This worksheet may have been altered from the original on the CD-ROM.
End of unit testGreenSolutions (continued)
8 Katie is investigating which is more soluble in water at 50 °C, salt or sugar. She writes a plan for her investigation:
a Write two things she must do to keep her investigation fair. 2 marks
Katie added the powders by using a spatula and counting the number of spatulas of each she added. Emily said this was not a very precise way of finding which was more soluble.
b What could Katie do to make the measuring of the powders more precise? 1 mark
c Katie could have put both beakers into a water bath. How would this have improved the investigation? 1 mark
d How would Katie know whether salt or sugar was more soluble? 1 mark
Sheet 3 of 3
1. Collect the equipment.
2. Put water at 50 °C into two beakers.
3. Add the salt to one beaker and stir.
4. Add the sugar to the other beaker and stir.
5. Record the results.

H
© Harcourt Education Ltd 2003 Catalyst 1This worksheet may have been altered from the original on the CD-ROM.
End of unit testRedSolutions
1 Tanya wanted to separate a mixture of solutes using filter paper and a solvent, but the instructions below are in the wrong order.
Write down letters A to D in the correct order. 2 marks
A Let the solvent move across the paper.
B Put dots of the mixture on the paper and let them dry.
C When the substances have split up, remove the paper from the solvent.
D Make a solution of the mixture.
2 Harry and Chris obtained these results from the chromatography of brown ink.
a Is brown ink a pure substance? 1 mark
b How many substances are there in brown ink? 1 mark
c Explain your answer to b. 1 mark
3 Alice was shipwrecked on a desert island that had no fresh water at all. She salvaged some plastic sheet and a can from the wreck and arranged it as shown in the diagram. She set it up in a position where it would be in the hot sun all day, then left it. Drops of water collected on the underside of the plastic sheet and fell into the can.
a What happens to the water in the hole? 1 mark
b What happens to the salt in the sea water? 1 mark
c Explain why the drops of water collect on the underside of the plastic sheet. 1 mark
Sheet 1 of 3
pencilline
sunlight
sea water
can
plastic sheet

H
© Harcourt Education Ltd 2003 Catalyst 1This worksheet may have been altered from the original on the CD-ROM.
End of unit testRedSolutions (continued)
4 Use ideas about particles to explain how, during chromatography, substances are carried up the paper. 1 mark
5 a Dara is having trouble understanding what happens to copper sulphate when it dissolves in water. Which diagram shows best how the particles of solute and solvent might be arranged in copper sulphate solution? 2 marks
b Dara added 50 g of sugar to 200 g of water and found the mass of the solution was 250 g. Explain why that is the mass of the solution. 1 mark
6 Cathy stirred salt into water at room temperature until no more would dissolve.
a What could Cathy see that told her that no more salt would dissolve? 1 mark
b What is this type of solution called? 1 mark
c Cathy was disappointed that so little salt would dissolve. Explain to Cathy what she could do to dissolve more salt in the same amount of water. 1 mark
7 Alice and Ted distilled some copper sulphate solution. Use the particle model ideas to explain what happens when:
a the solution is heated 1 mark
b the vapour is cooled. 1 mark
At the end of the distillation, Ted noticed that the water they had collected was sparklingly clear.
c Explain how the distillation process removes impurities from the water. 1 mark
Sheet 2 of 3
A B
solventparticle
solventparticle
soluteparticlesolute
particleC

H
© Harcourt Education Ltd 2003 Catalyst 1This worksheet may have been altered from the original on the CD-ROM.
End of unit testRedSolutions (continued)
8 Nick and Elizabeth carried out a series of tests to measure the amounts of three substances that would dissolve in 100 cm3 of water at different temperatures. They drew a graph to show their results.
Use their graph to answer these questions.
a At 50 °C, which of the three substances is the most soluble? 1 mark
b At 20 °C, which of the three substances needs the least solute to make a saturated solution? 1 mark
9 Katie is investigating which is more soluble in water at 50 °C, salt or sugar. She writes this plan for her investigation.
Katie added the powders by using a spatula, and counting the number of spatulas of each she added. Emily said this was not a very precise way of finding which was more soluble.
a What could Katie do to make the measuring of the powders more precise? 1 mark
b Katie could have put both beakers into a water bath. How would this have improved the investigation? 1 mark
c How would Katie know whether salt or sugar was more soluble? 1 mark
d Katie says that her experiment proves that sugar is more soluble than salt. Emily is not so sure. What should Katie do to check the reliability of her investigation? 1 mark
e Emily says Katie should have used distilled water rather than tapwater for the investigation. Why does Emily say this? 1 mark
Sheet 3 of 3
Am
ou
nt
of
sub
stan
ce i
n g
th
atw
ill
dis
solv
e in
100 c
m3 w
ater
00
Temperature in °C10 20 30 40 50 60
A
C
B
10
20
30
40
50
1. Collect the equipment.
2. Put water at 50 °C into two beakers.
3. Add the salt to one beaker and stir.
4. Add the sugar to the other beaker and stir.
5. Record the results.

H
© Harcourt Education Ltd 2003 Catalyst 1This worksheet may have been altered from the original on the CD-ROM.
End of unit testmark schemeSolutions
Sheet 1 of 1
Green (NC Tier 2–5)
Scores in the range of: NC Level
4–7 2
8–13 3
14–17 4
18–25 5
Question Answer Mark Level
1 a Insoluble
b Soluble
c Soluble
d InsolubleAward 1 mark for two or three correct answers, 2 marks for four correct. 2 2
2 a Heated or boiled 1 3
b Cooled 1 3
c Water 1 3
d Distillation 1 3
3 DBAC 2 3Award 1 mark for D B – –.
4 a Diagram C 2 4Award 1 mark for diagram A.
b No mass was lost or gained as the same substances were present before and after dissolving. 1 5
5 a Salt at the bottom that would not dissolve/a residue of salt 1 4
b Saturated 1 4
c Raise the temperature of the solvent by heating 1 5
6 a No 1 4
b 4 1 4
c There are 4 blobs/dots 1 4
7 a It evaporates. 1 4
b It stays in the hole/at the bottom. 1 4
c The water vapour condenses on the (plastic) sheet/They condense on the (plastic) sheet. Accept equivalent answers. 1 4
8 a Use the same volume of water 1 3and the same mass of salt and sugar. 1 3
b Weigh them. 1 4
c It would keep both beakers at the same temperature. 1 4
d One would have more undissolved powder left. 1 4

H
© Harcourt Education Ltd 2003 Catalyst 1This worksheet may have been altered from the original on the CD-ROM.
End of unit testmark schemeSolutions
Sheet 1 of 1
Red (NC Tier 3–6)
Scores in the range of: NC Level
4–9 3
10–14 4
15–18 5
19–25 6
Question Answer Mark Level
1 DBAC 2 3Award 1 mark for D B – –.
2 a No 1 4
b 4 1 4
c There are 4 blobs/dots. 1 4
3 a It evaporates. 1 4
b It stays in the hole/at the bottom. 1 4
c The water vapour condenses on the (plastic) sheet/They condense on the (plastic) sheet. Accept equivalent answers. 1 4
4 Solute particles are carried up the paper by solvent particles. Accept equivalent answers. 1 5
5 a Diagram C 2 4Award 1 mark for diagram A.
b No mass was lost or gained as the same substances were present before and after dissolving/mass is conserved 1 5
6 a Salt at the bottom that would not dissolve/a residue of salt 1 4
b Saturated 1 4
c Raise the temperature of the solvent by heating it 1 5
7 a The particles move faster and/or when the solvent particles are hot enough they leave the liquid and move into the air and evaporate 1 6
b The particles move slower and/or when the gas particles are cool enough they get closer together so that they turn back to a liquid and condense 1 6
c The water evaporates but the dissolved substances do not, so they are left behind. 1 5
8 a C 1 5
b C 1 5
9 a Weigh them. 1 4
b Keep both beakers at the same temperature. 1 4
c One would have more undissolved powder left. 1 4
d Repeat it. 1 5
e Distilled water is pure/tap water already has some dissolved substances in it. 1 5

Sheet 1 of 1
H
© Harcourt Education Ltd 2003 Catalyst 1This worksheet may have been altered from the original on the CD-ROM.
Pupil check listSolutions
Learning outcomes I can do I can do I need tothis very this quite do more well well work on this
I can describe to someone else what a mixture is using my ideas of particles.
I can identify examples of solvents and solutes in solution.
I can describe the stages involved in extracting salt from rock salt.
I can sequence the stages involved in distillation.
I can explain how to separate a mixture of solutes in a solution using chromatography.
I can recognise and name the apparatus used in filtration, simple distillation and chromatography.
I can suggest ways that different mixtures can be separated.
I can draw conclusions from evidence in chromatograms.
I can decide if the evidence is enough to draw conclusions.
I can explain why mass is conserved during dissolving.
I can use my ideas of particles to help describe what happens in dissolving and how a saturated solution is formed.
I recognise that different solutes have different solubilities in water.
I can describe what affects how much solute will dissolve.
I can plan an investigation as a fair test.
I can evaluate how reliable my results are.
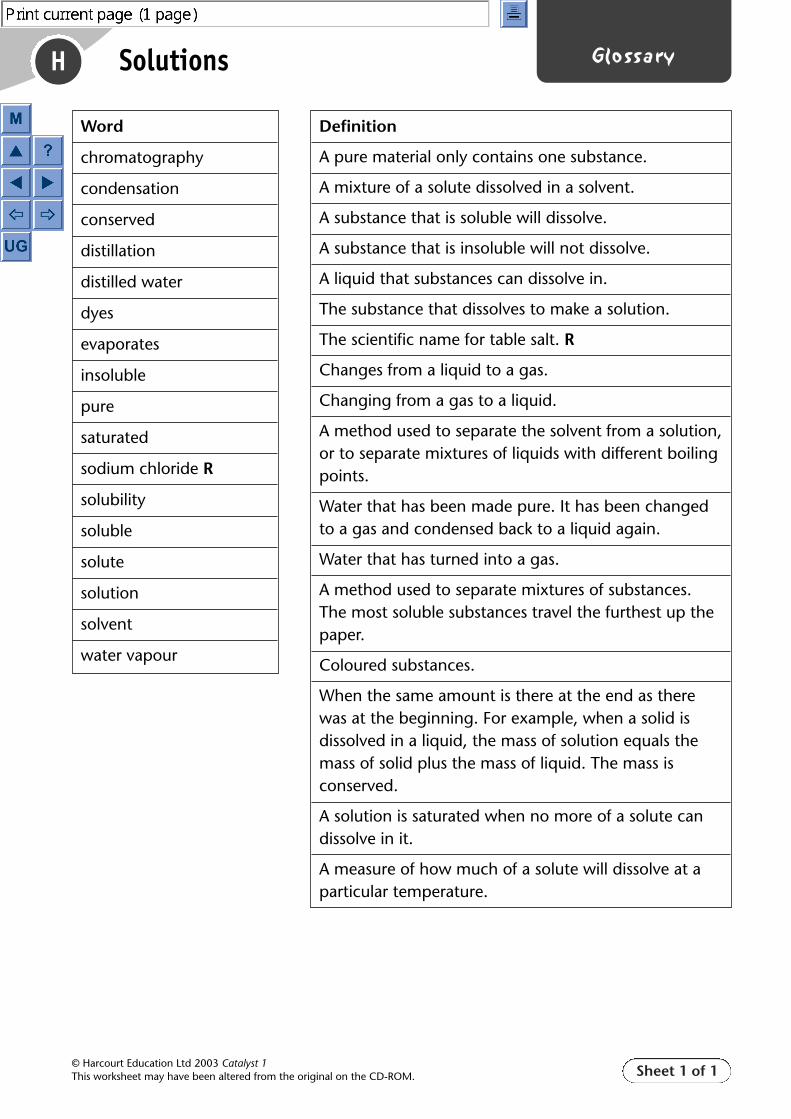
Sheet 1 of 1
H
© Harcourt Education Ltd 2003 Catalyst 1This worksheet may have been altered from the original on the CD-ROM.
Glossary
Word
chromatography
condensation
conserved
distillation
distilled water
dyes
evaporates
insoluble
pure
saturated
sodium chloride R
solubility
soluble
solute
solution
solvent
water vapour
Definition
A pure material only contains one substance.
A mixture of a solute dissolved in a solvent.
A substance that is soluble will dissolve.
A substance that is insoluble will not dissolve.
A liquid that substances can dissolve in.
The substance that dissolves to make a solution.
The scientific name for table salt. R
Changes from a liquid to a gas.
Changing from a gas to a liquid.
A method used to separate the solvent from a solution,or to separate mixtures of liquids with different boilingpoints.
Water that has been made pure. It has been changedto a gas and condensed back to a liquid again.
Water that has turned into a gas.
A method used to separate mixtures of substances.The most soluble substances travel the furthest up thepaper.
Coloured substances.
When the same amount is there at the end as therewas at the beginning. For example, when a solid isdissolved in a liquid, the mass of solution equals themass of solid plus the mass of liquid. The mass isconserved.
A solution is saturated when no more of a solute candissolve in it.
A measure of how much of a solute will dissolve at aparticular temperature.
Solutions

Sheet 1 of 1
H
© Harcourt Education Ltd 2003 Catalyst 1This worksheet may have been altered from the original on the CD-ROM.
Key wordsSolutions
chromatography
condensation
conserved
distillation
distilled water
dyes
evaporates
insoluble
pure
saturated
sodium chloride R
solubility
soluble
solute
solution
solvent
water vapour
H Key words
�
Sheet 1 of 1© Harcourt Education Ltd 2003 Catalyst 1This worksheet may have been altered from the original on the CD-ROM.
Solutions
chromatography
condensation
conserved
distillation
distilled water
dyes
evaporates
insoluble
pure
saturated
sodium chloride R
solubility
soluble
solute
solution
solvent
water vapour

H1 Pure saltGreena It is a mixture of different substances.b To dissolve it.c There are bits not dissolved.d To remove the bits that did not dissolve.e They heated the solution and evaporated the
water from it to leave the solid salt.f i Solute
ii Solventiii Solution
1 Word Meaningevaporating heating so that the solvent turns into
gas, leaving the solutefiltering passing through paper to separate
soluble and insoluble substancesinsoluble does not dissolve in a solventmixture more than one substancepure a substance on its own, with no other
substances mixed insoluble dissolves in a solvent to make a clear
solution2 1. Warm water is added to the rock salt to
make it dissolve.2. The salt solution with the undissolved
substances is poured into a filter containingfilter paper. The salt solution passes throughthe filter paper and is collected in a beakerwhile the undissolved substances remainbehind on the filter paper.
3. The salt solution in the beaker is heated toevaporate the water, leaving only puresolid salt in the beaker.
Reda There are bits not dissolved.b Salt solution.c Matthew. Some of the salt may have been lost
during the process.1 Individual presentations with content as:
dissolve when a substance mixes with aliquid to make a clear solution
insoluble does not dissolve in a solventsoluble dissolves in a solvent to make a
clear solutionundissolved when a substance does not mix
with a liquid and remains a solidsolution a mixture of a soluble substance
and a solventsolvent a liquid in which a solid will
dissolvesolute a solid which will dissolve in a
solute2 Put the mixture into water, stir well and filter.
Put aside the filtered solution and allow thewater to evaporate. This will produce pure salt.Put a magnet into the remaining mixture in thefilter paper. The iron filings will cling to themagnet and the sulphur will remain behind.
H2 DistillationGreena Salt and water.b Ac Cd De Bf Ag Dh The red solid and ethanol.1 To separate salt and water, we can use a method
called distillation. The water is boiled andturns into a gas. The water vapour reaches thecondenser where it cools down andcondenses. This pure water is called distilledwater.
2 By the process of distillation described inquestion 1 above.
Reda i A ii Cb i A ii Cc i Diagram A but with only a few open
circles and the large majority shadedparticles.
ii Diagram as i but with no open circles andonly shaded circles remaining.
1 C, A, D, B2 a i water
ii ethanolb ethanolc Sea water and crude oil.
H3 ChromatographyGreena Db 2c Greend Sunny yellow and solar yellow.e Sunburst yellow only.f No. Orange Brighties don’t contain sunburst
yellow colouring agent.g Yes. Yellow Brighties contain sunburst yellow
which Tony is allergic to.1 D, F, A, B, E, C.2 Yes. Description of suitable chromatography
investigation, as in question 1.
Reda Yellow Brighties. Yellow Brighties contain
sunburst yellow which Tony is allergic to.b Green, purple, red.1 a 3
b Bc Ad No. All have moved off from the starting
points at the Xs.
H Book answersSolutions
Sheet 1 of 2© Harcourt Education Ltd 2003 Catalyst 1This worksheet may have been altered from the original on the CD-ROM.

2 a i Solar yellow, mellow yellow, sunburstyellow.
ii Sunburst yellow, mellow yellow, solaryellow.
b Write the additives on the label.3 Yes. Description of suitable chromatography
investigation, as in question 1.
H4 Crime and coloursGreena Shaheen cut the words out of the cheque.
Shaheen dissolved the ink in a solvent.Shaheen filtered out the lumps of paper.
b Take a piece of filter paper. Draw a pencil lineat the bottom with two small crosses. Make inkspots on the crosses. Put the paper into abeaker with a small amount of propanone inthe bottom. Allow the solvent to run up thepaper and separate the dyes. Take out the filterpaper when the solvent reaches the top. Let itdry.
c Five. There are only five spots when viewedunder normal and UV light.
d Six. There are six spots visible when viewed inUV light.
e The extra dye in ink A could have come fromcontamination in the equipment and solvent.
f There are only five spots for ink B but six spotsfor ink B when viewed in UV light.
g Unless there was contamination in theapparatus, the words on the cheque are likelyto have been written by two different people.
1 a The ink ran out.b Unlikely, but possible. The ink usually runs
out gradually and there should normally beenough to finish writing the cheque. Do achromatography test on Mr Jones’ otherpen.
2 Individual answers. You should describe thebasic principles of chromatography and howyou carried out the experiment and whatresults you got.
Reda The bright blue dye didn’t move at all in
ethanol but was the highest spot in propanone.b In the first experiment three of the dyes were
soluble and moved up the paper. One spotremained at the cross, showing it was insoluble.But this one spot could have contained two ormore insoluble dyes, so there were at least fourdyes in that ink.
c The solubility of different dyes are different inone solvent from their solubility in othersolvents.
d Yes. The dyes showed the same action in bothsolvents.
e Yes. The two inks were the same.
f Some dyes will show up under UV light whicharen’t visible in normal light.
g No. The inks show different numbers of spotsunder UV light.
h There might have been contamination in thecontainer that held ink A.
i The colours seen in UV light would be different.j If she repeated the chromatography experiment
with the same results after having made certainthere were no contaminants in the aparatus,she would have confirmed her results.
k No. Mr Crisp might have used the same ink.1 Yes. All of the dyes were soluble in propanone
and were viewed under UV light.2 a The ink ran out.
b Unlikely, but possible. The ink usually runsout gradually and there should normally beenough to finish writing the cheque.
3 a Individual answers. You should describe thebasic principles of chromatography and howyou carried out the experiment and whatresults you got.
b No. This part of the experiment didn’t giveany information so it would only be a wasteof time to introduce the information.
c i The scientific evidence is indisputable.ii No.
H5 SolubilityGreena i 5.00 g ii 100.00 g iii 105.00 gb 50 gc 125 gd Hot water.1 When a substance dissolves, the particles from
the solute are surrounded by particles ofsolvent to make a solution. When thesolution is hotter, the solute dissolves morequickly. When no more of a substance willdissolve, the solution is saturated.
2 110 g. The mass of the copper sulphate remains10 g whether it is a solid or in solution.
Reda 50 gb 32 gc Xd i 60 g ii 40 ge 20 g1 Solubility is the mass of a substance that will
dissolve in 100 cm3 of solvent.2 a 265 g
b No. 10 g of copper sulphate in 50 cm3 ofwater is the same as 20 g of copper sulphatein 100 cm3 of water. But 22 g of coppersulphate can be dissolved in 100 cm3 ofwater. Therefore the solution is not quitesaturated.
H Book answers
Sheet 2 of 2© Harcourt Education Ltd 2003 Catalyst 1This worksheet may have been altered from the original on the CD-ROM.