Embed Size (px)
Citation preview
SO
LU
CIA
, IN
C. Innovations and Consumer Driven
Track: The New Frontier - Incorporating Lab Values and HRAs
into Predictive Models
Christian BirkmeyerSolucia, Inc.
December 13, 2007
THE NATIONAL PREDICTIVE MODELING SUMMIT
© Solucia, Inc. 2007
SO
LU
CIA
, IN
C.
2 Proprietary
• Are health risk assessment (HRA) responses and specific lab values correlated with future medical costs?
• Do HRAs and lab values provide additional predictive power over claims-only predictive models?
• Can HRAs help predict future medical costs if claims are not available?
Questions
© Solucia, Inc. 2007
SO
LU
CIA
, IN
C.
3 Proprietary
• Commercial members within large regional health plan
• More than 2 million members with continuous enrollment between April 2005 and March 2007
• Over $7 Billion in total annual allowed claims or $3,500 per member per year (PMPY)
Population
© Solucia, Inc. 2007
SO
LU
CIA
, IN
C.
4 Proprietary
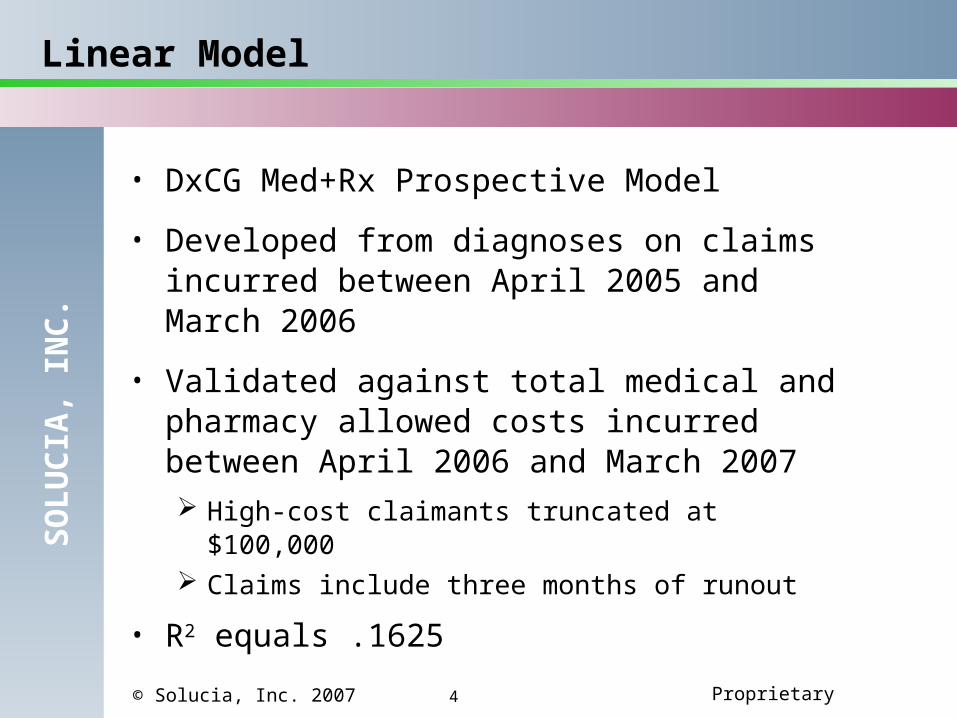
• DxCG Med+Rx Prospective Model
• Developed from diagnoses on claims incurred between April 2005 and March 2006
• Validated against total medical and pharmacy allowed costs incurred between April 2006 and March 2007 High-cost claimants truncated at $100,000 Claims include three months of runout
• R2 equals .1625
Linear Model
© Solucia, Inc. 2007
SO
LU
CIA
, IN
C.
5 Proprietary
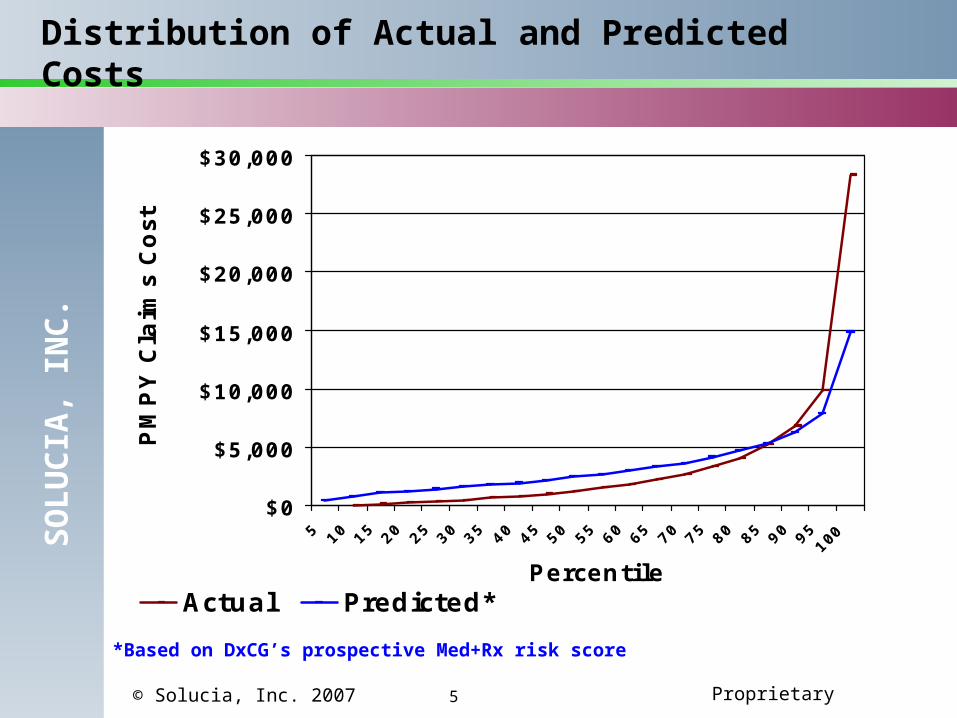
Distribution of Actual and Predicted Costs
$0
$5,000
$10,000
$15,000
$20,000
$25,000
$30,000
5 10 15 20 25 30 35 40 45 50 55 60 65 70 75 80 85 90 95100
Percentile
PM
PY
Cla
ims
Cost
Actual Predicted*
*Based on DxCG’s prospective Med+Rx risk score

© Solucia, Inc. 2007
SO
LU
CIA
, IN
C.
6 Proprietary
• Prioritize members for care management interventions
• Focus on relative risk of future costs rather than absolute predicted costs for a member
• More interested in maximizing prediction of high-risk members than predicting cost across the entire population
Context

© Solucia, Inc. 2007
SO
LU
CIA
, IN
C.
7 Proprietary
• Receiver Operating Characteristic (ROC) curve:
Definition: A graphical representation of the trade off between the false negative and false positive rates for every possible cut off. By tradition, the plot shows the false positive rate (1-specificity) on the X axis and the true positive rate (sensitivity or 1 - the false negative rate) on the Y axis
Interpretation:• .90-1.0 = Excellent• .80-.90 = Good• .70-.80 = Fair• .60-.70 = Poor• .50-.60 = Fail
Logistic Model Performance Assessment

© Solucia, Inc. 2007
SO
LU
CIA
, IN
C.
8 Proprietary
• Prediction of high-cost individuals having total medical and pharmacy claims greater than or equal to $10,000
• A split sample approach was used randomly selecting 50% of the population for model calibration and 50% for model validation
Population Logistic Model
Calibration Group
Validation Group
Members (n) 1,068,844 1,067,391
Average Cost $3,535 $3,532
High cost (n) 71,064 70,850
High cost (%) 6.65% 6.64%

© Solucia, Inc. 2007
SO
LU
CIA
, IN
C.
9 Proprietary
• ROC Curve Description of Model Area = .811
Population Model Performance
0%
20%
40%
60%
80%
100%
0% 20% 40% 60% 80% 100%
1-Specificity
Sensitivity
© Solucia, Inc. 2007
SO
LU
CIA
, IN
C.
10 Proprietary
• HRA administered to select large employer groups with questions in the following areas: General Demographics Biometrics Health Screening and Immunizations Personal and Family Disease History Weight Management Nutrition Physical Activity Tobacco and Alcohol Stress and Well-Being Injury Prevention Sexual Behavior
• 25,708 members completed HRAs between November 2005 and March 2006 and were continuously enrolled through March 2007
HRA Overview
© Solucia, Inc. 2007
SO
LU
CIA
, IN
C.
11 Proprietary
• Specific responses are clearly associated with higher future costs
• See attached Excel file for detailed findings
Preliminary HRA Assessment
© Solucia, Inc. 2007
SO
LU
CIA
, IN
C.
12 Proprietary
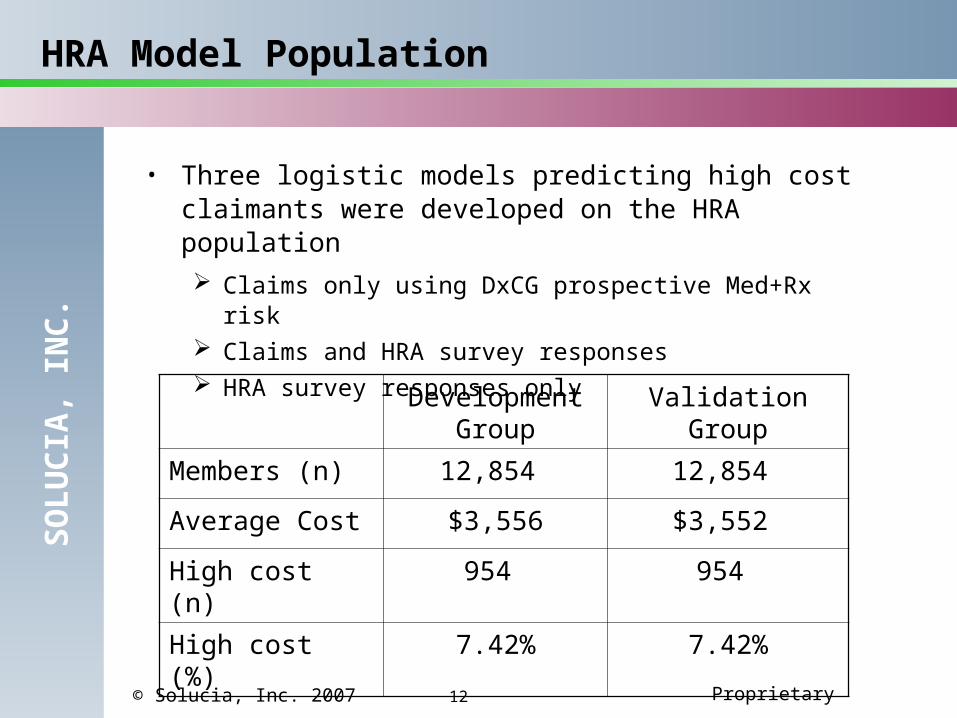
• Three logistic models predicting high cost claimants were developed on the HRA population Claims only using DxCG prospective Med+Rx risk Claims and HRA survey responses HRA survey responses only
HRA Model Population
Development Group
Validation Group
Members (n) 12,854 12,854
Average Cost $3,556 $3,552
High cost (n) 954 954
High cost (%) 7.42% 7.42%

© Solucia, Inc. 2007
SO
LU
CIA
, IN
C.
13 Proprietary
• ROC Curve Area = .775
Claims Only Model Performance
0%
20%
40%
60%
80%
100%
0% 20% 40% 60% 80% 100%
1-Specificity
Sensitivity
© Solucia, Inc. 2007
SO
LU
CIA
, IN
C.
14 Proprietary
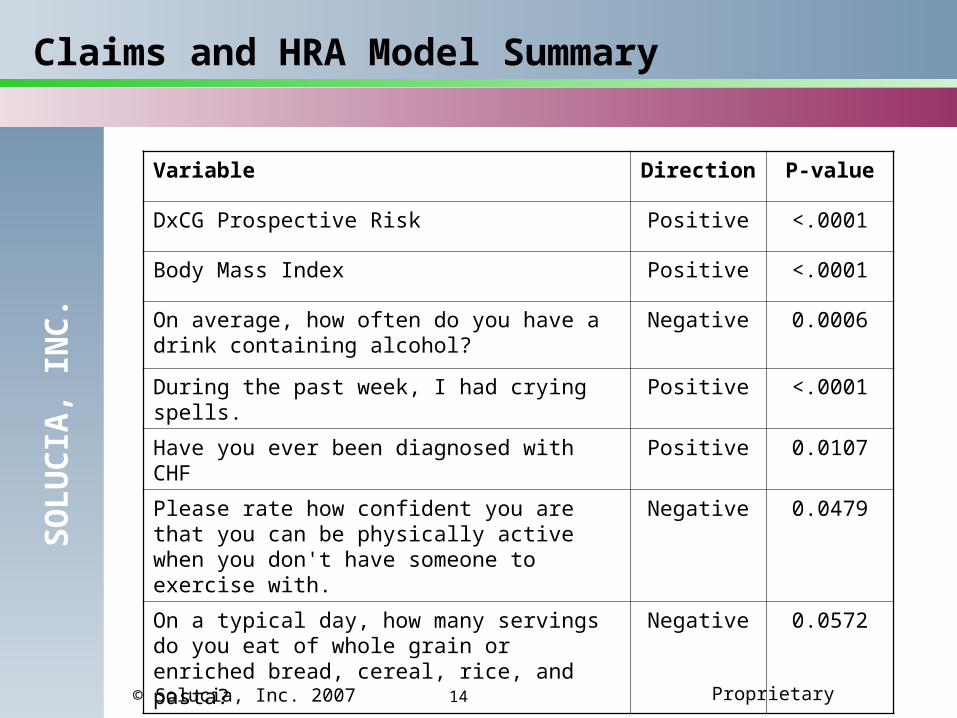
Claims and HRA Model Summary
Variable Direction P-value
DxCG Prospective Risk Positive <.0001
Body Mass Index Positive <.0001
On average, how often do you have a drink containing alcohol?
Negative 0.0006
During the past week, I had crying spells. Positive <.0001
Have you ever been diagnosed with CHF Positive 0.0107
Please rate how confident you are that you can be physically active when you don't have someone to exercise with.
Negative 0.0479
On a typical day, how many servings do you eat of whole grain or enriched bread, cereal, rice, and pasta?
Negative 0.0572
© Solucia, Inc. 2007
SO
LU
CIA
, IN
C.
15 Proprietary
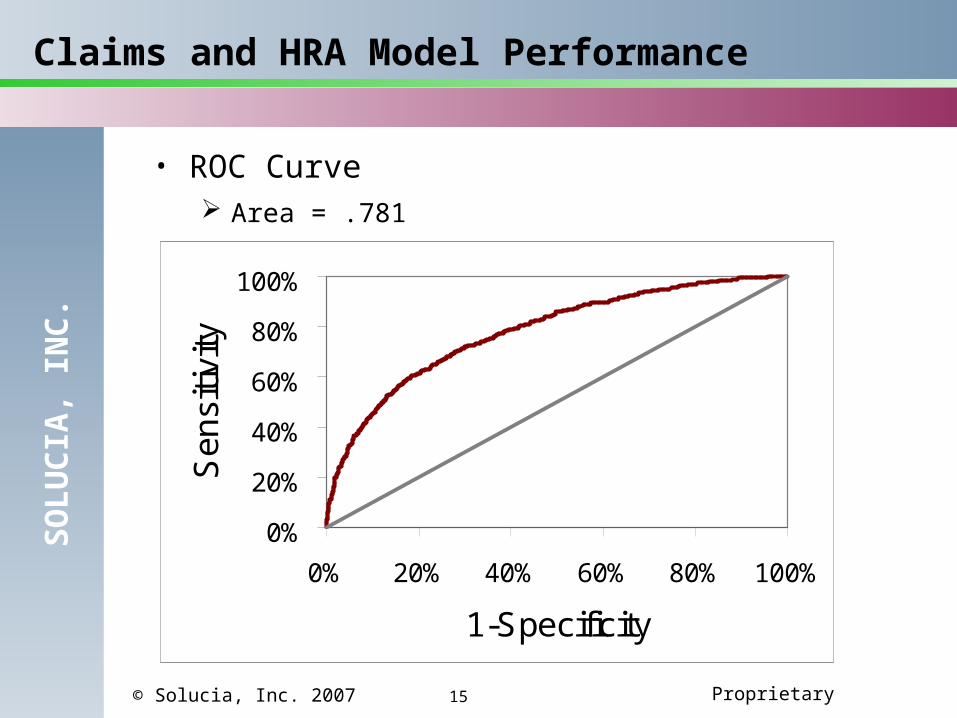
Claims and HRA Model Performance
• ROC Curve
Area = .781
0%
20%
40%
60%
80%
100%
0% 20% 40% 60% 80% 100%
1-Specificity
Sensitivity
© Solucia, Inc. 2007
SO
LU
CIA
, IN
C.
16 Proprietary
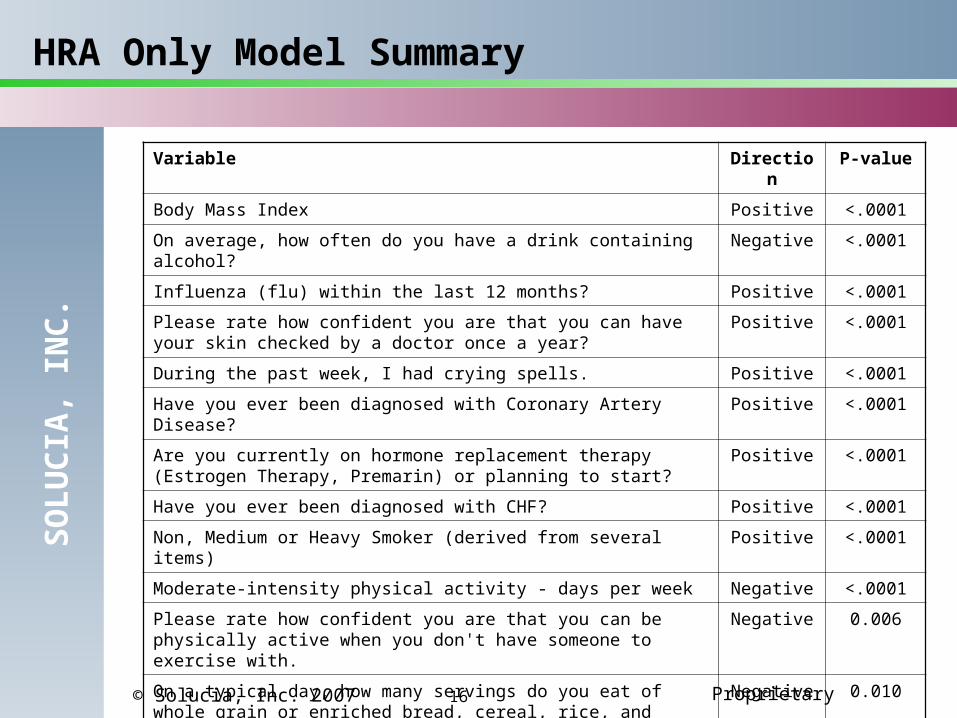
HRA Only Model Summary
Variable Direction P-value
Body Mass Index Positive <.0001
On average, how often do you have a drink containing alcohol? Negative <.0001
Influenza (flu) within the last 12 months? Positive <.0001
Please rate how confident you are that you can have your skin checked by a doctor once a year?
Positive <.0001
During the past week, I had crying spells. Positive <.0001
Have you ever been diagnosed with Coronary Artery Disease? Positive <.0001
Are you currently on hormone replacement therapy (Estrogen Therapy, Premarin) or planning to start?
Positive <.0001
Have you ever been diagnosed with CHF? Positive <.0001
Non, Medium or Heavy Smoker (derived from several items) Positive <.0001
Moderate-intensity physical activity - days per week Negative <.0001
Please rate how confident you are that you can be physically active when you don't have someone to exercise with.
Negative 0.006
On a typical day, how many servings do you eat of whole grain or enriched bread, cereal, rice, and pasta?
Negative 0.010
In the last month, how often have you felt nervous and stressed?
Positive 0.016
© Solucia, Inc. 2007
SO
LU
CIA
, IN
C.
17 Proprietary
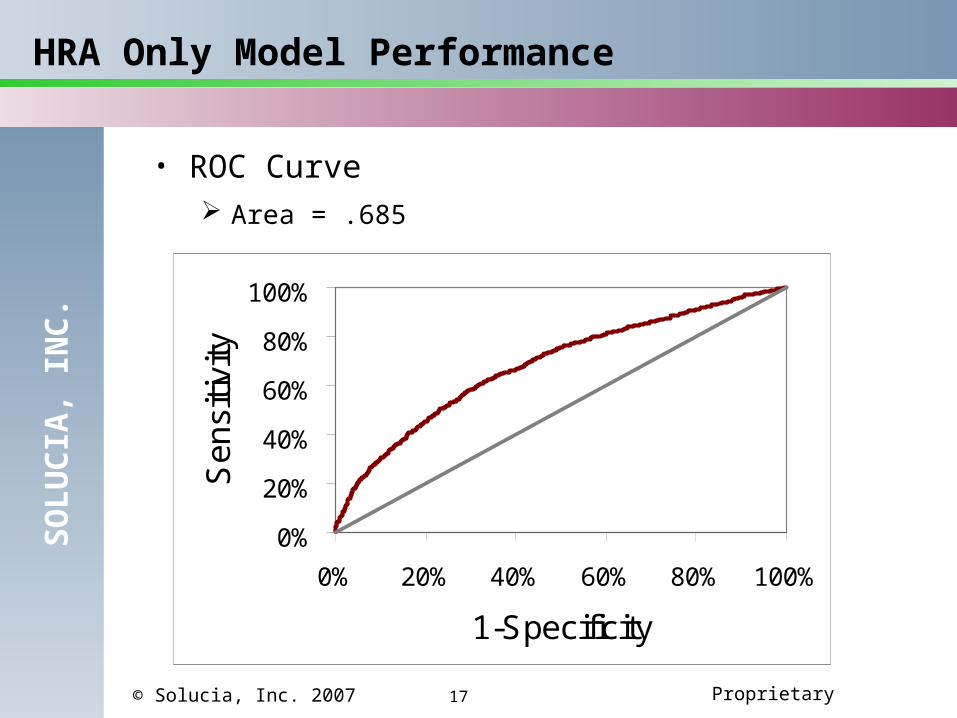
HRA Only Model Performance
• ROC Curve Area = .685
0%
20%
40%
60%
80%
100%
0% 20% 40% 60% 80% 100%
1-Specificity
Sensitivity
© Solucia, Inc. 2007
SO
LU
CIA
, IN
C.
18 Proprietary
• Lab values were provided by a large national laboratory
• Values available for approximately 20% of the total population having lab tests
• 65,906 members had lab values for tests administered between April 2005 and March 2006 and were continuously enrolled through March 2007
Lab Value Overview

© Solucia, Inc. 2007
SO
LU
CIA
, IN
C.
19 Proprietary
• Specific lab tests are associated with higher future costs
• See attached Excel file for detailed findings
Preliminary Lab Value Assessment

© Solucia, Inc. 2007
SO
LU
CIA
, IN
C.
20 Proprietary
• Two logistic models predicting high cost claimants were developed on members with lab values available Claims only using DxCG prospective Med+Rx risk Claims and lab values for specific tests
Lab Value Model Population
Development Group
Validation Group
Members (n) 32,953 32,953
Average Cost 7,156 7,154
High cost (n) 5667 5666
High cost (%) 17.20% 17.19%

© Solucia, Inc. 2007
SO
LU
CIA
, IN
C.
21 Proprietary
Claims Only Model Performance
• ROC Curve
Area = .815
0%
20%
40%
60%
80%
100%
0% 20% 40% 60% 80% 100%
1-Specificity
Sensitivity

© Solucia, Inc. 2007
SO
LU
CIA
, IN
C.
22 Proprietary
Claims and Lab Value Model Summary
Variable Association
P-Value
DxCG Prospective Risk Positive <.0001
HDL (maximum) Negative <.0001
Neutrophils (maximum) Positive <.0001
LDL (maximum) Negative 0.0002
Hemoglobin (n) Positive 0.001
Neutrophils (n) Positive 0.0011
Alkaline Phosphatase (maximum) Positive 0.0033

© Solucia, Inc. 2007
SO
LU
CIA
, IN
C.
23 Proprietary
Claims and Lab Values Model Performance
• ROC Curve Area = .817
0%
20%
40%
60%
80%
100%
0% 20% 40% 60% 80% 100%
1-Specificity
Sensitivity
© Solucia, Inc. 2007
SO
LU
CIA
, IN
C.
24 Proprietary
• Claims-based models are very effective in predicting high-cost claimants
• HRA Survey responses are correlated with future costs HRAs can be used to identify high-risk individuals if
claims are not available Survey responses do not provide material
improvement over claims in first year
• Lab values Lab values for specific tests are correlated with
future costs, particularly for members with specific conditions
Lab values provide little improvement over claims in identifying high-cost members across the population
Summary
© Solucia, Inc. 2007
SO
LU
CIA
, IN
C.
25 Proprietary
Limitations
• HRA Models developed for single population with
one year of follow-up Short term risk already identified through
claims Costs associated with behavioral issues may
take longer than one year to manifest HRA responses may provide insights into other
factors key to care management success:• Identify members receptive to intervention• Identify members with opportunity to impact

© Solucia, Inc. 2007
SO
LU
CIA
, IN
C.
26 Proprietary
Limitations (continued)
• Lab values Models developed for single population with
one year of follow-up. Short term risk already identified through
claims Costs associated with sub-optimal lab values
may take longer than one year to be experienced
Lab values may provide more value in specific sub-populations (e.g., diabetics)
Members with out of range lab values may provide greater opportunity to impact

SO
LU
CIA
, IN
C.
Questions?