Embed Size (px)
Citation preview

Rochester Institute of Technology Rochester Institute of Technology
RIT Scholar Works RIT Scholar Works
Theses
5-2019
Solid Phase Synthesis of Modular Peptide-based Targeted Solid Phase Synthesis of Modular Peptide-based Targeted
Molecular Imaging Agents Molecular Imaging Agents
Xinyu Xu [email protected]
Follow this and additional works at: https://scholarworks.rit.edu/theses
Recommended Citation Recommended Citation Xu, Xinyu, "Solid Phase Synthesis of Modular Peptide-based Targeted Molecular Imaging Agents" (2019). Thesis. Rochester Institute of Technology. Accessed from
This Thesis is brought to you for free and open access by RIT Scholar Works. It has been accepted for inclusion in Theses by an authorized administrator of RIT Scholar Works. For more information, please contact [email protected].

i
Solid Phase Synthesis of Modular Peptide-based
Targeted Molecular Imaging Agents
Xinyu Xu
A thesis submitted in Partial Fulfillment of the Requirements for the Degree
Master of Science in Chemistry
Supervised by
Dr. Hans Schmitthenner
School of Chemistry and Materials Science
The College of Science
Rochester Institute of Technology
May, 2019
Signature of the Author _____________________________
Accepted by ______________________________________
Director, M.S. Degree Program Date

ii
SCHOOL OF CHEMISTRY AND MATERIALS SCIENCE
COLLEGE OF SCIENCE
ROCHESTER INSTITUTE OF TECHNOLOGY
ROCHESTER, NEW YORK
CERTIFICATE OF APPROVAL
________________________________________________________________________
M.S. DEGREE THESIS
________________________________________________________________________
The M.S. Degree Thesis of Xinyu Xu has
been examined and approved by the thesis
committee as satisfactory for the thesis required for
the M.S. degree in Chemistry.
____________________________________________
Dr. Hans Schmitthenner, Thesis Advisor
____________________________________________
Dr. Jeffrey Mills
____________________________________________
Dr. Scott Williams
____________________________________________
Dr. George Thurston
____________________________________________
Date

iii
Abstract
Targeted molecular imaging agents (TMIA) are emerging as useful tools for early
diagnosis of cancer and other diseases. These agents couple imaging agents such as near
infrared fluorescence (NIRF) dyes or metallic contrast agents such as gadolinium (Gd) used
in magnetic resonance imaging (MRI) to targeting agents that bind to biomarker receptors
in cancer cells. Our group has developed a modular synthesis of peptide-based TMIAs
containing these two agents starting from “puzzle pieces”. Puzzle pieces, or modules, are
amino acids with imaging groups bonded to their side chains. These are assembled together
to form imaging peptides which are then conjugated to targeting groups. The research goal
was to synthesize targeting peptides using solid phase peptide synthesis (SPPS), and then
add the imaging puzzle pieces to these in the same SPPS method. SPPS is widely used and
has many advantages in the synthesis of TMIAs. The first goal, to learn how to synthesize
simple peptides by SPPS, was accomplished. The second goal of making Met-enkephalin,
a bioactive penta-peptide, and conjugating the imaging puzzle pieces containing a NIRF
dye or gadolinium chelate for MRI by SPPS was also successful. The final goal, to
synthesize a deca-peptide, 18-4a, useful for targeting breast cancer and then to couple these
same imaging puzzle pieces, to the peptide 18-4 in the last step, was also accomplished.
iv
Acknowledgements
First, I would like to extend my heartfelt thanks to my research advisor, Professor
Dr. Hans Schmitthenner, for all the help, patience, time and support during my graduate
study. I could not finish my research and thesis without his help.
Secondly, I would like to recognize the contributions from my committee members:
Dr. Williams, Dr. Mills, and Dr. Thurston for their helpful suggestions on presenting my
research and in the final manuscript and I would thank all my research lab members. Emily
Mahoney, Damien Dobson, Dana Murphy Soika, Toan Mach, and Matt Law for their
assistance, and for helping to keep the lab functional and tidy.
I would like to show my gratitude to Dr. Kamaljit Kaur from Chapman University
for providing our first sample of the breast cancer peptide 18-4a, and for her help in
mentoring me and my adviser in the choice of which peptide to synthesize and help with
the actual synthetic design. I would also like to show my gratitude also to Dr. Justin Miller
of Hobart College for his help in the techniques of SPPS including a manual for synthesis
prepared in his lab that he shared with us.
Support for this project was received from two R15 NIH grants from the NIH:
1R15CA192148-01 entitled “Targeted Molecular Agents for Photoacoustic Imaging of
Prostate Cancer” and R15CA219915-01 entitled “High Relaxivity PSMA-Targeted
Contrast Agents for MRI of Prostate Cancer”.
Lastly, my family has been very supportive in my graduate studies and I would like
to sincerely thank them from the bottom of my heart.

v
Abbreviations
AA (Amino Acids)
ACN (Acetonitrile, an organic solvent used in HPLC)
Boc (Tert-butyloxycarbonyl, a protecting group removed in strong acid)
CFM (Confocal fluorescence microscopy)
DCM (Dichloromethane)
DEA (Diethylamine, a de-protecting agent for Fmoc)
DIPA (Diisopropyl ethyl amine, also called DIEA, used as a base in coupling reactions)
DMF (N,N-dimethylformamide, a solvent for peptide coupling)
DOTA (1,4,7,10-Tetraazacyclododecane-1,4,7,10-tetraacetic acid)
Fmoc (Fluorenylmethyloxycarbonyl, a common peptide protecting group)
HATU (A common peptide coupling reagent)
HPLC (High Pressure Liquid Chromatography)
LC-MS (liquid chromatography – mass spectrometry)
MeOH (Methanol an organic solvent used in HPLC)
MRI (Magnetic Resonance Imaging)
MS (Mass Spectrometry)
Mtt (Methyltrityl, a protecting group that is easily removed with mild acid)
NIR (Near-Infrared)
NIRF (Near-Infrared Fluorescent)
NIRQ (Near-Infrared Quencher)
NMM (N-methylmorpholine, used as a base in coupling reactions)
NMP (N-methylpyrolidine, a peptide coupling solvent)
PAI (Photoacoustic Imaging)
PCa (Prostate Cancer)
PET (Positron Emission Tomography)
λmax (Lamda Max, peak wavelength in UV-Vis-NIR absorption spectroscopy
TBTU (A common peptide coupling reagent)
TCA Targeted contrast agent
TFA (Trifluoroacetic acid, a common buffer, also used to remove protecting groups)
THF (Tetrahydrofuran, an organic solvent)
TMIA (Targeted molecular imaging agent)
TSTU (A common peptide coupling reagent)
UV-Vis-NIR (Ultra Violet – Visible – NIR absorption spectroscopy)

vi
Amino Acids Abbreviations
Amino Acids Three Letter Abbreviations One Letter Abbreviations
Alanine Ala A
Glutamic Acid Glu E
Glutamine Gln Q
Glycine Gly G
Isoleucine Ile I
Leucine Leu L
Lysine Lys K
Methionine Met M
Phenylalanine Phe F
Tryptophan Try W
Tyrosine Tyr Y
Norleucine Nle X
Information on NIR dyes utilized
Cy5.5: NIRF dye absorbing at 680 nM and fluorescing at 710 nM, useful in confocal
fluorescence microscopy (CFM).

vii
Nomenclature of Peptides containing Dyes and Metals
In peptide synthesis, the structures are synthesized from right to left, but named in
the left to right by convention. In solution phase synthesis, the C-terminal carboxylic acid
on the right, may be changed to a C-terminal amide, to make it non-reactive. The nitrogen
on each amino acid coupled is most often protected by an Fmoc group. This nitrogen and
protecting group on the left side of the peptide chain is referred to as the N-terminus.
In peptide nomenclature, the three letters abbreviation is the standard utilization for
amino acids. Side chains are drawn alternately up and down. Natural amino acid is a solid
wedge when up and dashed when down. Unnatural is the opposite. Unnatural amino acids
are prefaced by d in three letter abbreviations, and are lower-case letters in one-letter
abbreviations. Unnatural amino acids are put in to give proteolytic stability. A protecting
group should be brought in on the amines of side chains. These protecting groups are
written in parentheses. We introduced a convention of putting the imaging groups,
likewise, in parentheses. This is important since our imaging groups are added on the side
chains of the amino acids. The illustrations represent the peptide, Met-enkephalin, with the
dye Cy5.5 or with the metal-chelate Gd-DOTA on the side chain of d-Lysine.
Fmoc-dLys(Cy5.5)-Tyr- Gly-Gly-Phe-Met-NH2 Fmoc-dLys(Gd-DOTA)-Tyr(tBu)-Gly-Gly-Phe-Met-NH2

viii
Table of Contents
Solid Phase Synthesis of Modular Peptide-based Targeted Molecular Imaging
Agents………………………………………………………………………………..i
CERTIFICATE OF APPROVAL………………………………………………… .ii
Abstract…………………………………………………………………………..... iii
Acknowledgements…………………………………………………………………iv
Abbreviations…………………………………………………………………...…...v
Nomenclature of Peptides containing Dyes and Metals……………………………vii
Table of Contents………………………………………………………………….viii
List of Figure………………………………………………………………………..ix
List of Schemes……………………………………………………………………...x
List of Tables…………………………………………………………………...........x
Chapter 1. Background Information
1.a. Cancer and Early Detection…………………………………………...……..….1
1.b. Modular “Puzzle Piece Approach” (peptides)……………………………..…....3
1.c. Solid Phase Peptide Synthesis……………………………………………...……6
Chapter 2. Solid Phase Peptide Synthesis (SPPS) Methods
2.a. Choice of SPPS resin………………………………………..……………..........8
2.b. Calculation of micro-equivalents of amine on resin……………………….……8
2.c. Preparation of deprotected resin for synthesis………………………………….10
2.d. General procedure for the optimization of peptides……………………..…......12
2.e. Mechanism of the deprotection of Fmoc……………………………….………14
2.f. Mechanism of coupling of amino acids by HATU……………………………..15
2.g. Mechanism of cleavage of peptide from the Xanthenyl………………….…….16
Chapter 3. Optimized Step-by-step recipe for the SPPS of peptide
3.a. Pre-Swelling……………………………………………………….……….….17
3.b. Fmoc Deprotection………………………………………………………..…...17
3.c. Washing after Deprotection…………………………………………….….…..17
3.d. Calculation of Equivalents…...…………………………………………..….....17
3.e. Coupling Amino Acids…………………………………………………..…….18
3.f. Washing after Coupling…………………………………………………...…...19
3.g. Synthesizing Longer Peptide Chains……………………………….…….…....19
3.h. Final Wash…………………………………………………………….….…....19
3.i. Cleavage………………………………………………………………….…….19
3.j. Method development versus yield determination………….…………….……..19
Chapter 4. Puzzle pieces
4.a. Puzzle piece methodology……………………………………………….…….21
4.b. Cy5.5 (imaging module) puzzle piece…………………………………..……..21

ix
4.c. Stability of imaging agents Cy5.5 and Gd-DOTA in dilute TFA………...……23
4.d. Synthesis tripeptides plus imaging modules Cy5.5…………………………....25
4.e. Gd-DOTA puzzle pieces………………………………………………...….....26
4.f. Synthesis of tri-peptides plus Gd-DOTA…………………………..…………..29
Chapter 5. Met-enkephalins
5.a. The choice of Met-enkephalins as a model system………………….…....…….31
5.b. Synthesis of Met-enkephalin……………………………………………..……31
5.c. Cy5.5 Met-enkephalin……………………………………...……………..…...32
5.d. Gd-DOTA Met-enkephalin…………………………………………….……...33
Chapter 6. Breast cancer peptides
6.a. Breast cancer targeting peptide 18-4…………………………………….……..35
6.b. SPPS of breast cancer targeting peptide 18-4…………………………….…....37
6.c. Cy 5.5 labelled breast cancer Fmoc-protected targeting peptide 18-4……........39
6.d. Cy 5.5 labelled breast cancer targeting peptide 18-4……………………….......40
6.e. Gd-DOTA labelled breast cancer targeting peptide 18-4………………………41
6.f. Confocal Fluorescence Microscopy of Breast Cancer Cells Targeted with Cy5.5
labelled 18-4……………………………………………………………………………...42
Chapter 7. Conclusion…………………………………….………..………....….….....43
Chapter 8. Experimental Procedures
Materials and Methods……………………………………………………………..44
Synthetic Procedures……………………………………………………………….45
References……………………………………………………………………………….51
Appendix I: Analytical Data…………………………………………………………..53
List of Figures
Figure 1: Synthesis of TMIAs using solution phase synthesis and SPPS…………………..4
Figure 2: The structure of Sieber resin……………………………………………………..8
Figure 3: The origin of impurities………………………………………………………...12
Figure 4: High stability of Gd-DOTA using the module Fmoc-Lys(Gd-DOTA)-NH2…..25
Figure 5: Structure of Breast cancer peptide……………………………………………...35
Figure 6: TMIA “M1”, peptide 18-4 labelled on the 3-lysine side chain with Cy5.5…….36
Figure 7: MDA-MD-231 BrCa cells stained with TMIA “M1” and NucBlu ……………36
Figure 8: Structure of Breast cancer peptide with non-sulfonated Cy5.5…………………39
Figure 9: Structure of Breast cancer peptide with non-sulfonated Cy5.5 (No Fmoc
protecting group)…………………………………………………………………………40
Figure 10: Molecular Weight of Peptides………………………………………………...40
Figure 11: Structure of Breast cancer peptide with metal-chelate complex Gd-DOTA…..41
Figure 12: CFM image of MDA-MB-231 BrCa stained with Cy5.5-18-4 TMIM………...42

x
List of Schemes
Scheme 1: Solid Phase Peptide Synthesis of a Tripeptide………………………………….7
Scheme 2: Mechanism of Fmoc deprotection ……………………………………………15
Scheme 3: Mechanism of amino acid coupling with HATU……………………………..15
Scheme 4: Cleavage of peptide from the Sieber (Xanthenyl) Resin with 1 or 2 %
trifluoroacetic acid (TFA) yields a C-terminal amide……………………………………16
Scheme 5: Synthesis of Lysine Puzzle Piece with sulfonated Cy5.5……………………..22
Scheme 6: Synthesis of Lysine Puzzle Piece with non-sulfonated Cy5.5………………...23
Scheme 7: Solid Phase Synthesis of Tripeptide with imaging agents: Cy5.5…………….26
Scheme 8: Synthesis by Prof. Dean Sherry’s group (world expert in chelated metals)…..27
Scheme 9: Synthesis using Di-t-butyl protected DOTA on SPPS by Yoo and Pagel…….28
Scheme 10: Synthesis of Lysine Puzzle Piece with Gd-DOTA…………………………..29
Scheme 11: Synthesis of Tripeptide with imaging agents for MRI: Gd-DOTA………….30
Scheme 12: Synthesis of Met-enkephalin………………………………………………...32
Scheme 13: Synthesis of Fmoc-dLys(Cy5.5)-Met-enkephalin…………………………...33
Scheme 14: Synthesis of Fmoc-dLys(Gd-DOTA)-Met-enkephalin……………………...34
List of Tables
Table 1: Calculation of Equivalents………………………………………………………18
Table 2: Summary of stability test of dyes………………………………………………..24
Table 3: Molecular Weight of Peptides…………………………………………………..38
Table 4: Molecular Weight of Peptides…………………………………………………..39
Table 5: Molecular Weight of Peptides…………………………………………………..41
Table 6: Molecular Weight of Peptides (Bold - Targeting peptides)……………………..82

1
Chapter 1. Background Information
1.a. Cancer and Early Detection
Cancer is a group of diseases involving abnormal cell growth with the potential to
invade or spread to other parts of the body.1, 2 Our lab is focused on discovering new ways
to image cancer, specifically prostate cancer (PCa) and breast cancer (BrCa). Cancer starts
when cells in the these or other organs begin to grow out of control. These cells usually
form a mass, or tumor that can often be seen with various imaging modalities such as X-
ray in a mammogram, or they can be felt as a lump upon examination.
There were approximately 18.1 million new cases and 9.6 million deaths in 2018.
One in 5 men and one in 6 women worldwide develop cancer during their lifetime, and one
in 8 men and one in 11 women will die from cancer.3
One of the main goals of this research project was to develop a method for the
synthesis of targeted molecular imaging agents (TMIAs) for breast cancer. For females,
breast cancer is the second main cause of death, just after lung cancer.4 In 2017, 252,710
new diagnoses of breast cancer occurred in females, and 40,610 females died from these
diseases.5 Since breast cancer is associated with many factors, such as age, genetics, a
family history of breast cancer or breast lumps, alcohol consumption, radiation exposure,
hormone treatment and dense breast tissue, it is important to be aware of the symptoms and
how to recognize them, and it is important to undergo regular screening (i.e.
mammograms).5 The best hope is to detect the cancer early, in order to improve the
outcome and to reduce the risk of death.
Molecular imaging is a multidisciplinary science that is developed rapidly recently
which involves in chemistry, biology and medicine.6 As a result of advances in molecular

2
imaging, more and more researches has focused on the need for a variety of safe and
effective targeting molecular imaging agents (TMIAs). The key purpose is to visualize
disease in real time and noninvasively assess physiological or pathological processes in the
living organisms. Molecular imaging is a powerful tool that can detect the disease in the
early onset which could save more lives. But since it is looking for small changes, it
requires highly sensitive instruments and techniques to detect the specific molecular
processes in diseased cells and tissues.
Confocal fluorescence microscopy (CFM) is a microscopy technique that provides
three-dimensional optical resolution, which is coupled with a laser light source, diffraction-
limited optics and a high-efficiency detection system has been used to study the diffusive
movement and emission process of individual fluorescent molecules in the liquid phase at
room temperature.7 Because we have a relatively newly acquired CFM instrument in the
College of Science, and have set up a collaboration with Dr. Evans, our primary focus in
imaging has been to synthesize TMIAs which make use of a fluorescent dye. The dye we
chose is Cy5.5 is chosen because it falls perfectly in the range of the CFM instrument with
excitation at 633 nm, which is the wavelength of the excitation laser, and the range of
emission that is entirely captured between 650 nm and 750 nm. In our approaches Cy 5.5
is conjugated to targeting systems for prostate and breasts cancer followed by evaluation
by CFM.
In addition to CFM the other two modalities of interest in our lab are magnetic
resonance imaging (MRI) and to synthesizing proto-types for positron emission
tomography (PET). Targeted contrast agents (TCAs) for NMR make use of chelated
gadolinium metal and TMIAs for PET make use of radioactive metals including gallium

3
(Gd) , indium (In), yttrium (Y) and copper (Cu). In our facilities radioactive agents are not
allowed so this will not be a focus of my research. However, the results we obtain for Gd
for MRI could be applied to the synthesis of PET agents containing other chelated metals
that will be useful to others in related future research.
1.b. Modular “Puzzle Piece Approach” (peptides)
Targeted molecular imaging is emerging as a useful method for early diagnosis of
cancer and other diseases.8 These agents couple various imaging agents such as near
infrared fluorescence (NIRF) dyes or metallic contrast agents used in magnetic resonance
imaging (MRI) with targeting agents. The targeting agents are designed to bind to unique
biomarker receptors in cancer cells, and therefore highly selective at “lighting up” both
cancer cells.
Our group has developed a modular synthesis of peptide-based TMIAs starting
from “puzzle pieces”.9,10 Puzzle pieces are amino acids with imaging groups bonded to
their side chains. These are assembled together to form imaging peptides which are then
conjugated to targeting groups to prepare TMIAs as shown in Figure 1 on the left side. So
far these have been synthesized by solution phase peptide synthesis. In this method the
yields are low, and synthesis requires many steps including purification of each
intermediate.
The goal of my research is to synthesize targeting peptides by a technique that is
new to our group at RIT which is solid phase peptide synthesis (SPPS), and to incorporate
the imaging modules or “puzzle pieces” as part of the synthesis to assemble TMIAs. SPPS
is widely used and has many advantages as outlined below. The difference in producing
TMIAs from a SPPS versus our group’s method is that in the SPPS method, the targeting

4
peptide is prepared first, followed by incorporation of the imaging modules as shown on
the right side of Figure 1. In the established group method, the imaging modules are
prepared first, followed by conjugating the targeting group on last.
Figure 1: Synthesis of TMIAs using solution phase synthesis (left) and SPPS (right)
There are distinct benefits from using low-molecular weight (<3,000) peptides for
both targeting and imaging agents. Small peptides have well-known bioavailability, with
known advantages in pharmacokinetics, tissue penetration, metabolism and clearance that
provide beneficial aspects in efficacy and safety.11 A disadvantage is that peptides can be
cleaved by proteases not only in the digestive tract, but also by proteases in the blood in
the case of injectable TMIAs such as those in this project. However, the proteolytic
stability can be increased by incorporation of D amino acids at critical centers to optimize
circulation time and clearance. Rapid metabolism and clearance is a desirable factor when
using injectable imaging agents, so D amino acids can further be used to fine-tune the
stability in blood to last a required amount of time to match the imaging method. For
example an MRI study might take about 30 minutes.
The goal of producing TMIAs with SPPS was pursued by a plan that included
synthesizing small (mono- to tri-peptides), then medium peptides (such as penta-peptides)

5
that would emulate targeting peptides, then to couple each of these to the dye and metal
imaging modules in the last step. The stretch goal was to synthesize an actual targeting
deca-peptide for breast cancer and likewise couple these to the dye and metal modules
containing Cy5.5 and Gd(III).
Carrying out this plan, the first goal was to learn how to synthesize simple mono-,
di- and tripeptides from common amino acids. The majority of synthesis time in this project
was devoted this goal. It involved troubleshooting, optimizing and essentially teaching
ourselves how to synthesis peptides utilizing SPPS, then bonding the imaging modules or
puzzle pieces to the peptides while still on the SPPS resin or after cleavage from the resin.
The second goal was to apply this optimized method to the synthesis of a small,
bio-active peptide. We chose Met-enkephalin, a natural opiate receptor targeting peptide,
and likewise assembled these with the Cy5.5 and Gd-DOTA imaging modules.
The third goal (a stretch goal) was to synthesize breast cancer targeting peptides of
the type discovered by Dr. Kaur at Chapman University12–14 and attach the same imaging
modules (“puzzle pieces”) in the last step. All of the steps including the imaging module
couple would be accomplished by SPPS. Progress toward these goals will be described in
the next section.
1.c. Solid Phase Peptide Synthesis
Solid phase peptide synthesis (SPPS) is a method in which molecules are bound to
a bead and synthesized step-by-step using solutions of reagents that act on these bound
peptides.15 Compared with synthesis in a liquid state, also called solution phase peptide
synthesis, it is easy to remove excess reactant or byproduct by simply washing the beads.

6
The advantage of solid phase peptide synthesis is that the products can be isolated easily
since all the intermediate peptides are immobilized on a polymer such as polystyrene. Thus,
the products can be purified by filtration and washing. Repetition of the deprotection-
coupling process will lead to larger peptides.16 In general, SPPS should give good yield
and high purity. It is a great way to synthesize long peptide chains.
A typical synthesis using SPPS is shown in Scheme 1 (below). In SPPS, the first
step is to bind the first amino acid (synthesizing from right to left) to the polymeric resin
by a coupling reaction of the free acid on the amino acid and the amine on the polymeric
resin. This is followed by deprotection of an Fmoc group (shown later). Fmoc is used
routinely in SPPS as a primary protecting group for the backbone amine. The second step
after coupling each amino acid to the resin is to remove the Fmoc group by the use of a
secondary amine, typically piperdine to yield the free N-terminus amine which is then
ready to couple to the next amino acid.
By repeating the process of bringing in an Fmoc protected amino acid, coupling it
to the prior deprotected amine bound to the resin, and deprotecting the Fmoc again, a longer
peptide chain can be synthesized as shown in Scheme 1. As described in the results section,
tripeptide Fmoc-Phe-Ile-Phe-NH2 was prepared as part of the SPPS learning and
development phase of the project.

7
Scheme 1: Solid Phase Peptide Synthesis of a Tripeptide
For following the progress of reactions, the classic Kaiser test is a qualitative
method that simply shows if the coupling reaction is completed by detecting unreacted
amines after micro-cleavage of a small portion of the beads. However, because we had
access to liquid chromatography-mass spectroscopy (LC-MS) right in the lab, we found it
most effective to conduct a micro-cleavage reaction (described later) and directly assay
each product. This, and other details of the SPPS methods that we developed are described
in detail in the following section.
1
2
3
1R
2R
3R

8
Chapter 2. Solid Phase Peptide Synthesis (SPPS) Methods
2.a. Choice of SPPS resin
The first step to build up a peptide chain is to find the best linker resin. Historically
the Merrifield resin was invented as the first resin. Using this resin, the final cleavage
produces the C-terminal acid of the peptide. The resin most currently used is a modification
of this resin called the Wang resin. If a C-terminal amide is required, the resin most
commonly used is currently the Rink-amide resin.
All of these resins require pure TFA to cleave the peptide product. But because our
near infrared dyes (NIR dyes) used in medical imaging are decomposed by strong acid,
which means it needs to find milder conditions. Sieber resin, also known as xanthenyl
linker resin, is the only resin commercially available at an affordable price that permits
dilute acid (1-2 % TFA) for cleavage. The structure of the Xanthenyl containing the linker
moiety, where the amine is protected by an Fmoc group, is shown in Figure 2.
Figure 2: The structure of Sieber resin (Xanthenyl linker resin)
2.b. Calculation of micro-equivalents of amine on resin
In order to use the correct stoichiometry for each reaction on a SPPS resin, it is
important to determine the micro-equivalents of reactive amine on the resin, upon which

9
the peptide is built. This is accomplished by deprotecting the Fmoc group from the entire
batch of resin to be coupled, which in our case is generally 100 mg per synthesis, followed
by measuring the absorbance of the resultant Fmoc byproduct, which as a known extinction
coefficient (M-1cm-1) at a key absorption band of 300 nm.
After an extensive series of trials in which many conditions were explored, the
following set of conditions was found to provide the best results.
First, the xanthenyl resin, which was chosen as the most appropriate resin which
would be compatible with the acid-sensitive dyes we ultimately used, was pre-swelled for
about twenty minutes before the experiment starts. Pre-swelling can help resin improve
accessibility within their macroporous structure. DMF is used as the organic solvent to pre-
swell it.
Conditions for removal of the FMOC (Fluorenylmethoxycarbonyl) group from the
resin were optimized by a reported method which used 2% DBU, 5% saturated piperazine,
and 93% DMF in order to completely deprotect it from the resin.17 To ensure the FMOC
has been removed completely, about 3mL of deprotection solution was added to the resin
and stirred for 5 minutes, then repeated twice. All deprotection solutions were drained,
combined and diluted as described below to test the concentration of the resin. This
optimized Fmoc deprotection process was tested by the UV absorption method several
times and was found to be the most efficient way to remove all Fmoc groups.
The combined deprotection solutions should be diluted in ethanol, or the
absorbance will be too high to measure. 30uL of deprotection solution was diluted in
2.97mL of ethanol, mixed well and assayed by UV spectroscopy to measure the absorbance
at 300nm and calculate the equivalents of the solution. The concentration equals

10
absorbance divided the extinction coefficient and the light path length as calculated by the
equation below (Beer’s Law).
𝐴𝑏𝑠 = 𝜀𝑙𝑐 → 𝑐 =𝐴𝑏𝑠
𝜀𝑙
2.c. Preparation of deprotected resin for synthesis
After determination of the micro equivalents per 100 mg, which is our initial
“reaction scale”, the SPPS resin needs to be further prepared in order to be utilized in the
next reactions. So, the beads are next washed with DMF to remove all the deprotection
solution by applying 2mL DMF and stirring for 30 seconds, apply air pressure to remove
the eluent through the frit in the SPPS vessel, then repeating three times. Next, using the
equivalents number to calculate the mass of all the compounds that are needed, the amino
acid is first activated, then the solution transferred to be the beads and stirred for at least
45 minutes to make sure the coupling is complete.
The optimized stoichiometry of the coupling reaction was found to be 1.9
equivalents of coupling reagent (HATU), 2.0 equivalents of amino acid and 10 equivalents
of base (DIEA). The specific order of addition is to dissolve the amino acid in DMF first,
followed by DIEA, followed by adding HATU which was separately dissolve in DMF first.
The mixture is transferred to the reaction vial and let it couple for 45 minutes.
After the coupling reaction, the beads were washed with 2mL of DMF, air pressure
was applied to remove the eluent through the frit in the SPPS vessel, and this procedure
was repeated twice to remove all the unreacted compounds, base and starting materials.
This is the clear advantage of SPPS in which the growing peptide chain stays on the beads
and all starting materials and impurities are easily washed off.

11
We developed two different procedures to cleave the final peptides. The first
procedure is more applicable to simply determine if we have synthesized the correct
intermediate or to learn if the targeting peptide has been made. In this procedure a small
portion of the resin was removed in order to assay the product at that step. In this case we
are not concerned about the yield, but to identify and assess the purity of the intermediate
peptide or product.
For the cleavage process, the beads should be washed with DCM three times
beforehand to remove all the DMF in the resin. By the first method, a small portion (ca. 1-
2 mg) of beads are removed and stirred with 1 mL of 1% TFA in DCM for 45 minutes,
then filtered and concentrated on a rotovap, then dissolved in methanol for analysis by LC-
MS.
The second method is better in the case where yields needs to be determined and is
generally on a larger portion of the beads or the entire amount. In this procedure, 1mL of
1% TFA in DCM is added to the resin, stirred for 45 seconds or 1 minute, then this process
is repeated twenty times to make sure all the product has been cleaved. The solution was
drained and concentrated on a rotovap in a pre-weighed flask for yield determination. An
aliquot of this may be removed for LC-MS analysis.
It is important to note that yields are subject to considerable loss due to the micro-
cleavage and LC-MS analysis at each step as in the first procedure, as well as removal of
aliquots for various analyses in the final step. This is also noted below in the philosophy of
yields section. In general, the focus of this research was to develop synthetic routes to
peptides and TMIAs and not to focus on yields. In order to accomplish this purity needs to
be examined at each step. Once a procedure has been established, it is more common to

12
run through the entire SPPS on a larger scale and measure the yields and purities of peptides
using the optimized procedure. This will be continued by future students.
2.d. General procedure for the optimization of peptides
At the beginning of learning SPPS, we tried to synthesis a tripeptide Fmoc-Phe-Ile-
Phe-NH2 as the first goal. To deprotect the Fmoc group, the most common reagent, 20%
piperidine and 80% NMP was used. After several attempts, there were always many
impurities in the product, such as Fmoc-Phe-Phe-NH2, Fmoc-Ile-Phe-NH2.
It is important to note that these can be caused by two incomplete processes: by
either incomplete Fmoc deprotection or incomplete coupling, or both. These can lead to
the impurities as described in Figure 3.
Figure 3: The origin of impurities (Pol=polymer resin), red is desired product.

13
The first guess at the flaw in synthesis leading to the impurities was incomplete
coupling of the first amino acid to the resin. This was deduced because the second coupling
amino acid was found as its terminal amide form after coupling process. This indicates
there was free amine on the resin even after the first coupling which would give rise to the
second amino acid (monopeptide) in its amide form. In order to solve this problem, the
equivalents of each reagent were changed several times.
With the help of Dr. Justin Miller from Hobart College, the number of equivalents
of the coupling reagent was advised to be a little bit less than the amino acid, so this was
adjusted to 2 equivalents of amino acid and 1.9 equivalents of coupling reagent (HATU,
described later).
In addition to the change in equivalents of coupling agent, after several more
experiments, it was determined that the use of 10 equivalents of diethylpropylamine was
more favorable than 20. Although these combined changes gave better result than before,
there were still impurities contained in the product.
Due to the above results, the second consideration was the incomplete Fmoc
deprotection both in the initial deprotection of the resin, and the deprotection of each amino
acid in the SPPS. The mechanism of this deprotection is shown in Scheme 2 (below).
Because the Fmoc deprotection time was ten minutes initially, in order to make sure the
process was finished completely, the deprotection time was extended to twenty minutes.
Unfortunately, the result was not changed.
By searching the literature, an alternative protocol for the standard deprotection by
piperidine or diethylamine was found and tried. The new conditions, 2% DBU, 5%
Piperazine and 93% DMF mixture solution,17 gave remarkable results and were deemed as

14
giving the best procedure to remove the Fmoc group. It reacted very rapidly. Two minutes
were enough to remove all the Fmoc groups. But just to make sure no more Fmoc group
has still linked to the previous peptide, five minutes of deprotection time was repeated
twice.
After changing all of these methods, there were almost no impurities in the product
anymore. The conclusion of this optimization campaign was that the incomplete Fmoc
deprotection had been the main problem that caused impurities formed. With the new
combination of optimized coupling and optimized deprotection of Fmoc, almost all of the
subsequent peptide syntheses were successful yielding pure di-peptides, tri-peptides and
later longer peptides all the way up to deca-peptides.
2.e. Mechanism of the deprotection of Fmoc
At every step in SPPS, it is most common to use the fluorenylmethyloxy carbonyl
(Fmoc) group to protect the backbone N-terminal nitrogen of each in-coming amino acid.
This may be effectively removed by bases such as piperidine, diethyl amine or a recipe we
discovered in the literature using piperazine and DBU. The advantage is that acid sensitive
groups may be used on the side chains of amino acids to be able to differentiate those
groups. This is called “differential or orthogonal protection” strategy in SPPS. The
mechanism of removal of the Fmoc group by the base is shown below.

15
Scheme 2: Mechanism of Fmoc deprotection
2.f. Mechanism of coupling of amino acids by HATU
The mechanism of coupling by HATU is shown in Scheme 3. In this reaction the
intermediate is an “activated ester” based on a pyridyl triazole, also known as oxy
pyridyltriazole (OPT) ester.
Scheme 3: Mechanism of amino acid coupling with HATU

16
2.g. Mechanism of cleavage of peptide from the Xanthenyl
To remove the final peptide from the resin a cleavage process using dilute
trifluoroacetic acid (TFA) was optimized. Due to the sensitivity of dyes and metal chelates
in our imaging agents, it was important to use very mild acid, such as 1-2 % TFA in DCM,
and this is why the Sieber resin was chosen as described earlier. The mechanism of
cleavage from the xanthenyl linker in the Sieber resin is shown in Scheme 4. In this reaction
the xanthenyl heterocycle is prone to decomposition followed by cleavage by the
mechanism shown.
Scheme 4: Cleavage of peptide from the Sieber (Xanthenyl) Resin with 1 or 2 %
trifluoroacetic acid (TFA) yields a C-terminal amide

17
Chapter 3. Optimized Step-by-step recipe for the SPPS of peptide
In lieu of a detailed experimental section for the generic synthesis of peptides, it
was decided that a recipe, or set of directions, for the synthesis by SPPS, would be more
useful for future students in the molecular imaging lab (MIL). The recipe was therefore
formulated as described below. Reagent acronyms have also been defined in the
abbreviations section.
3.a. Pre-Swelling
Weigh out 100 mg of Xanthenyl linker resin, transfer it to the SPPS reaction vessel.
Then, add a stir bar into the vessel. Use a syringe to add 1~2mL of N,N-
Dimethylformamide (DMF) into the vessel. Turn on the stir plate and let it stir for about
20 minutes. Drain the vessel by applying some air pressure to help.
3.b. Fmoc Deprotection
Mix 2% 1,8-Diazabicyclo[5.4.0]undec-7-ene (DBU), 5% piperazine and 93% DMF
together to make the deprotection solution, shake it well. Use a glass pipette to add 1mL
of the deprotection solution into the SPPS vessel, let it stir for 5 minutes. Then use a 20mL
scintillation vial to collect the deprotection solution by draining the vessel into a vial.
Repeat it two more times. Save the collected deprotection solution.
3.c. Washing after Deprotection
Add about 2mL of DMF to the vessel, stir for 30 seconds and drain it. Repeat these
3 times to make sure all the deprotection solution has been removed.
3.d. Calculation of Equivalents
Prepare three 3mL quartz cuvette, place 3mL 200 proof ethanol in each cuvette.
Two of them as blank. Using a syringe to remove 10L of ethanol from the third cuvette

18
and place 10L of eluate from the scintillation vial into the cuvette. Mix it well. Use the
cuvette which only contains ethanol to blank the instrument. Then place the cuvette in UV
spectrophotometer. Set the wavelength range from 200nm to 500nm. Record the
absorbance at 300nm. Use the formula 𝐴𝑏𝑠 = 𝜀𝑙𝑐 and the Excel sheet to calculate the
concentration of the deprotection solution. Record the result.
Example:
𝐴𝑏𝑠 = 𝜀𝑙𝑐 → 𝑐 =𝐴𝑏𝑠
𝜀𝑙=
0.633
7800 𝑀−1𝑐𝑚−1×1 𝑐𝑚= 0.0000811 𝑀
300𝑋 = 300 × 0.0000811 𝑀 = 24.3 𝑚𝑀
24.3 𝑚𝑀 = 24.3 𝜇𝑚𝑜𝑙/𝑚𝐿 = 73.0 𝜇𝑚𝑜𝑙/3𝑚𝐿 = 73.0 𝜇𝑚𝑜𝑙/100𝑚𝑔 𝑜𝑓 𝑟𝑒𝑠𝑖𝑛 =
73.0 𝜇𝑚𝑜𝑙/0.1𝑔 = 0.730 𝑚𝑚𝑜𝑙/𝑔
Table 1: Calculation of Equivalents
Xanthenyl
l (M-1) Absorbance Concentration
(M)
Concentration
(mM)
Equivalents
(mmol/g)
7800 0.633 8.1210-5 24.3 0.730
3.e. Coupling Amino Acids
Weigh out 2.0 equivalents of the amino acid, 1.9 equivalents of the coupling reagent
1-[Bis(dimethylamino)methylene]-1H-1,2,3-triazolo[4,5-b]pyridinium 3-oxid
hexafluorophosphate (HATU) in separate scintillation vials. Add DMF to the two vials to
dissolve the amino acid and coupling reagent. Use a glass pipette to add 10 equivalents of
N, N-Diisopropylethylamine (DIEA) to the vessel which contains amino acids. Then use
another glass pipette to transfer all the coupling reagent solution to the vial containing

19
amino acid and DIPEA Shake it or stir it for one minute and transfer the mixture solution
to the reaction vial. Stir for 45 minutes.
3.f. Washing after Coupling
Apply air pressure to drain the vial. Add about 2mL of DMF into the vial, stir for
30 seconds and drain it. Repeat three times.
3.g. Synthesizing Longer Peptide Chains
Repeat the process from Fmoc deprotection to washing after coupling until the
targeting peptide has been made. If it is not possible to finish making the targeting peptide
in one day, after the coupling washing step, add 1mL of dichloromethane (DCM) to wash
the beads and drain it. Label and store it properly in the fridge for next-day use. On the
next day, let the peptide warm up in room temperature, add some DMF to wash it before
starting deprotecting Fmoc group.
3.h. Final Wash
Add about 2mL of DCM into the vial, stir for 30 seconds and drain it. Repeat three
times. Label and store it in a vial properly.
3.i. Cleavage
Mix TFA and DCM together to make 1% Trifluoracetic Acid (TFA) cleavage
solution. Weight out certain amount of peptide and transfer it to the reaction vial. Add a
stir bar into the vial. Then, add about 1mL of 1% TFA solution to the reaction vial, stir for
1~2 minutes, drain it and use a small flask to collect the solution. Repeat for at least five
times. Rotavap the collected solution and test it in LCMS. Analyze the data.

20
3.j. Method development versus yield determination
In this project, the goal was primarily to devise a route to peptides that a student in
our lab could utilize to effectively synthesize TMIAs. The specific stretch goal was to
develop a method to produce product. It is important to recognize that there are two factors
which makes yield determination difficult: a) at each step about 3-5 mg of resin was
removed in order to verify each intermediate in the entire synthesis. The purity of this
intermediate was verified by an extracted wavelength chromatogram at 265nm, which is
the lambda max of the Fmoc group. In each case it was verified by total ion current in LC-
MS that there were minimal, or no impurities related to any peptides, protected or
deprotected amino acids or peptide combinations of those. b) at various points in the
synthesis the remaining resin was divided into smaller portions in order to test out new
procedures. As each portion becomes smaller, aliquots removed for analysis become more
of a factor. For this reason, yield determination was not a priority in this research. Rather,
relative purity of products after cleavage in each step and the final products were important.
As described, yields can be determined by future students after SPPS methods are scaled
up, in which case removal of micro-samples for assay by LC-MS is not a large factor.

21
Chapter 4. Puzzle pieces
4.a. Puzzle piece methodology
In order to create targeted molecular imaging agents (TMIAs) from the peptide
targeting groups that are synthesizing, we will use makes use of the puzzle piece approach
developed in our group. Puzzle pieces (also known as imaging modules) are synthesized
by bonding imaging groups, such as near infrared (NIR) dyes to amino acids such as lysine,
which have a reactive amine on the side chain. NIR dyes are useful in optical molecular
imaging (OMI) methods including confocal fluorescence microscopy (CFM) and a variety
of other in-vitro and in-vivo fluorescent imaging methods. 18
In addition to the use of NIR dyes, we could use metal – chelate complexes such as
gadolinium DOTA (Gadolinium (III) 1,4,7,10-Tetraazacyclododecane-1,4,7,10-
tetraacetate) that is used as a contrast agent in MRI. There are many MRI contrast agents
based on Gd, 19 and examples of targeted Gd-based molecular imaging agents.20 There are
instances where chelated metals such as Gd-DOTA and radioactive metals such as Ga-
DOTA have been put on peptides, but they are always put in after the peptide has been
cleaved from the resin and most of the time the DOTA is protected during the synthesis
with t-butyl groups which requires removal by harsh TFA.
To our knowledge the use of puzzle pieces to directly incorporate a NIR dye or a
metal in SPPS has never been reported.

22
4.b. Cy5.5 (imaging module) puzzle piece
In our first attempt the imaging module (see Scheme 5) was synthesized utilizing a
form of Cy5.5 that contained three sulfonates. The synthesis of this puzzle piece is shown
in Scheme 5, where the dye is in blue and the Fmoc protected lysine amino acid in in black.
Scheme 5: Synthesis of Lysine Puzzle Piece with sulfonated Cy5.5
Unfortunately, in our test reactions with the tri-peptide model system shown above
(Fmoc-Met-Ile-Phe-NH2), the dye, was not able to be cleaved from the resin as indicated
by the color. A number of different experiments involving stronger acid, base, different
solvents and increased time were not effective. It was suspected that the sulfonic acid
(sulfonate) groups on the dye irreversibly stuck to the resin. This was verified by an
experiment in which the dye alone was mixed with the resin in various solvents, followed
by an attempt to separate the dye by filtration. Regardless of conditions tried, the dye
indeed stuck to the resin and could not be freed.
23
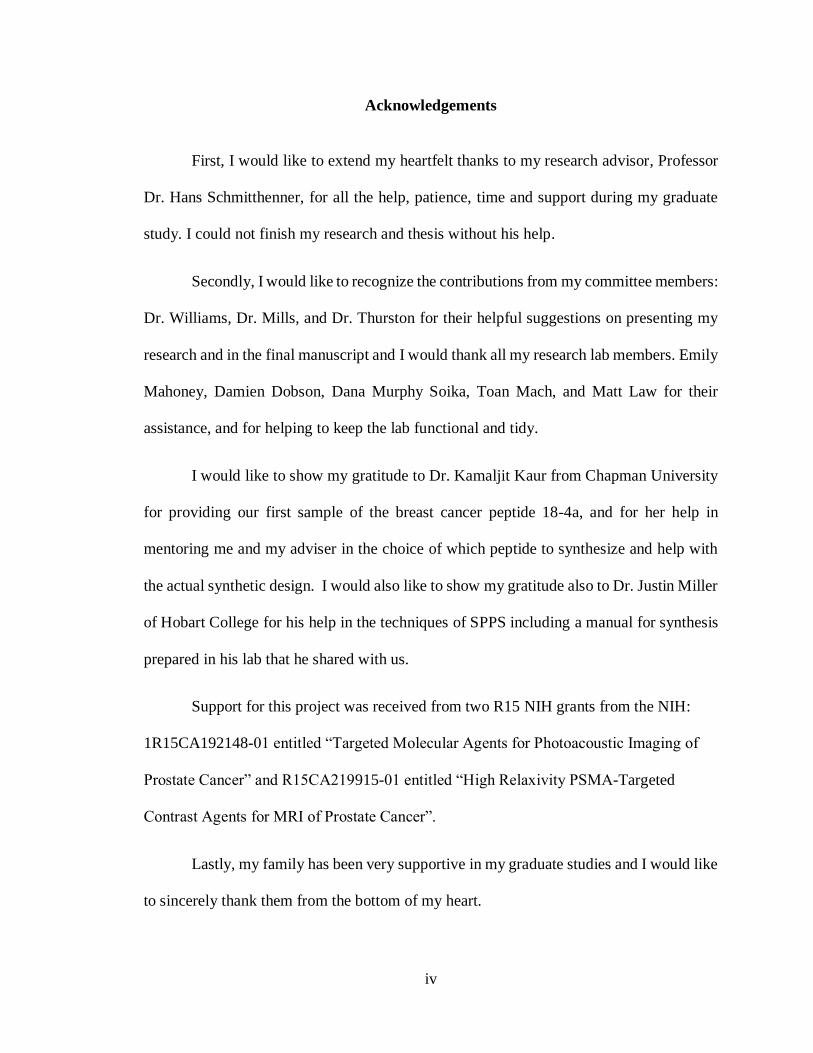
Based on this hypothesis, a lipophilic version of Cy5.5, containing no sulfonates,
was purchased from Lumiprobe. The analogous puzzle piece was synthesized as shown in
Scheme 6 and we were ultimately pleased to find that using the lipophilic version that the
labelled peptide could be removed from the resin as shown in the next section.
Scheme 6: Synthesis of Lysine Puzzle Piece with non-sulfonated Cy5.5
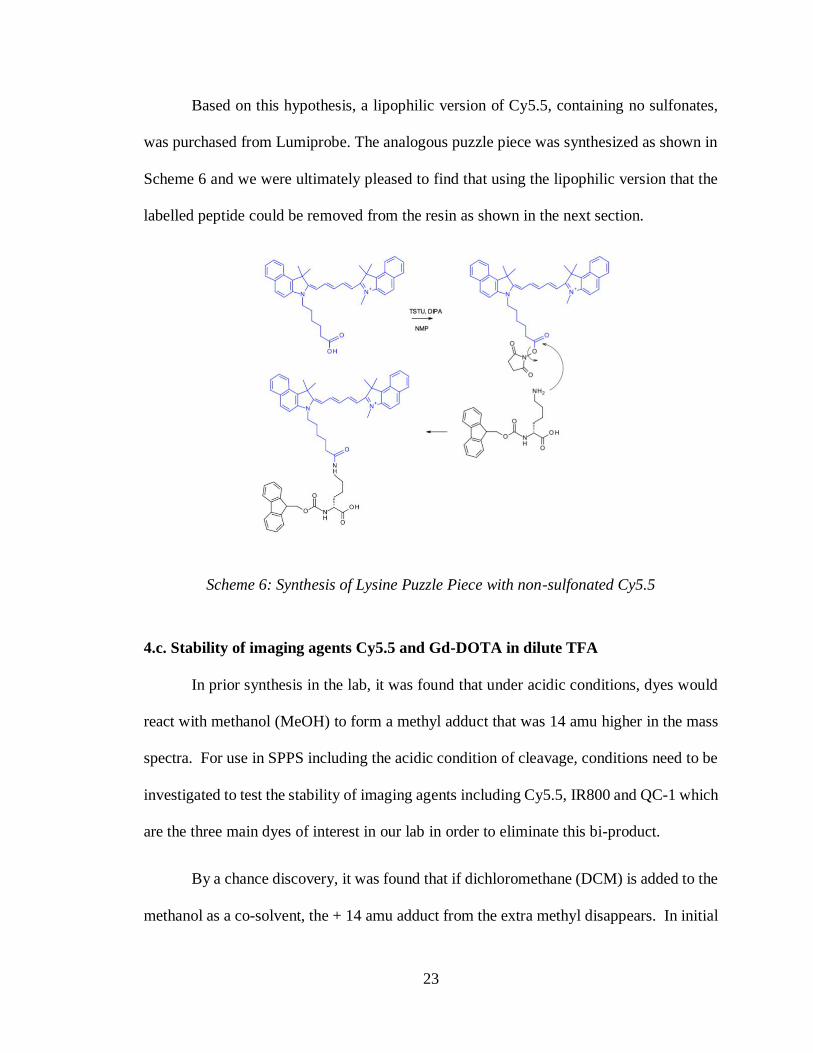
4.c. Stability of imaging agents Cy5.5 and Gd-DOTA in dilute TFA
In prior synthesis in the lab, it was found that under acidic conditions, dyes would
react with methanol (MeOH) to form a methyl adduct that was 14 amu higher in the mass
spectra. For use in SPPS including the acidic condition of cleavage, conditions need to be
investigated to test the stability of imaging agents including Cy5.5, IR800 and QC-1 which
are the three main dyes of interest in our lab in order to eliminate this bi-product.
By a chance discovery, it was found that if dichloromethane (DCM) is added to the
methanol as a co-solvent, the + 14 amu adduct from the extra methyl disappears. In initial

24
experiments, 50 % MeOH-DCM was found to protect the dye in acid, and in subsequent
experiments even 20 % MeOH could also be used. After several experiments, Cy5.5 was
stable in 1 % and 2 % TFA for at least three hours, and it even survived in 5% TFA for one
hour. The table below summarizes the experiments used with the dyes in various solvents
and conditions, monitoring the products by LC-MS.
Table 2: Summary of stability test of dyes (see Appendix I compounds 1-3 showing mass
spectra and the observed color. Stable conditions are highlighted)
In previous research in the lab (unpublished results, Jessica Perez, project M.S.,
2016), kinetic studies were performed of the chelated metal, Gd-DOTA, measured on the
puzzle piece shown in Scheme 10. As shown in Figure 4, it was found that this chelate
complex was stable in 0.1 M TFA in water for times up to one week. Based on these results,
we may safely predict that the Gd-DOTA would be stable to the conditions of cleavage
necessary for the Sieber resin, which we have determined is 1.0 % (0.088 M) or 2.0 %
(0.175 M) TFA in dichloromethane. In addition, the cleavage time is 30 minutes which a
small fraction of the week-long measurements in the previous study. However, this still
more favorable than using pure TFA which is required in other SPPS resins such as Wang
and Rink resins.

25
Figure 4: Graph showing the high stability of Gd-DOTA using the module Fmoc-Lys(Gd-
DOTA)-NH2. The displacement of Gd in 0.1M TFA was measured over several days, as
well as the formation of Cu-DOTA in an excess of Cu+2 solution in the same solution.
(Data from Jessica Perez, MS student, 2016.)
4.d. Synthesis tripeptides plus imaging modules Cy5.5
By using the optimized method for SPPS in Chapter 3, the puzzle piece was
successfully coupled first to the mono-peptide shown in Scheme 7, followed by coupling
this same imaging module to the tri-peptide. The products were verified by LC-MS which
showed not only the correct mass of the product, but the expected absorption in the NIR
region of the spectra at 684 nm of the same product.
While fluorescent dyes have been conjugated to peptides by solution methods, to
our knowledge, after searching the literature, NIR dyes have never been incorporated as
part of an SPPS followed by cleavage from the resin. Our puzzle piece method has enabled
this goal and this success paved the way for future syntheses involving larger peptides.
0
1000
2000
3000
4000
5000
6000
7000
8000
0 1 2 3 4 5
Inte
nsi
ty (
AU
)
Time (Days)
Gd - Cu
Gd

26
Scheme 7: Solid Phase Synthesis of Tripeptide with imaging agents: Cy5.5
4.e. Gd-DOTA puzzle pieces
The next goal was to apply the puzzle piece method to the SPPS of a tri-peptide
containing the metal Gd as its DOTA chelated complex.
Peptides containing Gd-DOTA on a lysine have been assembled in the past. In a
pioneering study, Sherry and co-workers have brought in a lysine or a phenylalanine
containing a protected DOTA group as its tri-t-butyl ester as shown in Scheme 8.21 In that
case, the tri-t-butyl group was removed as part of the acid catalyzed cleavage process, and
the final DOTA containing peptide was metalized in the last step.
4 1R

27
Scheme 8: Synthesis by Prof. Dean Sherry’s group (world expert in chelated metals)21
In a second related article, a similar approach was reported by Yoo and Pagel, a di-
t-butyl protected DOTA was fastened directly to the SPPS resin via a linker and the peptide
was built onto that.22 This approach was clearly different from the approach by Sherry who
incorporated the DOTA mid-way through the synthesis. In either approach, strong 100 %
TFA must be utilized to protect t-butyl groups from DOTA. In our group it was previously
determined that lower concentrations of TFA are not effective because when t-butyl groups
are on DOTA, they are more stable than normal t-butyl esters. This would prevent the use
of dyes in the SPPS which require the use of lower TFA concentrations as described below.

28
Scheme 9: Synthesis using Di-t-butyl protected DOTA on SPPS by Yoo and Pagel22
In contrast to the above approach, the use of puzzle pieces to directly incorporate a
metal-chelate complex such as in SPPS has never been reported to our knowledge. One
advantage of this approach is that there is no need for harsh treatment by pure TFA which
is necessary to remove the t-butyl groups from DOTA. In our approach 1% TFA is used
for a variety of reasons including the acid-sensitivity of most dyes. So, this approach in
which the metal is added early in the synthesis is unique and provides several advantages.
The synthesis of the puzzle piece containing the Gd-DOTA is shown in Scheme 10.
The procedure is a “one pot synthesis” developed in our lab which gives the module
directly and was an improvement over a three steps procedure involving a protection-
deprotection scheme (not shown).

29
Scheme 10: Synthesis of Lysine Puzzle Piece with Gd-DOTA
4.f. Synthesis of tri-peptides plus Gd-DOTA
By using the optimized method for SPPS in Chapter 3, the puzzle piece containing
the Gd-DOTA was successfully coupled first to the mono-peptide shown in Scheme 11,
followed by coupling to the tri-peptide. This success paved the way for future syntheses
involving larger peptides containing Gd-DOTA.

30
Scheme 11: Synthesis of Tripeptide with imaging agents for MRI: Gd-DOTA
5 1R

31
Chapter 5. Met-enkephalins
5.a. The choice of Met-enkephalins as a model system
Met-enkephalins are short peptides which are the active site of endorphins which
are larger proteins that contain the pentapeptide somewhere on their sequence. The
discovery of enkephalins followed research findings which linked morphine and heroin
and other opiates to a natural receptor site. This receptor site was part of a protein system
called endorphin, which is a natural protein in the body (animal or human). The binding
of natural or synthetic opiates (from poppy flowers) can also be a pain killer (and produce
a "high"). So, after the endorphins were found, researchers reduced the size of the peptide
until they found the minimal active sequence - which were two enkephalins, Met-
enkephalin and Leu-enkephalin.
Instead of using just a random peptide such as the tri-peptide utilized in our first
optimization efforts, we chose to synthesize Met-enkephalin and label it with both of our
puzzle piece imaging modules because it is a "biologically relevant" or "biologically
important" peptide. It was also anticipated that dye and Gd – based TMIAs based on
enkephalin may be novel and may be useful in imaging opioid receptors.
5.b. Synthesis of Met-enkephalin
The preparation of the pentapeptides, Met-enkephalin by the following method,
carried out on Sieber (Xanthenyl) resin, was successful. This paved the way for bringing
in the puzzle pieces containing Cy5.5 and Gd-DOTA.

32
Scheme 12: Synthesis of Met-enkephalin
5.c. Cy5.5 Met-enkephalin
The method applied to the synthesis of the Cy5.5 labelled tri-peptide as designed
in chapter 4d was utilized to synthesis Fmoc-dLys(Cy5.5)-NH2 by the method shown in
Scheme 13. In the case of enkephalin, it is necessary to bring in the tyrosine in its t-butyl
ether protected form. Our design is based on cleavage from the Sieber resin in 1% TFA
6R
7R
8R
9R
10
10R

33
and this is fortunate, as t-butyl ethers may be removed by very mild treatment, such as 1 %
TFA. In addition to this, the NIR dye Cy5.5 is stable to 1 % TFA.
Scheme 13: Synthesis of Fmoc-dLys(Cy5.5)-Met-enkephalin (11)
5.d. Gd-DOTA Met-enkephalin
The preparation of the Gd-DOTA Met-enkephalin containing the Gd-DOTA was
successful. Likewise, as expected from the earlier kinetic studies by Anne Marie Sweeney
and Jessica Perez in our group the Gd-DOTA complex is stable in the mild 1 % cleavage
solution.
Several synthesis steps
similar to Scheme 11
10R
11

34
Scheme 14: Synthesis of Fmoc-dLys(Gd-DOTA)-Met-enkephalin (12)
10R
12

35
Chapter 6. Breast cancer peptides
6.a. Breast cancer targeting peptide 18-4
The stretch goal of this research was to apply the SPPS methods we developed to
the synthesis of an actual targeted imaging agent for cancer. A beautiful example of a
targeting peptide useful for imaging breast cancer was recently reported by Dr. Kaur.12–14
In her studies, Kaur began with a previously developed breast cancer targeting
peptide p160 (12-mer) and prepared an enzymatically stable analogue 18-4 (10-mer) of this
peptide, shown in Figure 5, that showed remarkable potential for targeted breast cancer
drug delivery. The peptide was shown to target MDA-MB-231 cells in vitro by fluorescein
labelling using CFM then extended to the delivery of drugs including streptomycin in
animal studies.
Figure 5: Structure of Breast cancer peptide
Following this peptide, a cyclic peptide, “peptide 7”, was prepared by Dr. Kaur.
Animal studies using mice with orthotopic breast MDA-MB-231 tumors showed that the
cyclic peptide selectively accumulates in tumor and is rapidly cleared from all other organs
except kidneys and liver. While the cyclic peptide may be somewhat better, Dr. Kaur
advised us that the linear version would be suitable for our studies and would show the
same kind of results, and that it would be far simpler to synthesize.
22

36
In initial work by others in our group, a 20 mg sample of peptide 18-4 was sent as
a gift by Dr. Kaur to our lab for labelling purposes. A very small amount of this peptide
was labelled with Cy5.5 itself (not the puzzle piece) at the third amino acid (d-lysine, or k)
to form the TMIA we called “M1” shown in Figure 6 where the peptide is shown using
one-letter abbreviations for the amino acids, shown in red.
Figure 6: TMIA “M1”, peptide 18-4 labelled on the 3-lysine side chain with Cy5.5
Our collaborators in the School of Life Sciences, Dr. Evans and her group, were
able to grow MDA-MD-231 breast cancer cells and stain them with 0.1 M of agent “M1”
and stained with NucBlu which show the nuclei of cells only (in blue).
Figure 7: MDA-MD-231 BrCa cells stained with TMIA “M1” and NucBlu in
collaboration with Dr. Irene Evans, GSOLS, RIT.

37
After obtaining these preliminary results, which mirrored results obtained in the
Kaur group (using fluorescein as the NIR dye) we were encouraged to pursue the synthesis
of the peptide ourselves by the SPPS method described above. This was also a good time
to do this as we had run out of the gifted peptide, and we were having considerable
difficulty in reproducing the initial synthesis of M1.
6.b. SPPS of breast cancer targeting peptide 18-4
The peptide was successfully synthesized by using the methodology developed as
described in Chapter 3. Each step was carefully monitored by cleaving a tiny amount of
the resin with 1 % TFA and assaying the trace residue by LC-MS. The recipe works well
and each coupling and each deprotection step proceeded perfectly as shown by LC-MS,
described in Chapters 2c, 3e and 8 and shown in the LC-MS data in Appendix I. In most
cases the acid-sensitive protecting groups were removed but in some cases a mixture of
protected and deprotected intermediates were observed. The Mtt on d-lysine is removed
rapidly, but t-butyl on tyrosine and t-butyl on glutamic acid are partially removed. The Boc
group on tryptophan is difficult to remove and requires harsher conditions. In work carried
on in the lab, unprotected tryptophan is being used.
The synthesis is represented in the following table which shows each intermediate
in its protected and deprotected forms, along with the calculated full mass and half mass.
The results from the LC-MS are shown in Appendix I (compounds 12-23), showing that in
each case the major product was relatively pure and showed the correct mass or half mass.
In addition, a high-resolution mass spectra (HRMS) was obtained on the final peptide and
the results proved that the structure was peptide 18-4 in its protected form, Fmoc-Trp(Boc)-

38
d-Nle-Glu(OtBu)-Ala-Ala-Tyr(tBu)-Gln-d-Lys-Phe-Leu-NH2 (HRMS results: MW
1701.9296 theory vs 1701.9264 for M+H+, deviation of 1.9 ppm).
Table 3: Molecular Weight of Peptides
Compounds
Molecular
Weight
(g/mol)
Half
Mass
(g/mol)
Fmoc-Leu-NH2 352.2 177.1
Fmoc-Phe-NH2 386.2 194.1
Fmoc-Phe-Leu-NH2 499.2 250.6
Fmoc-d-Lys(Mtt)-Phe-Leu-NH2 883.5 442.8
Fmoc-d-Lys-Phe-Leu-NH2 627.3 314.7
Fmoc-Gln-d-Lys-Phe-Leu-NH2 755.4 378.7
Fmoc-Tyr(tBu)-Gln-d-Lys-Phe-Leu-NH2 974.5 488.3
Fmoc-Tyr-Gln-d-Lys-Phe-Leu-NH2 918.5 460.3
Fmoc-Ala-Tyr(tBu)-Gln-d-Lys-Phe-Leu-NH2 1045.6 523.8
Fmoc-Ala-Tyr-Gln-d-Lys-Phe-Leu-NH2 989.5 495.8
Fmoc-Ala-Ala-Tyr(tBu)-Gln-d-Lys-Phe-Leu-NH2 1116.6 559.3
Fmoc-Ala-Ala-Tyr-Gln-d-Lys-Phe-Leu-NH2 1060.5 531.3
Fmoc-Glu(OtBu)-Ala-Ala-Tyr-Gln-d-Lys-Phe-Leu-NH2 1245.6 623.8
Fmoc-Glu-Ala-Ala-Tyr(tBu)-Gln-d-Lys-Phe-Leu-NH2 1245.6 623.8
Fmoc-Glu(OtBu)-Ala-Ala-Tyr(tBu)-Gln-d-Lys-Phe-Leu-NH2 1301.7 651.9
Fmoc-Glu-Ala-Ala-Tyr-Gln-d-Lys-Phe-Leu-NH2 1189.6 595.8
Fmoc-d-Nle-Glu-Ala-Ala-Tyr-Gln-d-Lys-Phe-Leu-NH2 1302.7 652.4
Fmoc-d-Nle-Glu(OtBu)-Ala-Ala-Tyr-Gln-d-Lys-Phe-Leu-NH2 1358.7 680.4
Fmoc-d-Nle-Glu-Ala-Ala-Tyr(tBu)-Gln-d-Lys-Phe-Leu-NH2 1358.7 680.4
Fmoc-d-Nle-Glu(OtBu)-Ala-Ala-Tyr(tBu)-Gln-d-Lys-Phe-Leu-NH2 1414.8 708.4
Fmoc-Trp-d-Nle-Glu-Ala-Ala-Tyr-Gln-d-Lys-Phe-Leu-NH2 1488.7 745.4
Fmoc-Trp-d-Nle-Glu(OtBu)-Ala-Ala-Tyr-Gln-d-Lys-Phe-Leu-NH2 1544.8 773.4
Fmoc-Trp-d-Nle-Glu-Ala-Ala-Tyr(tBu)-Gln-d-Lys-Phe-Leu-NH2 1544.8 773.4
Fmoc-Trp-d-Nle-Glu(OtBu)-Ala-Ala-Tyr(tBu)-Gln-d-Lys-Phe-Leu-
NH2
1600.9 801.5
Fmoc-Trp(Boc)-d-Nle-Glu(OtBu)-Ala-Ala-Tyr(tBu)-Gln-d-Lys-Phe-
Leu-NH2
1700.9 851.5
It is important to note that all of the peptides in this sequence are very lipophilic.
This causes them to stick onto the C-18 column creating wide peaks and requiring the use
of increasing percentages of organic solvent (acetonitrile) as the chain increases. We were

39
able to chromatograph the intermediates up to the nona-peptide (gradient 80-100, but when
we added the tenth amino acid, tryptophan we could no longer use a column and switched
to “loop injections”.
6.c. Cy 5.5 labelled breast cancer Fmoc-protected targeting peptide 18-4
Utilizing the SPPS resin that contained the fully protected deca-peptide 18-4, the
non-sulfonated Cy5.5 puzzle piece described in Chapter 4b was coupled onto the resin to
yield the final product “M2” in its protected form. The entire resin was then cleaved with
1 % TFA to yield an analytical sample of the TMIA final product as partially protected
peptide Fmoc-d-Lys(Cy5.5)-Trp(Boc)-d-Nle-Glu(OtBu)-Ala-Ala-Tyr(tBu)-Gln-d-Lys-
Phe-Leu-NH2, (HRMS results: MW 1198.1691 theory vs 1198.1732 for (M+2H+)/2,
deviation of 3.42 ppm).
Figure 8: Structure of Breast cancer peptide with non-sulfonated Cy5.5
Table 4: Molecular Weight of Peptides
Fmoc-d-Lys(Cy5.5)-Trp(Boc)-d-Nle-Glu(OtBu)-Ala-Ala-
Tyr(tBu)-Gln-d-Lys-Phe-Leu-NH2
2394.3381 1198.17
Fmoc-d-Lys(Cy5.5)-Trp-d-Nle-Glu-Ala-Ala-Tyr-Gln-d-Lys-Phe-
Leu-NH2
2182.1610 1092.08
23

40
6.d. Cy 5.5 labelled breast cancer targeting peptide 18-4
Utilizing the SPPS resin that contained the fully protected deca-peptide 18-4, the
non-sulfonated Cy5.5 puzzle piece described in Chapter 4b was coupled onto the resin to
yield the final product “M2” in its protected form. Fmoc group has been taken off before
cleavage. The entire resin was then cleaved with 1 % TFA to yield an analytical sample of
the TMIA final product as partially protected peptide NH2-d-Lys(Cy5.5)-Trp-d-Nle-Glu-
Ala-Ala-Tyr-Gln-d-Lys-Phe-Leu-NH2, (HRMS results: MW 981.05194 theory vs
981.0515 for (M+2H+)/2, deviation of 0.448 ppm).
A 100 M solution of this compound was given to Dr. Evans group (GSOLS) for testing
in BrCa cells by CFM.
Figure 9: Structure of Breast cancer peptide with non-sulfonated Cy5.5 (No Fmoc
protecting group)
Figure 10: Molecular Weight of Peptides
NH2-d-Lys(Cy5.5)-Trp-d-Nle-Glu-Ala-Ala-Tyr-Gln-d-Lys-
Phe-Leu-NH2
1960.08800 981.05194
Fmoc-d-Lys(Cy5.5)-Trp(Boc)-d-Nle-Glu(OtBu)-Ala-Ala-
Tyr(tBu)-Gln-d-Lys-Phe-Leu-NH2
2182.15990 1092.08589
24
41
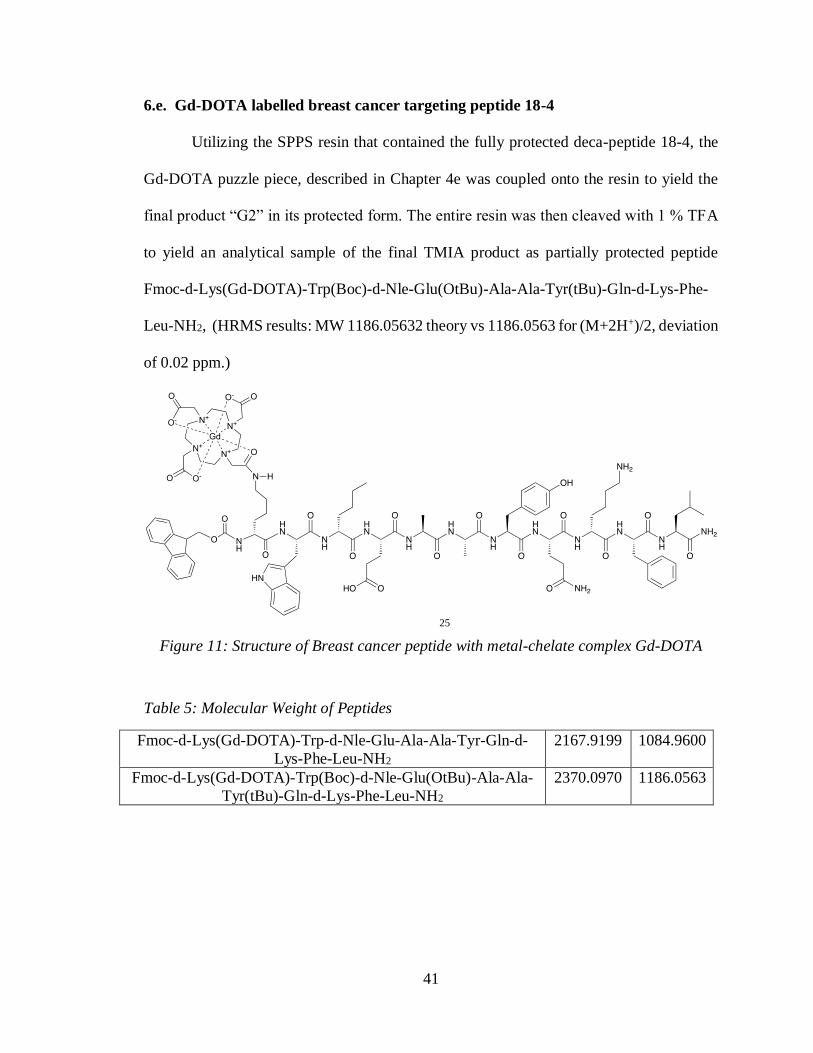
6.e. Gd-DOTA labelled breast cancer targeting peptide 18-4
Utilizing the SPPS resin that contained the fully protected deca-peptide 18-4, the
Gd-DOTA puzzle piece, described in Chapter 4e was coupled onto the resin to yield the
final product “G2” in its protected form. The entire resin was then cleaved with 1 % TFA
to yield an analytical sample of the final TMIA product as partially protected peptide
Fmoc-d-Lys(Gd-DOTA)-Trp(Boc)-d-Nle-Glu(OtBu)-Ala-Ala-Tyr(tBu)-Gln-d-Lys-Phe-
Leu-NH2, (HRMS results: MW 1186.05632 theory vs 1186.0563 for (M+2H+)/2, deviation
of 0.02 ppm.)
Figure 11: Structure of Breast cancer peptide with metal-chelate complex Gd-DOTA
Table 5: Molecular Weight of Peptides
Fmoc-d-Lys(Gd-DOTA)-Trp-d-Nle-Glu-Ala-Ala-Tyr-Gln-d-
Lys-Phe-Leu-NH2
2167.9199 1084.9600
Fmoc-d-Lys(Gd-DOTA)-Trp(Boc)-d-Nle-Glu(OtBu)-Ala-Ala-
Tyr(tBu)-Gln-d-Lys-Phe-Leu-NH2
2370.0970 1186.0563
25

42
6.f. Confocal Fluorescence Microscopy of Breast Cancer Cells Targeted with Cy5.5
labelled 18-4
In the final weeks of research Matt Law resynthesized the Cy5.5 labelled breast
cancer peptide 18-4 in the totally deprotected form using the method described here. Then
our collaborators in Biology (Dr. Irene Evans and her student Josh Evans) were successful
in culturing MDA-MB-231 breast cancer cells (triple negative type) in vitro, followed by
staining these with 10 M solutions of the Cy5.5-18-4 TMIA.
The following images were obtained using the Zeiss CFM in the School of Life
Sciences at RIT. This demonstrates that the approach of labelling 18-4 by placing the Cy5.5
lysine puzzle piece (module) on the N-terminus of the peptide was highly successful.
Figure 12: CFM image of MDA-MB-231 breast cancer cells stained with Cy5.5-18-4
TMIA, blue is the nucleus of each cell (NucBlu), red is TMIA

43
Chapter 7. Conclusion
A method has been developed for the solid phase synthesis of peptides using the
Sieber resin. This method has been tested by the synthesis of a mono-peptide (Fmoc-Phe-
NH2), di-peptide (Fmoc-Ile-Phe-NH2) and tri-peptide (Fmoc-Met-Ile-Phe-NH2) followed
by successfully coupling two types of imaging modules (puzzle pieces) separately onto the
mono-peptide (Fmoc-Phe-NH2). The imaging modules consisted of an Fmoc protected
lysine coupled to a NIR dye, Cy5.5, on the side chain nitrogen, or a Gd-DOTA coupled to
a lysine in the same manner.
After optimizing the method for synthesizing peptides, the method was documented
in the form of a recipe, then applied to the synthesis of a bioactive penta-peptide, Met-
enkephalin, followed by similarly attaching the two puzzle pieces containing Cy5.5 or Gd-
DOTA to this peptide.
A stretch goal was then achieved by synthesis of a breast cancer targeted peptide
18-4, a deca-peptide reported by Dr. Kaur of Chapman University. Puzzle pieces or
modules containing a lipophilic Cy5.5 dye and Gd-DOTA were also coupled successfully
to the resin containing the protected form of 18-4, followed by cleavage with dilute 1 %
TFA to yield the partially and fully deprotected TMIAs.
The value of this work was to provide the molecular imaging lab (MIL) at RIT with
a powerful method to synthesize not only targeting peptides by SPPS, peptides by SPPS,
and to synthesize targeted molecular imaging agents (TMIAs) that will be useful in the
detection of breast cancer. In the larger scope, these methods may be widely used to
synthesize peptide-based TMIAs for detecting a wide variety of cancers by molecular
imaging methods.

44
Chapter 8. Experimental Procedures
Materials and Methods
Chemicals were purchased from VWR (Radnor, PA), Sigma Aldrich (St. Louis,
MO), Alfa Aesar (Ward Hill, MA), TCI (Tokyo, Japan), and Acros Organics (Morris Plains,
NY), and were used as received unless otherwise stated. All were HPLC or American
Chemical Society grade. Amino acid starting materials and Xanthenyl linker resin were
purchased from Bachem (Bubendorf, Switzerland), and Chem-Impex Int’l Inc. (Wood
Dale, IL).
The HPLC instrument used was an Agilent 1100 with Diode Array Detector and
for LC-MS a Waters 2695 Alliance HPLC with a Waters 2998 Diode Array Detector and
a Waters 3100 SQ Mass Spectrometer was used. For HPLC the columns used were: an
Agilent XDB C18 column, with dimensions of 3 mm x 100 mm or a Waters XBridge C18
column 50 mm x 3 mm and 3µ particle size. Mass spectra from this instrument were
recorded at unit resolution with positive and negative switching mode at 35 or 50 V cone
voltages. The flow rate for HPLC-MS was 0.5 mL/min. All aqueous mobile phases for
HPLC are 0.1M ammonium acetate unless otherwise noted.
Preparative HPLC (prep-HPLC) was carried out with a Waters 600E system
controller, and Waters 600 multi-solvent delivery system using a 30 mL/min flow rate. For
SPE purification, a 20 g C-18 Sep-pack Varian Mega Bond Elut (20CC/5GRM) SPE
cartridge was utilized for DCL (7) and Gd/La DOTA compounds and the DOTA
transmetalations utilized a Varian Bond Elut (C18, 3CC/1GRM) SPE cartridge.
Chromatography gradients for HPLC, prep-HPLC, and SPE are noted as (method
X: Y, t) where X is the organic mobile phase being either acetonitrile (ACN) or methanol
(MeOH), Y is the starting percentage or overall range of the organic mobile phase, and t is
the overall time in minutes of the gradient except for SPE where this is not applicable. For
example, method (ACN: 60, 8min) is a gradient that is initially 60% ACN and 40% H2O,
but gradually transitions to 100% ACN and 0% H2O in 8 minutes. Method (MeOH: 20-70,
8min) is a gradient that starts at 20% MeOH and 80% H2O, and over 8 minutes the gradient
transitions to 70% MeOH and 30% H2O.
All aqueous mobile phases for prep-HPLC are 0.1M ammonium acetate unless
otherwise noted. Aqueous mobile phases for SPE are not buffered unless otherwise noted.
The SPE cartridges were conditioned with their respective organic solvent, then pure DI
H2O, then equilibrated with the initial gradient concentration. Gradients were performed
in 5% increments with 3-10 mL fractions each unless otherwise noted. Silica gel for flash
chromatography was purchased from Alfa Aesar and was 70-230 mesh. For DOTA
compounds, a Keystone Scientific, Inc. Hyperprep C18 BDS 250mm x 20 mm column
with an 8µ particle size was used for prep-HPLC.
High resolution mass spectra (HRMS) were obtained on a Waters Synapt G2Si
(School of Chemical Sciences, University of Illinois at Urbana-Champaign) using the

45
following parameters: Flow injection at flow rate of 0.1 ml/min, H2O/ACN/0.1% Formic
Acid, positive and negative mode ESI, Cone voltage =25 V, capillary voltage = 3.0, ion
source temperature = 100°C, desolvation temperature =180C, nebulizing gas (N2) flow
= 200 L/h, cone gas (N2) flow = 5L/h.
Synthetic Procedures
Fmoc-Phe-NH2 (1). Xanthenyl linker resin (100.0 mg, 29.1 mol) was pre-swelled in
DMF (2 mL). After draining, mixture of 5% Piperazine, 2% DBU and 93% DMF (3 × 2
mL) were applied to the resin. DMF (3 × 2mL) was added to wash the beads. Fmoc-Phe-
OH (22.5 mg, 58.2 mol) was dissolved in 2 mL DMF, followed by addition of DIEA
(49.7 L, 29.1 mol). HATU (21.0 mg, 55.3 mol) was dissolved separately in 2 mL DMF
added to the previous mixture and shaken. Then this solution was added to the resin within
1 minute. After being stirring for about 45 minutes at room temperature, the reaction
solution was drained and washed with pure DMF (3 × 2 mL) and DCM (2 × 2 mL). A small
amount of the resultant resin (1R) (10 g), was removed and cleaved with 1% TFA in DCM
(5 × 1 mL) for 1-2 min, drained through the vessel frit. The eluent was concentrated on a
rotovap, dissolved in 0.5 mL methanol and assayed by LC-MS. LC-MS (LR, ESI) = Calcd.
for C24H22N2O3: 386.444 (m/z), found: 387.28 [M+H]+.
Fmoc-Ile-Phe-NH2 (2). Resin 1R was treated by the same procedure as for (1) above using
Fmoc-Ile-OH (20.6 mg, 58.2 mol), followed by cleavage of a small amount the resultant
resin (2R) also by the same procedure as above to yield of Fmoc-Ile-Phe-NH2 (2). LC-MS
(LR, ESI) = Calcd. for C30H33N3O4: 499.602 (m/z), found: 500.45 [M+H]+.
Fmoc-Met-Ile-Phe-NH2 (3). Resin 2R was treated by the same procedure as for (1) above
using Fmoc-Met-OH (21.6 mg, 58.2 mol), followed by cleavage of a small amount the
resultant resin also by the same procedure as above to yield of Fmoc-Met-Ile-Phe-NH2 (3).
LC-MS (LR, ESI) = Calcd. for C35H42N4O5S: 630.288 (m/z), found: 631.49 [M+H]+.
Fmoc-d-Lys(Cy5.5)-Phe-NH2 (4). Take a small amount of resin 1R (10 g), treated by
the same procedure as for (1) above using Fmoc-d-Lys(Cy5.5)-NH2 (5.43 mg, 5.82 mol),
followed by cleavage of the resultant resin also by the same procedure as above to yield of
Fmoc-d-Lys(Cy5.5)-Phe-NH2 (4).The yield was 4.6 mg (61.3%). LC-MS (LR, ESI) =
Calcd. for C70H75N6O5: 1080.384 (m/z), found: 1080 [M+H]+. LC-MS (HR, ESI) = Calcd.
for C70H75N6O5: 1079.57989, found: 1080.5801 [M+H]+.

46
Fmoc-d-Lys(Gd-DOTA)-Phe-NH2 (5). Take a small amount of resin 1R (10 g), treated
by the same procedure as for (1) above using Fmoc-d-Lys(Gd-DOTA)-NH2 (5.3 mg, 5.82
mol), followed by cleavage of the resultant resin also by the same procedure as above to
yield of Fmoc-d-Lys(Gd-DOTA)-Phe-NH2 (5). The yield was 15.7 mg (87.2%). LC-MS
(LR, ESI) = Calcd. for C46H57GdN8O11: 1055.246 (m/z), found: 1056.32 [M+H]+. LC-MS
(HR, ESI) = Calcd. for C46H57GdN8O11: 1055.33878, found: 1056.3452 [M+H]+.
Fmoc-Met-NH2 (6). Xanthenyl linker resin (100.0 mg, 29.1 mol) was pre-swelled in
DMF (2 mL). After draining, mixture of 5% Piperazine, 2% DBU and 93% DMF (3 × 2
mL) were applied to the resin. DMF (3 × 2mL) was added to wash the beads. Fmoc-Met-
OH (21.6 mg, 58.2 mol) was dissolved in 2 mL DMF, followed by addition of DIEA
(49.7 L, 29.1 mol). HATU (21.0 mg, 55.3 mol) was dissolved separately in 2 mL DMF
added to the previous mixture and shaken. Then this solution was added to the resin within
1 minute. After being stirring for about 45 minutes at room temperature, the reaction
solution was drained and washed with pure DMF (3 × 2 mL) and DCM (2 × 2 mL). A small
amount of the resultant resin (3R) (10 g), was removed and cleaved with 1% TFA in DCM
(5 × 1 mL) for 1-2 min, drained through the vessel frit. The eluent was concentrated on a
rotovap, dissolved in 0.5 mL methanol and assayed by LC-MS. This resin was taken
directly on to the next step without characterization.
Fmoc-Phe-Met-NH2 (7). Resin 3R was treated by the same procedure as for (4) above
using Fmoc-Phe-OH (22.5 mg, 58.2 mol), followed by cleavage of a small amount the
resultant resin (4R) also by the same procedure as above to yield of Fmoc-Phe-Met-NH2
(7). This resin was taken directly on to the next step without characterization.
Fmoc-Gly-Phe-Met-NH2 (8). Resin 4R was treated by the same procedure as for (4) above
using Fmoc-Gly-OH (17.3 mg, 58.2 mol), followed by cleavage of a small amount the
resultant resin (5R) also by the same procedure as above to yield of Fmoc-Gly-Phe-Met-
NH2 (8). This resin was taken directly on to the next step without characterization.
Fmoc-Gly-Gly-Phe-Met-NH2 (9). Resin 5R was treated by the same procedure as for (4)
above using Fmoc-Gly-OH (17.3 mg, 58.2 mol), followed by cleavage of a small amount
the resultant resin (6R) also by the same procedure as above to yield of Fmoc-Gly-Gly-
Phe-Met-NH2 (9). This resin was taken directly on to the next step without characterization.
Fmoc-Tyr-Gly-Gly-Phe-Met-NH2 (10). Resin 6R was treated by the same procedure as
for (4) above using Fmoc-Tyr(tBu)-OH (26.7 mg, 58.2 mol), followed by cleavage of a

47
small amount the resultant resin (7R) also by the same procedure as above to yield of Fmoc-
Tyr-Gly-Gly-Phe-Met-NH2 (10). LC-MS (LR, ESI) = Calcd. for C42H46N6O8S: 794.916
(m/z), found: 795.31 [M+H]+. LC-MS (HR, ESI) = Calcd. for C42H46N6O8S: 794.30978,
found: 795.3162 [M+H]+.
Fmoc-d-Lys(Cy5.5)-Tyr(tBu)-Gly-Gly-Phe-Met-NH2 (11). Resin 7R (8 mg, ca. 10 % of
the prior yield of 7R) was treated by the same procedure as for (4) above using Fmoc-d-
Lys(Cy5.5)-NH2 (5.43 mg, 5.82 mol), followed by cleavage of the resultant resin also by
the same procedure as above to yield of Fmoc-d-Lys(Cy5.5)-Tyr(tBu)-Gly-Gly-Phe-Met-
NH2 (11). The yield was 5.8 mg (71.5%). LC-MS (LR, ESI) = Calcd. for C92H107N10O10S:
1543.78924 (m/z), found: 1544.96 [M+H]+. LC-MS (HR, ESI) = Calcd. for
C92H107N10O10S: 1543.78924, found: 1544.7880 [M+H]+.
Fmoc-d-Lys(Gd-DOTA)-Tyr-Gly-Gly-Phe-Met-NH2 (12). Resin 7R (8 mg, ca. 10 % of
the prior yield of 7R) was treated by the same procedure as for (4) above using Fmoc-d-
Lys(Gd-DOTA)-NH2 (5.3 mg, 5.82 mol), followed by cleavage of the resultant resin also
by the same procedure as above to yield of Fmoc-d-Lys(Gd-DOTA)-Tyr-Gly-Gly-Phe-
Met-NH2 (12). LC-MS (LR, ESI) = Calcd. for C64H81GdN12O16S: 1463.718 (m/z), found:
1464.51 [M+H]+. LC-MS (HR, ESI) = Calcd. for C64H81GdN12O16S: 1463.48552, found:
1464.4897 [M+H]+.
Fmoc-Leu-NH2 (13). Xanthenyl linker resin (100.0 mg, 29.1 mol) was pre-swelled in
DMF (2 mL). After draining, mixture of 5% Piperazine, 2% DBU and 93% DMF (3 × 2
mL) were applied to the resin. DMF (3 × 2mL) was added to wash the beads. Fmoc-Leu-
OH (20.6 mg, 58.2 mol), was dissolved in 2 mL DMF, followed by addition of DIEA
(49.7 L, 29.1 mol). HATU (21.0 mg, 55.3 mol) was dissolved separately in 2 mL DMF
added to the previous mixture and shaken. Then this solution was added to the resin within
1 minute. After being stirring for about 45 minutes at room temperature, the reaction
solution was drained and washed with pure DMF (3 × 2 mL) and DCM (2 × 2 mL). A small
amount of the resultant resin (8R) (10 g), was removed and cleaved with 1% TFA in DCM
(5 × 1 mL) for 1-2 min, drained through the vessel frit. The eluent was concentrated on a
rotovap, dissolved in 0.5 mL methanol and assayed by LC-MS. LC-MS (LR, ESI) = Calcd.
for C21H24N2O3: 352.428 (m/z), found: 353.25 [M+H]+.
Fmoc-Phe-Leu-NH2 (14). Resin 8R was treated by the same procedure as for (13) above
using Fmoc-Phe-OH (22.5 mg, 58.2 mol), followed by cleavage of a small amount the
resultant resin (9R) also by the same procedure as above to yield of Fmoc-Phe-Leu-NH2
(14). LC-MS (LR, ESI) = Calcd. for C30H33N3O4: 499.602 (m/z), found: 500.32 [M+H]+.

48
Fmoc-d-Lys-Phe-Leu-NH2 (15). Resin 9R was treated by the same procedure as for (13)
above using Fmoc-d-Lys(Mtt)-OH (36.4 mg, 58.2 mol), followed by cleavage of a small
amount the resultant resin (10R) also by the same procedure as above to yield of Fmoc-d-
Lys-Phe-Leu-NH2 (15). LC-MS (LR, ESI) = Calcd. for C36H45N5O5: 627.774 (m/z), found:
628.43 [M+H]+.
Fmoc-Gln-d-Lys-Phe-Leu-NH2 (16). Resin 10R was treated by the same procedure as for
(13) above using Fmoc-Gln-OH (22.5 mg, 58.2 mol), followed by cleavage of a small
amount the resultant resin (11R) also by the same procedure as above to yield of Fmoc-
Gln-d-Lys-Phe-Leu-NH2 (16). LC-MS (LR, ESI) = Calcd. for C41H53N7O7: 755.904 (m/z),
found: 756.47 [M+H]+.
Fmoc-Tyr-Gln-d-Lys-Phe-Leu-NH2 (17). Resin 11R was treated by the same procedure
as for (13) above using Fmoc-Tyr(tBu)-OH (26.7 mg, 58.2 mol), followed by cleavage of
a small amount the resultant resin (12R) also by the same procedure as above to yield of
Fmoc-Tyr-Gln-d-Lys-Phe-Leu-NH2 (17). LC-MS (LR, ESI) = Calcd. for C50H62N8O9:
919.077 (m/z), found: 919.56 [M+H]+.
Fmoc-Ala-Tyr(tBu)-Gln-d-Lys-Phe-Leu-NH2 (18). Resin 12R was treated by the same
procedure as for (13) above using Fmoc-Ala-OH (18.1 mg, 58.2 mol), followed by
cleavage of a small amount the resultant resin (13R) also by the same procedure as above
to yield of Fmoc-Ala-Tyr(tBu)-Gln-d-Lys-Phe-Leu-NH2 (18). LC-MS (LR, ESI) = Calcd.
for C57H75N9O10: 1045.56369 (m/z), found: 1046.64 [M+H]+.
Fmoc-Ala-Ala-Tyr(tBu)-Gln-d-Lys-Phe-Leu-NH2 (19). Resin 13R was treated by the
same procedure as for (13) above using Fmoc-Ala-OH (18.1 mg, 58.2 mol), followed by
cleavage of a small amount the resultant resin (14R) also by the same procedure as above
to yield of Fmoc-Ala-Ala-Tyr(tBu)-Gln-d-Lys-Phe-Leu-NH2 (19). LC-MS (LR, ESI) =
Calcd. for C60H80N10O11: 1116.60080 (m/z), found: 1117.68 [M+H]+.
Fmoc-Glu(OtBu)-Ala-Ala-Tyr(tBu)-Gln-d-Lys-Phe-Leu-NH2 (20). Resin 14R was
treated by the same procedure as for (13) above using Fmoc-Glu(OtBu)-OH (24.8 mg, 58.2
mol), followed by cleavage of a small amount the resultant resin (15R) also by the same
procedure as above to yield of Fmoc-Glu(OtBu)-Ala-Ala-Tyr(tBu)-Gln-d-Lys-Phe-Leu-
NH2 (20). LC-MS (LR, ESI) = Calcd. for C69H95N11O14: 1301.70600 (m/z), found: 1302.82
[M+H]+.

49
Fmoc-d-Nle-Glu(OtBu)-Ala-Ala-Tyr(tBu)-Gln-d-Lys-Phe-Leu-NH2 (21). Resin 15R
was treated by the same procedure as for (13) above using Fmoc-d-Nle-OH (20.6 mg, 58.2
mol), followed by cleavage of a small amount the resultant resin (16R) also by the same
procedure as above to yield of Fmoc-d-Nle-Glu(OtBu)-Ala-Ala-Tyr(tBu)-Gln-d-Lys-Phe-
Leu-NH2 (21). LC-MS (LR, ESI) = Calcd. for C75H106N12O15: 1414.79006 (m/z), found:
1415.91 [M+H]+.
Fmoc-Trp(Boc)-d-Nle-Glu(OtBu)-Ala-Ala-Tyr(tBu)-Gln-d-Lys-Phe-Leu-NH2 (22).
Resin 16R was treated by the same procedure as for (13) above using Fmoc-Trp(Boc)-OH
(30.6 mg, 58.2 mol), followed by cleavage of a small amount the resultant resin (17R)
also by the same procedure as above to yield of Fmoc-Trp(Boc)-d-Nle-Glu(OtBu)-Ala-
Ala-Tyr(tBu)-Gln-d-Lys-Phe-Leu-NH2 (22). LC-MS (LR, ESI) = Calcd. for C91H124N14O18:
1702.044 (m/z), found: 1703.19 [M+H]+. LC-MS (HR, ESI) = Calcd. for C91H124N14O18:
1700.92180 (m/z), found: 1701.9264 [M+H]+.
Fmoc-d-Lys(Cy5.5)-Trp(Boc)-d-Nle-Glu(OtBu)-Ala-Ala-Tyr(tBu)-Gln-d-Lys-Phe-
Leu-NH2 (23). Take a small amount of resin 17R (10 g), treated by the same procedure
as for (13) above using Fmoc-d-Lys(Cy5.5)-NH2 (5.43 mg, 5.82 mol), followed by
cleavage of the resultant resin (18R) also by the same procedure as above to yield of Fmoc-
d-Lys(Cy5.5)-Trp(Boc)-d-Nle-Glu(OtBu)-Ala-Ala-Tyr(tBu)-Gln-d-Lys-Phe-Leu-NH2
(23). LC-MS (LR, ESI) = Calcd. for C137H177N18O20: 2395.985 (m/z), found: 1198.32
[M+2H]+/2. LC-MS (HR, ESI) = Calcd. for C137H177N18O20: 2394.33866 (m/z), found:
1198.1732 [M+2H]+/2.
H-d-Lys(Cy5.5)-Trp-d-Nle-Glu-Ala-Ala-Tyr-Gln-d-Lys-Phe-Leu-NH2 (24). Take a
small amount of resin 18R (10 g), treated with Fmoc deprotection method, followed by
cleavage of the resultant resin also by the same procedure as above to yield of NH2-d-
Lys(Cy5.5)-Trp-d-Nle-Glu-Ala-Ala-Tyr-Gln-d-Lys-Phe-Leu-NH2 (24). LC-MS (LR, ESI)
= Calcd. for C109H143N18O16: 1960.08800 (m/z), found: 981.28 [M+2H]+/2. LC-MS (HR,
ESI) = Calcd. for C109H143N18O16: 1960.08800 (m/z), found: 981.05194 [M+2H]+/2.
Fmoc-d-Lys(Gd-DOTA)-Trp(Boc)-d-Nle-Glu(OtBu)-Ala-Ala-Tyr(tBu)-Gln-d-Lys-
Phe-Leu-NH2 (25). Take a small amount of resin 17R (10 g), treated by the same
procedure as for (13) above using Fmoc-d-Lys(Gd-DOTA)-NH2 (5.3 mg, 5.82 mol),
followed by cleavage of the resultant resin also by the same procedure as above to yield of
Fmoc-d-Lys(Gd-DOTA)-Trp(Boc)-d-Nle-Glu(OtBu)-Ala-Ala-Tyr(tBu)-Gln-d-Lys-Phe-
Leu-NH2 (24). LC-MS (LR, ESI) = Calcd. for C113H159GdN20O26: 2370.846 (m/z), found:

50
1186.64 [M+2H]+/2. LC-MS (HR, ESI) = Calcd. for C113H159GdN20O26: 2370.09754 (m/z),
found: 1186.0563 [M+2H]+/2.

51
References
(1) Cancer https://www.who.int/news-room/fact-sheets/detail/cancer (accessed May 4,
2019).
(2) What Is Cancer? https://www.cancer.gov/about-cancer/understanding/what-is-
cancer (accessed May 4, 2019).
(3) Global Cancer Observatory http://gco.iarc.fr/ (accessed Jun 28, 2019).
(4) Wang, R.; Yin, Z.; Liu, L.; Gao, W.; Li, W.; Shu, Y.; Xu, J. Second Primary Lung
Cancer After Breast Cancer: A Population-Based Study of 6,269 Women. Front.
Oncol. 2018, 8. https://doi.org/10.3389/fonc.2018.00427.
(5) Breast cancer: Symptoms, risk factors, and treatment
https://www.medicalnewstoday.com/articles/37136.php (accessed Nov 14, 2017).
(6) Chen, Z.-Y.; Wang, Y.-X.; Lin, Y.; Zhang, J.-S.; Yang, F.; Zhou, Q.-L.; Liao, Y.-Y.
Advance of Molecular Imaging Technology and Targeted Imaging Agent in
Imaging and Therapy. BioMed Res. Int. 2014. https://doi.org/10.1155/2014/819324.
(7) Dey, P. Fluorescence and Confocal Microscope: Basic Principles and Applications
in Pathology. In Basic and Advanced Laboratory Techniques in Histopathology and
Cytology; Dey, P., Ed.; Springer Singapore: Singapore, 2018; pp 245–252.
https://doi.org/10.1007/978-981-10-8252-8_25.
(8) Atreya, R.; Goetz, M. Molecular Imaging in Gastroenterology. Nat. Rev.
Gastroenterol. Hepatol. 2013, 10 (12), nrgastro.2013.125.
https://doi.org/10.1038/nrgastro.2013.125.
(9) Schmitthenner, H. F.; Beach, S.; Weidman, C.; Barrett, T. Modular Imaging Agents
Containing Amino Acids and Peptides. US20150038672A1, February 5, 2015.
(10) Schmitthenner, H. F.; Sweeney-Jones, A. M.; Williams, S. Transmetalation Methods
for the Synthesis of PET and SPECT Imaging Agents. US20160251378A1,
September 1, 2016.
(11) Azhdarinia, A.; Wilganowski, N.; Robinson, H.; Ghosh, P.; Kwon, S.; Lazard, Z.
W.; Davis, A. R.; Olmsted-Davis, E.; Sevick-Muraca, E. M. Characterization of
Chemical, Radiochemical and Optical Properties of a Dual-Labeled MMP-9
Targeting Peptide. Bioorg. Med. Chem. 2011, 19 (12), 3769–3776.
https://doi.org/10.1016/j.bmc.2011.04.054.
(12) Soudy, R.; Gill, A.; Sprules, T.; Lavasanifar, A.; Kaur, K. Proteolytically Stable
Cancer Targeting Peptides with High Affinity for Breast Cancer Cells. J. Med.
Chem. 2011, 54 (21), 7523–7534. https://doi.org/10.1021/jm200750x.
(13) Raghuwanshi, Y.; Etayash, H.; Soudy, R.; Paiva, I.; Lavasanifar, A.; Kaur, K.
Proteolytically Stable Cyclic Decapeptide for Breast Cancer Cell Targeting. J. Med.
Chem. 2017, 60 (12), 4893–4903. https://doi.org/10.1021/acs.jmedchem.7b00163.
(14) Soudy, R.; Etayash, H.; Bahadorani, K.; Lavasanifar, A.; Kaur, K. Breast Cancer
Targeting Peptide Binds Keratin 1: A New Molecular Marker for Targeted Drug
Delivery to Breast Cancer. Mol. Pharm. 2017, 14 (3), 593–604.
https://doi.org/10.1021/acs.molpharmaceut.6b00652.
(15) Palomo, J. M. Solid-Phase Peptide Synthesis: An Overview Focused on the
Preparation of Biologically Relevant Peptides. RSC Adv. 2014, 4 (62), 32658–
32672. https://doi.org/10.1039/C4RA02458C.

52
(16) Structural Biochemistry/Proteins/Synthesis - Wikibooks, open books for an open
world https://en.wikibooks.org/wiki/Structural_Biochemistry/Proteins/Synthesis
(accessed Nov 6, 2017).
(17) Ralhan, K.; Guru KrishnaKumar, V.; Gupta, S. Piperazine and DBU: A Safer
Alternative for Rapid and Efficient Fmoc Deprotection in Solid Phase Peptide
Synthesis. RSC Adv. 2015, 5 (126), 104417–104425.
https://doi.org/10.1039/C5RA23441G.
(18) Cheng, Z.; Wu, Y.; Xiong, Z.; Gambhir, S. S.; Chen, X. Near-Infrared Fluorescent
RGD Peptides for Optical Imaging of Integrin Αvβ3 Expression in Living Mice.
Bioconjug. Chem. 2005, 16 (6), 1433–1441. https://doi.org/10.1021/bc0501698.
(19) The Basics of MRI https://www.cis.rit.edu/htbooks/mri/ (accessed Mar 27, 2019).
(20) Zhou, Z.; Lu, Z.-R. Gadolinium-Based Contrast Agents for MR Cancer Imaging.
Wiley Interdiscip. Rev. Nanomed. Nanobiotechnol. 2013, 5 (1), 1–18.
https://doi.org/10.1002/wnan.1198.
(21) León‐Rodriguez, L. M. D.; Kovacs, Z.; Dieckmann, G. R.; Sherry, A. D. Solid-
Phase Synthesis of DOTA–Peptides. Chem. – Eur. J. 2004, 10 (5), 1149–1155.
https://doi.org/10.1002/chem.200305389.
(22) Yoo, B.; Pagel, M. D. Peptidyl Molecular Imaging Contrast Agents Using a New
Solid-Phase Peptide Synthesis Approach. Bioconjug. Chem. 2007, 18 (3), 903–911.
https://doi.org/10.1021/bc060250q.

53
Appendix I: Analytical Data
Stability test of IR800
LC-MS total diode array chromatogram (TDA) Mass spectra of parent dye and methyl adduct (top)
Peak 5.51 is Methyl adducts with no DCM present
LC-MS total diode array chromatogram (TDA) Mass spectra of parent dye
No methyl adducts when DCM is present
Stability test of Cy5.5
LC-MS total diode array chromatogram (TDA) Mass spectra of parent dye and methyl adduct (top)
Peak 6.34 is Methyl adducts with no DCM present
17_10_12_XX_IR800CW_0-01M_TFA+MeOH_5
Time0.00 1.00 2.00 3.00 4.00 5.00 6.00 7.00 8.00
%
0
100
0.00 1.00 2.00 3.00 4.00 5.00 6.00 7.00 8.00
AU
0.0
1.0e+2
2.0e+2
17_10_12_XX_IR800CW_0-01M_TFA+MeOH_5 3: Diode Array Range: 2.852e+24.93
0.30
5.51
17_10_12_XX_IR800CW_0-01M_TFA+MeOH_5 1: Scan ES- TIC
1.20e8
4.84
1.75
0.12
5.40
6.68
17_10_12_XX_IR800CW_0-01M_TFA+MeOH_5
m/z200 400 600 800 1000 1200 1400 1600 1800 2000
%
0
100
%
0
100
17_10_12_XX_IR800CW_0-01M_TFA+MeOH_5 156 (5.398) Cm (156:159) 1: Scan ES- 1.30e7507.35
337.99
112.87 506.71
338.78
676.61
594.53
1015.78
1015.04678.181017.75
1371.45 1550.85
17_10_12_XX_IR800CW_0-01M_TFA+MeOH_5 140 (4.841) Cm (140:143) 1: Scan ES- 1.28e7500.29
333.19
112.90
249.58
333.94
334.67
667.77
501.30
666.90
587.44
1002.56668.59
1000.91669.43
1003.341024.38 1364.66 1545.81 1721.65 1796.83
17_10_12_XX_IR800CW_0-01M_TFA+DCM+50MeOH_7
Time0.00 1.00 2.00 3.00 4.00 5.00 6.00 7.00 8.00
%
0
100
0.00 1.00 2.00 3.00 4.00 5.00 6.00 7.00 8.00
AU
0.0
1.0e+2
2.0e+2
17_10_12_XX_IR800CW_0-01M_TFA+DCM+50MeOH_7 3: Diode Array Range: 2.986e+24.69
0.286.055.32
17_10_12_XX_IR800CW_0-01M_TFA+DCM+50MeOH_7 1: Scan ES- TIC
9.46e7
4.60
1.650.16
3.903.175.29 6.515.81
17_10_12_XX_IR800CW_0-01M_TFA+DCM+50MeOH_7
m/z200 400 600 800 1000 1200 1400 1600 1800 2000
%
0
100
17_10_12_XX_IR800CW_0-01M_TFA+DCM+50MeOH_7 133 (4.598) Cm (131:138) 1: Scan ES- 8.81e6500.39
333.30
172.93
332.65
249.75
499.69
347.04
667.58
666.80
587.44
1002.00
668.391001.11
669.121000.45
1002.82
1003.591353.41 1546.86
1693.301853.40
17_10_12_XX_Cy55_0-01M_TFA+MeOH_1b
Time0.00 1.00 2.00 3.00 4.00 5.00 6.00 7.00 8.00
%
0
100
0.00 1.00 2.00 3.00 4.00 5.00 6.00 7.00 8.00
AU
0.0
1.0e+2
2.0e+2
17_10_12_XX_Cy55_0-01M_TFA+MeOH_1b 3: Diode Array Range: 2.39e+25.89
0.91 2.52
6.34
17_10_12_XX_Cy55_0-01M_TFA+MeOH_1b 1: Scan ES- TIC
7.73e7
5.79
0.12
2.380.79
1.901.65
2.70
4.994.754.193.63
6.28
7.256.76
17_10_12_XX_Cy55_0-01M_TFA+MeOH_1b
m/z200 400 600 800 1000 1200 1400 1600 1800 2000
%
0
100
%
0
100
17_10_12_XX_Cy55_0-01M_TFA+MeOH_1b 181 (6.276) Cm (179:184) 1: Scan ES- 4.24e6438.31
172.96
437.69
347.14
439.26
878.14525.32 584.67936.41 1317.56 1801.69
1701.64 1942.67
17_10_12_XX_Cy55_0-01M_TFA+MeOH_1b 167 (5.789) Cm (165:170) 1: Scan ES- 1.11e7431.21
173.00
287.12
432.21864.01
863.19575.63
633.59
864.99
1152.071296.14
1441.19 1762.69 1953.69
M+H+
M+H++ CH2
(M+2H+)/2
M+H+
(M+2H+)/2
M+H++ CH2
M+H+
(M+2H+)/2

54
LC-MS total diode array chromatogram (TDA) Mass spectra of parent dye
No methyl adducts when DCM is present
Stability test of QC1
LC-MS total diode array chromatogram (TDA) Mass spectra of parent dye
LC-MS total diode array chromatogram (TDA) Mass spectra of parent dye
17_10_12_XX_Cy55_0-01M_TFA+DCM+20MeOH_3
Time0.00 1.00 2.00 3.00 4.00 5.00 6.00 7.00 8.00
%
0
100
0.00 1.00 2.00 3.00 4.00 5.00 6.00 7.00 8.00
AU
0.0
2.5e+1
5.0e+1
7.5e+1
17_10_12_XX_Cy55_0-01M_TFA+DCM+20MeOH_3 3: Diode Array Range: 8.658e+15.18
0.571.09
4.60
6.25
17_10_12_XX_Cy55_0-01M_TFA+DCM+20MeOH_3 1: Scan ES- TIC
3.20e7
5.091.890.05
0.33
1.06 4.712.244.503.91
3.21
7.98
7.116.905.82
17_10_12_XX_Cy55_0-01M_TFA+DCM+20MeOH_3
m/z200 400 600 800 1000 1200 1400 1600 1800 2000
%
0
100
17_10_12_XX_Cy55_0-01M_TFA+DCM+20MeOH_3 147 (5.088) Cm (147:151) 1: Scan ES- 4.85e6431.19
172.95
347.00
190.94
432.03
575.42863.93
576.26605.35 865.36
1598.061152.361469.70
1804.98 1989.24
17_10_12_XX_QC1_0-01M_TFA+MeOH_9
Time0.00 1.00 2.00 3.00 4.00 5.00 6.00 7.00 8.00
%
0
100
0.00 1.00 2.00 3.00 4.00 5.00 6.00 7.00 8.00
AU
0.0
1.0e+2
2.0e+2
17_10_12_XX_QC1_0-01M_TFA+MeOH_9 3: Diode Array Range: 2.9e+25.92
4.960.30
17_10_12_XX_QC1_0-01M_TFA+MeOH_9 1: Scan ES- TIC
1.24e8
5.85
1.72
0.23 4.882.55 4.15
17_10_12_XX_QC1_0-01M_TFA+MeOH_9
m/z200 400 600 800 1000 1200 1400 1600 1800 2000
%
0
100
17_10_12_XX_QC1_0-01M_TFA+MeOH_9 169 (5.849) Cm (164:172) 1: Scan ES- 7.88e6391.38
390.73112.89
172.95
358.72
287.07
587.57
392.18
586.87
538.45
537.79
588.46
784.52
783.49
589.37
674.73
1176.92
1176.09
785.42
1175.32
882.401143.75
1177.76
1178.53
1195.11 1484.16
17_10_12_XX_QC1_0-01M_TFA+DCM+MeOH_11
Time0.00 1.00 2.00 3.00 4.00 5.00 6.00 7.00 8.00
%
0
100
0.00 1.00 2.00 3.00 4.00 5.00 6.00 7.00 8.00
AU
0.0
1.0e+2
2.0e+2
17_10_12_XX_QC1_0-01M_TFA+DCM+MeOH_11 3: Diode Array Range: 2.629e+25.67
5.224.550.28
17_10_12_XX_QC1_0-01M_TFA+DCM+MeOH_11 1: Scan ES- TIC
1.22e8
5.61
1.580.19 5.164.46
17_10_12_XX_QC1_0-01M_TFA+MeOH_9
m/z200 400 600 800 1000 1200 1400 1600 1800 2000
%
0
100
%
0
100
17_10_12_XX_QC1_0-01M_TFA+MeOH_9 169 (5.849) Cm (165:173) 1: Scan ES- 8.29e6391.37
390.72112.88
358.79
587.58
392.18
586.87
538.25
588.46
784.52783.49
589.38
1176.92785.43
1175.321178.531484.16
17_10_12_XX_QC1_0-01M_TFA+MeOH_9 141 (4.875) Cm (140:144) 1: Scan ES- 2.31e6112.85
172.91
539.18358.97
538.23
364.67
540.05
719.64 1842.511079.85894.27 1385.421702.80
2004.26
M+H+
(M+2H+)/2
M+H+
M+H+
(M+2H+)/2
(M+2H+)/2

55
Fmoc-Phe-NH2 1
LC-MS Total Diode Array Chromatogram (TDA) Mass Spectra and UV Spectra of cleaved product
Total Ion Chromatogram (TIC)
Extracted Ion Chromatogram (XIC) at 387 amu.
Single Wavelength Chromatogram (SWC) at 263 nm
Fmoc-Ile-Phe-NH2 2
LC-MS Total Diode Array Chromatogram (TDA) Mass Spectra and UV Spectra of cleaved product
Total Ion Chromatogram (TIC)
18_06_07_XX_Xanthenyl_FF_NH2_1b
Time0.00 2.00 4.00 6.00 8.00
%
0
100
0.00 2.00 4.00 6.00 8.00
AU
0.0
2.0e+2
18_06_07_XX_Xanthenyl_FF_NH2_1b 3: Diode Array Range: 3.976e+22.38
1.07
18_06_07_XX_Xanthenyl_FF_NH2_1b 1: Scan ES+ TIC
9.51e7
2.372.24
2.121.00
1.11
6.556.426.285.72
5.004.553.99
6.75
7.70 7.86
18_06_07_XX_Xanthenyl_FF_NH2_1b
m/z250 500 750 1000 1250 1500 1750
AU
0.0
2.0
%
0
100
18_06_07_XX_Xanthenyl_FF_NH2_1b 132 (2.369) Cm (114:147) 1: Scan ES+ 1.39e7790.68404.33
387.28
115.10
405.35 773.65
460.48
791.68
792.721177.00
1950.651564.29
18_06_07_XX_Xanthenyl_FF_NH2_1b 287 (2.383) Cm (254:321) 3: Diode Array 3.986210.53
298.53
18_06_07_XX_Xanthenyl_FF_NH2_1b
Time0.00 1.00 2.00 3.00 4.00 5.00 6.00 7.00 8.00
AU
0.0
2.0
4.0
0.00 1.00 2.00 3.00 4.00 5.00 6.00 7.00 8.00
%
0
100
18_06_07_XX_Xanthenyl_FF_NH2_1b 1: Scan ES+ 387.2851.16e7
2.372.15 2.46
2.60
2.64
2.87
18_06_07_XX_Xanthenyl_FF_NH2_1b 3: Diode Array 263
Range: 5.093
2.37
1.07
18_06_07_XX_Xanthenyl_FIF_NH2_2
Time0.00 2.00 4.00 6.00 8.00
%
0
100
0.00 2.00 4.00 6.00 8.00
AU
0.0
1.0e+2
2.0e+2
18_06_07_XX_Xanthenyl_FIF_NH2_2 3: Diode Array Range: 2.368e+22.97
1.06
18_06_07_XX_Xanthenyl_FIF_NH2_2 1: Scan ES+ TIC
8.80e7
2.80
0.961.12
1.50
2.91
6.576.395.61
3.36 4.916.82 7.64
18_06_07_XX_Xanthenyl_FIF_NH2_2
m/z250 500 750 1000 1250 1500 1750
AU
0.0
1.0
2.0
%
0
100
18_06_07_XX_Xanthenyl_FIF_NH2_2 156 (2.801) Cm (151:176) 1: Scan ES+ 1.57e7517.49
500.45
141.13483.49
1016.93
518.50999.90
519.54729.76
1517.361018.94
1500.321021.84 1519.331767.14
18_06_07_XX_Xanthenyl_FIF_NH2_2 357 (2.967) Cm (322:391) 3: Diode Array 2.633208.53
262.53
298.53
M+H+
M+H2O
Fmoc
M+H+
M+H2O
Fmoc
2M+H2O
2M+H2O
3M+H2O
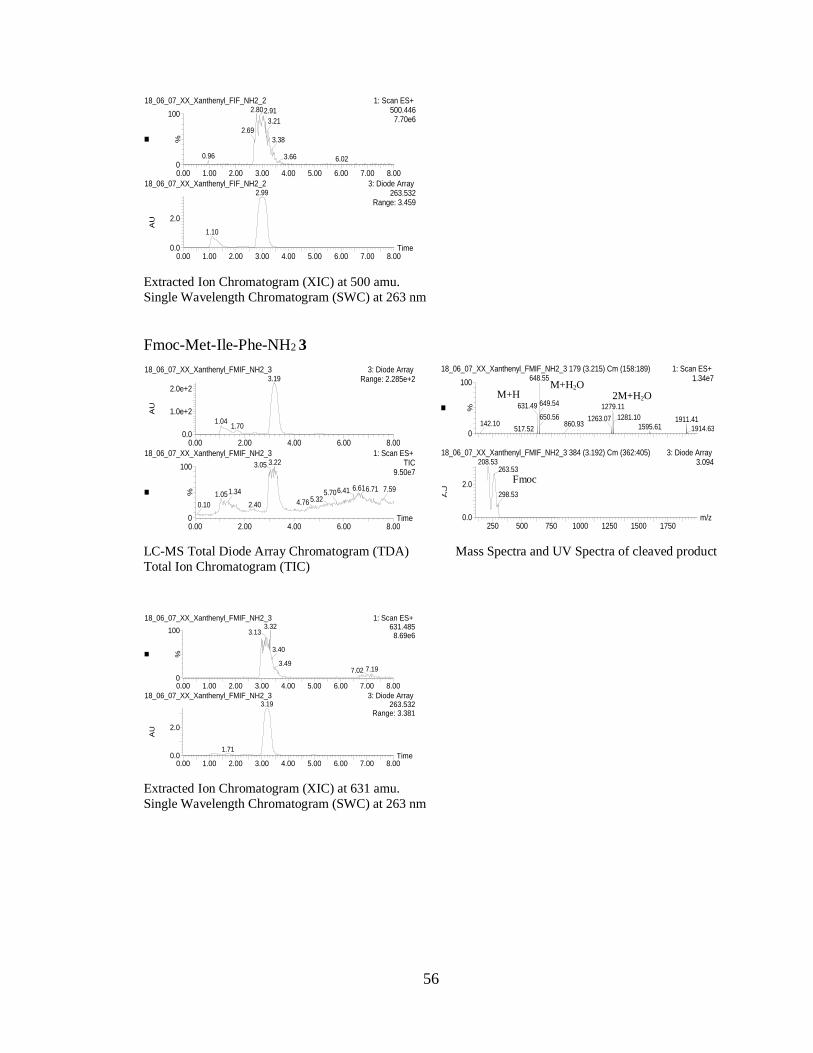
56
Extracted Ion Chromatogram (XIC) at 500 amu.
Single Wavelength Chromatogram (SWC) at 263 nm
Fmoc-Met-Ile-Phe-NH2 3
LC-MS Total Diode Array Chromatogram (TDA) Mass Spectra and UV Spectra of cleaved product
Total Ion Chromatogram (TIC)
Extracted Ion Chromatogram (XIC) at 631 amu.
Single Wavelength Chromatogram (SWC) at 263 nm
18_06_07_XX_Xanthenyl_FIF_NH2_2
Time0.00 1.00 2.00 3.00 4.00 5.00 6.00 7.00 8.00
AU
0.0
2.0
0.00 1.00 2.00 3.00 4.00 5.00 6.00 7.00 8.00%
0
100
18_06_07_XX_Xanthenyl_FIF_NH2_2 1: Scan ES+ 500.4467.70e6
2.80
2.69
0.96
2.91
3.21
3.38
3.66 6.02
18_06_07_XX_Xanthenyl_FIF_NH2_2 3: Diode Array 263.532
Range: 3.459
2.99
1.10
18_06_07_XX_Xanthenyl_FMIF_NH2_3
Time0.00 2.00 4.00 6.00 8.00
%
0
100
0.00 2.00 4.00 6.00 8.00
AU
0.0
1.0e+2
2.0e+2
18_06_07_XX_Xanthenyl_FMIF_NH2_3 3: Diode Array Range: 2.285e+23.19
1.041.70
18_06_07_XX_Xanthenyl_FMIF_NH2_3 1: Scan ES+ TIC
9.50e7
3.223.05
1.05
0.10
1.34
2.40
6.616.415.705.324.76
6.71 7.59
18_06_07_XX_Xanthenyl_FMIF_NH2_3
m/z250 500 750 1000 1250 1500 1750
AU
0.0
2.0
%
0
100
18_06_07_XX_Xanthenyl_FMIF_NH2_3 179 (3.215) Cm (158:189) 1: Scan ES+ 1.34e7648.55
631.49
142.10517.52
1279.11649.54
650.56 1263.07860.93
1281.10 1911.411595.61 1914.63
18_06_07_XX_Xanthenyl_FMIF_NH2_3 384 (3.192) Cm (362:405) 3: Diode Array 3.094208.53
263.53
298.53
18_06_07_XX_Xanthenyl_FMIF_NH2_3
Time0.00 1.00 2.00 3.00 4.00 5.00 6.00 7.00 8.00
AU
0.0
2.0
0.00 1.00 2.00 3.00 4.00 5.00 6.00 7.00 8.00
%
0
100
18_06_07_XX_Xanthenyl_FMIF_NH2_3 1: Scan ES+ 631.4858.69e6
3.323.13
3.40
3.497.197.02
18_06_07_XX_Xanthenyl_FMIF_NH2_3 3: Diode Array 263.532
Range: 3.381
3.19
1.71
M+H2O
Fmoc
M+H+
2M+H2O

57
Fmoc-d-Lys(Cy5.5)-Phe-NH2 4
Single wavelength chromatogram (SWC) at 265 nm
UV-Vis-NIR spectra shows Cy5.5 dye is present in product
200 300 400 500 600 700 nm
-0.5
0.0
0.5
1.0
1.5
2.0
2.5
3.0
3.5
4.0
4.5
5.0mAU(x100)
4.60/ 1.00
67
9
22
2
25
5
30
02
892
41
28
52
95
33
4
31
7
Cy5.5

58
Mass spectra of product
HRMS of Fmoc-d-Lys(Cy5.5)-Phe-NH2
High resolution mass spectra of product
250 500 750 1000 1250 1500 1750 m/z
0.0
0.1
0.2
0.3
0.4
0.5
0.6
0.7
0.8
0.9
1.0
1.1
1.2
1.3
1.4
1.5
Inten.(x1,000,000)
1080
541
532 902
M+H+
M+H+
(M+2H+)/2
(M+2H+)/2

59
Expanded high resolution mass spectra of product
Fmoc-d-Lys(Gd-DOTA)-Phe-NH2 5
Total Ion Chromatogram (TIC) Mass Spectra and UV Spectra of cleaved product
LC-MS Total Diode Array Chromatogram
product at 4.11 min
19_02_25_XX_Fmoc_dK(Gd-DOTA)_Phe_NH2_3
Time2.00 4.00 6.00 8.00
AU
0.0
5.0e+1
2.00 4.00 6.00 8.00
%
0
100
19_02_25_XX_Fmoc_dK(Gd-DOTA)_Phe_NH2_3 1: Scan ES+ TIC
8.13e7
1.80
1.110.70
3.55
2.213.34
3.85
7.494.20
5.125.98
19_02_25_XX_Fmoc_dK(Gd-DOTA)_Phe_NH2_3 3: Diode Array Range: 1.022e+24.11
1.38
3.601.82
19_02_25_XX_Fmoc_dK(Gd-DOTA)_Phe_NH2_3
m/z200 400 600 800 1000 1200
AU
0.0
5.0e-1
m/z200 400 600 800 1000 1200
%
0
100
19_02_25_XX_Fmoc_dK(Gd-DOTA)_Phe_NH2_3 123 (4.198) Cm (119:129)4.63e6363.28
179.11
349.26
1056.32364.29
1053.31
442.27 1052.33834.32
1059.34
1130.55
19_02_25_XX_Fmoc_dK(Gd-DOTA)_Phe_NH2_3 494 (4.108) Cm (465:514)8.882e-1208.53
263.53
298.53
M+H+
M+H+
Fmoc

60
Extracted Ion Chromatogram (XIC) at 1056 amu. Expanded mass spectra of product showing
Single Wavelength Chromatogram (SWC) at 263 nm Gd isotope pattern
HRMS of Fmoc-d-Lys(Gd-DOTA)-Phe-NH2
High resolution mass spectra of product
19_02_25_XX_Fmoc_dK(Gd-DOTA)_Phe_NH2_3
Time0.00 1.00 2.00 3.00 4.00 5.00 6.00 7.00 8.00
AU
0.0
5.0e-1
1.0
0.00 1.00 2.00 3.00 4.00 5.00 6.00 7.00 8.00%
0
100
19_02_25_XX_Fmoc_dK(Gd-DOTA)_Phe_NH2_3 1: Scan ES+ 1056.323
4.92e6
4.03
4.33
19_02_25_XX_Fmoc_dK(Gd-DOTA)_Phe_NH2_3 3: Diode Array 263.532
Range: 1.346
4.11
2.03
19_02_25_XX_Fmoc_dK(Gd-DOTA)_Phe_NH2_3
m/z1035 1040 1045 1050 1055 1060 1065 1070 1075
%
0
100
19_02_25_XX_Fmoc_dK(Gd-DOTA)_Phe_NH2_3 123 (4.198) Cm (119:129)1.95e61056.32
1055.32
1053.31
1052.331036.32 1041.37
1058.32
1059.34
1060.36
1061.401073.35
1076.12
M+H+
M+H+

61
Expanded high resolution mass spectra of Gd isotope pattern
Fmoc-Tyr-Gly-Gly-Phe-Met-NH2 10
Total Ion Chromatogram (TIC) Mass Spectra and UV Spectra of cleaved product
LC-MS Total Diode Array Chromatogram
product at 5.23 min
Extracted Ion Chromatogram (XIC) at 795 amu.
Single Wavelength Chromatogram (SWC) at 264 nm
19_02_25_XX_Fmoc_Met Enkephalin_NH2_1b
Time2.00 4.00 6.00 8.00
AU
0.0
2.5e+1
5.0e+1
2.00 4.00 6.00 8.00
%
0
100
19_02_25_XX_Fmoc_Met Enkephalin_NH2_1b 1: Scan ES+ TIC
4.55e7
7.865.16
2.352.211.11
0.94
5.022.48 4.57
3.17 7.045.67
19_02_25_XX_Fmoc_Met Enkephalin_NH2_1b 3: Diode Array Range: 7.517e+15.23
1.36
1.11 4.64
19_02_25_XX_Fmoc_Met Enkephalin_NH2_1b
m/z200 400 600 800 1000
AU
0.0
5.0e-1
m/z200 400 600 800 1000
%
0
100
19_02_25_XX_Fmoc_Met Enkephalin_NH2_1b 151 (5.157) Cm (146:157)7.74e6795.30
197.07 778.26
647.27198.07 558.44
796.30
797.29
813.31 958.401172.58
19_02_25_XX_Fmoc_Met Enkephalin_NH2_1b 628 (5.225) Cm (611:653)8.345e-1208.53
263.53
298.53
19_02_25_XX_Fmoc_Met Enkephalin_NH2_1b
Time2.00 4.00 6.00 8.00
AU
0.0
2.5e-1
5.0e-1
2.00 4.00 6.00 8.00
%
0
100
19_02_25_XX_Fmoc_Met Enkephalin_NH2_1b 1: Scan ES+ 795.3021.49e7
5.16
5.40
19_02_25_XX_Fmoc_Met Enkephalin_NH2_1b 3: Diode Array 264.532
Range: 7.323e-1
5.23
4.641.36
M+H+
M+H+
Fmoc

62
HRMS of Fmoc-Tyr-Gly-Gly-Phe-Met-NH2
High resolution mass spectra of product
Fmoc-d-Lys(Cy5.5)-Tyr-Gly-Gly-Phe-Met-NH2 11
LC-MS Total Diode Array Chromatogram (TDA) Single wavelength chromatogram at 263 nm Total Ion Chromatogram (TIC)
19_02_25_XX_Fmoc_dK(Cy55)_Met Enkephalin_NH2_12
Time0.00 1.00 2.00 3.00 4.00 5.00 6.00 7.00 8.00
AU
0.0
2.5
5.0
7.5
0.00 1.00 2.00 3.00 4.00 5.00 6.00 7.00 8.00
%
0
100
19_02_25_XX_Fmoc_dK(Cy55)_Met Enkephalin_NH2_12 1: Scan ES+ TIC
5.69e7
1.11
0.05
7.765.295.09
4.682.451.76 4.162.83
5.47 7.496.05
19_02_25_XX_Fmoc_dK(Cy55)_Met Enkephalin_NH2_12 3: Diode Array Range: 1.254e+11.16
0.00
19_02_25_XX_Fmoc_dK(Cy55)_Met Enkephalin_NH2_12
Time0.00 1.00 2.00 3.00 4.00 5.00 6.00 7.00 8.00
AU
0.0
2.5
5.0
7.5
0.00 1.00 2.00 3.00 4.00 5.00 6.00 7.00 8.00
AU
0.0
5.0e-3
1.0e-2
19_02_25_XX_Fmoc_dK(Cy55)_Met Enkephalin_NH2_12 3: Diode Array 263
Range: 1.587e-2
1.37
1.17
0.92
0.00
2.15
19_02_25_XX_Fmoc_dK(Cy55)_Met Enkephalin_NH2_12 3: Diode Array Range: 1.254e+11.16
0.00
M+H+
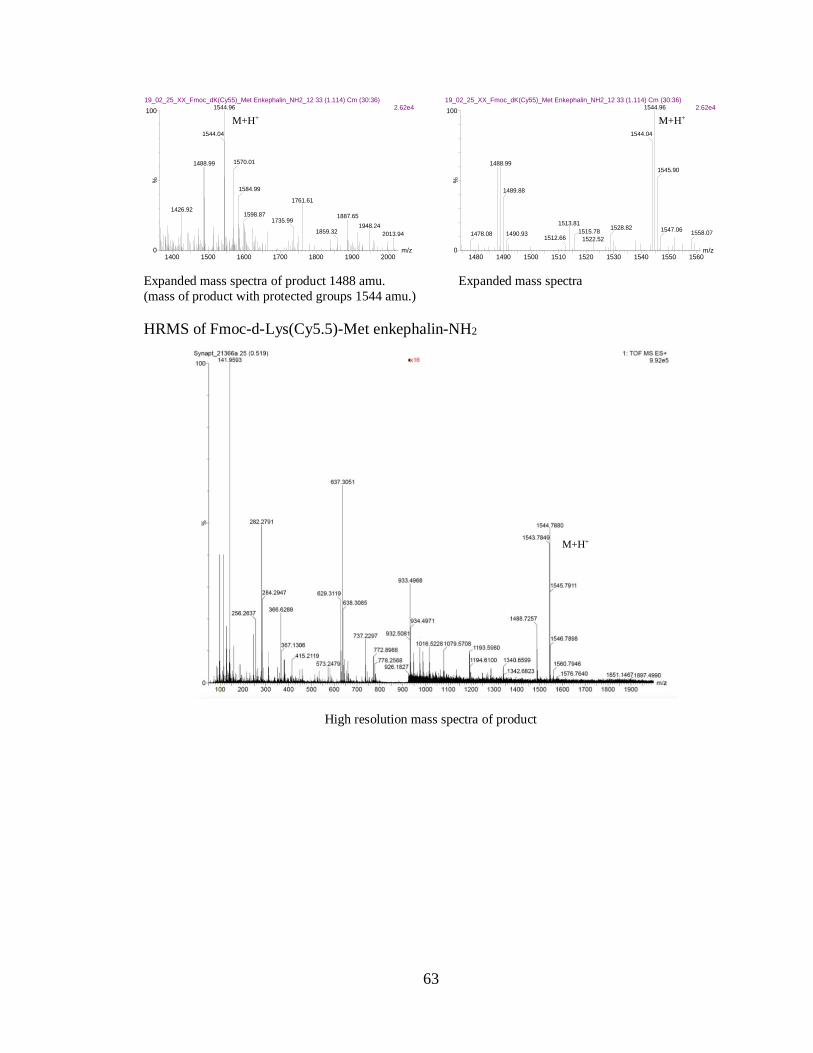
63
Expanded mass spectra of product 1488 amu. Expanded mass spectra
(mass of product with protected groups 1544 amu.)
HRMS of Fmoc-d-Lys(Cy5.5)-Met enkephalin-NH2
High resolution mass spectra of product
19_02_25_XX_Fmoc_dK(Cy55)_Met Enkephalin_NH2_12
m/z1400 1500 1600 1700 1800 1900 2000
%
0
100
19_02_25_XX_Fmoc_dK(Cy55)_Met Enkephalin_NH2_12 33 (1.114) Cm (30:36)2.62e41544.96
1544.04
1488.99
1426.92
1570.01
1584.99
1761.61
1598.871735.99
1887.65
1859.321948.24
2013.94
19_02_25_XX_Fmoc_dK(Cy55)_Met Enkephalin_NH2_12
m/z1480 1490 1500 1510 1520 1530 1540 1550 1560
%
0
100
19_02_25_XX_Fmoc_dK(Cy55)_Met Enkephalin_NH2_12 33 (1.114) Cm (30:36)2.62e41544.96
1544.04
1488.99
1478.08
1489.88
1513.81
1490.931512.66
1515.781528.82
1522.52
1545.90
1547.061558.07
M+H+ M+H+
M+H+

64
Expanded High resolution mass spectra of product
Expanded High resolution mass spectra of product (with protecting groups)
M+H+
M+H+

65
Fmoc-d-Lys(Gd-DOTA)-Tyr-Gly-Gly-Phe-Met-NH2 12
Total Ion Chromatogram (TIC) Mass Spectra and UV Spectra of cleaved product
LC-MS Total Diode Array Chromatogram
product at 4.12 min
Extracted Ion Chromatogram (XIC) at 1464 amu. Expanded mass spectra of product showing
Single Wavelength Chromatogram (SWC) at 268 nm Gd isotope pattern
19_02_25_XX_Fmoc_dK(Gd-DOTA)_Met Enkephalin_NH2_New_6
Time0.00 2.00 4.00 6.00 8.00
AU
0.0
5.0e+1
1.0e+2
0.00 2.00 4.00 6.00 8.00
%0
100
19_02_25_XX_Fmoc_dK(Gd-DOTA)_Met Enkephalin_NH2_New_6 1: Scan ES+ TIC
5.47e77.803.14
2.311.08
0.46
4.164.30 4.95
5.84 6.22
19_02_25_XX_Fmoc_dK(Gd-DOTA)_Met Enkephalin_NH2_New_6 3: Diode Array Range: 1.302e+24.12
1.36 3.232.02
4.96
19_02_25_XX_Fmoc_dK(Gd-DOTA)_Met Enkephalin_NH2_New_6
m/z200 400 600 800 1000 1200 1400 1600
AU
0.0
5.0e-1
1.0
m/z200 400 600 800 1000 1200 1400 1600
%
0
100
19_02_25_XX_Fmoc_dK(Gd-DOTA)_Met Enkephalin_NH2_New_6 122 (4.163) Cm (112:127)2.39e6732.54
731.54
149.08 724.02573.29
239.17
733.55
772.39
1242.53773.41922.30
1464.501624.56
19_02_25_XX_Fmoc_dK(Gd-DOTA)_Met Enkephalin_NH2_New_6 495 (4.117) Cm (472:517)1.376208.53
265.53
19_02_25_XX_Fmoc_dK(Gd-DOTA)_Met Enkephalin_NH2_New_6
Time0.00 1.00 2.00 3.00 4.00 5.00 6.00 7.00 8.00
AU
0.0
5.0e-1
1.0
0.00 1.00 2.00 3.00 4.00 5.00 6.00 7.00 8.00
%
0
100
19_02_25_XX_Fmoc_dK(Gd-DOTA)_Met Enkephalin_NH2_New_6 1: Scan ES+ 1464.504
1.13e6
4.06
4.23
4.68 5.84
19_02_25_XX_Fmoc_dK(Gd-DOTA)_Met Enkephalin_NH2_New_6 3: Diode Array 268.532
Range: 1.31
4.13
3.842.01
19_02_25_XX_Fmoc_dK(Gd-DOTA)_Met Enkephalin_NH2_New_6
m/z1450 1460 1470 1480 1490
%
0
100
19_02_25_XX_Fmoc_dK(Gd-DOTA)_Met Enkephalin_NH2_New_6 122 (4.163) Cm (112:127)3.52e51464.50
1463.49
1462.54
1461.49
1460.51
1445.81
1465.51
1467.51
1468.45
1472.301482.45 1484.59
M+H+
(M+2H+)/2
M+H+

66
HRMS of Fmoc-d-Lys(Gd-DOTA)-Met enkephalin-NH2
High resolution mass spectra of product (with protecting groups)
Expanded High resolution mass spectra of product (with protecting groups)
M+H+
M+H+

67
Fmoc-Leu-NH2 13
(First amino acid in SPPS of 18-4)
LC-MS Total Diode Array Chromatogram (TDA) Mass Spectra and UV Spectra of cleaved product
Total Ion Chromatogram (TIC)
Extracted Ion Chromatogram (XIC) at 353 amu.
Single Wavelength Chromatogram (SWC) at 261 nm
Fmoc-Phe-Leu-NH2 14
(Di-peptide in SPPS of 18-4)
TIC & TDA of di-peptide, product at 4.45 min Mass Spectra and UV Spectra of cleaved product
(peak is broad due to lipophilicity)
19_03_28_XX_Fmoc-Leu-NH2_1b
Time1.00 2.00 3.00 4.00 5.00 6.00 7.00 8.00
AU
0.0
5.0e+1
1.00 2.00 3.00 4.00 5.00 6.00 7.00 8.00
%
0
100
19_03_28_XX_Fmoc-Leu-NH2_1b 1: Scan ES+ TIC
2.27e8
3.72
3.58
2.001.08
7.83
19_03_28_XX_Fmoc-Leu-NH2_1b 3: Diode Array Range: 9.477e+13.80
1.31
19_03_28_XX_Fmoc-Leu-NH2_1b
m/z250 300 350 400 450 500
AU
0.0
1.0
m/z250 300 350 400 450 500
%
0
100
19_03_28_XX_Fmoc-Leu-NH2_1b 109 (3.718) Cm (103:118) 1: Scan ES+ 3.07e7353.25
336.22216.17 308.23
354.26
375.25391.22453.49
475.47501.48
19_03_28_XX_Fmoc-Leu-NH2_1b 457 (3.800) Cm (436:476) 3: Diode Array 1.967206.53
263.53
298.53
19_03_28_XX_Fmoc-Leu-NH2_1b
Time1.00 2.00 3.00 4.00 5.00 6.00 7.00 8.00
AU
0.0
5.0e-1
1.0
1.00 2.00 3.00 4.00 5.00 6.00 7.00 8.00
%
0
100
19_03_28_XX_Fmoc-Leu-NH2_1b 1: Scan ES+ 353.2554.62e7
3.72
7.56
19_03_28_XX_Fmoc-Leu-NH2_1b 3: Diode Array 261.532
Range: 1.23
3.80
19_03_28_XX_Fmoc-Phe-Leu-NH2_2
Time1.00 2.00 3.00 4.00 5.00 6.00 7.00 8.00
AU
0.0
2.0e+1
4.0e+1
1.00 2.00 3.00 4.00 5.00 6.00 7.00 8.00
%
0
100
19_03_28_XX_Fmoc-Phe-Leu-NH2_2 1: Scan ES+ TIC
1.81e8
4.40
1.110.02 1.322.07
19_03_28_XX_Fmoc-Phe-Leu-NH2_2 4: Diode Array Range: 6.492e+14.45
1.301.17
19_03_28_XX_Fmoc-Phe-Leu-NH2_2
m/z250 300 350 400 450 500 550
AU
0.0
2.0e-1
4.0e-1
m/z250 300 350 400 450 500 550
%
0
100
19_03_28_XX_Fmoc-Phe-Leu-NH2_2 129 (4.403) Cm (126:132) 1: Scan ES+ 3.84e7500.32483.28
233.15370.24305.22 455.29411.24
501.32
517.35558.37
19_03_28_XX_Fmoc-Phe-Leu-NH2_2 535 (4.450) Cm (501:564) 4: Diode Array 5.439e-1
263.53
298.53
M+H+
Fmoc
M+H+

68
Extracted Ion Chromatogram (XIC) at 500 amu.
Single Wavelength Chromatogram (SWC) at 263 nm
Fmoc-d-Lys-Phe-Leu-NH2 15
(Tri-peptide in SPPS of 18-4)
TIC & TDA of tri-peptide, product at 3.56 min Mass Spectra and UV Spectra of cleaved product
(peak is broad due to lipophilicity)
Extracted Ion Chromatogram (XIC) at 628 amu.
Single Wavelength Chromatogram (SWC) at 263 nm
19_03_28_XX_Fmoc-Phe-Leu-NH2_2
Time1.00 2.00 3.00 4.00 5.00 6.00 7.00 8.00
AU
0.0
2.5e-1
5.0e-1
1.00 2.00 3.00 4.00 5.00 6.00 7.00 8.00
%
0
100
19_03_28_XX_Fmoc-Phe-Leu-NH2_2 1: Scan ES+ 500.3214.67e7
4.37
19_03_28_XX_Fmoc-Phe-Leu-NH2_2 4: Diode Array 263.532
Range: 7.254e-1
4.45
19_03_28_XX_Fmoc-Lys-Phe-Leu-NH2_3
Time1.00 2.00 3.00 4.00 5.00 6.00 7.00 8.00
AU
0.0
5.0e+1
1.0e+2
1.00 2.00 3.00 4.00 5.00 6.00 7.00 8.00
%
0
100
19_03_28_XX_Fmoc-Lys-Phe-Leu-NH2_3 1: Scan ES+ TIC
1.19e8
7.493.483.34
1.35
1.11
2.76
3.75
4.06
7.04
5.02
5.98
19_03_28_XX_Fmoc-Lys-Phe-Leu-NH2_3 3: Diode Array Range: 1.078e+23.56
1.30
7.68
19_03_28_XX_Fmoc-Lys-Phe-Leu-NH2_3
m/z200 300 400 500 600 700
AU
0.0
1.0
2.0
m/z200 300 400 500 600 700
%
0
100
19_03_28_XX_Fmoc-Lys-Phe-Leu-NH2_3 102 (3.478) Cm (101:114)1: Scan ES+ 5.68e7628.43
257.18611.40
498.31278.26 481.35406.38
629.44
630.43
727.50782.50
19_03_28_XX_Fmoc-Lys-Phe-Leu-NH2_3 428 (3.558) Cm (402:470)2.608208.53
263.53
298.53
19_03_28_XX_Fmoc-Lys-Phe-Leu-NH2_3
Time1.00 2.00 3.00 4.00 5.00 6.00 7.00 8.00
AU
0.0
5.0e-1
1.0
1.00 2.00 3.00 4.00 5.00 6.00 7.00 8.00
%
0
100
19_03_28_XX_Fmoc-Lys-Phe-Leu-NH2_3 1: Scan ES+ 628.4256.02e7
3.483.34
3.58
4.03
4.57
5.027.046.80
19_03_28_XX_Fmoc-Lys-Phe-Leu-NH2_3 3: Diode Array 263.532
Range: 1.375
3.60
M+H+

69
Fmoc-Gln-d-Lys-Phe-Leu-NH2 16
(Tetra-peptide in SPPS of 18-4)
TIC & TDA of tetra-peptide, product at 2.63 min Mass Spectra and UV Spectra of cleaved product
(peak is broad due to lipophilicity)
Extracted Ion Chromatogram (XIC) at 756 amu.
Single Wavelength Chromatogram (SWC) at 264 nm
Fmoc-Tyr-Gln-d-Lys-Phe-Leu-NH2 17
(Penta-peptide in SPPS of 18-4)
TIC & TDA of penta-peptide, product at 2.73 min Mass Spectra and UV Spectra of cleaved product
(peak is broad due to lipophilicity)
19_03_28_XX_Fmoc-Gln-Lys-Phe-Leu-NH2_4
Time1.00 2.00 3.00 4.00 5.00 6.00 7.00 8.00
AU
0.0
5.0e+1
1.00 2.00 3.00 4.00 5.00 6.00 7.00 8.00
%
0
100
19_03_28_XX_Fmoc-Gln-Lys-Phe-Leu-NH2_4 1: Scan ES+ TIC
1.42e8
7.35
7.21
1.421.08
2.522.42 2.76 7.04
5.955.813.10 3.82
5.33
19_03_28_XX_Fmoc-Gln-Lys-Phe-Leu-NH2_4 3: Diode Array Range: 8.567e+12.63
1.31
7.37
6.05
3.93
19_03_28_XX_Fmoc-Gln-Lys-Phe-Leu-NH2_4
m/z200 400 600 800 1000 1200
AU
0.0
1.0
2.0
m/z200 400 600 800 1000 1200
%
0
100
19_03_28_XX_Fmoc-Gln-Lys-Phe-Leu-NH2_4 74 (2.519) Cm (74:82)4.00e7756.47
406.36257.19 628.39
757.49
758.48
1162.76796.441042.25
19_03_28_XX_Fmoc-Gln-Lys-Phe-Leu-NH2_4 317 (2.633) Cm (308:343)2.381208.53
263.53
298.53
19_03_28_XX_Fmoc-Gln-Lys-Phe-Leu-NH2_4
Time1.00 2.00 3.00 4.00 5.00 6.00 7.00 8.00
AU
0.0
5.0e-1
1.0
1.00 2.00 3.00 4.00 5.00 6.00 7.00 8.00
%
0
100
19_03_28_XX_Fmoc-Gln-Lys-Phe-Leu-NH2_4 1: Scan ES+ 756.4754.30e7
2.52
2.42
2.76
2.96
3.10
3.48
5.95
19_03_28_XX_Fmoc-Gln-Lys-Phe-Leu-NH2_4 3: Diode Array 264.532
Range: 1.051
2.63
3.93 7.37
19_03_28_XX_Fmoc-Tyr-Gln-Lys-Phe-Leu-NH2_5
Time1.00 2.00 3.00 4.00 5.00 6.00 7.00 8.00
AU
0.0
2.0e+1
4.0e+1
1.00 2.00 3.00 4.00 5.00 6.00 7.00 8.00
%
0
100
19_03_28_XX_Fmoc-Tyr-Gln-Lys-Phe-Leu-NH2_5 1: Scan ES+ TIC
1.21e8
7.90
7.357.257.08
1.351.08
0.02
5.952.692.11 5.67
3.85
19_03_28_XX_Fmoc-Tyr-Gln-Lys-Phe-Leu-NH2_5 3: Diode Array Range: 4.397e+12.73
1.311.19
7.37
6.05
3.71
19_03_28_XX_Fmoc-Tyr-Gln-Lys-Phe-Leu-NH2_5
m/z200 400 600 800 1000 1200
AU
0.0
5.0e-1
1.0
m/z200 400 600 800 1000 1200
%
0
100
19_03_28_XX_Fmoc-Tyr-Gln-Lys-Phe-Leu-NH2_5 79 (2.690) Cm (75:82)1.17e7919.56
406.38153.13 479.55
791.44664.38
920.56
921.57
941.561124.37
19_03_28_XX_Fmoc-Tyr-Gln-Lys-Phe-Leu-NH2_5 329 (2.733) Cm (316:356)1.206202.53
263.53
M+H+
M+H+

70
Extracted Ion Chromatogram (XIC) at 919 amu.
Single Wavelength Chromatogram (SWC) at 263 nm
Fmoc-Ala-Tyr(tBu)-Gln-d-Lys-Phe-Leu-NH2 18
(Hexa-peptide in SPPS of 18-4)
TIC & TDA of hexa-peptide, product at 2.83 min Mass Spectra and UV Spectra of cleaved product
(peak is broad due to lipophilicity)
Extracted Ion Chromatogram (XIC) at 1046 amu.
Single Wavelength Chromatogram (SWC) at 263 nm
19_03_28_XX_Fmoc-Tyr-Gln-Lys-Phe-Leu-NH2_5
Time1.00 2.00 3.00 4.00 5.00 6.00 7.00 8.00
AU
0.0
2.0e-1
1.00 2.00 3.00 4.00 5.00 6.00 7.00 8.00
%
0
100
19_03_28_XX_Fmoc-Tyr-Gln-Lys-Phe-Leu-NH2_5 1: Scan ES+ 919.5611.35e7
2.692.59
2.79
2.90
19_03_28_XX_Fmoc-Tyr-Gln-Lys-Phe-Leu-NH2_5 3: Diode Array 263.532
Range: 3.973e-1
2.74
3.72 5.59 7.37
19_04_04_XX_Fmoc-Ala-Tyr-Gln-Lys-Phe-Leu-NH2_6c
Time0.00 1.00 2.00 3.00 4.00 5.00 6.00 7.00 8.00
AU
0.0
2.5e+1
5.0e+1
0.00 1.00 2.00 3.00 4.00 5.00 6.00 7.00 8.00
%
0
100
19_04_04_XX_Fmoc-Ala-Tyr-Gln-Lys-Phe-Leu-NH2_6c 1: Scan ES+ TIC
1.19e8
1.11
0.02
1.561.662.76
5.295.094.543.20 7.835.95 7.326.87
19_04_04_XX_Fmoc-Ala-Tyr-Gln-Lys-Phe-Leu-NH2_6c 3: Diode Array Range: 8.088e+12.83
1.080.00 1.85
4.69
19_04_04_XX_Fmoc-Ala-Tyr-Gln-Lys-Phe-Leu-NH2_6c
m/z250 500 750 1000 1250 1500 1750 2000
AU
0.0
5.0e-1
1.0
m/z250 500 750 1000 1250 1500 1750 2000
%
0
100
19_04_04_XX_Fmoc-Ala-Tyr-Gln-Lys-Phe-Leu-NH2_6c 81 (2.758) Cm (76:86)2.53e71046.64
153.14448.36 899.58
779.54
1047.64
1048.65
1069.621570.19 1946.34
19_04_04_XX_Fmoc-Ala-Tyr-Gln-Lys-Phe-Leu-NH2_6c 340 (2.825) Cm (304:388)1.424204.53
263.53
19_04_04_XX_Fmoc-Ala-Tyr-Gln-Lys-Phe-Leu-NH2_6c
Time0.00 1.00 2.00 3.00 4.00 5.00 6.00 7.00 8.00
AU
0.0
2.5e-1
5.0e-1
0.00 1.00 2.00 3.00 4.00 5.00 6.00 7.00 8.00
%
0
100
19_04_04_XX_Fmoc-Ala-Tyr-Gln-Lys-Phe-Leu-NH2_6c 1: Scan ES+ 1046.637
2.96e7
2.76
0.02
0.98
2.86
3.20
4.47 4.64 5.29
19_04_04_XX_Fmoc-Ala-Tyr-Gln-Lys-Phe-Leu-NH2_6c 3: Diode Array 263
Range: 7.672e-1
2.83
1.880.004.68
M+H+

71
Fmoc-Ala-Ala-Tyr(tBu)-Gln-d-Lys-Phe-Leu-NH2 19
(Hepta-peptide in SPPS of 18-4)
TIC & TDA of hepta-peptide, product at 2.73 min Mass Spectra and UV Spectra of cleaved product
(peak is broad due to lipophilicity)
Extracted Ion Chromatogram (XIC) at 1117 amu.
Single Wavelength Chromatogram (SWC) at 263 nm
Fmoc-Glu(OtBu)-Ala-Ala-Tyr(tBu)-Gln-d-Lys-Phe-Leu-NH2 20
(Octa-peptide in SPPS of 18-4)
TIC & TDA of octa-peptide, product at 4.61 min Mass Spectra and UV Spectra of cleaved product
(peak is broad due to lipophilicity)
19_04_04_XX_Fmoc-Ala-Ala-Tyr-Gln-Lys-Phe-Leu-NH2_7
Time0.00 1.00 2.00 3.00 4.00 5.00 6.00 7.00 8.00
AU
0.0
2.5e+1
5.0e+1
0.00 1.00 2.00 3.00 4.00 5.00 6.00 7.00 8.00
%
0
100
19_04_04_XX_Fmoc-Ala-Ala-Tyr-Gln-Lys-Phe-Leu-NH2_7 1: Scan ES+ TIC
1.18e8
1.11
0.02
1.66
2.62 5.094.78
4.40
5.477.907.59
5.887.21
19_04_04_XX_Fmoc-Ala-Ala-Tyr-Gln-Lys-Phe-Leu-NH2_7 3: Diode Array Range: 7.222e+12.73
1.821.07
4.63
19_04_04_XX_Fmoc-Ala-Ala-Tyr-Gln-Lys-Phe-Leu-NH2_7
m/z250 500 750 1000 1250 1500 1750 2000
AU
0.0
1.0
m/z250 500 750 1000 1250 1500 1750 2000
%
0
100
19_04_04_XX_Fmoc-Ala-Ala-Tyr-Gln-Lys-Phe-Leu-NH2_7 77 (2.621) Cm (74:85)1.78e71117.68
523.07153.13 1046.65824.62
1118.68
1119.68
1140.671677.27 2027.57
19_04_04_XX_Fmoc-Ala-Ala-Tyr-Gln-Lys-Phe-Leu-NH2_7 328 (2.725) Cm (299:369)1.582202.53
263.53
19_04_04_XX_Fmoc-Ala-Ala-Tyr-Gln-Lys-Phe-Leu-NH2_7
Time0.00 1.00 2.00 3.00 4.00 5.00 6.00 7.00 8.00
AU
0.0
2.5e-1
5.0e-1
0.00 1.00 2.00 3.00 4.00 5.00 6.00 7.00 8.00
%
0
100
19_04_04_XX_Fmoc-Ala-Ala-Tyr-Gln-Lys-Phe-Leu-NH2_7 1: Scan ES+ 1117.682.28e7
2.69
2.52 2.86
3.14
4.40 5.26
19_04_04_XX_Fmoc-Ala-Ala-Tyr-Gln-Lys-Phe-Leu-NH2_7 3: Diode Array 263.532
Range: 6.692e-1
2.73
1.83 4.63
19_04_04_XX_Fmoc-Glu-Ala-Ala-Tyr-Gln-Lys-Phe-Leu-NH2_8
Time0.00 1.00 2.00 3.00 4.00 5.00 6.00 7.00 8.00
AU
0.0
2.0e+1
4.0e+1
0.00 1.00 2.00 3.00 4.00 5.00 6.00 7.00 8.00
%
0
100
19_04_04_XX_Fmoc-Glu-Ala-Ala-Tyr-Gln-Lys-Phe-Leu-NH2_8 1: Scan ES+ TIC
9.57e7
1.08
0.02
5.191.664.51
4.402.11
3.58
5.53
7.695.956.49
19_04_04_XX_Fmoc-Glu-Ala-Ala-Tyr-Gln-Lys-Phe-Leu-NH2_8 3: Diode Array Range: 5.063e+14.61
1.10
1.782.30
19_04_04_XX_Fmoc-Glu-Ala-Ala-Tyr-Gln-Lys-Phe-Leu-NH2_8
m/z250 500 750 1000 1250 1500 1750 2000
AU
0.0
5.0e-1
1.0
1.5
m/z250 500 750 1000 1250 1500 1750 2000
%
0
100
19_04_04_XX_Fmoc-Glu-Ala-Ala-Tyr-Gln-Lys-Phe-Leu-NH2_8 152 (5.192) Cm (129:159)9.61e61302.82
257.19
86.09596.15
258.20663.20
1060.57
1303.82
1304.82
1305.82
1954.89
19_04_04_XX_Fmoc-Glu-Ala-Ala-Tyr-Gln-Lys-Phe-Leu-NH2_8 554 (4.608) Cm (522:587)1.537201.53
263.53
M+H+
M+H+

72
Extracted Ion Chromatogram (XIC) at 1302 amu.
Single Wavelength Chromatogram (SWC) at 263 nm
Fmoc-d-Nle-Glu(OtBu)-Ala-Ala-Tyr(tBu)-Gln-d-Lys-Phe-Leu-NH2 21
(Nona-peptide in SPPS of 18-4)
TIC & TDA of nona-peptide, product at 5.72 min Mass Spectra and UV Spectra of cleaved product
(peak is broad due to lipophilicity) (With two t-butyl protecting groups)
Extracted Ion Chromatogram (XIC) at 1415 amu. Mass Spectra and UV Spectra of cleaved product
Single Wavelength Chromatogram (SWC) at 265 nm (With one t-butyl protecting groups, 1359.87 amu.)
(Without protecting groups, 1302.84 amu.)
19_04_04_XX_Fmoc-Glu-Ala-Ala-Tyr-Gln-Lys-Phe-Leu-NH2_8
Time0.00 1.00 2.00 3.00 4.00 5.00 6.00 7.00 8.00
AU
0.0
1.0e-1
2.0e-1
0.00 1.00 2.00 3.00 4.00 5.00 6.00 7.00 8.00
%
0
100
19_04_04_XX_Fmoc-Glu-Ala-Ala-Tyr-Gln-Lys-Phe-Leu-NH2_8 1: Scan ES+ 1302.819
1.40e7
5.19
5.094.61
5.33
5.74
6.12
19_04_04_XX_Fmoc-Glu-Ala-Ala-Tyr-Gln-Lys-Phe-Leu-NH2_8 3: Diode Array 263.532
Range: 2.177e-1
4.56
2.320.00
19_04_04_XX_Fmoc-dNle-Glu-Ala-Ala-Tyr-Gln-Lys-Phe-Leu-NH2_9
Time0.00 1.00 2.00 3.00 4.00 5.00 6.00 7.00 8.00
AU
0.0
2.0e+1
4.0e+1
0.00 1.00 2.00 3.00 4.00 5.00 6.00 7.00 8.00
%
0
100
19_04_04_XX_Fmoc-dNle-Glu-Ala-Ala-Tyr-Gln-Lys-Phe-Leu-NH2_9 1: Scan ES+ TIC
1.18e8
1.11
0.02
5.985.741.52 5.53
4.854.47
2.35
6.12
6.706.87
7.97
19_04_04_XX_Fmoc-dNle-Glu-Ala-Ala-Tyr-Gln-Lys-Phe-Leu-NH2_9 3: Diode Array Range: 5.249e+14.62
1.12
0.001.72
2.795.72
19_04_04_XX_Fmoc-dNle-Glu-Ala-Ala-Tyr-Gln-Lys-Phe-Leu-NH2_9
m/z250 500 750 1000 1250 1500 1750 2000
AU
0.0
1.0e-1
2.0e-1
m/z250 500 750 1000 1250 1500 1750 2000
%
0
100
19_04_04_XX_Fmoc-dNle-Glu-Ala-Ala-Tyr-Gln-Lys-Phe-Leu-NH2_9 175 (5.980) Cm (165:190)1.84e71415.91
652.69131.12 587.56
719.731344.85
755.20
1417.89
1418.90
1888.65
19_04_04_XX_Fmoc-dNle-Glu-Ala-Ala-Tyr-Gln-Lys-Phe-Leu-NH2_9 688 (5.725) Cm (671:732)2.42e-1204.53
263.53
19_04_04_XX_Fmoc-dNle-Glu-Ala-Ala-Tyr-Gln-Lys-Phe-Leu-NH2_9
Time0.00 1.00 2.00 3.00 4.00 5.00 6.00 7.00 8.00
AU
0.0
2.0e-2
4.0e-2
0.00 1.00 2.00 3.00 4.00 5.00 6.00 7.00 8.00
%
0
100
19_04_04_XX_Fmoc-dNle-Glu-Ala-Ala-Tyr-Gln-Lys-Phe-Leu-NH2_9 1: Scan ES+ 1415.906
2.14e7
6.296.126.43
19_04_04_XX_Fmoc-dNle-Glu-Ala-Ala-Tyr-Gln-Lys-Phe-Leu-NH2_9 3: Diode Array 265.532
Range: 7.013e-2
5.86
2.80
0.00
4.62
19_04_04_XX_Fmoc-dNle-Glu-Ala-Ala-Tyr-Gln-Lys-Phe-Leu-NH2_9
m/z500 1000 1500 2000
AU
0.0
1.0e-1
2.0e-1
m/z500 1000 1500 2000
%
0
100
19_04_04_XX_Fmoc-dNle-Glu-Ala-Ala-Tyr-Gln-Lys-Phe-Leu-NH2_9 76 (2.587) Cm (76:86)1.55e6153.17
1359.87644.25448.37
257.21779.52 1302.84
1361.89
1382.881786.61
19_04_04_XX_Fmoc-dNle-Glu-Ala-Ala-Tyr-Gln-Lys-Phe-Leu-NH2_9 688 (5.725) Cm (662:730)2.456e-1204.53
263.53
M+H+
M+H+

73
Fmoc-Trp(Boc)-d-Nle-Glu(OtBu)-Ala-Ala-Tyr(tBu)-Gln-d-Lys-Phe-Leu-NH2 22
(Deca-peptide in SPPS of 18-4)
TIC & TDA of deca-peptide, product at 3.74 min Mass Spectra and UV Spectra of cleaved product
(peak is broad due to lipophilicity)
Extracted Ion Chromatogram (XIC) at 1703 amu. Extracted Ion Chromatogram (XIC) at 1489 amu.
Single Wavelength Chromatogram (SWC) at 265 nm (Product with no protecting groups)
19_04_05_XX_Fmoc-Trp-dNle-Glu-Ala-Ala-Tyr-Gln-Lys-Phe-Leu-NH2_10b
Time0.00 1.00 2.00 3.00 4.00 5.00 6.00 7.00 8.00
AU
0.0
1.0e+1
0.00 1.00 2.00 3.00 4.00 5.00 6.00 7.00 8.00
%
0
100
19_04_05_XX_Fmoc-Trp-dNle-Glu-Ala-Ala-Tyr-Gln-Lys-Phe-Leu-NH2_10b F1TIC
7.74e7
1.15
0.02
5.575.474.61
1.702.18
3.893.68
5.74
7.766.39
19_04_05_XX_Fmoc-Trp-dNle-Glu-Ala-Ala-Tyr-Gln-Lys-Phe-Leu-NH2_10b F3Range: 2.194e+14.64
1.08
0.34
1.351.74 2.33 5.54
19_04_05_XX_Fmoc-Trp-dNle-Glu-Ala-Ala-Tyr-Gln-Lys-Phe-Leu-NH2_10b
m/z250 500 750 1000 1250 1500 1750
AU
0.0
2.5e-1
5.0e-1
m/z250 500 750 1000 1250 1500 1750
%
0
100
19_04_05_XX_Fmoc-Trp-dNle-Glu-Ala-Ala-Tyr-Gln-Lys-Phe-Leu-NH2_10b 135 (4.609) Cm (129:142)8.27e6257.21
851.89795.77258.21
759.18259.23
852.70 1703.16864.22 1647.121235.95 1706.07
19_04_05_XX_Fmoc-Trp-dNle-Glu-Ala-Ala-Tyr-Gln-Lys-Phe-Leu-NH2_10b 558 (4.642) Cm (534:595)6.491e-1x4
262.53
19_04_05_XX_Fmoc-Trp-dNle-Glu-Ala-Ala-Tyr-Gln-Lys-Phe-Leu-NH2_10b
Time0.00 1.00 2.00 3.00 4.00 5.00 6.00 7.00 8.00
AU
0.0
2.0e-2
4.0e-2
0.00 1.00 2.00 3.00 4.00 5.00 6.00 7.00 8.00
%
0
100
19_04_05_XX_Fmoc-Trp-dNle-Glu-Ala-Ala-Tyr-Gln-Lys-Phe-Leu-NH2_10b F11703.156
1.78e6
5.474.784.54
4.093.82
3.582.93
5.71
6.22 6.53
6.607.21
19_04_05_XX_Fmoc-Trp-dNle-Glu-Ala-Ala-Tyr-Gln-Lys-Phe-Leu-NH2_10b F3262.532
Range: 5.404e-2
4.604.19
1.761.07
0.33
19_04_05_XX_Fmoc-Trp-dNle-Glu-Ala-Ala-Tyr-Gln-Lys-Phe-Leu-NH2_10b
Time0.00 1.00 2.00 3.00 4.00 5.00 6.00 7.00 8.00
AU
0.0
2.0e-2
4.0e-2
0.00 1.00 2.00 3.00 4.00 5.00 6.00 7.00 8.00
%
0
100
19_04_05_XX_Fmoc-Trp-dNle-Glu-Ala-Ala-Tyr-Gln-Lys-Phe-Leu-NH2_10b F11489
1.99e4
5.53
0.09 5.291.76
1.080.844.61
3.171.906.12
6.46
19_04_05_XX_Fmoc-Trp-dNle-Glu-Ala-Ala-Tyr-Gln-Lys-Phe-Leu-NH2_10b F3265.532
Range: 5.28e-2
4.19
1.761.07
0.33
4.59
M+H+
(M+2H+)/2

74
HRMS of Fmoc-Trp(Boc)-d-Nle-Glu(OtBu)-Ala-Ala-Tyr(tBu)-Gln-d-Lys-Phe-Leu-NH2
High resolution mass spectra of product (with protecting groups)
High resolution mass spectra of product (with protecting groups, 1701.9264 amu)
M+H+
M+H+
(M+2H+)/2

75
High resolution mass spectra of product (Half mass, with protecting groups, 851.4691 amu.)
Fmoc-d-Lys(Cy5.5)-Trp(Boc)-d-Nle-Glu(OtBu)-Ala-Ala-Tyr(tBu)-Gln-d-Lys-Phe-Leu-
NH2 23
Total Ion Chromatogram (TIC) Mass Spectra and UV Spectra of cleaved product
LC-MS Total Diode Array Chromatogram (TDA)
19_05_01_XX_Fmoc_dLys(Cy55)_BrC_NH2_b
Time0.00 1.00 2.00 3.00 4.00 5.00 6.00 7.00 8.00
AU
0.0
2.5e+2
5.0e+2
7.5e+2
0.00 1.00 2.00 3.00 4.00 5.00 6.00 7.00 8.00
%
0
100
19_05_01_XX_Fmoc_dLys(Cy55)_BrC_NH2_b 2: Scan ES+ TIC
1.08e8
0.65 0.86
1.401.88
19_05_01_XX_Fmoc_dLys(Cy55)_BrC_NH2_b 3: Diode Array Range: 8.608e+20.49
19_05_01_XX_Fmoc_dLys(Cy55)_BrC_NH2_b
m/z600 800 1000 1200 1400 1600
AU
0.0
1.0
2.0
m/z600 800 1000 1200 1400 1600
%
0
100
19_05_01_XX_Fmoc_dLys(Cy55)_BrC_NH2_b 19 (0.651) Cm (9:44) 2: Scan ES+ 1.83e61326.85
576.54
866.74740.901326.12
921.82
1327.78
1328.64 1493.971622.12
19_05_01_XX_Fmoc_dLys(Cy55)_BrC_NH2_b 60 (0.492) Cm (49:122)2.519687.53
(M+2H+)/2
(M+2H+)/2
1198

76
Extracted Ion Chromatogram (XIC) at 1326 amu.
Single Wavelength Chromatogram (SWC) at 687 nm
HRMS of Fmoc-d-Lys(Cy5.5)-Trp(Boc)-d-Nle-Glu(OtBu)-Ala-Ala-Tyr(tBu)-Gln-d-Lys-
Phe-Leu-NH2
High resolution mass spectra of product (Half mass, with protecting groups, 1198.1732 amu.)
19_05_01_XX_Fmoc_dLys(Cy55)_BrC_NH2_b
Time0.00 1.00 2.00 3.00 4.00 5.00 6.00 7.00 8.00
AU
0.0
1.0
2.0
0.00 1.00 2.00 3.00 4.00 5.00 6.00 7.00 8.00%
0
100
19_05_01_XX_Fmoc_dLys(Cy55)_BrC_NH2_b 2: Scan ES+ 1198
3.57e5
1.540.341.06
0.51 1.71
1.88
19_05_01_XX_Fmoc_dLys(Cy55)_BrC_NH2_b 3: Diode Array 687
Range: 2.789
0.49
(M+2H+)/2

77
Fmoc-d-Lys(Cy5.5)-Trp-d-Nle-Glu-Ala-Ala-Tyr-Gln-d-Lys-Phe-Leu-NH2
UV Spectra of cleaved product Mass Spectra of cleaved product (Half mass)
HRMS of Fmoc-d-Lys(Cy5.5)-Trp-d-Nle-Glu-Ala-Ala-Tyr-Gln-d-Lys-Phe-Leu-NH2
High resolution mass spectra of product (Half mass, without protecting groups, 1092.0850 amu.)
19_06_12_ML_Fmoc-Lys-Trp-Nle-Glu-Ala-Ala-Tyr-Gln-dLys-Phe-Leu-NH2_32e
nm300 350 400 450 500 550 600 650 700 750 800
AU
0.0
1.0e-1
2.0e-1
3.0e-1
19_06_12_ML_Fmoc-Lys-Trp-Nle-Glu-Ala-Ala-Tyr-Gln-dLys-Phe-Leu-NH2_32e 90 (0.742) Cm (90:157)3.992e-1677.53
272.53
363.53
19_06_12_ML_Fmoc-Lys-Trp-Nle-Glu-Ala-Ala-Tyr-Gln-dLys-Phe-Leu-NH2_33f
m/z400 600 800 1000 1200 1400 1600 1800 2000
%
0
100
19_06_12_ML_Fmoc-Lys-Trp-Nle-Glu-Ala-Ala-Tyr-Gln-dLys-Phe-Leu-NH2_33f 40 (0.684) Cm (39:140)7.10e51092.73
1092.01447.38
711.93448.50
736.02 1083.71
1120.36
1121.21
1122.03
1282.191455.68
(M+2H+)/2
(M+2H+)/2

78
High resolution mass spectra of product (Third mass, without protecting groups, 728.3932 amu.)
H-d-Lys(Cy5.5)-Trp-d-Nle-Glu-Ala-Ala-Tyr-Gln-d-Lys-Phe-Leu-NH2 24
UV Spectra of cleaved product Mass Spectra of cleaved product (Half mass)
19_06_14_ML_BrC PeptideComp_3b
nm300 350 400 450 500 550 600 650 700 750 800
AU
0.0
2.5e-1
5.0e-1
7.5e-1
1.0
1.25
19_06_14_ML_BrC PeptideComp_3b 78 (0.642) Cm (60:107) 2: Diode Array 1.552677.53
265.53
353.53
19_06_14_ML_BrC PeptideComp_3b
m/z400 600 800 1000 1200 1400 1600 1800 2000
%
0
100
19_06_14_ML_BrC PeptideComp_3b 95 (1.626) Cm (88:109) 1: Scan ES+ 1.20e7654.68
648.86
567.89448.47
740.14
758.77
981.67 1109.351281.42 1725.51
(M+2H+)/2
(M+3H+)/3
(M+3H+)/3

79
HRMS of H-d-Lys(Cy5.5)-Trp-d-Nle-Glu-Ala-Ala-Tyr-Gln-d-Lys-Phe-Leu-NH2
High resolution mass spectra of product (Half mass, without protecting groups, 981.0515 amu.)
High resolution mass spectra of product (Third mass, without protecting groups, 654.3713 amu.)
(M+3H+)/3
(M+2H+)/2
(M+2H+)/2

80
Fmoc-d-Lys(Gd-DOTA)-Trp(Boc)-d-Nle-Glu(OtBu)-Ala-Ala-Tyr(tBu)-Gln-d-Lys-Phe-
Leu-NH2 25
Total Ion Chromatogram (TIC) Mass Spectra and UV Spectra of cleaved product
LC-MS Total Diode Array Chromatogram (TDA)
Extracted Ion Chromatogram (XIC) at 1186 amu.
Single Wavelength Chromatogram (SWC) at 263 nm
19_04_26_XX_Fmoc_dLys(Gd-DOTA)_BrC_NH2_1-0 TFA_b
Time0.00 1.00 2.00 3.00 4.00 5.00 6.00 7.00 8.00
AU
0.0
1.0e+2
2.0e+2
0.00 1.00 2.00 3.00 4.00 5.00 6.00 7.00 8.00
%
0
100
19_04_26_XX_Fmoc_dLys(Gd-DOTA)_BrC_NH2_1-0 TFA_b 2: Scan ES+ TIC
1.41e8
0.31 0.51
1.16
1.54
19_04_26_XX_Fmoc_dLys(Gd-DOTA)_BrC_NH2_1-0 TFA_b 3: Diode Array Range: 2.635e+20.52
19_04_26_XX_Fmoc_dLys(Gd-DOTA)_BrC_NH2_1-0 TFA_b
m/z400 600 800 1000 1200
AU
0.0
2.0
m/z400 600 800 1000 1200
%
0
100
19_04_26_XX_Fmoc_dLys(Gd-DOTA)_BrC_NH2_1-0 TFA_b 15 (0.514) Cm (13:50)1.73e7257.24
258.24
810.87448.46259.25 576.58 779.71 1186.64850.781123.03
1236.17
19_04_26_XX_Fmoc_dLys(Gd-DOTA)_BrC_NH2_1-0 TFA_b 63 (0.517) Cm (55:124)3.597222.53
260.53
19_04_26_XX_Fmoc_dLys(Gd-DOTA)_BrC_NH2_1-0 TFA_b
Time0.00 1.00 2.00 3.00 4.00 5.00 6.00 7.00 8.00
AU
0.0
1.0
2.0
3.0
0.00 1.00 2.00 3.00 4.00 5.00 6.00 7.00 8.00
%
0
100
19_04_26_XX_Fmoc_dLys(Gd-DOTA)_BrC_NH2_1-0 TFA_b 2: Scan ES+ 1186
1.42e6
0.10
1.681.54
1.340.21
1.16
0.82
1.78
19_04_26_XX_Fmoc_dLys(Gd-DOTA)_BrC_NH2_1-0 TFA_b 3: Diode Array 263
Range: 3.113
0.57
(M+2H+)/2

81
HRMS of Fmoc-d-Lys(Gd-DOTA)-Trp(Boc)-d-Nle-Glu(OtBu)-Ala-Ala-Tyr(tBu)-Gln-d-
Lys-Phe-Leu-NH2
High resolution mass spectra of product (Half mass, with protecting groups, 1186.0563 amu.)
Expanded high resolution mass spectra of product (Half mass, with protecting groups, 1186.0563 amu.)
(M+2H+)/2
(M+2H+)/2

82
Table 6: Molecular Weight of Peptides (Bold - Targeting peptides)
Compounds
Molecular
Weight
(g/mol)
Half Mass
(g/mol)
Fmoc-Leu-NH2 352.2 177.1
Fmoc-Phe-NH2 386.2 194.1
Fmoc-Phe-Leu-NH2 499.2 250.6
Fmoc-d-Lys(Mtt)-Phe-Leu-NH2 883.5 442.75
Fmoc-d-Lys-Phe-Leu-NH2 627.3 314.65
Fmoc-Gln-d-Lys-Phe-Leu-NH2 755.4 378.7
Fmoc-Tyr(tBu)-Gln-d-Lys-Phe-Leu-NH2 974.5 488.25
Fmoc-Tyr-Gln-d-Lys-Phe-Leu-NH2 918.5 460.25
Fmoc-Ala-Tyr(tBu)-Gln-d-Lys-Phe-Leu-NH2 1045.6 523.8
Fmoc-Ala-Tyr-Gln-d-Lys-Phe-Leu-NH2 989.5 495.75
Fmoc-Ala-Ala-Tyr(tBu)-Gln-d-Lys-Phe-Leu-NH2 1116.6 559.3
Fmoc-Ala-Ala-Tyr-Gln-d-Lys-Phe-Leu-NH2 1060.5 531.25
Fmoc-Glu(OtBu)-Ala-Ala-Tyr-Gln-d-Lys-Phe-Leu-NH2 1245.6 623.8
Fmoc-Glu-Ala-Ala-Tyr(tBu)-Gln-d-Lys-Phe-Leu-NH2 1245.6 623.8
Fmoc-Glu(OtBu)-Ala-Ala-Tyr(tBu)-Gln-d-Lys-Phe-Leu-NH2 1301.7 651.85
Fmoc-Glu-Ala-Ala-Tyr-Gln-d-Lys-Phe-Leu-NH2 1189.6 595.8
Fmoc-d-Nle-Glu-Ala-Ala-Tyr-Gln-d-Lys-Phe-Leu-NH2 1302.7 652.35
Fmoc-d-Nle-Glu(OtBu)-Ala-Ala-Tyr-Gln-d-Lys-Phe-Leu-NH2 1358.7 680.35
Fmoc-d-Nle-Glu-Ala-Ala-Tyr(tBu)-Gln-d-Lys-Phe-Leu-NH2 1358.7 680.35
Fmoc-d-Nle-Glu(OtBu)-Ala-Ala-Tyr(tBu)-Gln-d-Lys-Phe-Leu-
NH2
1414.8 708.4
Fmoc-Trp-d-Nle-Glu-Ala-Ala-Tyr-Gln-d-Lys-Phe-Leu-NH2 1488.7 745.35
Fmoc-Trp-d-Nle-Glu(OtBu)-Ala-Ala-Tyr-Gln-d-Lys-Phe-Leu-NH2 1544.8 773.4
Fmoc-Trp-d-Nle-Glu-Ala-Ala-Tyr(tBu)-Gln-d-Lys-Phe-Leu-NH2 1544.8 773.4
Fmoc-Trp-d-Nle-Glu(OtBu)-Ala-Ala-Tyr(tBu)-Gln-d-Lys-Phe-
Leu-NH2
1600.9 801.45
Fmoc-Trp(Boc)-d-Nle-Glu(OtBu)-Ala-Ala-Tyr(tBu)-Gln-d-Lys-
Phe-Leu-NH2
1700.9218 851.46
Fmoc-d-Lys(Cy5.5)-Trp(Boc)-d-Nle-Glu(OtBu)-Ala-Ala-Tyr(tBu)-
Gln-d-Lys-Phe-Leu-NH2
2394.3381 1198.17
Fmoc-d-Lys(Cy5.5)-Trp-d-Nle-Glu-Ala-Ala-Tyr-Gln-d-Lys-
Phe-Leu-NH2
2182.1610 1092.08
NH2-d-Lys(Cy5.5)-Trp-d-Nle-Glu-Ala-Ala-Tyr-Gln-d-
Lys-Phe-Leu-NH2
1960.08800 981.05194
Fmoc-d-Lys(Cy5.5)-Trp(Boc)-d-Nle-Glu(OtBu)-Ala-Ala-
Tyr(tBu)-Gln-d-Lys-Phe-Leu-NH2
2182.15990 1092.08589
Fmoc-d-Lys(Gd-DOTA)-Trp-d-Nle-Glu-Ala-Ala-Tyr-Gln-d-
Lys-Phe-Leu-NH2 2167.9199 1084.96
Fmoc-d-Lys(Gd-DOTA)-Trp(Boc)-d-Nle-Glu(OtBu)-Ala-Ala-
Tyr(tBu)-Gln-d-Lys-Phe-Leu-NH2
2370.0970 1186.05

83